Galaxies hosting an AGN: a view from the CALIFA survey
Abstract
We study the presence of optically-selected Active Galactic Nuclei (AGNs) within a sample of 867 galaxies extracted from the extended Calar-Alto Legacy Integral Field spectroscopy Area (eCALIFA) spanning all morphological classes. We identify 10 Type-I and 24 Type-II AGNs, amounting to per cent of our sample, similar to the fraction reported by previous explorations in the same redshift range. We compare the integrated properties of the ionized and molecular gas, and stellar population of AGN hosts and their non-active counterparts, combining them with morphological information. The AGN hosts are found in transitory parts (i.e. green-valley) in almost all analysed properties which present bimodal distributions (i.e. a region where reside star-forming galaxies and another with quiescent/retired ones). Regarding morphology, we find AGN hosts among the most massive galaxies, with enhanced central stellar-mass surface density in comparison to the average population at each morphological type. Moreover, their distribution peaks at the Sab-Sb classes and none are found among very late-type galaxies (> Scd). Finally, we inspect how the AGN could act in their hosts regarding the quenching of star-formation. The main role of the AGN in the quenching process appears to be the removal (or heating) of molecular gas, rather than an additional suppression of the already observed decrease of the star-formation efficiency from late-to-early type galaxies.
keywords:
galaxies: nuclei – galaxies: evolution – galaxies: star formation1 Introduction
It is likely that all local galaxies (or at least those with a bulge) harbour a supermassive black hole (SMBH) at the centre that, when accretes surrounding gas, ignites an Active Galactic Nucleus (AGN; Kormendy & Richstone, 1995). The energy released in this natural process has been interpreted as a plausible cause of the halting of star-formation (SF) in galaxies (e.g. Silk & Rees, 1998) via removal of the interstellar cold gas (e.g. Fabian, 2012; Trussler et al., 2018) or heating it to a temperature that makes it unfeasible to cool down in a considerable time-scale (e.g. Bower et al., 2006). Conversely, in some cases, it could promote SF by creating disturbances that help the fragmentation of cold gas clouds (e.g. Silk, 2005). Apart from being negative or positive, the AGN feedback should couple the evolution of the SMBH with their host galaxy (e.g. Silk & Rees, 1998), affecting the amount of gas in the interstellar medium and the properties of the underlying stellar population.
The bimodality of galaxies is under the spotlight of evolution at the present epoch. The luminosity coming from red galaxies at least double up since z1 (e.g. Bell et al., 2004; Faber et al., 2007) as a physical manifestation of the growth of the red sequence population (e.g. Sánchez et al., 2019a). This fundamental bifold behaviour tells us that the present-day red galaxies ceased their SF at some time in the past. Their differences could be perceived in the color-magnitude diagram (CMD; e.g. Strateva et al., 2001; Baldry et al., 2004), stellar mass (e.g. Gallazzi et al., 2005, 2008), star-formation rate (SFR; e.g. Brinchmann et al., 2004; Daddi et al., 2007; Renzini & Peng, 2015), both global and local dominance over the ionization budget (e.g. Stasińska et al., 2008; Sarzi et al., 2010; Cid Fernandes et al., 2010; Cid Fernandes et al., 2011; Lacerda et al., 2018), among other properties. The role/relevance of AGNs in this separation is not completely understood. However, when hosting such phenomena, galaxies experience different behaviors reflected on their stellar and gas properties, probably accounting for such observed segregation (e.g. Kauffmann et al., 2007; Sánchez et al., 2018, hereafter S18). Furthermore, AGN hosts populate the green-valley of the CMD (e.g. Kauffmann et al. 2003b; SFS.etal.2004a; Martin et al. 2007; Salim et al. 2007; S18) and SFR-M⋆ diagram (e.g. Schawinski et al. 2014; S18), reinforcing its fleeting behavior.
In addition, there is a tight correlation between the central BH mass and the velocity dispersion of the stellar population in galaxies (M relation; Ferrarese & Merritt, 2000; Gebhardt et al., 2000). This points in the direction of a coevolution between the SMBH and its host galaxy. This idea seems to be right at certain level, as the coevolution exists only when a bulge is present (e.g. Greene et al., 2008, 2010; Kormendy & Ho, 2013, and references therein). Moreover, the growth of the bulge could explain the dominance of inside-out over outside-in quenching (e.g. González Delgado et al., 2016; Ellison et al., 2018; Lin et al., 2019; Bluck et al., 2019). Thus, there seem to be a connection between AGN activity, bulge and SMBH growth and SF quenching.
So far it is considered that the AGN negative feedback described before (i.e., the injection of energy from the nuclear source onto the host galaxy) is the main driver of the suggested connection. Negative feedback implies the removal (mechanical feedback) or heat (thermal feedback) of the cold gas, preventing the formation of new stars. Nowadays, the presence of this negative feedback is almost mandatory in numerical, theoretical and semi-analytic models in order to explain the lack of massive galaxies in the high-mass end of the mass function (e.g. Kauffmann & Haehnelt, 2000; Di Matteo et al., 2005; Croton et al., 2006; Somerville et al., 2008; Schaye et al., 2015; Sijacki et al., 2015; Lacey et al., 2016). The most accepted evolutionary scenario between star-forming galaxies (SFGs) and retired galaxies (RGs) implies the ignition of an AGN that effectively quench the SF, and that ignition is triggered by a process that modifies the morphology too (i.e., a major merger; Hopkins et al., 2010). However, that simple picture lacks strong observational support, since host galaxies of AGNs are not preferentially found in highly disturbed or clear merging systems (e.g. Sánchez et al., 2014).
For all these reasons, it is important to compare the properties of AGN hosts with those of non-active galaxies to understand the nature of such connection. Here we explore if AGN hosts are in a transitory phase between SFGs and RGs. We will try to understand the role of AGN activity in causing the SF quenching, or if the quenching is produced by a different process that co-evolves with the ignition of nuclear activity (e.g., bulge growth that stabilizes the disk, hampering the fragmentation of molecular clouds, Martig et al., 2009). For doing so, we select a sample of AGN hosts in the nearby Universe () based on a dataset of Integral Field Spetroscopy (IFS) provided by the Calar-Alto Legacy Integral Field spectroscopy Area survey (CALIFA, Sánchez et al., 2012). This provides us with a census of the local strong optical AGNs. We characterize the main properties of their host galaxies and the differences between them and their non-active counterparts. Finally, we explore the presence of AGN and its relation with two mechanisms explored by Bitsakis et al. (2019): (i) the lack of cold gas and (ii) the decrease of the efficiency to form new stars. In addition, we include the morphology of the host galaxy in the analysis, searching for a morphological connection with the aforementioned mechanisms.
This paper is organized as follows. In Section 2 we summarize the general properties of the employed sample of galaxies. The stellar population synthesis, the fit of the emission lines and the AGN selection scheme are unfolded at Section 3. The main properties of AGN hosts and the comparison with their non-active counterparts appear in Section 4. Section 5 brings a comparison with other recent IFS AGN studies and the discussion about what role the AGN plays in the evolution of their host galaxies and we finalize with our conclusions at Section 6. Along this article we assume the standard Cold Dark Matter cosmology with the parameters: H0=71 km/s/Mpc, =0.27, =0.73.
2 Data
The dataset adopted along this study comprises all the observations with good quality obtained by the CALIFA survey in the low resolution mode (V500), together with all the CALIFA extended surveys (Sánchez et al., 2016c; Galbany et al., 2018), including data from the PMAS/Ppak Integral-field Supernova hosts COmpilation (PISCO; Galbany et al., 2018). This sample (eCALIFA hereafter), comprises 867 galaxies selected following the criteria of the original mother sample (MS; Walcher et al., 2014), but relaxing some of them. In general, all of galaxies were diameter selected, with most of their optical extension fitting within the field-of-view (FoV) of the instrument, but they could be either fainter or brighter than the limits adopted for the MS, or located at slightly larger redshifts, slightly out of the boundaries of the original selection. The main difference with the original mother sample is that the selection is not restricted to the SDSS foot-print (York et al., 2000). The final sample comprises galaxies of any morphological type, covering the mass range between M⊙ (mean M⊙), and a redshift range between (with 93 per cent of them with , i.e., a similar redshift foot-print of the original CALIFA sample). In general they comprise a representative sample of the galaxies in the nearby Universe.
Observations are made using the V500 setup of the Integral Field Unity (IFU) instrument (PMAS/PPAK, Roth et al. 2005; Kelz et al. 2006) at the Calar Alto 3.5 m telescope. This configuration results in a spectral range covering 3745-7500 Å with a nominal resolution of at 5000 Å (FWHM Å). A three point dithering scheme was performed in order to increase the spatial resolution and cover 100 per cent of the field-of-view (). Data were reduced using version 2.2 of the CALIFA reduction pipeline. The processes involved in the reduced pipeline are described in the third data-release of the CALIFA survey (DR3, Sánchez et al., 2016c). The final product of the reduction is a datacube with two dimensions corresponding to the spatial coordinates (right-ascension and declination), and a spatial sampling of 1/spaxel, and the third dimension corresponding to the spectral range. The galaxies from the sample are covered well enough to obtain integrated and spatial resolved properties probing up to 3 (in some cases 4) effective radii. At the distances of our sources, the estimated spatial PSF FWHM () is around 0.8 kpc in average.
Morphological information for all the objects in the original CALIFA mother sample was retrieved from Walcher et al. (2014), comprising 635 of the current sample. For the remaining 232 objects in the eCALIFA sample we adopted the same procedure described in that article to derive the morphological classification by eye. In summary we inspected the true-color SDSS (DR7, Abazajian et al., 2009) images, and when not available we used similar images extracted from the datacubes (at lower spatial resolution), together with emission line images (to detect possible traces of spiral arm structures). As indicated before, the final sample spans over all Hubble types, comprising 163 ellipticals (E0-E7), 105 lenticulars (S0+S0a), 590 spirals (Sa-Sm) and 9 irregular (I) galaxies.
3 Analysis
3.1 Stellar population synthesis and Emission-line fitting
The datacubes were analysed using the Pipe3D pipeline (Sánchez et al., 2016b), in order to extract information of the properties of the stellar population and the emission lines. Its current implementation adopts the GSD156 library of simple stellar populations, SSP (Cid Fernandes et al., 2013). This SSP-library comprises 156 templates for 39 stellar ages from 0.001 to 14.1 Gyr and four metallicities ( = 0.2, 0.4, 1 and 1.5), that adopts the Salpeter initial mass function (IMF; Salpeter, 1955). This library has been widely used by various previous publications (e.g. Pérez et al., 2013; González Delgado et al., 2014b; Sánchez-Menguiano et al., 2016, 2018; Lin et al., 2019; Ibarra-Medel et al., 2019). Details of the fitting procedure, dust attenuation curve, uncertainties of the processing of the stellar populations and emission lines, and the dataproducts derived by Pipe3D are included in Sánchez et al. (2016a), Sánchez et al. (2016b). We include here a brief summary of the main processes included in the pipeline.
First, the stellar population is analysed. To do so the datacube is spatially binned in the V-band to increase the signal-to-noise (S/N) above the limit at which the derived parameters are reliable (S/N50, based on Sánchez et al., 2016a). However, in order to preserve the original shape of the galaxies and minimize the mixing of different physical regions, the adopted binning impose a maximum difference in the surface-brightness between adjacent spaxels (Sánchez et al., 2016b). Then a stellar population fit is applied to the co-added spectra within each spatial bin using the Fit3D code. A spaxel-wise stellar-population model is estimated then by re-scaling the best fitted model (in each bin) to the continuum flux intensity in the corresponding spaxel (Cid Fernandes et al., 2013; Sánchez et al., 2016a). The model is then used to derive the spaxel-wise stellar mass density and co-adding through the entire FoV, the total stellar mass of the galaxy.
A gas-pure datacube is created by subtracting the spaxel-wise stellar-population model from the original cube. This cube is used to derive the spatial resolved properties of the ionized gas emission lines. A moment analysis is performed for a set of 52 emission lines (Sánchez et al., 2016b, 2018), deriving the flux intensity, velocity, velocity dispersion and equivalent width (EW) for each individual spectrum. The final dataproducts comprise a set of maps for each galaxy, one for each of the estimated parameter (with its corresponding error). Along this article we use only the fluxes and EWs for the strongest emission lines: H, H, [O ii]3727, [O iii]4958,5007, [N ii]6548,6583, [S ii]6731,6716. Each of these lines were corrected for dust attenuation in a post-processing of the data. The dust attenuation was estimated spaxel-wise, using the H/H ratio, assuming a Cardelli et al. (1989) extinction law with RV=3.1 and a standard value of the intrinsic ratio of 2.86 (Osterbrock, 1989).
Along this paper we derive the SFR from the H luminosity calculated spaxel-by-spaxel with detected ionized gas for each galaxy, using the dust-corrected H luminosity and then converted to SFR following the Kennicutt (1998) calibration. This procedure considers spaxels irrespective of their ionization source, thus a part of the observed H is not coming from SF. This H emission contamination is discussed by Cano-Díaz et al. (2016) and Sánchez et al. (2017) and evaluated by Lacerda et al. (2018). The SFR value is minorly affected by this contamination in galaxies dominated by SF, as previously noted by Catalán-Torrecilla et al. (2017). Conversely, galaxies with ionization budget dominated by other processes, such as AGN, jets, shocks and post-AGB (Asymptotic Giant Branch) stars would be affected and their derived SFR should be consider as an upper limit. In order to mitigate part of this caveat, in our version of the H-based SFR, the H flux is decontaminated for post-AGB (hot low-mass evolved stars; Flores-Fajardo et al. 2011) emission by assuming that these sources add 1 Å to the EW of H, WHα (Binette et al., 1994; Stasińska et al., 2008; Cid Fernandes et al., 2011).
The cold gas is a key property for the understanding of the evolution of galaxies since it is the fuel of the SF (e.g. Kennicutt & Evans, 2012; Krumholz et al., 2012). Recent studies have evaluated how and why the SF stops using different data, methods and assumptions (e.g. Cappellari, 2013; González Delgado et al., 2014a; Casado et al., 2015; Saintonge et al., 2016). The relation between the SFR and the density of the interestellar gas proposed by Schmidt (1959), later known as the Schmidt-Kennicutt law (SK-law Kennicutt, 1998), is maintained at kpc-scales only for the molecular gas (e.g. Kennicutt et al., 2007; Bigiel et al., 2008; Leroy et al., 2013). Important efforts have been made in order to gather direct measurements of molecular gas in galaxies present in the CALIFA sample by the EDGE-CALIFA collaboration (e.g. Bolatto et al., 2017), but so far they have collected CO measurements for only 126 galaxies. We have thus estimated the molecular gas content indirectly by means of a gas-to-dust conversion with a correction factor that depends of the oxygen abundance as derived by S18:
| (1) |
Dust extinction along the line-of-sight correlates with the molecular hydrogen column density (e.g. Dickman, 1978; Bohlin et al., 1978; Rachford et al., 2009; Brinchmann et al., 2013) allowing us to estimate the gas content in galaxies. A detailed study of the spatially-resolved distribution of the total cold gas (atomic+molecular) from the optical dust attenuation calibration is presented by Barrera-Ballesteros et al. (2019). Following those results, the molecular gas mass surface density, , is estimated by the local (i.e. spaxel-by-spaxel) gas-to-dust conversion and integrated for the entire FoV of each galaxy. On average, these estimated surface density values, when compared with CO-based measurements, present a dispersion of dex (e.g. Galbany et al. 2017), therefore our integrated gas masses values should be considered as a first order approximation to the real ones.
Further global parameters derived from the emission lines or directly from the multi-SSP analysis of the stellar population synthesis, like both characteristic oxygen abundance and stellar metallicity (thus, at the effective radius) are derived following the same procedure described in several previous articles (e.g. Sánchez et al., 2017, 2018, 2019b). We refer the reader those articles for the details on their particular derivation, to avoid unnecessary repetitions.
3.2 AGN candidates
The ionized gas located in the central region of galaxies carries the spectroscopic signatures of the presence or not of an active nucleus. The analysis of diagnostic diagrams based on flux ratios between emission lines observed in the optical range have helped us through years to this goal (e.g. Baldwin, Phillips & Terlevich 1981; Veilleux & Osterbrock 1987; Veilleux et al. 1995; Kewley et al. 2001; Kauffmann et al. 2003b). Ratios between collisionally excited to recombination lines are sensitive to electronic temperature so that the hardness of the ionization field can be measured combining them (e.g. [N ii]/H vs [O iii]/H, [O i]/H vs. [O iii]/H).
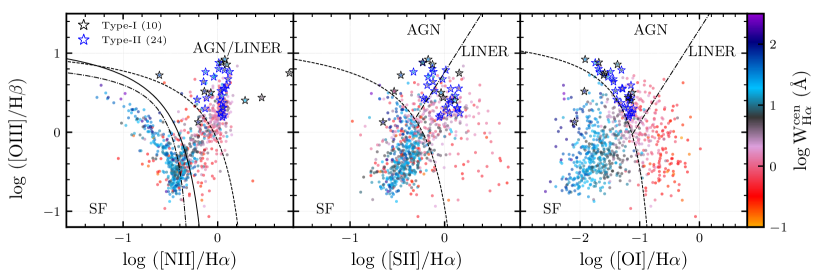
In pursuance of AGN host candidates among our sample, we plot in Figure 1 the distribution of [N ii]/H, [S ii]/H, [O i]/H vs [O iii]/H emission-line ratios (here we call it BPTVO, after Baldwin, Phillips & Terlevich 1981 and Veilleux & Osterbrock 1987) integrated over the central region of 849, 837 and 834 galaxies respectively. They comprise all galaxies with the considered emission lines detected at the central aperture above a 3 detection limit. Combining them we obtain 819 objects with all needed lines measured. For the remaining 48 galaxies, at least one of the considered emission lines is not detected in this particular aperture. The numbers are different between diagrams due to the natural differences in the line intensity of each emission-line, and therefore the ability to detect them. From the initial sample of 867 galaxies, we do not detect H (the strongest line, in general) in the central region of only 10 of them.
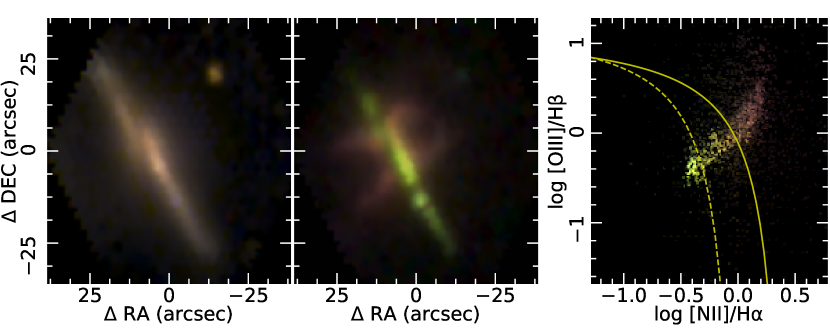
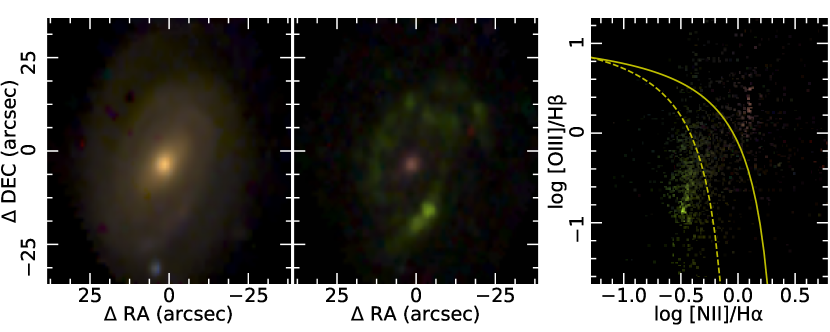
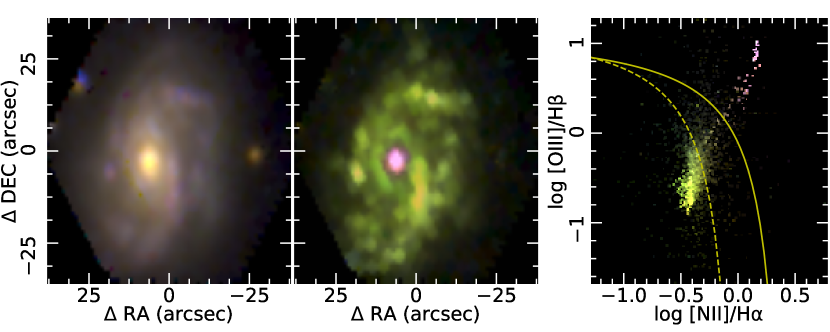
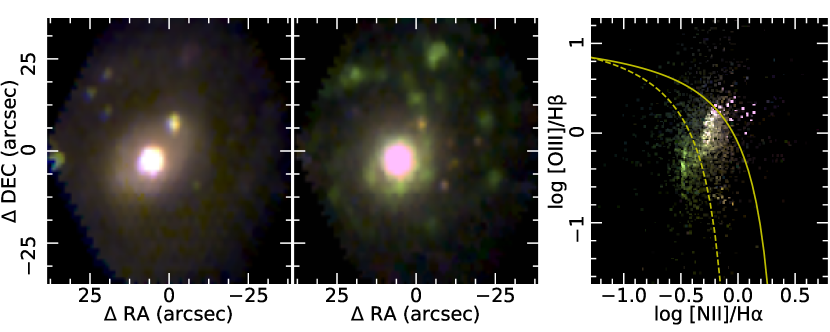
The lines in each diagram included in Figure 1 were designed to indicate the main ionization source of different loci over the analysed plane. The Kewley et al. (2001, K01) and the Kauffmann et al. (2003b, K03) lines are the most known. They are typically used to distinguish between pure star-forming galaxies (below the K03 line) and pure AGN/LINER (Low-ionization Nuclear Emission-line Region) hosts (above the K01 line). However, with the spread usage comes a lot of misleading interpretation of its purposes and real foundations. The K01 line was designed to select galaxies that harbour an ionization different than SF with certainty. Its derivation was based on photoionization models covering a wide range of parameters and stellar population synthesis models. It traces the maximum values of the involved line ratios that can be generated by ionization due to young stars (thus, associated with SF). Objects above it have to harbour an additional ionization source (different from what they considered SF), however its nature is not well determined. In general AGNs are located above this line (e.g. Osterbrock, 1989), therefore central ionization found in this location of the diagram is in general associated with the presence of an AGN. Nonetheless, other sources of ionization may populate these regions too. The most frequent ones are: (i) diffuse ionization ubiquitous associated with old-stellar populations (e.g., post-AGBs; Binette et al., 1994; Singh et al., 2013; Gomes et al., 2016) as shown in the central region of the galaxy at the upper-right panel in Figure 2, IC 4566; and (ii) shock ionization, associated with galactic outflows at the resolution of our data (e.g. Bland-Hawthorn et al., 2007). This latter example could be seen in galaxy at the upper-left panel in Figure 2. NGC 6286 is an interacting galaxy hosting outflows identified by the study of López-Cobá et al. (2019) and it has the central EW of H, W, equals to 28 Å, but a soft central spectrum compatible with ionization by SF. However, this galaxy is full of regions dominated by the hard ionization compatible with AGN/shocks in the outskirts.
In addition, stellar population synthesis including the near-infrared (NIR) modeling shows that Type-I AGN hosts have a contribution of young stellar components up to 90 per cent in the central spectra (e.g. Riffel et al., 2009). This effect could move a source to the SF region of the diagnostic diagrams applyied here. On the other hand, distinguishing between the presence of an AGN from post-AGB ionization it is possible by introducing a cut in the WHα (e.g. Cid Fernandes et al., 2011; Lacerda et al., 2018, at least for the strong AGNs). On the other hand, shock ionization induced by a galactic outflow can be identified by examining the morphology of the ionized gas distribution towards the minor axis, where its typical distribution adopts conical/biconical shapes (López-Cobá et al., 2017; López-Cobá et al., 2019). Optical counterparts of radio-jets and supernova remnants may be also located in this region of the diagram, however they are far less frequent.
3.2.1 The selection of Type-II AGN candidates
The issue of identifying the ionizing source in galaxies or regions of galaxies based just on pure line ratios has been discussed extensively in previous studies (e.g. Sánchez et al., 2012; Cano-Díaz et al., 2016; López-Cobá et al., 2019). Based on the prescriptions adopted in these articles and adapting the recipe used by S18, we select our sample of bona-fide AGN candidates (black and blue open stars in Figure 1). This involves a combination of the loci within the BPTVO diagrams together with a limit in W. If instead of that criteria, we had only adopted a demarcation line (even the more conservative one, i.e., K01) as our boundary between AGNs and SF ionization, we would have selected 181/259/312 AGN hosts respectively (for each diagram). Conversely, we can combine the BPTVO diagram together with one of the other two, selecting objects simultaneously above the two involved demarcation lines. With this selection we would have found 169 AGNs using the first diagram plus the second one (BPT + [S ii]/H) and 131 objects using the first plus the third one (BPT + [O i]/H). A lot of these objects are certainly not AGN hosts, based on the results by Stasińska et al. (2008) and Cid Fernandes et al. (2010), since they have low W values. In order to remove objects with the central ionization source most probably coming from post-AGBs, we select only those galaxies that have an W above 3 Å. An example of this cut effect could be seen in Figure 2 where the galaxy IC 4566 (upper-right triad of panels) and NGC 1667 (lower-left triad of panels) are very similar regarding RGB images and BPT planes and both could be classified by AGN hosts if only the BPT plane of the central spectrum was considered. However, IC 4566 has the central ionization dominated by HOLMES, i.e., a hard ionizing field with low-WHα, 1.8 Å. On the other hand, NGC 1667 has W 11.4 Å, showing a signature of a strong AGN. After this cut we obtain, in the same order described before, 69, 90 and 49 galaxies, using only one of the diagrams, and 60 and 34 using the BPT plus [S ii]/H or [O i]/H. Therefore, following S18, to choose our bona-fide Type-II AGN candidates, we select our candidates in the most restrictive criteria: (i) they have to lie above the K01 line in all three diagrams at the same time; and (ii) have W larger than 3 Å (e.g. Cid Fernandes et al., 2011). S18 adopted a slightly less restrictive criterion for the W (1.5Å), due to the lower spatial resolution of the MaNGA sample, and the involved dilution (e.g. Mast et al., 2014) and possible contamination by other sources of ionization for the same central aperture selected here. From the 63 initial candidates above the K01 line in the BPT and with W > 3 Å, 60 of them are also above the K01 line in the [S ii]/H diagram. Finally, of those 60 candidates, 32 lay above the K01 line in the [O i]/H diagram. These are the initial sample of AGN host candidates. Raising the W limit to 6 Å, we loose 12 Type-II candidates. This last value was attributed as the borderline between weak and strong AGN (wAGN and sAGN) loci in the WHAN diagram (Cid Fernandes et al., 2011). Thus, of the 32 candidates, 20 are sAGNs and 12 would be wAGNs.
Note that we do not use the Kewley et al. (2006, K06) line, usually adopted to segregate between AGN and LINERs, since this segregation occurs naturally by the limit adopted in the W. Of the 32 candidates, 18 are below the AGN/LINER division in the [S ii]/H diagram, but none are below this demarcation line in the [O i]/H diagram, showing that this latter is a better proxy to the strength of the ionization field (e.g. Schawinski et al. 2010; S18). As noted by these two previous studies, we see that our AGN selection disagrees with the Seyfert/LINER separation line in the BPT diagram (K06 line updated by Cid Fernandes et al., 2011), with 41 per cent of the selected candidates to host an AGN located below it. For the K06 line in the [S ii]/H diagram we found 53 per cent below it. Although this foregoing procedure could bias our sample towards hosts of strong AGNs, as we need to measure various emission lines and make a restriction to the W, such method helps us to select more reliable candidates and not all possible contenders. Our final sample of bona-fide Type-II AGN hosts is composed by 24 candidates (blue open stars on Figure 1). The 8 remaining candidates (from the 32 that passed all criteria to select an AGN host in this study) are classified as Type-I AGN, as described in the next Section.
3.2.2 Type-I AGN candidates
| Galaxy Name | AGN Type | RA | DEC | redshift | Morphology |
|---|---|---|---|---|---|
| UGC 01859 | 1 | 02h24m44s | +42d37m24s | 0.019872 | E4 |
| UGC 03973 | 1 | 07h42m33s | +49d48m34s | 0.022048 | Sbc |
| UGC 03995 | 1 | 07h44m09s | +29d14m51s | 0.015735 | Sb |
| CGCG 064-017 | 1 | 09h59m15s | +12d59m02s | 0.034273 | Scd |
| NGC 5929 | 1 | 15h26m06s | +41d40m14s | 0.008385 | Sb |
| NGC 6251 | 1 | 16h32m32s | +82d32m16s | 0.024440 | E5 |
| NGC 6264 | 1 | 16h57m16s | +27d50m59s | 0.033883 | Sab |
| UGC 11680 NED01 | 1 | 21h07m41s | +03d52m18s | 0.025800 | Sb |
| NGC 7469 | 1 | 23h03m16s | +08d52m26s | 0.016169 | Sc |
| UGC 12505 | 1 | 23h19m25s | +05d54m22s | 0.020278 | Sc |
| MCG -02-02-030 | 2 | 00h30m07s | -11d06m49s | 0.011787 | Sb |
| UGC 00934 | 2 | 01h23m27s | +30d46m42s | 0.034871 | Sb |
| UGC 00987 | 2 | 01h25m31s | +32d08m12s | 0.015301 | Sa |
| NGC 0833 | 2 | 02h09m21s | -10d07m59s | 0.012702 | Sa |
| PGC 009572 | 2 | 02h30m51s | +22d28m13s | 0.030990 | E4 |
| NGC 1093 | 2 | 02h48m16s | +34d25m13s | 0.017428 | Sbc |
| NGC 1667 | 2 | 04h48m37s | -06d19m12s | 0.015049 | Sbc |
| UGC 03789 | 2 | 07h19m31s | +59d21m18s | 0.010692 | Sb |
| NGC 2410 | 2 | 07h35m02s | +32d49m20s | 0.015591 | Sb |
| IC 2247 | 2 | 08h16m00s | +23d11m59s | 0.014242 | Sab |
| NGC 2554 | 2 | 08h17m54s | +23d28m20s | 0.013507 | S0a |
| NGC 2639 | 2 | 08h43m38s | +50d12m20s | 0.010502 | Sa |
| IC 0540 | 2 | 09h30m10s | +07d54m10s | 0.006701 | Sab |
| NGC 3160 | 2 | 10h13m55s | +38d50m35s | 0.022733 | Sab |
| UGC 06719 | 2 | 11h44m47s | +20d07m24s | 0.021831 | Sb |
| NGC 3861 | 2 | 11h45m04s | +19d58m25s | 0.016874 | Sb |
| NGC 5216 | 2 | 13h32m07s | +62d42m02s | 0.009742 | E0 |
| NGC 5443 | 2 | 14h02m12s | +55d48m50s | 0.005982 | Sab |
| NGC 5533 | 2 | 14h16m08s | +35d20m38s | 0.012793 | Sab |
| NGC 5675 | 2 | 14h32m40s | +36d18m08s | 0.013098 | Sa |
| UGC 09711 | 2 | 15h06m37s | +09d26m19s | 0.027915 | Sab |
| NGC 6394 | 2 | 17h30m21s | +59d38m24s | 0.028471 | Sbc |
| NGC 6762 | 2 | 19h05m37s | +63d56m03s | 0.009729 | Sab |
| UGC 12348 | 2 | 23h05m19s | +00d11m22s | 0.025097 | Sb |
-
1
The complete data is published in an online catalog at http://132.248.1.15:8001/CALIFA_AGN_hosts.csv.
We base our selection of Type-I AGN hosts on the presence of a broad component of H in the central spectra. With Fit3D (Sánchez et al., 2016a) we perform a fit of the spectral region around the [N ii] doublet and H with a model that comprises four gaussians: (i) a broad component of H (FWHM 1000 km/s), and (ii) three narrow components, the [N ii] doublet and H itself (FWHM 300 km/s). Following this process, we select those galaxies with a S/N above 8 for the peak intensity of the measured broad component of H. We adopt the peak intensity and not the integrated flux since when no broad component is present the procedure tends to artificially introduce a nonphysical one with a very low intensity peak. Based on this criterion we selected 8 Type-I AGN candidates. Two more were added after a visual inspection of all the spectra with a broad component intensity with a S/N5, selecting those that clearly show a broad component. Similar visual inspection were performed in previous studies for the same reason (e.g., S18).
For Type-I AGNs we adopted the flux intensities derived from the narrow emission lines modeling performed using the multi-Gaussian fitting for the ratios included in Figure 1. For doing so we repeated the same fitting procedure described before for the H +[O iii] wavelength range, including a narrow and broad component to model H, just for the AGN candidates. All but 2 of the Type-I candidates fulfill the criteria adopted to select Type-II candidates. The other two may be affected by a inaccurate or imprecise determinations of the narrow component of H, since in both cases it is clearly below the flux intensity of the corresponding broad component. It should be noticed that even in the case where we have a good fit for the broad component of H, the fitting of H is more difficult due to its intrinsically lower flux. Indeed the two Type-I candidates that do not fulfill all the criteria indicated before are above the K01 demarcation curves in at least two of the considered diagnostic diagrams. Besides that, for both AGN Types, we have to take into account that, at least in the considered aperture (1 kpc2), the central ionization may be contaminated by ionizing sources other than AGN, that could affect the observed line ratios. One of these galaxies is NGC 7469 (lower-right triad of panels at Figure 2), a face-on Sc galaxy host of a Type-I AGN with the FWHM of the rms spectrum reaching thousands of km/s (e.g Seyfert, 1943; Peterson & Wandel, 2000) and with W 100Å. Rembold et al. (2017) have shown that the hosts of the strongest AGNs (those with higher [O iii] luminosity) present an increasing contribution of young stellar populations at their centre, which could account for the loci of this central spectrum in all BPTVO diagnostic diagrams and the high value of W at the current spatial resolution of our data.
3.2.3 Final Sample
In Table 1 we present the final sample of candidates to host an AGN, that comprises 34 galaxies (24 Type-I and 10 Type-II). They represent 4 per cent of the total sample of galaxies. This number is very close to the one reported by S18, using a similar selection criteria for the MaNGA IFS dataset (Bundy et al., 2015). As pointed out by S18, this kind of selection is biased through galaxies with enough gas to present a clear AGN signature in the optical range of the spectrum. That means that we do not include radio-galaxies (without emission lines), Type-0 objects (e.g. Urry & Padovani, 1995) and very obscured AGNs (e.g. Benn et al., 1998; Hickox & Alexander, 2018), in our selection. These are not very usual objects (apart from radio-galaxies) and we believe that they do not impose any strong bias in our sample considering the final goals of our study. In respect to radio galaxies, the involved time-scales are different, thus they could represent distinct evolutionary stages between the radio emission and other AGN activity (e.g. Buttiglione et al., 2010; Tadhunter et al., 2012). Finally, by construction, we exclude very weak AGNs, as we impose an W > 3 Å cut for the AGN host selection. However, it is expected that the effect of this group in the overall evolution of the host galaxy is less important.
When selecting AGN hosts using only the central region ionization, our goal is to classify the bona fide AGN hosts and not all the possible candidates. In this way we do not account for possible displaced active nuclei observed in some mergers (e.g. Menezes et al., 2014) and also recently turned off AGNs (e.g. Wylezalek et al. 2018, using the MPL-5 sample). These authors consider the ionization of all spaxels of a galaxy in their classification of AGN hosts. In this way, as we will discuss ahead in this article, they add galaxies that suffer from ionization by outflows in a great number of spaxels, reaching a high fraction of AGN hosts (303 AGN hosts from 2727 galaxies, 11 per cent). It is worth noticing that no inclination cut was performed during the selection process. This may introduce a possible issue, since in edge-on galaxies shock ionization due to galactic outflows may mimic the properties of that of AGNs, based on our selection criteria. For example, IC 2247, assigned here as a Type-II AGN host candidate, is also a candidate to be hosting an outflow in the study of 203 highly inclined () galaxies from CALIFA made by López-Cobá et al. (2019). In the same line, these authors detected extraplanar gas in IC 1481, a galaxy classified as Type-I by our analysis. However, it is also worth noticing that they report that both objects present an ionization compatible with AGNs in between a 30 per cent and 60 per cent of their covered FoV. Thus, they have already indicated the possible presence of an AGN. It is important to notice that approximately 30 per cent of our Type-II AGN hosts have and none of our Type-I AGN hosts are. Thus, inclination does not seem to impose a severe bias in the detection of Type-II AGNs in our sample, since the observed fraction is similar to the one found for highly inclined galaxies.
4 Results
4.1 The properties of the AGN hosts
Knowing which galaxies host an AGN, we now explore their properties and compare them with those of their non-active counterparts.
First we classify the full sample of galaxies with respect to their stage of SF, separating them in three categories, based on the WHα at the effective radius, W:
-
•
Star-forming Galaxies (SFG): W > 10 Å;
-
•
Green-valley Galaxies (GVG): 3 Å > W 10 Å;
-
•
Retired Galaxies (RG): W 3 Å.
We adopt WHα as a proxy of the SF stage based on the tight correlation between this parameter and the specific star-formation rate (sSFR; e.g. Sánchez et al., 2013; Belfiore et al., 2018). In essence, this classification is similar to the one proposed by Lacerda et al. (2018) but loosening up the floor limit of SF from 14 Å to 10 Å, since here we are dealing with integrated/characteristic properties of entire galaxies. Additionally, we recall that the W is a better proxy of the average WHα of a galaxy than the actual value derived using a limited aperture spectroscopic exploration. Dividing the sample of 867 galaxies in these three classes we obtain the following distribution: 382 SFGs, where SF process is prominent; 185 GVGs, where a range of different processes could are in place (shocks, jets, AGN, etc), or it does not exist a prevalent process (mixed processes like AGN+SF, HOLMES+SF, AGN+HOLMES, etc); and 300 RGs, where the scant gas is mainly ionized by HOLMES. The strong connection between the mean WHα, the dominant ionization process and the SF-stage was uncovered and discussed in detail recently by Cano-Díaz et al. (2019).
AGN hosts are clearly more frequent within the GVG class, comprising 18 galaxies (4 Type-I and 14 Type-II). Both SFG and RG classes have 8 AGN hosts each one, with 4 Type-I and 4 Type-II at SFG class and 2 Type-I and 6 Type-II between the retired ones. We will see that this behavior is reflected in most of the properties analysed hereafter. Indeed, this was already noticed, in the exploration of the CMD by Kauffmann et al. (2003b) and Sánchez et al. (2004), for both Type-II and Type-I AGNs respetively. More recently, Schawinski et al. (2014) replicate both results in more detail. Similar results were reported at a wide range of redshifts by different authors (e.g. Silverman et al., 2008; Wang et al., 2017).
4.1.1 Color-Magnitude diagram
Galaxies present a clear correlation between their colors and their morphology, as already highlighted in the seminal article from de Vaucouleurs (1961). In a more recent study, Strateva et al. (2001) verified this bimodality in the color for 148,000 galaxies from the SDSS survey. The bimodality is more evident in the CMD, showing a density peak for what we know as the red sequence population, dominated by early-type galaxies with dominant old-stellar populations and a blue cloud populated by late-type star-forming galaxies, with younger stellar populations (Bell et al., 2004). The luminosity of a source correlates very well with its mass (via the M/L ratio that correlates with the color, e.g., Bell & de Jong, 2001). Thus, red and old population galaxies are in general more massive and the blue and young ones are the less massive.
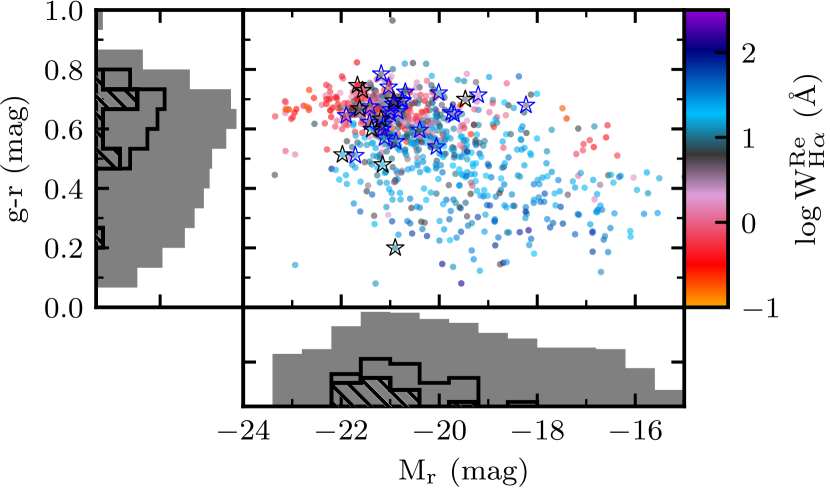
The leftmost diagram of Figure 3 show the CMD for our sample. We use the color vs. the -band absolute magnitude, Mr, in order to verify the location occupied by the AGN hosts in this plane. For the total sample, the bimodality is evident, with the two denser regions indicated before clearly visible: the red sequence and the blue cloud. The region in between these two more populated places is the so-called green valley. Those galaxies corresponds exactly with those selected using the W criterion indicated before. The lack of galaxies in the GV is interpreted as a fast evolution between SFGs and RGs, i.e., a quick halting of the SF (accompanied by a dramatic change in the morphology, structural properties and dynamics of galaxies) compared to the Hubble time. The fraction of GVG in this work is 20 per cent of the total, the lowest population with respect to the other two groups.
The mean values of the color and Mr are 0.47 mag and -19.46 mag for the SFG, 0.60 mag and -20.46 mag for the GVG and 0.65 mag and -20.84 mag for the RG, respectively. The color seem to be less efficient to segregate between GVGs and RGs (e.g. Kauffmann et al., 2007) that other colors involving UV-bands or other parameters, like the sSFR or the WHα. The W (color-code used in Figure 3) indicates us that the red sequence is populated by galaxies which main ionization is compatible with post-AGBs. On the other hand, galaxies in the blue-cloud present higher W values, therefore they are compatible with ionization by SF. As indicated before, several works found AGN hosts populating the GV in the UV-optical CMD too (e.g. Martin et al., 2007; Salim et al., 2007; Salim, 2014, and references therein). The AGN hosts of our sample are located in between the two most populated regions of the CMD plane, found at the bluer part of the red sequence, in agreement with former works (e.g. Kauffmann et al. 2003a; Sánchez et al. 2004; S18). However, regarding their colors, AGN hosts are difficult to differentiate from galaxies mostly ionized by post-AGBs. The colors of Type-I and Type-II AGN hosts are 0.60 and 0.65 mag, respectively, and the mean value for all AGN hosts is 0.63 mag. Thus, a value in between the GVG and RG values. Regarding the Mr, the mean value for AGN hosts is approximately the same than that of RGs, with -21.18 mag for Type-I and -20.68 mag for the Type-II hosts.
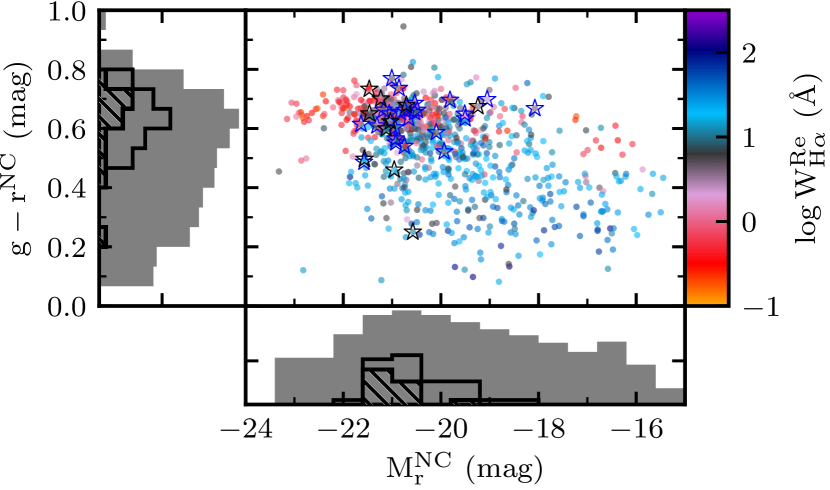
AGNs could present a high luminosity compared with their host galaxies, over-shining them, and dominating the overall colors. Thus, they may change the galaxy position at the CMD. For Type-I AGN hosts this effect could be even stronger (e.g. Sánchez & González-Serrano, 2003; Sánchez et al., 2004; Jahnke et al., 2004a, b; Zhang et al., 2016). With the current dataset we repeat the experiment already done by S18 masking the central region from the datacubes and recreating the CMD in order to evaluate the possible AGN contamination upon the colors. We see in the right-panel of Figure 3 this experiment. In agreement with S18, we do not find any significant difference between both diagrams. In summary, Type-I hosts shift, in average (standard deviation), -0.01 mag (0.02 mag) in the axis and 0.25 mag (0.08 mag) in the Mr one, while Type-II hosts shift by -0.02 mag (0.01 mag) in the axis and 0.18 mag (0.07 mag). In both cases the change is negligible. Therefore, the position of AGNs in the transition regime between the red sequence and the blue cloud is not produced by the nuclear source itself, as excluding the central regions neither the positions of Type-I AGN hosts nor those of the Type-II AGN hosts change significantly.
4.1.2 The morphology
| M. type | N (per cent) | all AGN1 | Type-I2 | Type-II2 | /M | R90/R50 | V/ (R < Re) | |
| E | 163 (19) | 4 (12;2) | 2 (6;20;1) | 2 (6;8;1) | 10.83 | 2.82 | 3.64 | 0.28 |
| S0 | 59 (7) | – | – | – | 10.60 | 3.20 | 3.61 | 0.40 |
| S0a | 46 (5) | 1 (3;2) | – | 1 (3;4;2) | 10.81 | 2.73 | 3.64 | 0.41 |
| Sa | 59 (7) | 4 (12;7) | – | 4 (12;17;7) | 10.82 | 2.78 | 3.65 | 0.41 |
| Sab | 66 (8) | 8 (24;12) | 1 (3;10;2) | 7 (21;29;11) | 10.73 | 2.57 | 3.50 | 0.44 |
| Sb | 130 (15) | 10 (29;8) | 3 (9;30;2) | 7 (21;29;5) | 10.68 | 2.38 | 3.41 | 0.46 |
| Sbc | 106 (12) | 4 (12;4) | 1 (3;10;1) | 3 (9;12;3) | 10.57 | 2.19 | 3.27 | 0.49 |
| Sc | 75 (9) | 2 (6;3) | 2 (6;20;3) | – | 10.26 | 2.32 | 3.03 | 0.52 |
| Scd | 71 (8) | 1 (3;1) | 1 (3;10;1) | – | 10.03 | 2.15 | 2.88 | 0.50 |
| Sd | 34 (4) | – | – | – | 9.81 | 2.09 | 2.67 | 0.52 |
| Sdm | 30 (3) | – | – | – | 9.80 | 2.38 | 2.59 | 0.54 |
| Sm | 19 (2) | – | – | – | 9.57 | 2.47 | 2.67 | 0.43 |
| I | 9 (1) | – | – | – | 8.89 | 2.53 | 2.29 | 0.43 |
-
1
We show the number of galaxies, the percentage over the total of objects at the considered column (all AGN hosts, only Type-I hosts and only Type-II hosts) and over the total present of each morphological class. E.g. We have a total of 9 AGNs among Sab galaxies. They represent 24 per cent of all AGNs and 12 per cent of all Sab.
-
2
We present the same statistics of all AGN with the inclusion of the percentage over the total number of each AGN Type. E.g., we have a total of 34 AGNs and 10 of them are among Sb galaxies. Three of them are classified as Type-I (9 percent of all AGNs, 30 per cent of all Type-I hosts and 2 per cent of Sb galaxies); and 7 are Type-II AGN hosts (21 percent of all AGNs, 29 per cent of Type-II, and 5 per cent of Sab galaxies).
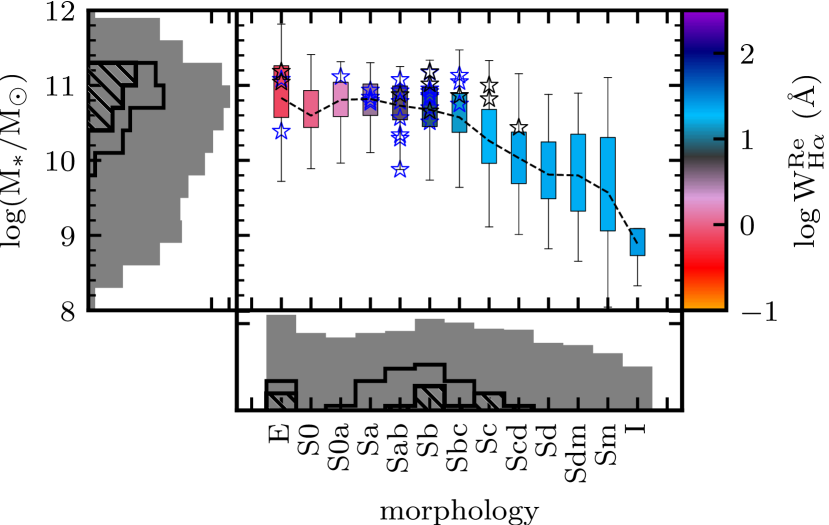
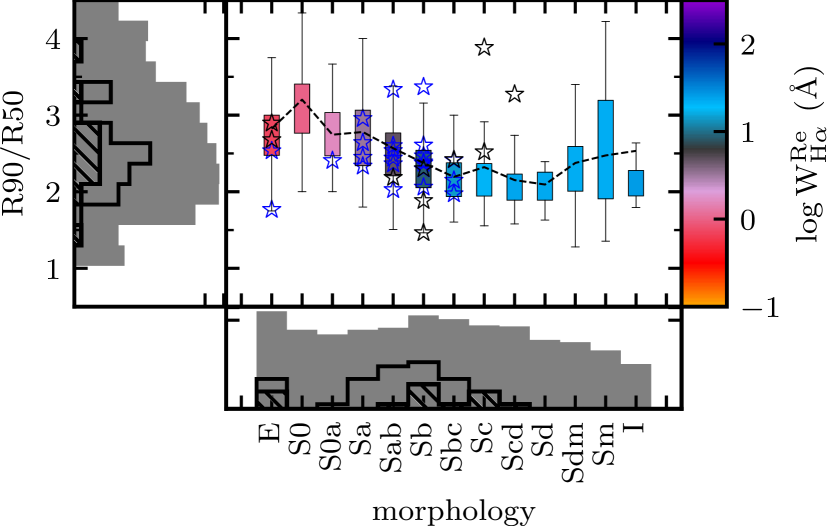
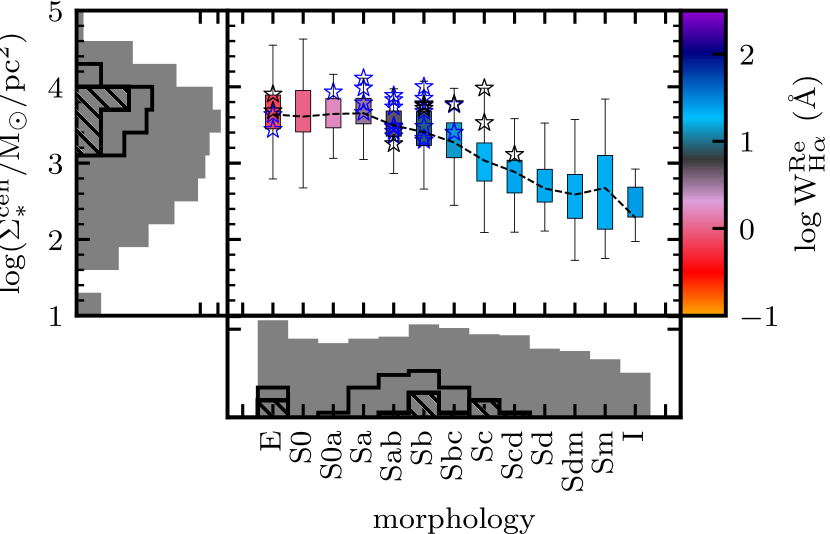
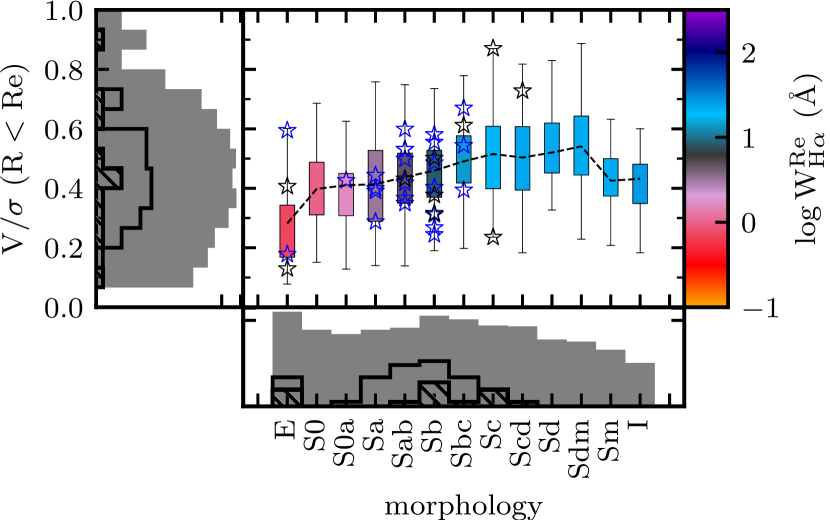
We continue our study comparing representative physical properties that can elucidate which type of galaxies are hosting an AGN and which are the differences with respect to those that are not (if any). Figure 4 shows the distribution of the integrated stellar mass, R90/R50 concentration ratio, central stellar mass surface density and the velocity-to-velocity dispersion ratio, V, along morphological classes. In general, the average distribution of such properties follows the expected values for the majority of galaxies at each class. Later-types show smaller total stellar-mass, are more concentrated in light and in stellar-mass surface density with its stars following less disturbed orbits, in comparison to early-type ones (more massive, concentrated and usually supported by random orbits).
If morphology is somehow bound to the evolution of galaxies, and AGNs play a role in the quenching process, they should be located as transition objects between spirals (SFGs) and ellipticals (RGs). It is clearly appreciated in all panels in Figure 4 that the AGN hosts are indeed in the spiral-to-elliptical transitory space. Table 2 summarize the distribution of galaxies in morphological classes and how the AGN hosts spread among them, including the average values of every property at each morphological class. We see a predilection to Sab-Sb galaxies harbouring an AGN while none are found in later-types (> Scd). Our sample of AGN hosts contains 4 early-type elliptical galaxies (E), 29 from early to late spirals (>= Sa) but only one among lenticular ones (S0+S0a). Statistically, we found per cent of all Sab galaxies (8 out of 66) hosting an AGN. Finally, we have 10 hosts among the Sb galaxies, but those represent only per cent of this class galaxies (10 in 130).
In the upper-left panel of Figure 4 we see that the AGN hosts are strongly biased toward massive galaxies when comparing with the non-active ones, with their stellar masses peaking at . Indeed, they are distributed mostly at the massive end at each morphology bin, except among E and Sab galaxies, where they spread along the full range of masses for this class. In total, 74 per cent of the AGN hosts are above the mean stellar mass distribution. For Type I the effect is stronger, with 90 per cent above the mean value, although 67 per cent of Type-II are also above the mean. This behavior is similar regarding the central stellar mass surface density (), with 80 per cent of the AGN hosts above the mean value, hence more centrally peaked, with a mean value of .
The main trend of the concentration index (R90/R50) follows an anti-correlation from late to early-to-late type galaxies (with higher values for the later ones). The mean value for the AGN hosts is 2.6, identical the value found to separate early from late-types (e.g. Shimasaku et al., 2001; Strateva et al., 2001). This means that the AGN hosts are also in between classes regarding the concentration index too.
Regarding the ratio within the effective radius (lower-right panel in Figure 4), galaxies in general follows the expected trend. Early-type galaxies, supported in average by disordered motions (pressure), present smaller values of this ratio. Conversely, later-type ones (up to Sd/Sdm) present larger and large values (e.g. Cappellari, 2016; Blanton & Moustakas, 2009). AGN hosts follow the main distribution too. Conversely, they are confined to morphological types with a substantial fraction of the hot/warm orbits (Zhu et al., 2018b, a).
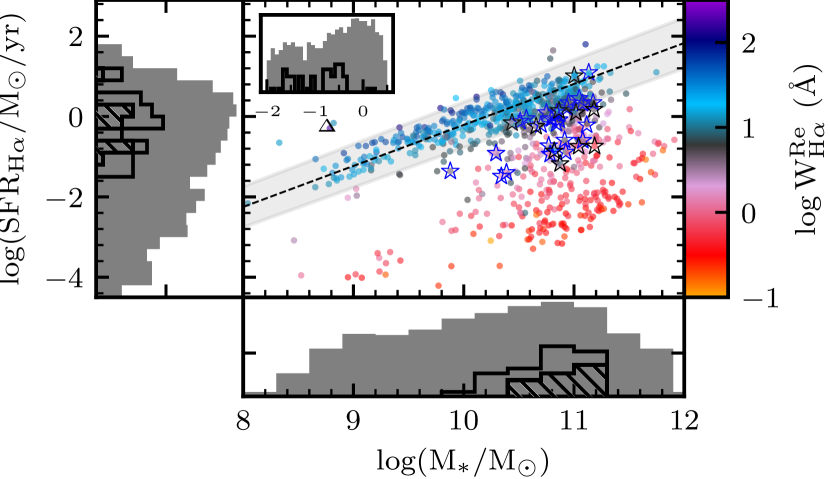
4.1.3 The integrated SFR-M⋆ diagram
Figure 5 shows the distribution of the SFR along the M⋆ for the galaxies in our sample. The distribution shows the bimodal behavior already discussed in previous articles (e.g. Brinchmann et al., 2004; Daddi et al., 2007; Salim et al., 2007; Renzini & Peng, 2015), with two sequences, one for SFGs (the so-called star-formation main sequence, SFMS), and another one for RGs. The number of galaxies in between these two sequences is very scarce, being larger for more massive galaxies than for less massive ones. Spectral energy distribution (SED) fit including UV-to-IR theoretical models unveil that our current derivation of the SFR for RGs (i.e., at very low SFRs) is overestimated (Bitsakis et al., 2019). López Fernández et al. (2016) achieved the same conclusion using the stellar synthesis code starlight (Cid Fernandes et al., 2005) updated for UV photometric data. Despite all uncertainties in the process, the H hDIG decontamination implemented here should correct somehow this overestimation. In any case, its effect would be to decrease the bimodality, pushing up RGs in this diagram towards the loci of SFGs.
Moreover, the left-panel of Figure 5 presents an orthogonal distance regression (ODR) for the SFGs with the filled area representing interval. This regression minimizes the orthogonal distance from each point to the average distribution fitted by a model, in this case, a linear one. The same process is performed for all regressions along this article. The process takes into account the errors in both parameters. As indicated in Section 4.1, apart of the differences in the selection of SFGs (since we define a GVG class in between the RG and SFG classes), a bigger sample with a different regression method leads to distinct derived slope and zero-point comparing with recent results (e.g. Cano-Díaz et al., 2016). Our best-fit values for the SFMS is:
| (2) |
The dispersion in the fit is dex and the one projected to the SFR-axis is 0.22 dex and the Spearman’s Rank correlation coefficient for the distribution is .
Concerning present-day optical AGN hosts, they occupy mostly the right side of the plane, in the region between both sequences. This suggests that the AGN have an important role in the SF quench. The position of the AGN hosts in the SFR- diagram was reported before by Shimizu et al. (2015), Cano-Díaz et al. (2016) and confirmed by Smith et al. (2016), Catalán-Torrecilla et al. (2017) and S18. We find both AGN types located most frequently under the SFMS, at the high-mass end of the this relation. Type-I hosts are mostly concentrated at the high-mass end of the this relation (as we see also in the Figure 4), however they are distributed along a interval in SFR similar to that for Type-II hosts. This result appears to contradict somehow the one reported by S18 in their MaNGA study. They found that the Type-I are more concentrated in the low-end of the SFMS, and the Type-II are more spread between the low-end of the SFMS and the high-end of the RGs region of the plot. We compute the distance (in log) of each galaxy in the plot to the SFMS, i.e. the SFR that they should have if they were average SFGs, as seen in the inset plot at left-panel of Figure 5. They appear to populate the same range of values with the same scatter, with Type-II going a little bit down towards the RGs region. Moreover, only two AGN hosts are above the SFMS, NGC 1667 (Type-II AGN host) and NGC 7469 (Type-I AGN host). The reason could be that both of them are face-on galaxies with a very blue disk. Furthermore, they are considered strong AGNs in our sample (W > 10 Å) and also both exhibit high W (above 20 Å).
We repeat the same procedure adopted for the analysis of the CMD and remove the central regions of the datacubes to minimize any possible bias in the position of AGN hosts due to a contamination by the AGN itselft. As previously reported by Catalán-Torrecilla et al. (2015), for Type-II AGN hosts this contamination can be neglected when comparing with the integrated H luminosity. S18 also reported that this conclusion can be extended for the Type-I hosts, indicating that the AGN hosts are indeed in this intermediate region of the SFR- plane, between the SFG and the RG, irrespective of the possible contamination of the AGN. We can indeed quantify the offset introduced by this contamination, showing that the mean (stardard deviation) of the SFR changes by 0.03 (0.03) dex for the full sample, 0.06 (0.04) dex for the Type-II AGN hosts and 0.07 (0.03) dex for the Type-I hosts. Indeed, this is well below the typical expected error for these values.
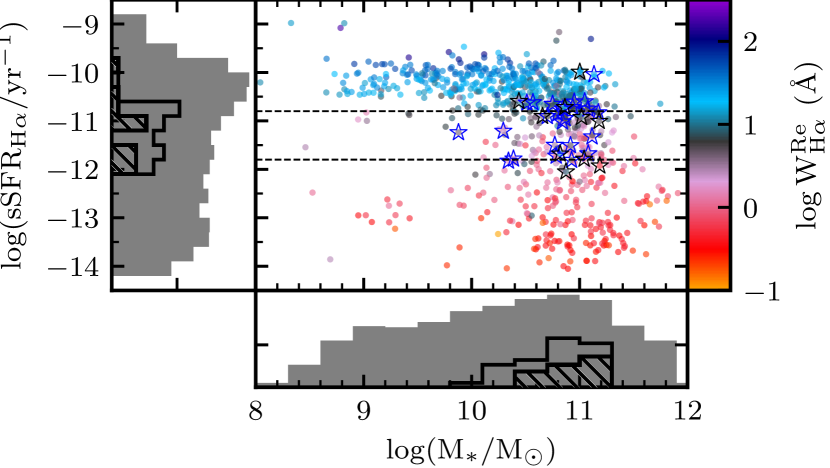
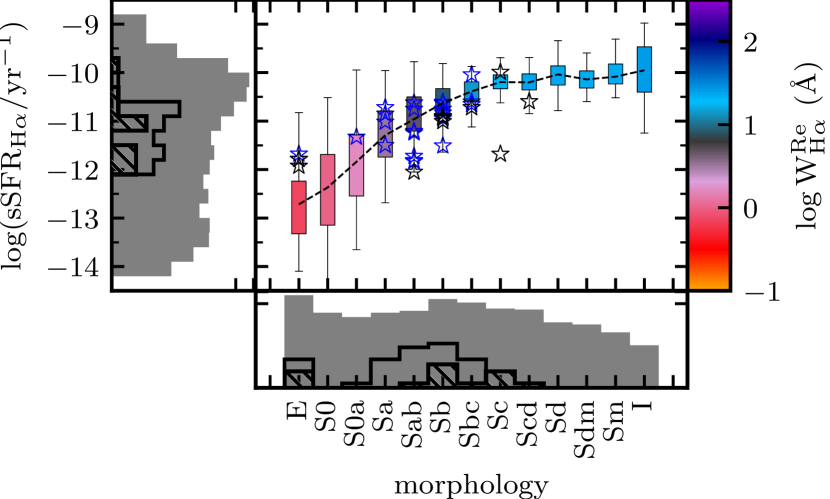
The Right-panel of Figure 5 shows the distribution of sSFR along M⋆, highlighting exactly this behavior. At high-mass, the sSFR can differentiate better galaxies that have stopped its SF from those that are still actively forming stars than the diagrams shown in previous sections. One more time, AGN hosts are in the region in between (high-mass with lower sSFR) following the colors in the plot, suggesting that the nuclear activity should play a role in halting the SF from the host galaxy. Moreover, high values of sSFR are populated by low (B/T)⋆ galaxies and the sequence of dominance of bulge in stellar mass grows as the sSFR decreases, with AGNs present in between them.
4.1.4 Stellar Mass-Age relation
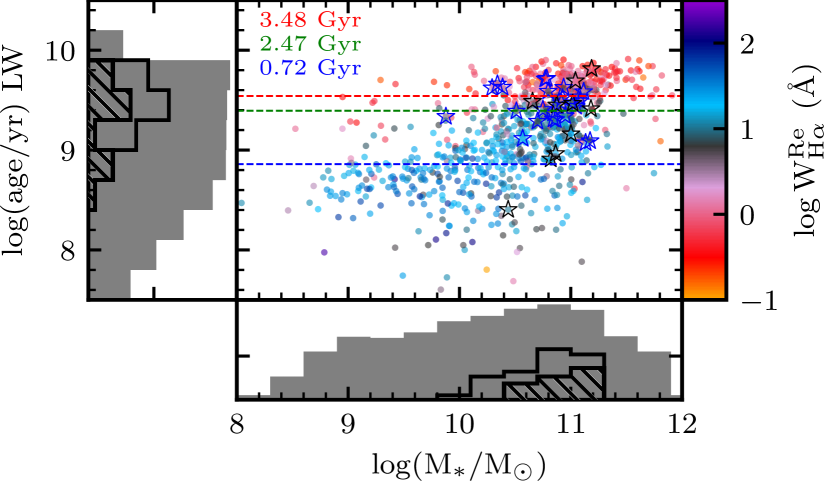
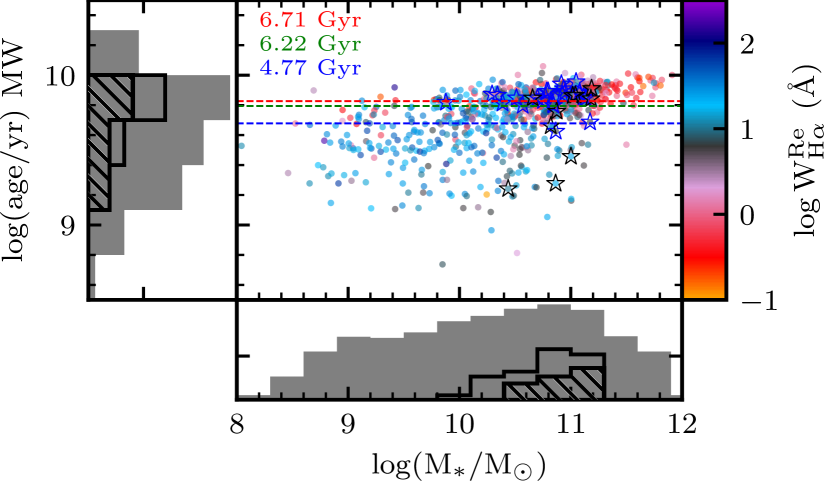
In Figure 6 we show the distributions along stellar mass of the luminosity weighted (LW, left-panel) and mass-weighted (MW, right-panel) mean stellar age evaluated at the effective radius. Ages are derived based on the stellar population synthesis described in Section 3.1. Furthermore, we calculate the mean age for SFGs (blue dashed line), RGs (red dashed line) and AGN hosts (green dashed line), respectively. The evolution of the distribution is evident to the eye. In both panels, the AGN host population has mean stellar ages in between SFGs and RGs. The LW mean stellar age highlights better the young population, which are dominant in light. But the old population is predominant in number (and mass), so in the MW version, the old stars are dominating the average. With this analysis we can conclude that the predominant stellar population in AGN hosts galaxies is old, since the MW mean stellar age is close to that of the RGs and with an intermediate young stellar population. We see a very good agreement with hyphothesis that the AGN phase is part of an evolutive sequence in between both dominant behaviors (star-forming and retired classes). This result totally agrees with the one derived from the exploration of the SFR-M⋆ diagram, being based on an independent analysis.
In this regards it is important to compare the time required for a galaxy to evolve from SF to retired (using the age difference of the stellar populations as a proxy) with the known life-time of the nuclear activity. Studies on AGN life-time agree that it lasts between to years, depending what is consider to constrain the AGN activity (ratio between the number of RG/GV/SFG populations, period of X-ray being emitted by a central event, length of radio jets, statistics in function of redshift, etc). Tadhunter et al. (2012) studied a dual radio-loud/radio-quiet AGN system. Through the assumption that both AGN were triggered at same time by a major galaxy merge, they observe radio emission from hot spots away from the nucleus even not observing emission from the narrow-line region of one of the AGNs. Deriving the life-time of the radio emission episode, they conclude that the AGN may be switched in the last yr. More recent, Stasińska et al. (2015) using statistical arguments regarding the local (z < 0.4) population of galaxies with a detectable AGN and with M⋆ > M⊙ proposed an upper-limit for the AGN life-time of about 1-5 Gyr. From a sample of AGN hosts with X-ray observations, Schawinski et al. (2015) conclude that the AGN duty-cicle is composed by a sequence of various short-lived ( yr) processes of mass being accreated to the galaxy centre (feeding the BH).
Being various rapid processes or a long one, the observed time of an AGN is various orders of magnitude shorter that the Hubble time, so this kind of process is not present during all the galaxy life-time (if nuclear activity is present in all galaxies). On the other hand, we find that the stellar population of AGN hosts are in average 1 Gyr younger than RG galaxies and about 2 Gyr older than SFG regarding LW mean stellar age. This interval between RG and AGN hosts decreases when adopting the MW stellar ages, but the outcome is the same. S18 did the same exploration using data of the MaNGA survey. Despite of the quantitative differences in the mean stellar ages for different classes we reach the same qualitative conclusions. We attribute the quantitative differences mainly to different spatial resolution and redshift range covered by the CALIFA and MaNGA samples.
As indicated before the population of AGN hosts are concentrated among the GVGs, but they comprise only 10 per cent of all these galaxies. So, either the nuclear activity of the other 90 per cent of GVG is too weak for our detection criteria or the differences in the time-scales between the halting of the SF and the AGN activity is of a factor 10 larger (i.e., only 1/10th of GVGs would be seen in the AGN period).
4.1.5 Mass-Metallicity Relation
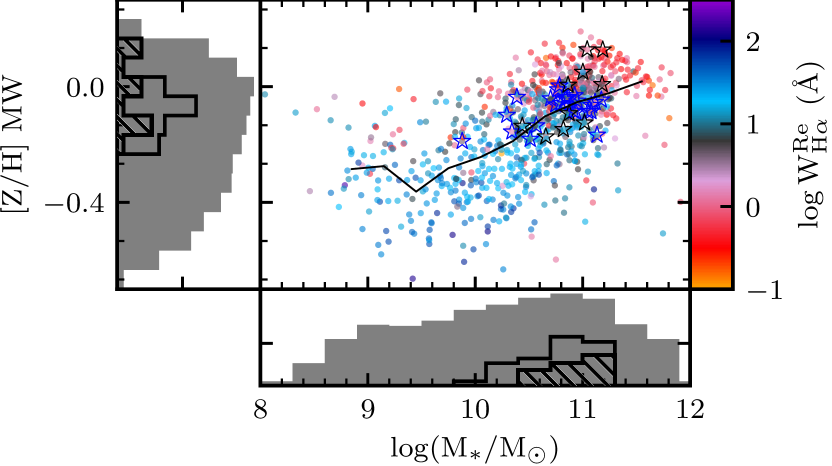
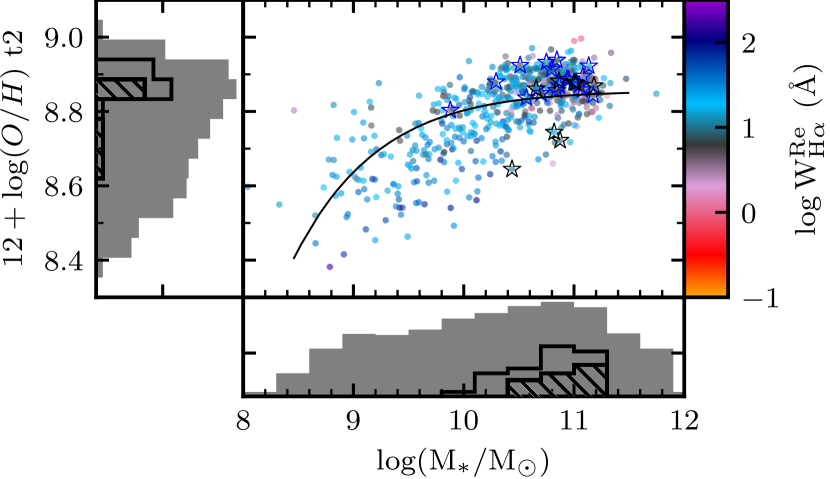
The left-panel of Figure 7 shows the distribution of the MW stellar metallicity at the effective radius versus the stellar mass for all sample. The clear correlation seen in the plot is known as the stellar mass-metallicity relation (MZR; Gallazzi et al., 2005; Vale Asari et al., 2009; González Delgado et al., 2014b). Like in the case of the stellar ages, metallicities are derived based on the stellar population analysis described in Section 3.1. The stellar MZR is steeper than the nebular one, for the same reasons that we obtain flatter stellar metallicity profiles when averaging only over young stars (González Delgado et al., 2014b). The AGN hosts are concentrated in the high-mass, high-metallicity corner of the distribution, and mostly (60 per cent) above the mean distribution. This result holds for both Type-I and Type-II AGN hosts.
At the right-panel of Figure 7 we show the gas-phase version of the MZR for the 587 galaxies with emission lines detected fulfilling the criteria to derive the oxygen abundance at the effective radius following (Sánchez et al., 2014) and successive studies (e.g. Sánchez-Menguiano et al., 2016; Sánchez et al., 2017; Barrera-Ballesteros et al., 2017). The adopted proxy for nebular metallicity is the -calibrator for the oxygen abundance (O/H), although similar qualitative results are found when adopting any other strong-line calibrator (e.g. Sánchez et al., 2017). We derived the best fitted MZR using the formula described in Sánchez et al. (2013) (included in the left-panel of Figure 7). Of the total number of AGNs, 25 are present in this plot and 21 (84 per cent) of them are above the mean distribution. All but one Type-II are above the mean distribution, and 5 out of 8 Type-I too.
For the AGN hosts, the main distribution along the MZR diagram seems to follow a different trend than the one found by S18 for the MaNGA galaxies. There AGN hosts were found mostly under the mean trend for the entire sample. Assuming that we have the same drawbacks in measuring metallicity of AGN hosts, the differences in mass and redshift range of the samples appear to be the main reason. MaNGA samples a slightly wider range of stellar masses, in particular covering a mass range that goes up to . Due to the redshift cut of the CALIFA sample, it is difficult to include such massive galaxies (that are very limited in number at low redshift). A detail inspection of the right panel of the Figure 6 in S18 tell us that the AGN fraction tops at very high stellar masses, and all AGN hosts above have estimated oxygen abundances below the mean value. Once removed those massive AGN hosts, not observed by CALIFA, both results are pretty consistent.
Moreover, metallicity increases as the Universe evolves. Thus higher-redshift galaxies (e.g., MaNGA) present a slightly lower metallicity (see Figure 6 in Lara-López et al. 2013 and also Figure 1 in Zahid et al. 2014). Thus, there is an anticorrelation between the mean oxygen abundance (at a fixed stellar mass) and the redshift. Indeed, we found that the median redshift for the AGN hosts is lower than for non-active galaxies at this mass range, what may give a possible explanation for the observed (aparent) discrepancy with previous results (e.g. S18).
Looking from another perspective, Thomas et al. (2019) found a systematic positive offset in the oxygen abundances for Seyfert galaxies in comparison to SFGs from the SDSS DR7. They inspect many possible methodological causes that could artificially create this offset. However, they did not not reach a denifitive conclusion. Nevertheless, they proposed that top-heavy IMFs in the accretion-disk may produce an increase in abundance. The offset found in our study is much smaller. Selecting galaxies with stellar masses above , we find the AGN hosts to be just 0.01 dex above the mean value and about 0.03 dex above the corresponding value for SFGs in the same mass range. Those differences are far too small compared with the accepted errors for oxygen abundance calibrators.
In summary, regarding the MZR, and in particular the stellar one, AGN hosts seem to be in the transition between the location of SFGs and RGs in this diagram. Again, this reinforces the results from previous sections suggesting that AGNs are somehow connected with the quenching process.
4.1.6 The gas content in AGN hosts
So far all our results have made clear that the AGN hosts are mostly transitional objects (GVG) with integrated properties in between those of SFGs and RGs. However, this does not clarify which is the mechanism required to halt the SF nor if it is an unique process. We already indicated that the main mechanisms proposed for quenching involves either removal or heating of the molecular gas. We explore in this section the gas content on galaxies and its connection with the presence of an AGN.
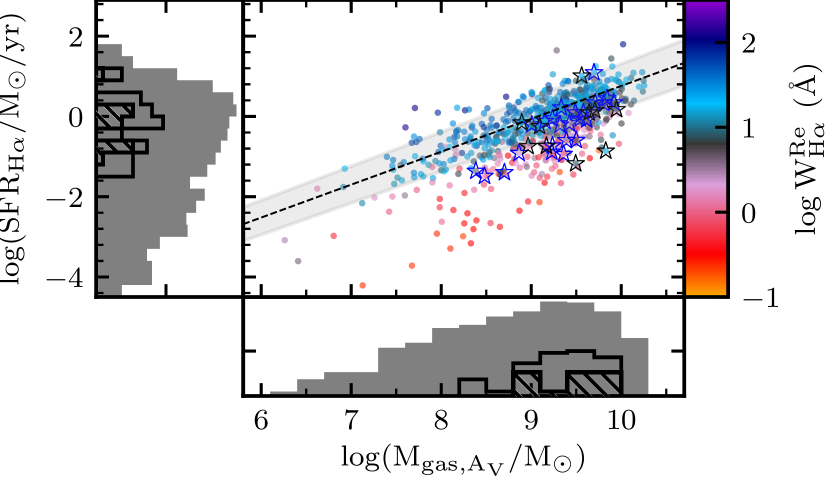
Figure 8 left-panel shows the scaling relation between molecular gas and SFR, an integrated version of the SK-law/relation (Schmidt, 1959; Kennicutt, 1998). The SK-law was originally defined only for SFGs, and using intensive quantities (surface densities) of the involved parameters. The in the original SK-law is referred as the total gas surface density ( plus ), but here we parametrize our relation only in terms of the molecular gas, which traces the SFR better than the total gas (e.g. Wong & Blitz, 2002; Bigiel et al., 2008). There is a clear tight relation that tell us that the SFR is directly proportional to the surface density of the molecular gas. This relation holds to kpc-scales regarding the molecular gas as a manifestation of the spatial and time averaging of local physical processes (e.g. Kennicutt & Evans, 2012). The slope of the SK-law ranges from 1 to 3 in the literature (e.g. Gao & Solomon 2004; Bigiel et al. 2008; Narayanan et al. 2012; Leroy et al. 2013; S18) , being 1.4 the nominal one derived by Kennicutt (1998) for starburst galaxies. Those values are in agreement to the physically motivated range, that goes from 0.7 to 2 depending of the considered densities, timescales and physical details of the SF process (Bigiel et al., 2008). Quantitative differences in the derived slopes in the literature are attributed to resolution of the data, adopted IMF, considered gas (total or molecular) probed by different tracers and conversion factors (e.g. CO, HCN, dust-to-gas ratio), and differences in the SFR tracers (e.g., H, IR, UV, multi-SSP or multi-wavelenght analysis) (Sánchez et al. submitted).
Comparing with the values derived by S18, we have differences in the apertures for which we derive the SFR and Mgas, a higher value of WHα adopted to select SFGs and a different method to perform the regression. We find a very tight correlation () with a steeper slope for the SFGs. The best fit using the ODR method to the data is:
| (3) |
with dispersions dex and dex. For the entire sample, the relation is steeper but less concentrated (the slope is 0.93, the zero point, , dex, , ) that the one reported by S18. The bimodal behaviour observed in most of the previous analysed diagrams (CMD, SFR-M⋆, age-M⋆), but not in all of them (MZR), is not so prominent in here neither. There is an offset in the SFR between SFG and RG at a given Mgas, that increases for M M⊙, a result that was not found by S18 too. As we explain in Section 4.1.3, our hDIG-corrected SFRHα results in lower values of SFR for hDIG dominated galaxies, which are mostly RG with low gas fractions. Thus, adding GVGs and RGs to the linear fit of the relation increases the slope, zero-point (as we are adding high galaxies) and the scatter, decreasing the correlation coefficient.
The mean depletion time derived for SFGs is Gyr, a value slightly lower than the one found by recent studies (e.g. 2.2 Gyr, Leroy et al., 2013; Colombo et al., 2018). Comparing the SF activity, the SFGs have on average from 0.6 to 1.9 dex higher SFR than RGs at same molecular gas mass, with differences weakely decreasing while increasing Mgas. Furthermore, to produce the same SFR, RGs needs to have much more molecular gas than SFGs (i.e., the have a lower star-formation efficiency, SFE). Both former results reinforce the idea that SFGs form stars more efficiently. Considering that our estimated SFR for RGs are most probably just upper-limits, the difference in SFE may be even stronger, with RGs have much lower values than what it is reflected in our analysis.
Like in the case of the SFMS, we find here the same AGN hosts (NGC 1667 and NGC 7469) above the best fit for the SK-law derived for SFGs. On average AGN hosts present lower (higher) SFE than SFG (RG): thus, they are again in between both population of galaxies. They exhibit integrated gas masses over M⊙ with M⊙ in average. Therefore they are concentrated in the high-mass end of the plot. Type-I AGN hosts peak at slightly higher masses than Type-II AGN hosts (0.1 dex above in average) with the distribution of Mgas having a similar scatter ( 0.4 dex for both). Whether this is a significant result and points towards a real difference between both families of AGNs should be explored using larger samples.
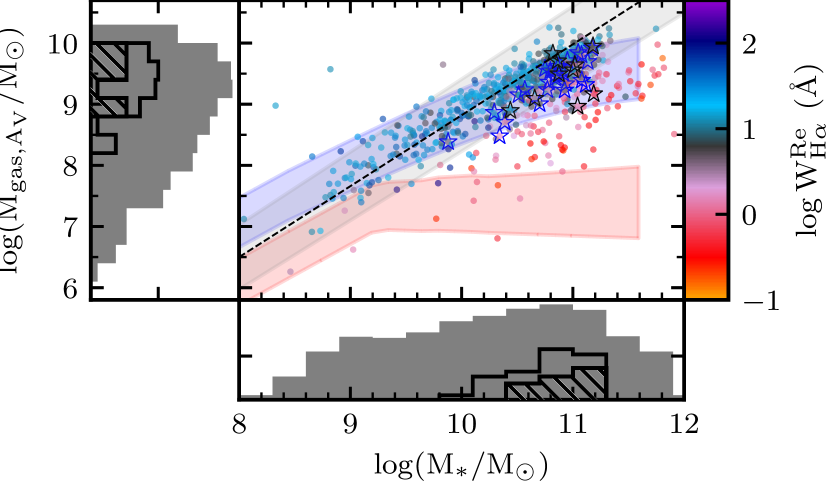
In the right-panel of Figure 8 we see the distribution of the estimated molecular gas mass as a function of the integrated stellar mass. The best-fit using the ODR methods for the SFGs is:
| (4) |
with dex, dex and a correlation coefficient .
The RGs present lower values of Mgas on average and they cover a wider range of values at same stellar mass than SFGs and GVGs. For SFGs we see a clear tight correlation betwenn Mgas and M⋆. This points towards the direction that galaxies that have lower gas fractions are those that form stars at lower rates for corresponding stellar mass. In the same panel we show two curves (red and blue dashed lines) representing a compilation of data from Rodrigues-Puebla et al. (submitted), after correcting for the different adopted IMF. Their molecular Hydrogen masses are derived using CO as a main proxy, taking in account upper limit cases when CO is not detected. This updates the curves over-plotted in Figure 8 from S18 (and also those published by Calette et al. 2018) after a change in the calculated mass functions. The same separation from RGs to SFGs is appreciated when dividing galaxies for morphological types (early- and late-type), with late-type galaxies being significantly gas richer than early-type, in particular at high stellar masses. Our results agree with those ones, showing that RG do not form stars (or form at a really low pace) due to their lack of gas in comparison with SFGs of the same stellar mass. However, as indicated before, there must be another mechanism on top of the lack of gas, since RGs and GVGs have lower SFE. Thus, for a given Mgas they have lower SFRs too.
Only one AGN host is found above our best fit of the distribution, IC 1481. This galaxy, as mentioned before (c.f. Section 3.2.3), is a candidate to be hosting an outflow by the work of López-Cobá et al. 2019, with 43 per cent of its extra-planar spaxels ionized by shocks. However, in the same study, they indicate that 56 per cent of the explored area is probably ionized by an AGN. The qualitative results regarding the AGN hosts are the same reported by S18 for a MaNGA sample. As we see in the upper-left panel of Figure 4, the AGN hosts are at the high-mass end of the stellar-mass distribution. Besides the spread, they are also mostly at the high-mass end of the molecular gas mass distribution too, but usually with less gas than the SFGs at same integrated stellar-mass. One more time suggesting that even having plenty of molecular gas the AGN appears to be acting as a SF strangler of their host galaxies.
5 Discussion
5.1 Comparison with other AGN classification schemes for IFS data
This article uses a similar scheme of AGN hosts identification adopted in S18 for the MPL-5 sample. Comparisons with S18 results are distributed among this entire article. However, recent works did the same job of classifying AGN hosts and it is worth to notice the main differences between the schemes and resulting selections.
Using a similar MPL-5 sample, Wylezalek et al. (2018) identified 303 AGN hosts, a number three time bigger than that of S18. They classify the hosts based in a spaxel-by-spaxel analysis of [NII]/H vs [OIII]/H and [SII]/H vs [OIII]/H, including the equivalent width of H. In addition, they use the distance of those spaxels classified as Seyfert/LINER and the K06 curve in the [SII]/H vs [OIII]/H plane. This type of scrutiny considering all spaxels from a galaxy adds up to the final number of possible AGN hosts some objects that suffer from ionization by outflows and also from recently dimmed (or ’just’ turned off) AGNs. Furthermore, the MaNGA sample includes a color-enhanced subsample in order to balance the colour distribution at a fixed stellar mass. However, this selection also populates the GV with spiral galaxies with a high number of inclined galaxies enhancing the number of detected outflows. This could be visualized in the archetypal galaxies shown in their article, (e.g, Figures 1, 4 and 7 of Wylezalek et al. 2018). The example in their Figure 1 is a clear example of this caveat. Analyzing this galaxy with the same process done by Wylezalek et al. (2018) we also would classify this galaxy as a probable AGN host, but when looking towards the galaxy center, we see a region ionized by star-formation with a textbook biconical outflow that goes towards the outer parts. This is confirmed by the enhance of the ratio between velocity-to-velocity dispersion (v/) parameter in the center and the outflow region. Moreover, when adding the statistics of identifyied outflows by López-Cobá et al. (2019) and removing the overlapped galaxies, the number of identified candidates increases up to 6 per cent of galaxies accounting for shock ionization. Therefore, this effect helps to account for the high number of galaxies identified as harbouring an AGN in this study.
Four recent studies using the same MPL-5 sample identify 62 AGN hosts using the SDSS-III DR12 (Alam et al., 2015) integrated nuclear spectra, that comprises the central region of the select galaxies. Rembold et al. (2017) presents the sample and a study of the nuclear stellar populations with starlight (Cid Fernandes et al., 2005). Their classification is based on the BPT diagram togheter with the WHAN diagram, i.e., less restrictive regarding the hardness of the ionization field (they do not use [S ii]/H and [O i]/H ratios in the classification scheme). Also, they apply the same lower-limit of W for AGN hosts used in this study (3 Å). The emission lines fluxes and equivalent widths measurements utilized in the classification were derived by Thomas et al. (2013). Comparing the AGN sample with a control sample with two non-active galaxies for each active one, they found that in the luminosity of [O iii], L([O iii]), is enhanced in strong luminous AGNs, also identifying an increasing fraction of young stellar populations in the centre of those galaxies hosting strong AGNs and also a decreasing fraction of the older ones. This kind of balance between the old-to-young stellar populations suggests that most luminous AGNs were trigged by a recent supply of molecular gas that produces SF in the circumvent area of the AGN. This support a connection between bulge growth via formation of new stars and the growth of the SMBH via accretion during the AGN phase of activity. For the kinematics, Ilha et al. (2019) find an enhancement in the differences between the velocity dispersion of the gas and the stars for AGN hosts in the central kpc. The cause of this displacement is understand as the gas close to the galaxy centre is being perturbed by outflows ejected from an active nucleus. Indeed some of our AGN hosts present detectable outflows, with one of them also reported by López-Cobá et al. (2019) as a host of an AGN-driven outflow. Other
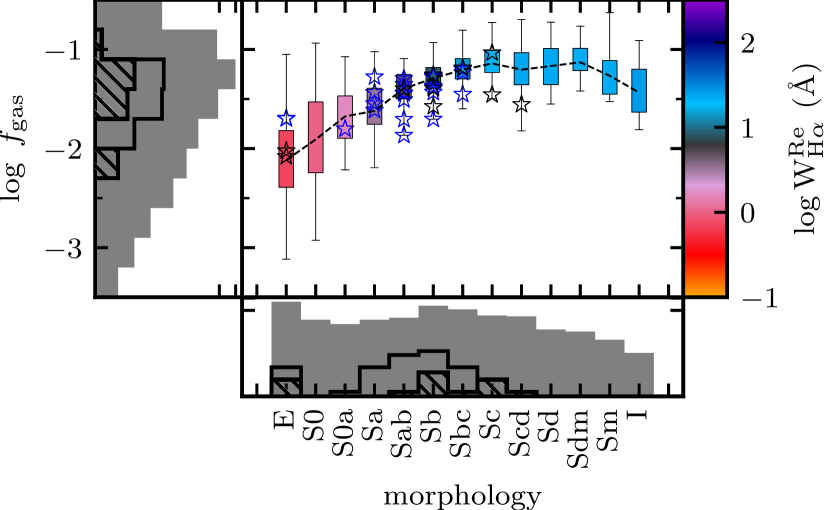
Mallmann et al. (2018) studied the resolved properties of the stellar populations and do Nascimento et al. (2019), the gas excitation and the SFR distribution. Although, the derivation of the gas masses is different, they find that the AGN hosts have higher ionized gas masses, a result which is also reported in S18 and here in Section 4.1.6. In addition, they said that many of the nuclear regions of MPL-5 galaxies would be classified as AGN in a BPT-only scheme, this reaffirms the importance of the inclusion of the WHα in the classification process. The SFR is derived from H which includes ionization other than star-formation, reason why the SFR is not evaluated at the central regions. The average population of galaxy bulges is old and as we said in many parts of this study, the H emission is contamined by diffuse ionization by HOLMES. When an active nucleus is present, the hard AGN ionizing spectrum dominates the H emission, however in very dusty AGNs this effect could be compensated. They observe higher differences in the total SFR between AGNs and the control sample within early-type galaxies. The reason could be that the gas that ignites AGNs in early-type galaxies also ignites some star-formation in their hosts disks. For late-type hosts they also do not see evidence for a SF-quench caused by the AGN. However, both gas and stellar population studies are complementary and support an inside-out quench of the SF in the average population of galaxies. Otherwise, in AGN hosts an outside-in scenario could describe the recent SF. We find no significant difference in the integrated SFR between Type-I and Type-II AGN hosts. This could be explained if both are the same type of AGNs only seen by different angles. In the other hand, the integrated spectra is dominated by the light of the young stars which live in the disks dictating the value of the integrated SFR. Although this study only includes central, effective radii and integrated properties, we find that the difference between W and W is bigger for AGN hosts (10Å) than non-active galaxies (2Å), with this behaviour persisting when dividing by ionization classes (SFG, GVG and RG): for all SFGs the is 3.08Å and 21.87Å for SFG AGN hosts; for GVGs, 4.25Å and 7.44Å for GVG AGN hosts; and for RGs, 0.91Å and 4.07Å for RGs AGN hosts.
| Morph. type | /M | (sSFR | /Gyr) | |
|---|---|---|---|---|
| E | 8.86 | -2.12 | -12.72 | 1.12 |
| S0 | 8.83 | -1.91 | -12.37 | 0.87 |
| S0a | 9.19 | -1.68 | -11.84 | 0.73 |
| Sa | 9.21 | -1.62 | -11.29 | 0.57 |
| Sab | 9.35 | -1.39 | -10.96 | 0.54 |
| Sb | 9.41 | -1.29 | -10.63 | 0.34 |
| Sbc | 9.40 | -1.20 | -10.39 | 0.21 |
| Sc | 9.16 | -1.14 | -10.20 | 0.09 |
| Scd | 8.86 | -1.20 | -10.20 | 0.03 |
| Sd | 8.70 | -1.17 | -10.04 | -0.07 |
| Sdm | 8.71 | -1.13 | -10.14 | 0.05 |
| Sm | 8.34 | -1.26 | -10.08 | -0.15 |
| I | 7.55 | -1.44 | -9.95 | -0.38 |
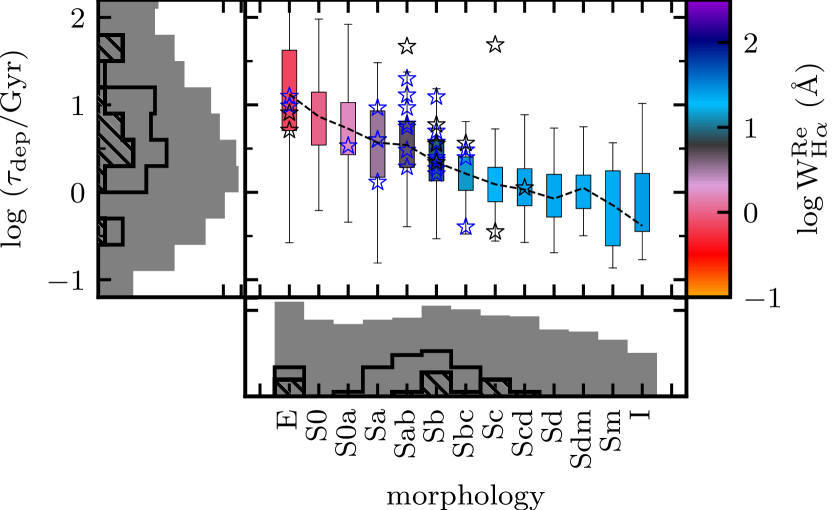
5.2 The AGN and their hosts
The results shown in this study indicate that AGN hosts are mostly located in the transition region between SFGs and RGs, broadly known as the GV. This occurs with basically all the integrated properties explored along this article. In this regards, we confirm previous similar explorations using different samples and observational techniques (e.g. Schawinski et al., 2014, S18). Two possible scenarios have been proposed to explain these results: (i) either the AGN halts the SF due to a removal or heating of the molecular gas, moving galaxies from the SF cloud to the RGs one; or (ii) an already retired galaxy suffers a rejuvenation by the inflow of gas that also feed the AGN (e.g. King, 2005; Gaibler et al., 2012; Rovilos et al., 2012). In both cases the AGN hosts would reside in the transition regime between both populations.
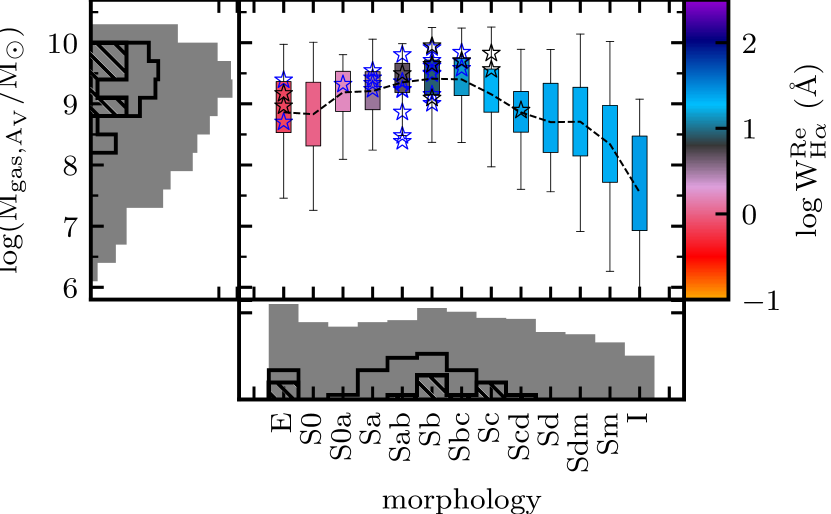
AGN hosts are among the most massive galaxies and those with denser central regions at each morphological class (c.f. lower-left panel of Figure 4). At the same time, compared with SFG, they are the ones with lower SFR and sSFR. Their mean stellar ages indicate that they are usually dominated by old stellar populations. When comparing their ages with those of SFGs and RGs, it seems that the AGN phase last 1-3 Gyr. In general it seems that the removal of molecular gas is the main effect of the presence of an AGN (either physical removal or heated preventing to form molecular gas). This is more clearly seen by a morphological segregation explored in Figure 9 and summarized in Table 3. In this figure we present the distribution of the integrated Mgas, gas fraction ( = ), sSFR, and along the morphological type of galaxies. Exploring the properties of galaxies from late-to-early types, AGN hosts are mostly found in the peak of the estimated mean gas mass, gas fraction, and sSFR. Conversely, the molecular gas depletion time shows a smooth decline from early-to-late types, with AGN hosts following the same average sequence. From that, AGN activity and bulge growth appear to work concomitantly since the molecular gas fraction starts to decrease when AGN ignites and increasing with morphology (e.g. Cheung et al., 2012; Mancini et al., 2015). Although most late-type galaxies have less gas mass, when normalizing it by the sum of stellar and molecular gas masses, their gas fraction is high and mostly constant till the Sbc galaxies, making those galaxies the ones with high sSFR and highest efficiency to form stars. The early-types are scant of gas in absolute and relative values, with almost no SF and with high (low SFE).
As mentioned in Section 4.1.3, we inspect the offset in SFR, (SFR), with respect to the SFMS for each galaxy along its stellar mass (following, Elbaz et al., 2007; Bitsakis et al., 2019) in order to infer how AGNs affects the SF in galaxies. Regarding this parameter, the scatter for the SFGs (that is almost zero by construction) appears to be independent of the gas fraction. However, for GVGs and RGs the gas fraction seems to have an influence in (SFR), affecting more those galaxies in the transition from GVG to RG. At the same gas fraction AGN hosts are the more distant from the SFMS, with not much difference between Type-I and II. As was foreshadowed by the lower-right panel of Figure 9, the influence of the AGN lowering the SFE appears to not be the main driver of the quenching. On the other hand, the AGN presence helps to heat/expel the molecular gas (c.f. upper-left panel of Figure 9), or at least AGN hosts clearly show a deficit of this gas. The conclusions here point in the same direction suggested by S18, where a mixed scenario of quenching exists: (i) an AGN feedback quenching, where the AGN injects energy heating the cold gas and also decreasing its reservoir; and (ii) a morphological quenching, where the growth of the bulge helps to increase the depletion time of the molecular gas.
6 Summary
We explore the presence of AGNs in a sample of 867 galaxies in the nearby universe (z0.04) extracted from the CALIFA survey. In order to characterize which galaxies host an AGN in comparison with the non active ones, we analyse the IFS data using Pipe3D to derive the properties of the underlying stellar population and the ionized gas. From the derived dataproducts we found the following results:
-
1.
We classify our galaxies regarding their SF stage using the equivalent width of H at effective radius (W), comprising 382 SFGs, 185 GVGs and 300 RGs.
-
2.
Using the information provided by the emission line ratios and the WHα in the central region of the analysed galaxies we found 34 AGN host candidates, 10 of them classified as Type-I and 24 Type-II. They are distributed in morphology from E to Sc galaxies with a predilection to Sab+Sb galaxies. Type-I hosts are more concentrated in late-type galaxies apart from 2 found in elliptical ones, while Type-II are distributed along all morphological classes.
-
3.
Regarding the stellar properties, the AGN hosts are in the range of the most massive and centrally peaked (in stellar mass density) ones with respect to their non-active counterparts. They were found in GV-like locations in all analysed diagrams that present a bimodality in their values.
-
4.
Considering that morphology could represent a pathway for the history of galaxy evolution (from late to early-types), AGN hosts start to appear in morphological classes that present the higher molecular gas masses, and decreases with the smooth turn-down observed toward early-types. This change of behaviour could also be seen in the molecular gas fraction and the sSFR, but not in the depletion time (or SFE). Therefore, the AGN appear to have an important role in decreasing the molecular gas-fraction of their hosts but not in lowering the SFE (that seems to be more clearly related with morphology).
All these results indicate that AGN observed in galaxies at the transition phase between SFGs and RGs. If there is a causal connection, it is still not clear. However, our results points towards in a mixed scenario where AGN feedback and growth of the bulge act toghether in order to first quench (by removing or heating the molecular gas) and then prevent (by decreasing the SFE) their hosts SF.
7 Acknowledgements
We thanks CONACYT FC-2016-01-1916 and CB-285080 projects and PAPIIT IN100519 project for support on this study. L.G. was funded by the European Union’s Horizon 2020 research and innovation programme under the Marie Skłodowska-Curie grant agreement No. 839090. EADL thanks all Stellar Population Synthesis and Chemical Evolution group of the Instituto de Astronomía UNAM for the help through the by-eye morphological classification.
References
- Abazajian et al. (2009) Abazajian K. N., et al., 2009, ApJS, 182, 543
- Alam et al. (2015) Alam S., et al., 2015, ApJS, 219, 12
- Baldry et al. (2004) Baldry I. K., Glazebrook K., Brinkmann J., Ivezić Ž., Lupton R. H., Nichol R. C., Szalay A. S., 2004, ApJ, 600, 681
- Baldwin et al. (1981) Baldwin J. A., Phillips M. M., Terlevich R., 1981, PASP, 93, 5
- Barrera-Ballesteros et al. (2017) Barrera-Ballesteros J. K., Sánchez S. F., Heckman T., Blanc G. A., The MaNGA Team 2017, ApJ, 844, 80
- Barrera-Ballesteros et al. (2019) Barrera-Ballesteros J. K., et al., 2019, arXiv e-prints, p. arXiv:1911.09677
- Belfiore et al. (2018) Belfiore F., et al., 2018, MNRAS, 477, 3014
- Bell & de Jong (2001) Bell E. F., de Jong R. S., 2001, ApJ, 550, 212
- Bell et al. (2004) Bell E. F., et al., 2004, ApJ, 608, 752
- Benn et al. (1998) Benn C. R., Vigotti M., Carballo R., Gonzalez-Serrano J. I., Sánchez S. F., 1998, MNRAS, 295, 451
- Bigiel et al. (2008) Bigiel F., Leroy A., Walter F., Brinks E., de Blok W. J. G., Madore B., Thornley M. D., 2008, AJ, 136, 2846
- Binette et al. (1994) Binette L., Magris C. G., Stasińska G., Bruzual A. G., 1994, A&A, 292, 13
- Bitsakis et al. (2019) Bitsakis T., et al., 2019, MNRAS, 483, 370
- Bland-Hawthorn et al. (2007) Bland-Hawthorn J., Veilleux S., Cecil G., 2007, Astrophysics and Space Science, 311, 87
- Blanton & Moustakas (2009) Blanton M. R., Moustakas J., 2009, ARA&A, 47, 159
- Bluck et al. (2019) Bluck A. F. L., et al., 2019, MNRAS, 485, 666
- Bohlin et al. (1978) Bohlin R. C., Savage B. D., Drake J. F., 1978, The Astrophysical Journal, 224, 132
- Bolatto et al. (2017) Bolatto A. D., et al., 2017, The Astrophysical Journal, 846, 159
- Bower et al. (2006) Bower R. G., Benson A. J., Malbon R., Helly J. C., Frenk C. S., Baugh C. M., Cole S., Lacey C. G., 2006, MNRAS, 370, 645
- Brinchmann et al. (2004) Brinchmann J., Charlot S., White S. D. M., Tremonti C., Kauffmann G., Heckman T., Brinkmann J., 2004, MNRAS, 351, 1151
- Brinchmann et al. (2013) Brinchmann J., Charlot S., Kauffmann G., Heckman T., White S. D. M., Tremonti C., 2013, Monthly Notices of the Royal Astronomical Society, 432, 2112
- Bundy et al. (2015) Bundy K., et al., 2015, ApJ, 798, 7
- Buttiglione et al. (2010) Buttiglione S., Capetti A., Celotti A., Axon D. J., Chiaberge M., Macchetto F. D., Sparks W. B., 2010, A&A, 509, A6
- Calette et al. (2018) Calette A. R., Avila-Reese V., Rodríguez-Puebla A., Hernández-Toledo H., Papastergis E., 2018, Rev. Mex. Astron. Astrofis., 54, 443
- Cano-Díaz et al. (2016) Cano-Díaz M., et al., 2016, ApJ, 821, L26
- Cano-Díaz et al. (2019) Cano-Díaz M., Ávila-Reese V., Sánchez S. F., Hernández-Toledo H. M., Rodríguez-Puebla A., Boquien M., Ibarra-Medel H., 2019, MNRAS, p. 1830
- Cappellari (2013) Cappellari M., 2013, ApJ, 778, L2
- Cappellari (2016) Cappellari M., 2016, ARA&A, 54, 597
- Cardelli et al. (1989) Cardelli J. A., Clayton G. C., Mathis J. S., 1989, ApJ, 345, 245
- Casado et al. (2015) Casado J., Ascasibar Y., Gavilán M., Terlevich R., Terlevich E., Hoyos C., Díaz A. I., 2015, Monthly Notices of the Royal Astronomical Society, 451, 888
- Catalán-Torrecilla et al. (2015) Catalán-Torrecilla C., et al., 2015, A&A, 584, A87
- Catalán-Torrecilla et al. (2017) Catalán-Torrecilla C., et al., 2017, ApJ, 848, 87
- Cheung et al. (2012) Cheung E., et al., 2012, ApJ, 760, 131
- Cid Fernandes et al. (2005) Cid Fernandes R., Mateus A., Sodré L., Stasińska G., Gomes J. M., 2005, MNRAS, 358, 363
- Cid Fernandes et al. (2010) Cid Fernandes R., Stasińska G., Schlickmann M. S., Mateus A., Vale Asari N., Schoenell W., Sodré L., 2010, MNRAS, 403, 1036
- Cid Fernandes et al. (2011) Cid Fernandes R., Stasińska G., Mateus A., Vale Asari N., 2011, MNRAS, 413, 1687
- Cid Fernandes et al. (2013) Cid Fernandes R., et al., 2013, A&A, 557, A86
- Colombo et al. (2018) Colombo D., et al., 2018, MNRAS, 475, 1791
- Croton et al. (2006) Croton D. J., et al., 2006, MNRAS, 365, 11
- Daddi et al. (2007) Daddi E., et al., 2007, ApJ, 670, 156
- Di Matteo et al. (2005) Di Matteo T., Springel V., Hernquist L., 2005, Nature, 433, 604
- Dickman (1978) Dickman R. L., 1978, The Astrophysical Journal Supplement Series, 37, 407
- Elbaz et al. (2007) Elbaz D., et al., 2007, A&A, 468, 33
- Ellison et al. (2018) Ellison S. L., Sánchez S. F., Ibarra-Medel H., Antonio B., Mendel J. T., Barrera-Ballesteros J., 2018, MNRAS, 474, 2039
- Faber et al. (2007) Faber S. M., et al., 2007, ApJ, 665, 265
- Fabian (2012) Fabian A. C., 2012, ARA&A, 50, 455
- Ferrarese & Merritt (2000) Ferrarese L., Merritt D., 2000, ApJ, 539, L9
- Flores-Fajardo et al. (2011) Flores-Fajardo N., Morisset C., Stasińska G., Binette L., 2011, MNRAS, 415, 2182
- Gaibler et al. (2012) Gaibler V., Khochfar S., Krause M., Silk J., 2012, MNRAS, 425, 438
- Galbany et al. (2017) Galbany L., et al., 2017, MNRAS, 468, 628
- Galbany et al. (2018) Galbany L., et al., 2018, ApJ, 855, 107
- Gallazzi et al. (2005) Gallazzi A., Charlot S., Brinchmann J., White S. D. M., Tremonti C. A., 2005, MNRAS, 362, 41
- Gallazzi et al. (2008) Gallazzi A., Brinchmann J., Charlot S., White S. D. M., 2008, MNRAS, 383, 1439
- Gao & Solomon (2004) Gao Y., Solomon P. M., 2004, ApJ, 606, 271
- Gebhardt et al. (2000) Gebhardt K., et al., 2000, ApJ, 539, L13
- Gomes et al. (2016) Gomes J. M., et al., 2016, A&A, 585, A92
- González Delgado et al. (2014a) González Delgado R. M., et al., 2014a, A&A, 562, A47
- González Delgado et al. (2014b) González Delgado R. M., et al., 2014b, ApJ, 791, L16
- González Delgado et al. (2016) González Delgado R. M., et al., 2016, A&A, 590, A44
- Greene et al. (2008) Greene J. E., Ho L. C., Barth A. J., 2008, ApJ, 688, 159
- Greene et al. (2010) Greene J. E., et al., 2010, ApJ, 721, 26
- Hickox & Alexander (2018) Hickox R. C., Alexander D. M., 2018, ARA&A, 56, 625
- Hopkins et al. (2010) Hopkins P. F., et al., 2010, ApJ, 715, 202
- Ibarra-Medel et al. (2019) Ibarra-Medel H. J., Avila-Reese V., Sánchez S. F., González-Samaniego A., Rodríguez-Puebla A., 2019, MNRAS, 483, 4525
- Ilha et al. (2019) Ilha G. S., et al., 2019, MNRAS, 484, 252
- Jahnke et al. (2004a) Jahnke K., Kuhlbrodt B., Wisotzki L., 2004a, MNRAS, 352, 399
- Jahnke et al. (2004b) Jahnke K., et al., 2004b, ApJ, 614, 568
- Kauffmann & Haehnelt (2000) Kauffmann G., Haehnelt M., 2000, MNRAS, 311, 576
- Kauffmann et al. (2003a) Kauffmann G., et al., 2003a, MNRAS, 341, 33
- Kauffmann et al. (2003b) Kauffmann G., et al., 2003b, MNRAS, 346, 1055
- Kauffmann et al. (2007) Kauffmann G., et al., 2007, ApJS, 173, 357
- Kelz et al. (2006) Kelz A., et al., 2006, Publications of the Astronomical Society of the Pacific, 118, 129
- Kennicutt (1998) Kennicutt Jr. R. C., 1998, ARA&A, 36, 189
- Kennicutt & Evans (2012) Kennicutt R. C., Evans N. J., 2012, Annual Review of Astronomy and Astrophysics, 50, 531
- Kennicutt et al. (2007) Kennicutt Robert C. J., et al., 2007, The Astrophysical Journal, 671, 333
- Kewley et al. (2001) Kewley L. J., Dopita M. A., Sutherland R. S., Heisler C. A., Trevena J., 2001, ApJ, 556, 121
- Kewley et al. (2006) Kewley L. J., Groves B., Kauffmann G., Heckman T., 2006, MNRAS, 372, 961
- King (2005) King A., 2005, ApJ, 635, L121
- Kormendy & Ho (2013) Kormendy J., Ho L. C., 2013, ARA&A, 51, 511
- Kormendy & Richstone (1995) Kormendy J., Richstone D., 1995, ARA&A, 33, 581
- Krumholz et al. (2012) Krumholz M. R., Dekel A., McKee C. F., 2012, ApJ, 745, 69
- Lacerda et al. (2018) Lacerda E. A. D., et al., 2018, MNRAS, 474, 3727
- Lacey et al. (2016) Lacey C. G., et al., 2016, MNRAS, 462, 3854
- Lara-López et al. (2013) Lara-López M. A., et al., 2013, MNRAS, 434, 451
- Leroy et al. (2013) Leroy A. K., et al., 2013, AJ, 146, 19
- Lin et al. (2019) Lin L., et al., 2019, ApJ, 872, 50
- López-Cobá et al. (2017) López-Cobá C., et al., 2017, MNRAS, 467, 4951
- López-Cobá et al. (2019) López-Cobá C., Sánchez S. F., Bland-Hawthorn J., Moiseev A. V., Cruz-González I., García-Benito R., Barrera-Ballesteros J. K., Galbany L., 2019, MNRAS, 482, 4032
- López Fernández et al. (2016) López Fernández R., et al., 2016, MNRAS, 458, 184
- Mallmann et al. (2018) Mallmann N. D., et al., 2018, MNRAS, 478, 5491
- Mancini et al. (2015) Mancini C., Renzini A., Daddi E., Rodighiero G., Berta S., Grogin N., Kocevski D., Koekemoer A., 2015, MNRAS, 450, 763
- Martig et al. (2009) Martig M., Bournaud F., Teyssier R., Dekel A., 2009, ApJ, 707, 250
- Martin et al. (2007) Martin D. C., et al., 2007, ApJS, 173, 342
- Mast et al. (2014) Mast D., et al., 2014, A&A, 561, A129
- Menezes et al. (2014) Menezes R. B., Steiner J. E., Ricci T. V., 2014, The Astrophysical Journal, 796, L13
- Narayanan et al. (2012) Narayanan D., Krumholz M. R., Ostriker E. C., Hernquist L., 2012, MNRAS, 421, 3127
- Osterbrock (1989) Osterbrock D. E., 1989, Astrophysics of gaseous nebulae and active galactic nuclei. University Science Books
- Pérez et al. (2013) Pérez E., et al., 2013, ApJ, 764, L1
- Peterson & Wandel (2000) Peterson B. M., Wandel A., 2000, ApJ, 540, L13
- Rachford et al. (2009) Rachford B. L., et al., 2009, The Astrophysical Journal Supplement Series, 180, 125
- Rembold et al. (2017) Rembold S. B., et al., 2017, MNRAS, 472, 4382
- Renzini & Peng (2015) Renzini A., Peng Y.-j., 2015, ApJ, 801, L29
- Riffel et al. (2009) Riffel R., Pastoriza M. G., Rodríguez-Ardila A., Bonatto C., 2009, MNRAS, 400, 273
- Roth et al. (2005) Roth M. M., et al., 2005, Publications of the Astronomical Society of the Pacific, 117, 620
- Rovilos et al. (2012) Rovilos E., et al., 2012, A&A, 546, A58
- Saintonge et al. (2016) Saintonge A., et al., 2016, Monthly Notices of the Royal Astronomical Society, 462, 1749
- Salim (2014) Salim S., 2014, Serbian Astronomical Journal, 189, 1
- Salim et al. (2007) Salim S., et al., 2007, ApJS, 173, 267
- Salpeter (1955) Salpeter E. E., 1955, ApJ, 121, 161
- Sánchez & González-Serrano (2003) Sánchez S. F., González-Serrano J. I., 2003, A&A, 406, 435
- Sánchez-Menguiano et al. (2016) Sánchez-Menguiano L., et al., 2016, A&A, 587, A70
- Sánchez-Menguiano et al. (2018) Sánchez-Menguiano L., et al., 2018, A&A, 609, A119
- Sánchez et al. (2004) Sánchez S. F., et al., 2004, ApJ, 614, 586
- Sánchez et al. (2012) Sánchez S. F., et al., 2012, A&A, 546, A2
- Sánchez et al. (2013) Sánchez S. F., et al., 2013, A&A, 554, A58
- Sánchez et al. (2014) Sánchez S. F., et al., 2014, A&A, 563, A49
- Sánchez et al. (2016a) Sánchez S. F., et al., 2016a, Rev. Mex. Astron. Astrofis., 52, 21
- Sánchez et al. (2016b) Sánchez S. F., et al., 2016b, Rev. Mex. Astron. Astrofis., 52, 171
- Sánchez et al. (2016c) Sánchez S. F., et al., 2016c, A&A, 594, A36
- Sánchez et al. (2017) Sánchez S. F., et al., 2017, MNRAS, 469, 2121
- Sánchez et al. (2018) Sánchez S. F., et al., 2018, Rev. Mex. Astron. Astrofis., 54, 217
- Sánchez et al. (2019a) Sánchez S. F., et al., 2019a, MNRAS, 482, 1557
- Sánchez et al. (2019b) Sánchez S. F., et al., 2019b, MNRAS, 484, 3042
- Sarzi et al. (2010) Sarzi M., et al., 2010, MNRAS, 402, 2187
- Schawinski et al. (2010) Schawinski K., et al., 2010, ApJ, 711, 284
- Schawinski et al. (2014) Schawinski K., et al., 2014, MNRAS, 440, 889
- Schawinski et al. (2015) Schawinski K., Koss M., Berney S., Sartori L. F., 2015, MNRAS, 451, 2517
- Schaye et al. (2015) Schaye J., et al., 2015, MNRAS, 446, 521
- Schmidt (1959) Schmidt M., 1959, ApJ, 129, 243
- Seyfert (1943) Seyfert C. K., 1943, ApJ, 97, 28
- Shimasaku et al. (2001) Shimasaku K., et al., 2001, AJ, 122, 1238
- Shimizu et al. (2015) Shimizu T. T., Mushotzky R. F., Meléndez M., Koss M., Rosario D. J., 2015, MNRAS, 452, 1841
- Sijacki et al. (2015) Sijacki D., Vogelsberger M., Genel S., Springel V., Torrey P., Snyder G. F., Nelson D., Hernquist L., 2015, MNRAS, 452, 575
- Silk (2005) Silk J., 2005, MNRAS, 364, 1337
- Silk & Rees (1998) Silk J., Rees M. J., 1998, A&A, 331, L1
- Silverman et al. (2008) Silverman J. D., et al., 2008, ApJ, 675, 1025
- Singh et al. (2013) Singh R., et al., 2013, A&A, 558, A43
- Smith et al. (2016) Smith K. L., Mushotzky R. F., Vogel S., Shimizu T. T., Miller N., 2016, ApJ, 832, 163
- Somerville et al. (2008) Somerville R. S., Hopkins P. F., Cox T. J., Robertson B. E., Hernquist L., 2008, MNRAS, 391, 481
- Stasińska et al. (2006) Stasińska G., Cid Fernandes R., Mateus A., Sodré L., Asari N. V., 2006, MNRAS, 371, 972
- Stasińska et al. (2008) Stasińska G., et al., 2008, MNRAS, 391, L29
- Stasińska et al. (2015) Stasińska G., Costa-Duarte M. V., Vale Asari N., Cid Fernandes R., Sodré L., 2015, MNRAS, 449, 559
- Strateva et al. (2001) Strateva I., et al., 2001, AJ, 122, 1861
- Tadhunter et al. (2012) Tadhunter C. N., Ramos Almeida C., Morganti R., Holt J., Rose M., Dicken D., Inskip K., 2012, MNRAS, 427, 1603
- Thomas et al. (2013) Thomas D., et al., 2013, MNRAS, 431, 1383
- Thomas et al. (2019) Thomas A. D., Kewley L. J., Dopita M. A., Groves B. A., Hopkins A. M., Sutherland R. S., 2019, ApJ, 874, 100
- Trussler et al. (2018) Trussler J., Maiolino R., Maraston C., Peng Y., Thomas D., Goddard D., Lian J., 2018, arXiv e-prints, p. arXiv:1811.09283
- Urry & Padovani (1995) Urry C. M., Padovani P., 1995, PASP, 107, 803
- Vale Asari et al. (2009) Vale Asari N., Stasińska G., Cid Fernandes R., Gomes J. M., Schlickmann M., Mateus A., Schoenell W., 2009, MNRAS, 396, L71
- Veilleux & Osterbrock (1987) Veilleux S., Osterbrock D. E., 1987, ApJS, 63, 295
- Veilleux et al. (1995) Veilleux S., Kim D.-C., Sanders D. B., Mazzarella J. M., Soifer B. T., 1995, ApJS, 98, 171
- Walcher et al. (2014) Walcher C. J., et al., 2014, A&A, 569, A1
- Wang et al. (2017) Wang T., et al., 2017, A&A, 601, A63
- Wong & Blitz (2002) Wong T., Blitz L., 2002, ApJ, 569, 157
- Wylezalek et al. (2018) Wylezalek D., Zakamska N. L., Greene J. E., Riffel R. A., Drory N., Andrews B. H., Merloni A., Thomas D., 2018, MNRAS, 474, 1499
- York et al. (2000) York D. G., et al., 2000, AJ, 120, 1579
- Zahid et al. (2014) Zahid H. J., Dima G. I., Kudritzki R.-P., Kewley L. J., Geller M. J., Hwang H. S., Silverman J. D., Kashino D., 2014, ApJ, 791, 130
- Zhang et al. (2016) Zhang Z., Shi Y., Rieke G. H., Xia X., Wang Y., Sun B., Wan L., 2016, ApJ, 819, L27
- Zhu et al. (2018a) Zhu L., et al., 2018a, Nature Astronomy, 2, 233
- Zhu et al. (2018b) Zhu L., et al., 2018b, MNRAS, 473, 3000
- de Vaucouleurs (1961) de Vaucouleurs G., 1961, ApJS, 5, 233
- do Nascimento et al. (2019) do Nascimento J. C., et al., 2019, MNRAS, 486, 5075
Appendix A The integrated BPTVO
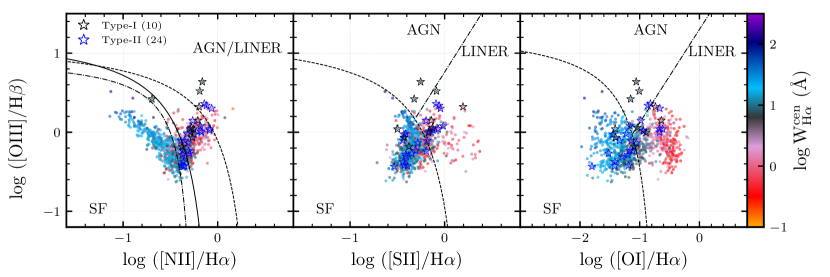
In order to classify AGN hosts, instead of using the spectra integrated in the central area, we could use the emission line ratios from the integrated data cube. We show this experiment in Figure 10, the same as Figure 1 but considering the ratios from the integrated spectra. It is clear that the AGN influence does not dominate the entire FoV of galaxies. Regarding IFS from fields that encase entire galaxies, the integrated spectrum is dominated by the light of the stellar components, this could be seen because almost all Type-II AGN hosts have their line ratios dominated by SF, as one could see both [S ii]/H and [O i]/H vs [O iii]/H diagrams. If the method of AGN hosts classification employed in this article were feed by integrated data we would have been classified only 4 AGN hosts, 3 Type-I and 1 Type-II, a number one order lower than the actual number we report.