PHENIX Collaboration
and production at forward rapidity in collisions at GeV
Abstract
The PHENIX experiment at the Relativistic Heavy Ion Collider has measured the differential cross section, mean transverse momentum, mean transverse momentum squared of inclusive and cross-section ratio of to at forward rapidity in + collisions at = 510 GeV via the dimuon decay channel. Comparison is made to inclusive cross sections measured at = 200 GeV and 2.76–13 TeV. The result is also compared to leading-order nonrelativistic QCD calculations coupled to a color-glass-condensate description of the low- gluons in the proton at low transverse momentum () and to next-to-leading order nonrelativistic QCD calculations for the rest of the range. These calculations overestimate the data at low . While consistent with the data within uncertainties above GeV/, the calculations are systematically below the data. The total cross section times the branching ratio is BR 54.3 0.5 (stat) 5.5 (syst) nb.
I Introduction
Charmonium states such as and mesons are bound states of a charm and anti-charm quark (). At the Relativistic Heavy Ion Collider (RHIC) energies, they are produced mostly from hard scattering of two gluons into a pair followed by the evolution of this pair through a hadronization process to form a physical charmonium. Despite several decades of extensive studies Abe et al. (1992); Adare et al. (2007); Aamodt et al. (2011); Abelev et al. (2012a); Adam et al. (2016); Acharya et al. (2017); Adam et al. (2019); Ma et al. (2011); Ma and Venugopalan (2014) since the discovery of , we still have very limited knowledge about the production mechanism and hadronization. Therefore, carrying out as many charmonium measurements as possible in + collisions over a wide range of transverse momentum () and of rapidity () at different energies is essential to understanding production mechanisms. These measurements over a wide range of (down to zero ) and rapidity allow calculating quantities, such as the mean transverse momentum , the mean transverse momentum squared , and the -integrated cross section . The collision energy dependence of these quantities can put stringent constraints on the different theoretical approaches that are used to describe the hadronic production of . These approaches include the color-evaporation model (CEM) Fritzsch (1977); Amundson et al. (1997), the color-singlet model (CSM) R. Baier and R. Rückl (1981) and the nonrelativistic quantum chromodynamics formalism (NRQCD) Bodwin et al. (1995). In this work, we compare the data to NRQCD, an effective field theory derived from QCD and valid for heavy-quark pairs with low relative velocity, where a can be formed from pair produced in a color-singlet or a color-octet state.
In this paper, we present the inclusive production cross section and the ratio of to production cross sections at forward rapidity () measured in + collisions at center of mass energy = 510 GeV. These mesons are measured in the dimuon decay channel. The inclusive differential cross sections are obtained as a function of and over a wide range of . The and results at = 510 GeV are the first measurements at this rapidity. Comparisons to similar PHENIX measurements performed at = 200 GeV Adare et al. (2007) and Large Hadron Collider (LHC) measurements at = 2.76, 5.02, 7, 8 and 13 TeV Aamodt et al. (2011); Abelev et al. (2012a); Adam et al. (2016); Acharya et al. (2017) allow studying the variations of , and as a function of . The results are also compared to next-to-leading order (NLO) NRQCD calculations Ma et al. (2011).
II Experimental Setup
A complete description of the PHENIX detector can be found in Ref. Adcox et al. (2003). Only the detector systems relevant to this measurement are briefly described here.
The PHENIX muon spectrometers, see Fig. 1, cover the full aziumth and the north (south) arm cover forward (backward) rapidity, . Each muon spectrometer comprises a hadronic absorber, a magnet, a muon tracker (MuTr), and a muon identifier (MuID). The absorbers comprise layers of copper, iron and stainless steel and have about 7.2 interaction lengths. Following the absorber in each muon arm is the MuTr, which comprises three stations of cathode strip chambers in a radial magnetic field with an integrated bending power of 0.8 Tm. The MuID comprises five alternating steel absorbers and Iarocci tubes. The composite momentum resolution, , of particles in the analyzed momentum range is about 5%, independent of momentum and dominated by multiple scattering. Muon candidates are identified by reconstructed tracks in the MuTr matched to MuID tracks that penetrate through to the last MuID plane.
Since 2012 the PHENIX detector had a new forward vertex detector (FVTX) Aidala et al. (2014), which comprises four planes of silicon strip detectors, finely segmented in radius and coarsely segmented in azimuth. For the subset of muon candidate tracks passing several of these detector planes, this additional information was used to improve mass resolution by a factor of 1.5 for studying .
Another detector system relevant to this analysis is the beam-beam counter (BBC), comprising two arrays of 64 Čerenkov counters, located on both sides of the interaction point and covering the pseudorapidity range . The BBC system was used to measure the + collision vertex position along the beam axis (), with 2 cm resolution, and initial collision time. It was also used to measure the beam luminosity and form a minimum bias (MB) trigger.
III Data analysis
The results presented here are based on the data sample collected by PHENIX during the 2013 + run at = 510 GeV. The BBC counters provided the MB trigger, which required at least one hit in each of the BBCs. Events, in coincidence with the MB trigger, containing a muon pair within the acceptance of the spectrometer are selected by the level-1 dimuon trigger (MuIDLL1-2D) requiring that at least two tracks penetrate through the MuID to its last layer. The data sample, used in this analysis, corresponds to MB events or to an integrated luminosity of 94.4 pb-1.
III.1 Raw yield extraction
A set of quality cuts is applied to the data to select good + events and good muon candidates as well as to improve the signal-to-background ratio. Good + events are selected by requiring that the collision occurs in the fiducial interaction region cm as measured by the BBC. Each reconstructed muon candidate comprises a combination of reconstructed muon tracks in the MuTr and in the MuID. The MuTr track is required to have more than 9 hits out of the maximum possible of 16 while the MuID track is required to have more than 6 hits out of the maximum possible of 10. In addition, a cut on individual MuTr track of 23 is applied. The MuTr track is calculated from the difference between the measured hit positions of the track and the subsequent fit for each MuTr track. The MuTr tracks are then matched to the MuID tracks at the first MuID layer by applying cuts on maximum position and angle differences. Furthermore, there is a minimum allowed single muon momentum along the beam axis, , which is reconstructed and energy-loss corrected at the collision vertex, of 3.0 GeV/ corresponding to the momentum cut effectively imposed by the absorbers. Finally, a cut on the of the fit of the two muon tracks to the common vertex of the two candidate tracks near the interaction point was applied.
The invariant mass distribution is formed by combining muon candidate tracks of opposite charges (unlike-sign). In addition to the charmonium signal, the resulting unlike-sign dimuon spectrum includes correlated and uncorrelated pairs. In the and region, the correlated pairs arise from correlated semi-muonic decays of charmed hadrons, beauty and the Drell-Yan process as well as light hadron decays. The uncorrelated pairs are mainly coming from the decays of light hadrons (, and ) which decay before or after passing through the absorber, and form the combinatorial background.
The combinatorial background is estimated using two methods: The first one derives the combinatorial background from the mass distribution of the same sign (like-sign) pairs of muon candidates within the same event. The second method derives the combinatorial background from the mass distribution of the unlike-sign pairs of muon candidates from different events (mixed-event) of z-vertex position within 2 cm. The normalization of the mass distribution of the combinatorial background from the like-sign dimuon distributions ( and ) is calculated as: . The mixed-event like-sign dimuon mass distribution is normalized to the same-event like-sign combinatorial background distribution in the invariant mass range GeV/. This factor is then used to normalize the mixed-event unlike-sign dimuon mass distribution.
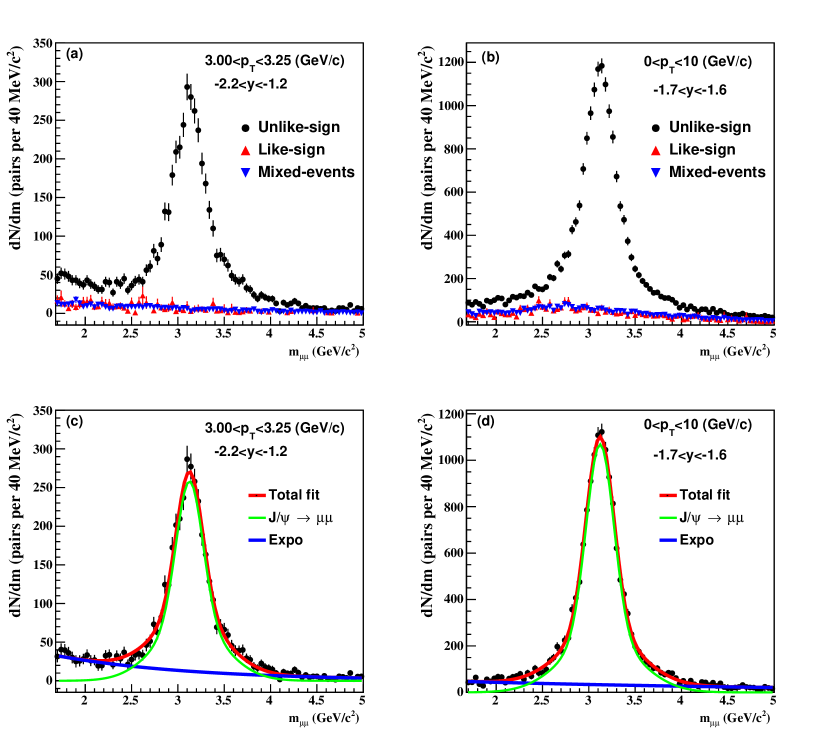
Figure 2 shows the unlike-sign dimuon spectrum together with the combinatorial background estimated by both methods. Both background distributions from the mixed-event and like-sign methods are consistent, however, the mixed-event background is more statistically stable, because we mix each event with the previous four events. Therefore, the mixed-event background was used to subtract the uncorrelated background from the unlike-sign dimuon spectrum.
After subtracting the uncorrelated background, the unlike-sign spectra including the correlated background are fitted by the following function,
| (1) |
where are free parameters and is the unlike-sign dimuon mass. The shape is better described with two Gaussian distributions, corresponding to the first two terms in Eq. 1, one for the peak and a second one with larger width to account for the wider tails, which occurs due to limitations in MuTr resolution, as discussed in sec. II. The peak also includes contribution from , which is not resolved. An exponential is used to describe the continuum contributions from correlated backgrounds. Panels (a) and (b) of Fig. 2 show the raw spectra for selected and rapidity bins and panels (c) and (d) show the spectra after subtracting the combinatorial background fitted with the function described above for those selected bins.
To extract the signal we improve the mass resolution of the muon tracking systems by utilizing the FVTX. The FVTX being located before the absorber allows measuring the dimuon opening angle before any multiple scattering occurs in the absorber Aidala et al. (2014). Using this additional tracking information gives a more precise measurement of the dimuon opening angle and thereby a more precise measurement of the pair mass, as well as rejecting backgrounds from decay muons that emerge from the absorber. However, these additional requirements on the dimuon tracks that are necessary to separate the and peaks also reduce the statistics by a factor of 6 due to the geometric acceptance of FVTX, therefore, we study the dimuon mass spectra in each arm integrated over and rapidity within each arm. The dimuon mass spectrum extracted including the FVTX after subtracting the mixed-event background is shown in Fig. 3.
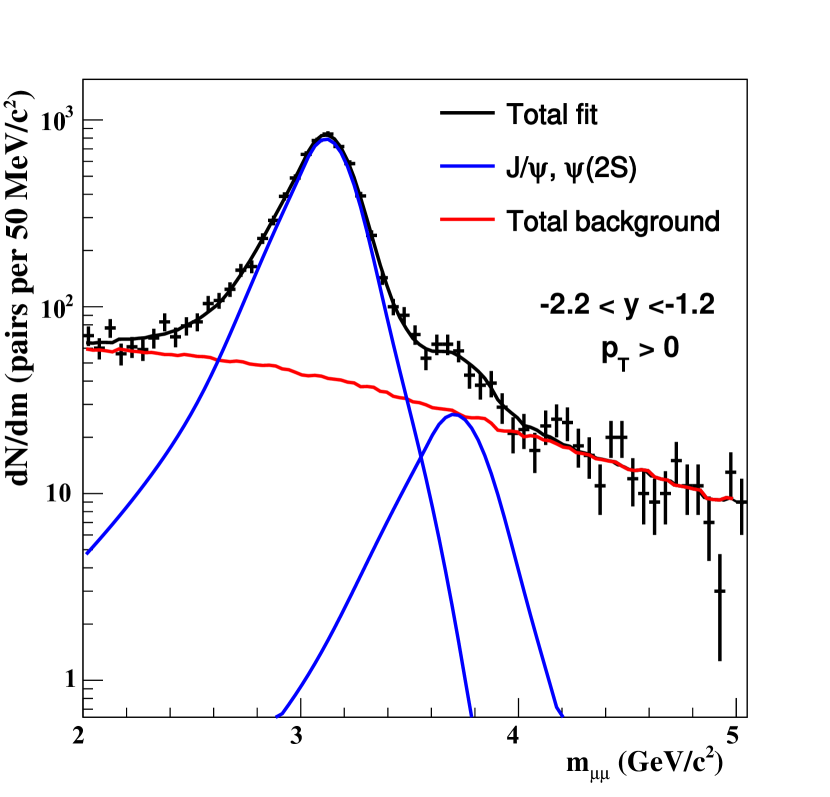
Given the resolution enhancement, the sum of a Gaussian and a crystal-ball function Gaiser (1983); Adare et al. (2017), rather than a double Gaussian, was used for each of and peaks to fit the dimuon mass spectrum. The peak is expected to be wider than the peak, due to the fact that the higher mass and harder spectrum of the state will produce higher momentum decay muons which have larger uncertainty in their reconstructed momentum in the spectrometer due to a smaller bend in the magnetic field. By selecting only poorly reconstructed tracks, we found a width of MeV/c2, therefore, the width of the second Gaussian in the fit to the entire sample of tracks is set to 200 MeV/c2. The ratio of widths of the to is set to 1.15, following expectations of the performance of the muon tracking system Akikawa et al. (2003). The difference between the centroids of the and peaks is set to the Particle Data Group value of 589 MeV/c2 Olive et al. (2014). The relative normalization of the second Gaussian is fixed to be the same for both resonances, as are the parameters for the crystal-ball line shape.
III.2 Detector acceptance and reconstruction efficiency
The acceptance and reconstruction efficiency () of the muon spectrometers, including the MuID trigger efficiency, is determined by running a pythia111We used pythia6.421, with parton distribution functions given by CTEQ6LL. The following parameters were modified: MSEL = 0, MSUB(86) = 1, PARP(91) = 2.1, MSTP(51) = 10041, MDME(858,1) = 0, MDME(859,1) = 1, MDME(860,1) = 0, and Tune A. Sjstrand et al. (2001) generated signal through a geant4-based full detector simulation Agostinelli et al. (2003) of PHENIX. The simulation tuned the detector response to a set of characteristics (dead and hot channel maps, gains, noise, etc.) that described the performance of each detector subsystem. The simulated vertex distribution was tuned to match that of the 2013 data. The simulated events are reconstructed in the same manner as the data and the same cuts are applied as in the real data analysis.
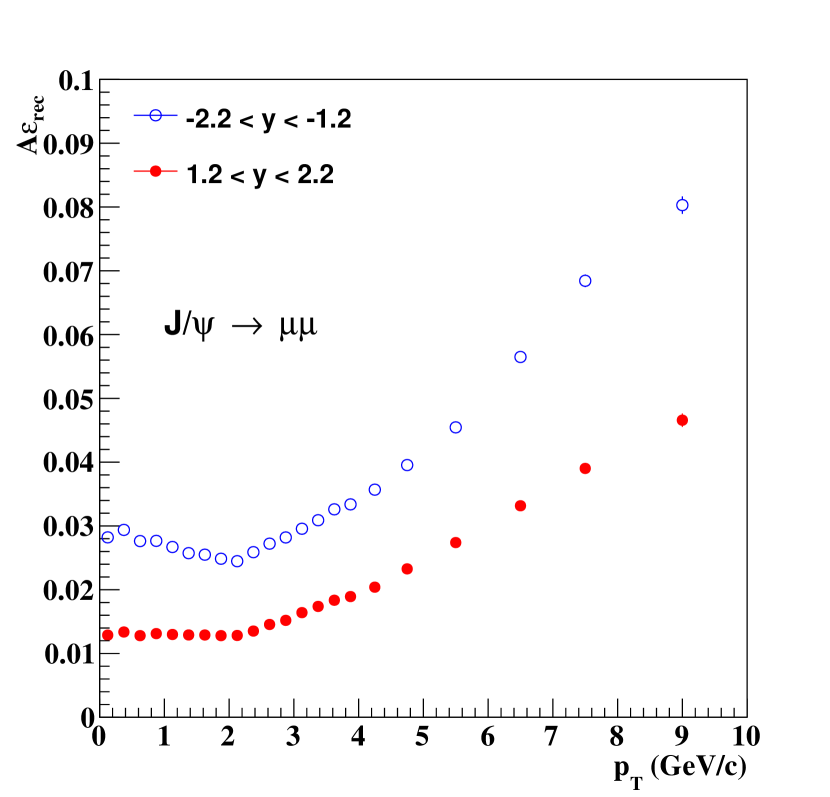
Figure 4 shows as a function of and rapidity for . The relative difference in between the two spectrometers is due to different detection efficiencies of the MuTr and MuID systems and different amount of absorber material.
In the case of , we are interested in the ratio of its differential cross section to that of , therefore, we extract the ratio of for and with addition of the FVTX information in analyzing the simulation to match that of the data analysis. A factor of 0.77 (0.69) is applied to the / ratio extracted from the fit to the invariant mass spectrum to account for differences in acceptance, efficiency, and dimuon trigger efficiencies between the north (south) arm of the muon spectrometer.
III.3 Differential cross section
The differential cross section is evaluated according to the following relation:
| (2) |
where is the extracted or yield in and bins with and widths, respectively. is the branching ratio where and Olive et al. (2014). is the product of the acceptance and reconstruction efficiency. is the number of MB events and is the efficiency of the MB trigger for events containing a hard scattering Adare et al. (2016). is the PHENIX BBC cross section, mb at GeV, which is determined from the van der Meer scan technique Adare et al. (2011).
III.4 Systematic uncertainties
All systematic uncertainties are evaluated as standard deviations and are summarized in Tables 1 and 2. They are divided into three categories based upon the effect each source has on the measured results:
- Type-A
-
Point-to-point uncorrelated uncertainties allow the data points to move independently with respect to one another and are added in quadrature with statistical uncertainties; however, no systematic uncertainties of this type are associated with this measurement.
- Type-B
-
Point-to-point correlated uncertainties which allow the data points to move coherently within the quoted range to some degree. These systematic uncertainties include a 4% uncertainty from MuID tube efficiency and an 8.2% (2.8%) from MuTr overall efficiency for the north (south) arm. A 3.9% signal extraction uncertainty is assigned to account for the yield variations when using different functions, i.e., second, third and fourth order polynomials, to fit the correlated background and uncertainty is assigned to account for the contribution. The systematic uncertainty associated with includes the uncertainty on the input and rapidity distributions which is extracted by varying these distributions over the range of the statistical uncertainty of the data, yielding 4.4% (5.0%) for the north (south) arm. Additional 11.2% (8.8%) systematic effect for the north (south) arm was also considered to account for the azimuthal angle distribution difference between data and simulation. To be consistent with the real data analysis, a trigger emulator was used to match the level-1 dimuon trigger for the data. The efficiency of the trigger emulator was studied by applying it to the data and comparing the resulting mass spectrum to the mass spectrum when applying the level-1 dimuon trigger which resulted in a 1.5% (2%) uncertainty for the north (south) arm. Type-B systematic uncertainties are added in quadrature and amount to 16.0% (12.4%) for the north (south) arm. They are shown as shaded bands on the associated data points.
- Type-C
-
An overall normalization uncertainty of 10% was assigned for the BBC cross section and efficiency uncertainties Adler et al. (2003) that allow the data points to move together by a common multiplicative factor.
| Type- | Origin | north (south) |
|---|---|---|
| B | MuID hit efficiency | 4.0% (4.0%) |
| B | MuTr hit efficiency | 8.2% (2.8%) |
| B | Signal extraction | 3.9% (3.9%) |
| B | contribution | 3.0% (3.0%) |
| B | and input distributions | 4.4% (5.0%) |
| B | distribution | 11.2% (8.8%) |
| B | trigger emulator | 1.5% (2.0%) |
| B | Quadratic sum | 16.0% (12.4)% |
| C | MB trigger efficiency | 10% |
In the measurement of the to ratio, most of the mentioned systematic uncertainties cancel out. However, the fit that was used to extract the yields is more complex and additional systematic uncertainties arose from the constraints applied during the fitting process.
A systematic uncertainty from constraining the normalization factor is determined by varying the mass range over which the factor is calculated and a 3% systematic uncertainty is assigned for both arms. Systematic uncertainty of 3% (7%) was assigned to the north (south) arm on the fit range by varying the range around the nominal values, 2–5 GeV/. The effect of constraining the second Gaussian peak width to 200 MeV/ was studied by varying the width between 175 and 225 MeV/, resulting in a systematic uncertainty of 12% (10%) in the north (south) arm.
The systematic uncertainty component on that survived the ratio amounts to 2.7% (4.1%) in the north (south) arm. The systematic uncertainties associated with the ratio measurement are summarized in Table 2.
| Type | Origin | north (south) |
|---|---|---|
| B | constraint | 3% (3%) |
| B | Background fit mass range | 3% (7%) |
| B | Second Gaussian width constraint | 12% (10%) |
| B | 2.7% (4.1%) | |
| B | Quadratic sum | 13% (13%) |
IV Results
The inclusive differential cross section as a function of is calculated independently for each muon arm, then the results are combined using the best-linear-unbiased-estimate method Nisius (2014). Results obtained using the two muon spectrometers are consistent within statistical uncertainties. The combined inclusive differential cross section is shown in Fig. 5 and listed in Table 3. The gray shaded bands represent the weighted average of the quadratic sum of type-B systematic uncertainties of the north and south arms, . The average is weighted based on the statistical uncertainties of each arm.
| 0.00 | 0.25 | ||
|---|---|---|---|
| 0.25 | 0.50 | ||
| 0.50 | 0.75 | ||
| 0.75 | 1.00 | ||
| 1.00 | 1.25 | ||
| 1.25 | 1.50 | ||
| 1.50 | 1.75 | ||
| 1.75 | 2.00 | ||
| 2.00 | 2.25 | ||
| 2.25 | 2.50 | ||
| 2.50 | 2.75 | ||
| 2.75 | 3.00 | ||
| 3.00 | 3.25 | ||
| 3.25 | 3.50 | ||
| 3.50 | 3.75 | ||
| 3.75 | 4.00 | ||
| 4.00 | 4.50 | ||
| 4.50 | 5.00 | ||
| 5.00 | 6.00 | ||
| 6.00 | 7.00 | ||
| 7.00 | 8.00 | ||
| 8.00 | 10.00 |
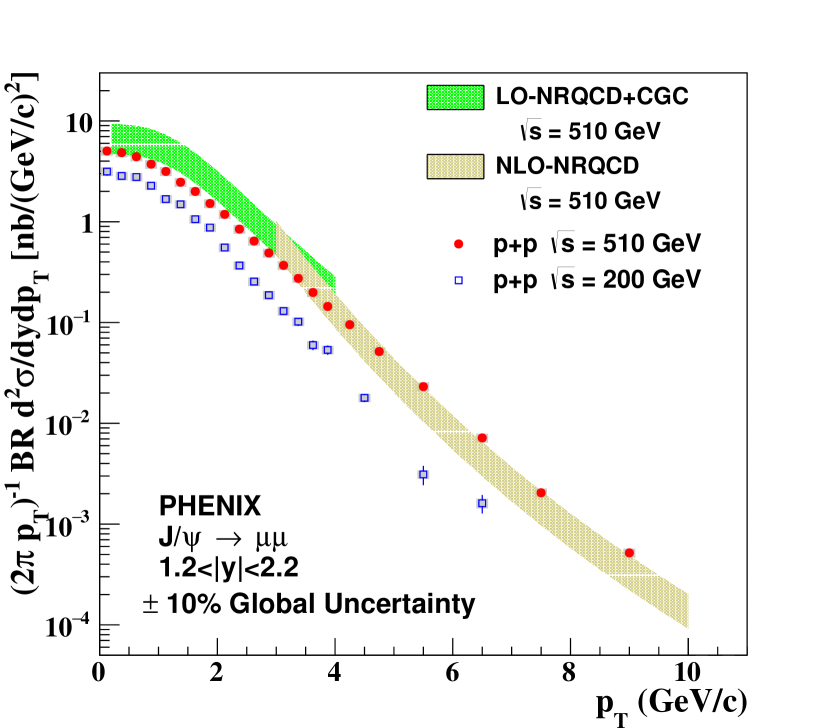
The data points are corrected to account for the finite width of the analyzed bins Lafferty and Wyatt (1995). We compare the data to inclusive data at 200 GeV Adare et al. (2007) which show similar dependence. At low , the data are compared to prompt leading-order (LO) NRQCD calculations Ma et al. (2011); Bodwin et al. (1995) coupled to a Color Glass Condensate (CGC) description of the low- gluons in the proton Ma and Venugopalan (2014). For the rest of range, the data are compared to prompt NLO NRQCD calculations Ma et al. (2011); Bodwin et al. (1995). The LO-NRQCD+CGC calculations overestimate the data at low . The NLO-NRQCD calculations underestimate the data at high , while to some extent, are consistent with the data at intermediate , 3–5 GeV/. It is important to stress that the nonprompt contribution (from excited charmonium states and from -meson decays) is not included in these calculations. This is expected to be a significant contribution at high ; therefore, the addition of the nonprompt contribution could account for the difference between the data and calculations Aidala et al. (2017); Cacciari et al. (2005); Nelson et al. (2013). The coverage down to zero allows the extraction of the -integrated cross section, BR 54.3 0.5 (stat) 5.5 (syst) nb.
| (nb) | |||
|---|---|---|---|
| -2.20 | -2.00 | ||
| -2.00 | -1.90 | ||
| -1.90 | -1.80 | ||
| -1.80 | -1.70 | ||
| -1.70 | -1.60 | ||
| -1.60 | -1.50 | ||
| -1.50 | -1.20 | ||
| 1.20 | 1.50 | ||
| 1.50 | 1.60 | ||
| 1.60 | 1.70 | ||
| 1.70 | 1.80 | ||
| 1.80 | 1.90 | ||
| 1.90 | 2.00 | ||
| 2.00 | 2.20 |
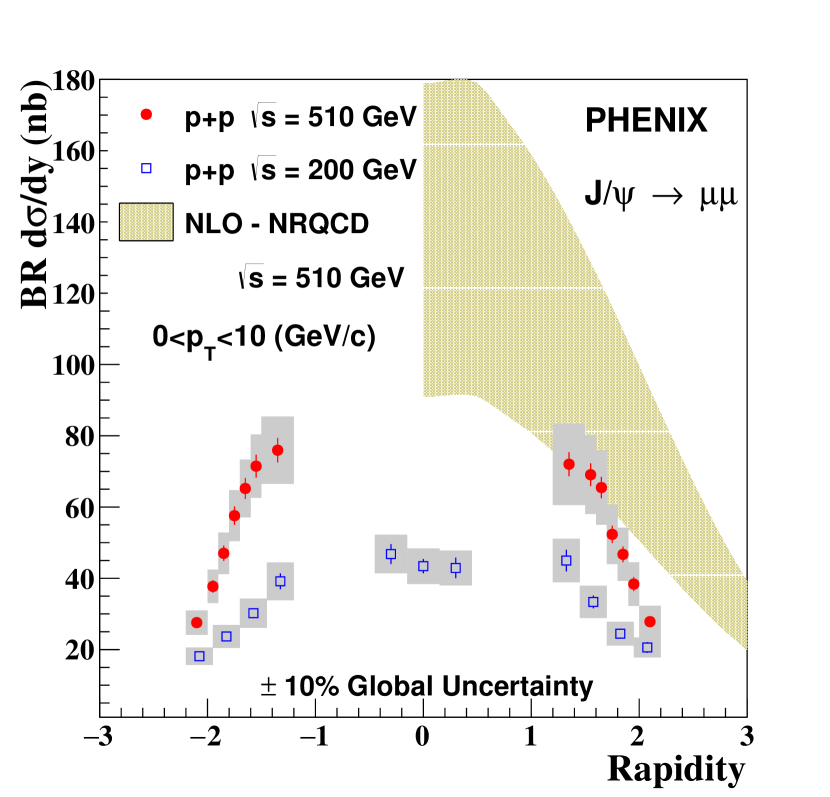
Inclusive differential cross section as a function of rapidity is listed in Table 4 and shown in Fig. 6, which also includes PHENIX inclusive data at 200 GeV Adare et al. (2007) and NLO-NRQCD calculations Ma et al. (2011). The 510 GeV data show a similar rapidity dependence pattern to that of the 200 GeV data. NLO-NRQCD calculations overestimate the data, and this is consistent with what was observed in the case of -dependent differential cross section (see Fig. 5) because the -dependent differential cross section is dominated by the low- region where NRQCD calculation overestimates the data.
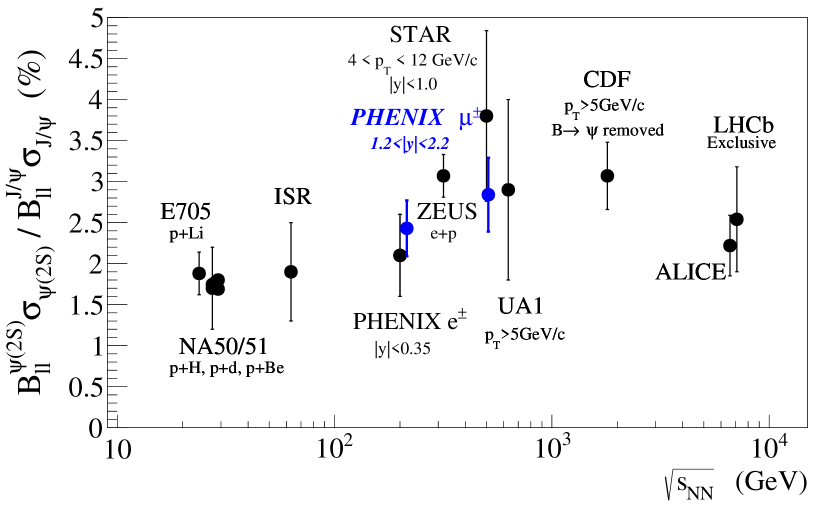
To quantify the feed-down contribution of excited charmonium states, the ratio of the cross section of to , multiplied by their respective branching ratio to dimuons, is measured (%) and shown in Fig. 7. This ratio is compared with other and systems at different collision energies Alessandro et al. (2006); Adare et al. (2012); Antoniazzi et al. (1993); Abreu et al. (1998); Clark et al. (1978); Albajar et al. (1991); Abe et al. (1997); Aaij et al. (2013); Abelev et al. (2014); Adare et al. (2017). The results are consistent with world data within uncertainties with no significant dependence on collision energy.
To better understand the shape of the spectrum for at forward rapidity and quantify its hardening at = 510 GeV, we calculate the corresponding mean transverse momentum and mean transverse momentum squared . This is done by fitting the inclusive -dependent differential cross sections with the following function Adare et al. (2007); Acharya et al. (2017):
| (3) |
where , and are free parameters and their values from the fit are , and , respectively, and and are the first and second moments of Eq. 3 in a given range. This fit results in a GeV/ and (GeV/)2.
The first error is statistical, and the second is the systematic uncertainty from the maximum shape deviation permitted by the type-B correlated errors.
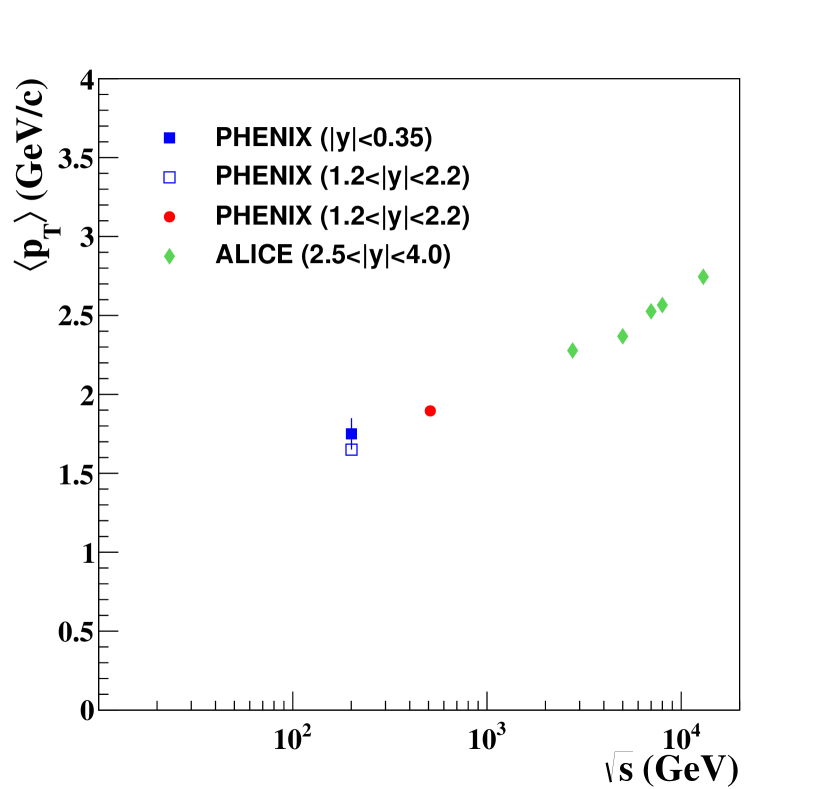
Figure 9 shows as a function of from this measurement compared with results from 200 GeV PHENIX data at the same rapidity range Adare et al. (2007), and results from ALICE at different values and in the rapidity range, Aaij (2014). This result follows the increasing pattern observed between PHENIX results at 200 GeV and ALICE results at 2.76–13 TeV.
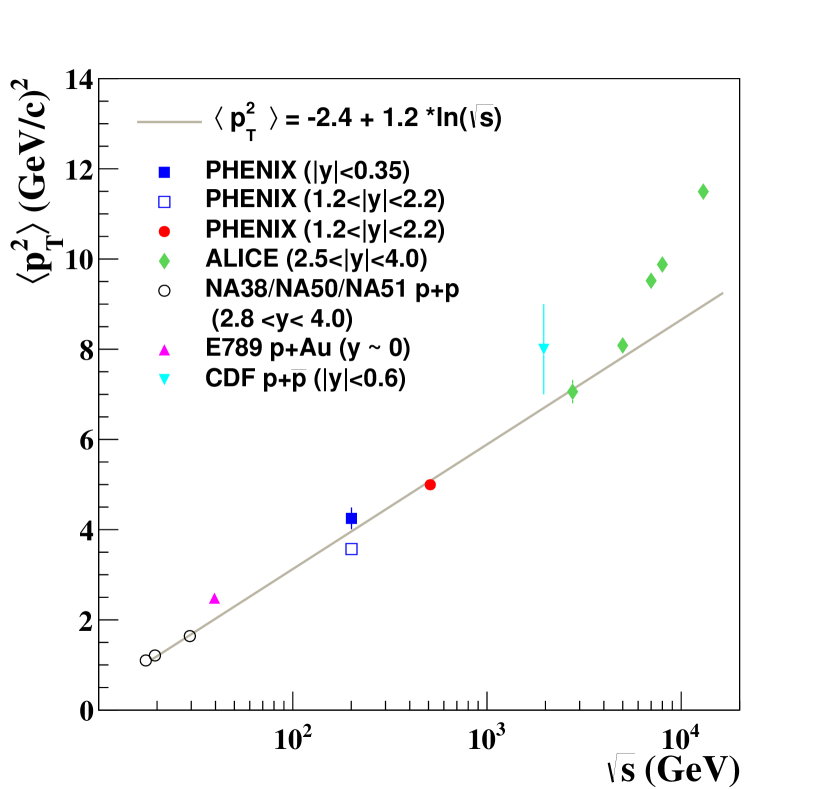
Figure 9 shows as a function of from this measurement compared with several other measurements Adare et al. (2007); Acharya et al. (2017); Abe et al. (1992); Acosta et al. (2002, 2005); Aaij (2014); Drapier (1998). Similar to , from this measurement follows the increasing pattern versus established by several sets of data over a wide range of energies. Below of 2 TeV, the trend is qualitatively consistent with a linear fit of versus the log of the center of mass energy from Ref. Adare et al. (2007). However, above of 2 TeV, the ALICE data indicate grows at an increased rate which is interpreted by authors of Ref. Acharya et al. (2017) as due to the fact that ALICE data sets have different ranges. The bottom cross section also increases with increasing , changing the relative prompt and -meson decay contributions to the inclusive samples discussed here Abelev et al. (2012b); Aidala et al. (2017). This may also contribute to the observed differences in the measured .
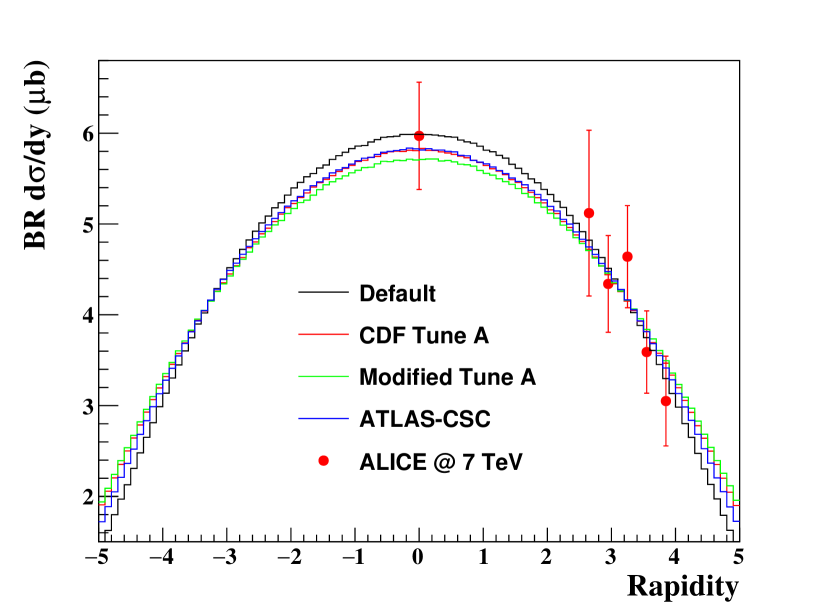
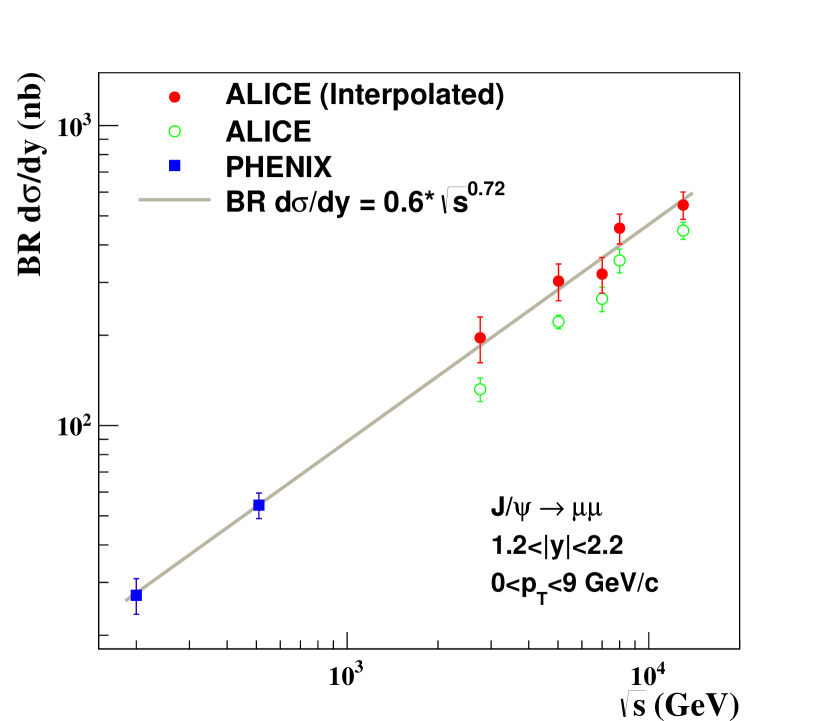
The measurement at = 510 GeV offers an opportunity to test the center-of-mass energy dependence of the -integrated cross section. Moreover, it bridges the gap between RHIC data at 200 GeV and ALICE data starting at 2.76 TeV Aamodt et al. (2011); Abelev et al. (2012a); Adam et al. (2016); Acharya et al. (2017). However, ALICE data are collected at mid and forward rapidities and to have a proper comparison we interpolate the ALICE data to the PHENIX forward rapidity range, . This is done by fitting the pythia generated distribution at each energy to the data at the same energy with only the normalization as a free parameter. An example is shown in Fig. 11. We used several pythia Sjstrand et al. (2006) tunes including PHENIX default, tune-A, modified tune-A and atlas-csc Sjöstrand and Skands (2005). After fitting each of these pythia tunes to the data, we extracted at , from these fits. The rms value of the extracted from the different fits is used in the comparison to RHIC data. The error on the rms value is the rms of the errors associated with the fit results.
Figure 11 shows the results from this measurement, 200 GeV PHENIX data (closed [blue] squares), ALICE data (open [green] circles), and interpolated ALICE data (closed [red] circles) at several energies. Figure 11 shows that the data are well described by a power law, , where the exponent is .
V Summary
We studied inclusive production in + collisions at = 510 GeV for and GeV/, through the dimuon decay channel. We measured inclusive differential cross sections as a function of as well as a function of rapidity. The integrated differential cross section multiplied by branching ratio to dimuons is 54.3 0.5 (stat) 5.5 (syst) nb. With these data measured over a wide range, we calculated , and . The results were compared to similar quantities at different energies from RHIC and LHC to study their dependence. These new measurements could put stringent constraints on production models.
The inclusive differential cross sections were compared to prompt calculations. These calculations included LO-NRQCD+CGC at low and NLO-NRQCD for the rest of range. These model calculations overestimated the data at low and underestimated the data at high . The nonprompt contribution was not included which could account for the underestimation at high where the nonprompt processes are significant.
In addition, we measured the ratio of the cross section of to , multiplied by their respective branching ratio to dimuons, %. The result is consistent with world data within uncertainties with no dependence on collision energy.
Acknowledgements.
We thank the staff of the Collider-Accelerator and Physics Departments at Brookhaven National Laboratory and the staff of the other PHENIX participating institutions for their vital contributions. We acknowledge support from the Office of Nuclear Physics in the Office of Science of the Department of Energy, the National Science Foundation, Abilene Christian University Research Council, Research Foundation of SUNY, and Dean of the College of Arts and Sciences, Vanderbilt University (U.S.A), Ministry of Education, Culture, Sports, Science, and Technology and the Japan Society for the Promotion of Science (Japan), Conselho Nacional de Desenvolvimento Científico e Tecnológico and Fundação de Amparo à Pesquisa do Estado de São Paulo (Brazil), Natural Science Foundation of China (People’s Republic of China), Croatian Science Foundation and Ministry of Science and Education (Croatia), Ministry of Education, Youth and Sports (Czech Republic), Centre National de la Recherche Scientifique, Commissariat à l’Énergie Atomique, and Institut National de Physique Nucléaire et de Physique des Particules (France), Bundesministerium für Bildung und Forschung, Deutscher Akademischer Austausch Dienst, and Alexander von Humboldt Stiftung (Germany), J. Bolyai Research Scholarship, EFOP, the New National Excellence Program (ÚNKP), NKFIH, and OTKA (Hungary), Department of Atomic Energy and Department of Science and Technology (India), Israel Science Foundation (Israel), Basic Science Research and SRC(CENuM) Programs through NRF funded by the Ministry of Education and the Ministry of Science and ICT (Korea). Physics Department, Lahore University of Management Sciences (Pakistan), Ministry of Education and Science, Russian Academy of Sciences, Federal Agency of Atomic Energy (Russia), VR and Wallenberg Foundation (Sweden), the U.S. Civilian Research and Development Foundation for the Independent States of the Former Soviet Union, the Hungarian American Enterprise Scholarship Fund, the US-Hungarian Fulbright Foundation, and the US-Israel Binational Science Foundation.References
- Abe et al. (1992) F. Abe et al. (CDF Collaboration), “Inclusive , and quark production in collisions at TeV,” Phys. Rev. Lett. 69, 3704 (1992).
- Adare et al. (2007) A. Adare et al. (PHENIX Collaboration), “ Production versus Transverse Momentum and Rapidity in Collisions at ,” Phys. Rev. Lett. 98, 232002 (2007).
- Aamodt et al. (2011) K. Aamodt et al., “Rapidity and transverse momentum dependence of inclusive production in collisions at TeV,” Phys, Lett. B 704, 442 (2011).
- Abelev et al. (2012a) B. Abelev et al., “Inclusive production in collisions at =2.76 TeV,” Phys. Lett. B 718, 295 (2012a).
- Adam et al. (2016) J. Adam et al., “Inclusive quarkonium production at forward rapidity in collisions at =8 TeV,” Eur. Phys. J. C 76, 184 (2016).
- Acharya et al. (2017) S. Acharya et al., “Energy dependence of forward-rapidity and production in collisions at the LHC,” Eur. Phys. J. C 77, 392 (2017).
- Adam et al. (2019) J. Adam et al. (STAR Collaboration), “Measurements of the transverse-momentum-dependent cross sections of production at mid-rapidity in collisions at and 500 GeV with the STAR detector,” Phys. Rev. D 100, 052009 (2019).
- Ma et al. (2011) Y.-Q. Ma, K. Wang, and K.-T. Chao, “ Production at the Tevatron and LHC at ( in Nonrelativistic QCD ,” Phys. Rev. Lett. 106, 042002 (2011).
- Ma and Venugopalan (2014) Y.-Q. Ma and R. Venugopalan, “Comprehensive Description of Production in Proton-Proton Collisions at Collider Energies,” Phys. Rev. Lett. 113, 192301 (2014).
- Fritzsch (1977) H. Fritzsch, “Producing heavy quark flavors in hadronic collisions—’ A test of quantum chromodynamics,” Phys. Lett. B 67, 217 (1977).
- Amundson et al. (1997) J.F. Amundson, O.J.P. boli, E.M. Gregores, and F. Halzen, “Quantitative tests of color evaporation: charmonium production,” Phys. Lett. B 390, 323 (1997).
- R. Baier and R. Rückl (1981) R. Baier and R. Rückl, “Hadronic production of and : Transverse momentum distributions,” Phys. Lett. B 102, 364 (1981).
- Bodwin et al. (1995) G. T. Bodwin, E. Braaten, and G. P. Lepage, “Rigorous QCD analysis of inclusive annihilation and production of heavy quarkonium,” Phys. Rev. D 51, 1125 (1995).
- Adcox et al. (2003) K. Adcox et al. (PHENIX Collaboration), “PHENIX detector overview,” Nucl. Instrum. Methods Phys. Res., Sec. A 499, 469–479 (2003).
- Aidala et al. (2014) C. Aidala et al., “The PHENIX Forward Silicon Vertex Detector,” Nucl. Instrum. Methods Phys. Res., Sec. A 755, 44 (2014).
- Gaiser (1983) J. Gaiser, Charmonium Spectroscopy From Radiative Decays of the and , Ph.D. dissertation., Stanford Linear Accelerator Center, Stanford University, Stanford, California 94305 (1983), SLAC Stanford - SLAC-255 (82,REC.JUN.83).
- Adare et al. (2017) A. Adare et al. (PHENIX Collaboration), “Measurement of the relative yields of to mesons produced at forward and backward rapidity in , , , and collisions at GeV,” Phys. Rev. C 95, 034904 (2017).
- Akikawa et al. (2003) H. Akikawa et al., “PHENIX Muon Arms,” Nucl. Instrum. Methods Phys. Res., Sec. A 499, 537 (2003).
- Olive et al. (2014) K.A. Olive et al. (Particle Data Group), “Review of Particle Physics,” Chin. Phys. C 38, 090001 (2014).
- Sjstrand et al. (2001) T. Sjstrand et al., “High-energy-physics event generation with pythia6.1,” Comput. Phys. Commun. 135, 238 (2001).
- Agostinelli et al. (2003) S. Agostinelli et al. (geant4 Collaboration), “geant4: A simulation toolkit,” Nucl. Instrum. Methods Phys. Res., Sec. A 506, 250 (2003).
- Adare et al. (2016) A. Adare et al. (PHENIX Collaboration), “Inclusive cross section and double-helicity asymmetry for production at midrapidity in collisions at gev,” Phys. Rev. D 93, 011501 (2016).
- Adare et al. (2011) A. Adare et al. (PHENIX Collaboration), “Cross Section and Parity Violating Spin Asymmetries of Boson Production in Polarized Collisions at GeV,” Phys. Rev. Lett. 106, 062001 (2011).
- Adler et al. (2003) S. S. Adler et al. (PHENIX Collaboration), “Midrapidity Neutral-Pion Production in Proton-Proton Collisions at GeV,” Phys. Rev. Lett. 91, 241803 (2003).
- Nisius (2014) R. Nisius, “On the combination of correlated estimates of a physics observable,” Eur. Phys. J. C 74, 3004 (2014).
- Lafferty and Wyatt (1995) G. D. Lafferty and T. R. Wyatt, “Where to stick your data points: The treatment of measurements within wide bins,” Nucl. Instrum. Methods Phys. Res., Sec. A 355, 541 (1995).
- Aidala et al. (2017) C. Aidala et al. (PHENIX Collaboration), “Measurements of at forward rapidity in collisions at ,” Phys. Rev. D 95, 092002 (2017).
- Cacciari et al. (2005) M. Cacciari, P. Nason, and R. Vogt, “QCD Predictions for Charm and Bottom Quark Production at RHIC,” Phys. Rev. Lett. 95, 122001 (2005).
- Nelson et al. (2013) R. E. Nelson, R. Vogt, and A. D. Frawley, “Narrowing the uncertainty on the total charm cross section and its effect on the cross section,” Phys. Rev. C 87, 014908 (2013).
- Alessandro et al. (2006) B. Alessandro et al., “ and production and their normal nuclear absorption in proton-nucleus collisions at 400 GeV,” Eur. Phys. J. C 48, 329 (2006).
- Adare et al. (2012) A. Adare et al. (PHENIX Collaboration), “Ground and excited state charmonium production in collisions at 200 GeV,” Phys. Rev. D 85, 092004 (2012).
- Antoniazzi et al. (1993) L. Antoniazzi et al., “Production of via and decay in 300 GeV/ proton- and -nucleon interactions,” Phys. Rev. Lett. 70, 383 (1993).
- Abreu et al. (1998) M. C. Abreu et al., “, (2S) and Drell-Yan production in and interactions at 450 GeV/,” Phys. Lett. B 438, 35 (1998).
- Clark et al. (1978) A. G. Clark et al., “Electron pair production at the CERN ISR,” Nucl. Phys. B 142, 29 (1978).
- Albajar et al. (1991) C. Albajar et al., “ and production at the CERN collider,” Phys. Lett. B 256, 112 (1991).
- Abe et al. (1997) F. Abe et al. (CDF Collaboration), “ and Production in Collisions at 1.8 TeV,” Phys. Rev. Lett. 79, 572 (1997).
- Aaij et al. (2013) R. Aaij et al., “Exclusive and production in collisions at TeV,” J. Phys. G 40, 045001 (2013).
- Abelev et al. (2014) B. Abelev et al. (ALICE Collaboration), “Measurement of quarkonium production at forward rapidity in collisions at 7 TeV,” Eur. Phys. J. C 74, 2974 (2014).
- Acosta et al. (2005) D. Acosta et al. (CDF Collaboration), “Measurement of the meson and -hadron production cross sections in collisions at ,” Phys. Rev. D 71, 032001 (2005).
- Drapier (1998) O. Drapier, Study of the transverse momentum distributions of dimuons produced in nucleus-nucleus collisions at the CERN SPS, Thse d’habilitation thesis, Universit´ Claude Bernard-Lyon (1998).
- Schub et al. (1995) M. H. Schub et al., “Measurement of J/ and ’ production in 800 GeV/c proton-gold collisions,” Phys. Rev. D 52, 1307 (1995).
- Aaij (2014) R. Aaij, “Measurement of polarization in collisions at 7 TeV,” Eur. Phys. J. C 74, 2872 (2014).
- Acosta et al. (2002) D. Acosta et al. (CDF Collaboration), “Cross section for forward production in collisions at ,” Phys. Rev. D 66, 092001 (2002).
- Abelev et al. (2012b) B. Abelev et al. (ALICE Collaboration), “Measurement of prompt and beauty hadron production cross sections at midrapidity in pp collisions at TeV,” (2012b), J. High Energy Phys. 11 (2012) 065.
- Sjstrand et al. (2006) T. Sjstrand, S. Mrenna, and P. Skands, “pythia6.4 physics and manual,” (2006), J. High Energy Phys. 05 (2006) 026.
- Sjöstrand and Skands (2005) T. Sjöstrand and P. Z. Skands, “Transverse-momentum-ordered showers and interleaved multiple interactions,” Eur. Phys. J. C 39, 129 (2005).