∎
33institutetext: S. Author 44institutetext: Hamidreza Fallah
44email: hfallah@sci.ui.ac.ir 55institutetext: t. Author 66institutetext: Morteza Hajimahmoodzadeh
Investigating the effect of different quantum dots on the absorption spectrum and characteristics of quantum dot sensitized solar cells
Abstract
Quantum dot sensitized solar cells are among the new generations of solar cells that have attracted much attention. Theoretical and simulation studies have predicted high efficiency for these cells so that in the future, these cells could be an excellent alternative to silicon solar cells. Other advantages of these cells are their ease of fabrication and cheaper manufacturing methods than existing cells. This paper’s main idea is to simulate the effect of different quantum dots on the optical and electrical characteristics of these cells and, in particular, the efficiency. We then simulated the effect of simultaneous sensitizing by different quantum dots, and we observed that the cell’s light absorption and the efficiency in simultaneous sensitizing, increased. Then we experimentally studied one of the cells that give the best simulation result (\cePbS/\ceCdS co-sensitized). We deposited the quantum dots on transparent \ceTiO2, and we obtained the light absorption, efficiency, and other characteristics of cells. Further, we investigated the effect of cobalt sulfide as the counter electrode in \cePbS/\ceCdS, instead of platinum and gold, and we found that the efficiency has increased.
Keywords:
Quantum dot solar cell absorption spectrum photovoltaics counter electrode.1 Introduction
can be transformed into other useful forms of energy, such as heat, electricity, and chemicals, to supply daily human energy. Reports have shown that using solar cells by 10% efficiency in just 0.1% of the earth’s surface can provide current electricity demand gratzel2001photoelectrochemical . The first-generation solar cells were based on silicon, and then the thin-layer solar cells were made as second-generation. The production of solar cells with high efficiency, low cost, and mass-producing capability is a priority of research in solar cells. Researchers have developed a plan for the third generation of solar cells by combining the knowledge of first and second generations of solar cells. This generation can achieve Shockley’s extraordinary theoretical efficiency while reducing cell manufacturing costs beard2013third .
Quantum dot solar cells are a bunch of solar cells based on nanomaterials, and quantum dots(QDs) and QDs can be used in a variety of solar cells to reduce costs and increase efficiency. The optical behavior of quantum dots is such that they emit visible light of varying wavelengths when exposed to ultraviolet light els1 . The point is that the wavelength of light emitted from quantum dots depends on the quantum dots’ size. In small quantum dots, the band-gap is larger. Therefore, by applying the UV beam to small quantum dots, the electrons traveling to the higher energy band emit a larger energy band-gap when losing excess energy and return to steady-state. The beam of visible light they emit has more energy and is bluish. Quantum dots have attracted researchers’ attention to making solar cells because of their adjustable band-gap to their desired size. So their absorption spectra can be adjusted to the spectral distribution of sunlight els2 . Their high extinction coefficient els3 , rapid separation of charges due to the significant intrinsic dipole moments of them els4 , and their ability to produce multiple excitons by absorbing a single photon cause the incident photon to current conversion efficiency to be more than 100% els5 .
If the photon energy exceeds the threshold required for impact ionization, this extra energy will excite another electron and produce another exciton wolf1998solar . Impact Ionization is a process in which an electron or hole with sufficient kinetic energy can excite one electron from the valence band to the conduction band. The result of this process is the production of another electron-hole pair.
Quantum dot sensitized solar cells (QDSSCs) are a replacement of dye-sensitized solar cell (DSSCs) mishra2009metal . The difference between QDSSCs and DSSCs is sensitizers which are responsible for absorbing light. In DSSCs, the sensitizers are organic dye molecules or metal-organic compounds, and in QDSSCs, they are quantum dots. Briefly, the operation principles of these cells are as follows. Li research group in 2013 showed that using \cePbS and \ceCdS quantum dots deposited on \ceTiO2 nanorod arrays can achieve to 1.3% efficiency li2013efficient . In this work, we improved the efficiency of cells using transparent and reflector \ceTiO2 to 1.88% .
After the light is emitted into the photovoltaic cell, the quantum dots on the surface \ce TiO2 layer absorb light, which excites the quantum dots’ electrons from the valance band to the conduction band. This process leaves a positive charge hole in the vacancy of the electron. The generated electron-hole pair (exciton) must be separated at the quantum dots’ boundary with \ce TiO2. The excited electron is transferred to the \ceTiO2 electrode and moved to the counter electrode through an external circuit. Also, through the electrolyte, which plays the role of oxidation /reduction (redox) pair, the electron transfers to the Ground state of the quantum dots and becomes oxidized. Then the intermediate undergoing the oxidation process goes through the diffusion process to the counter electrode and is then subjected to the reduction process again.
Selecting the counter electrode is one of the key points in achieving high efficiency. Because the counter electrode plays the role of oxidation, it is necessary to choose the counter electrode from materials with low resistance and high work function. Mainly in quantum dot sensitized solar cells, the is redox pair, and the platinum, gold, and cobalt sulfide are used as the counter electrode. We used three of them in \cePbS/\ceCdS co-sensitized solar cells, and we investigated their effect on the efficiency of this particular cell in the experimental section.
In the simulation section of this paper, after investigation the effect of different quantum dots on the optical and electrical properties of sensitized solar cells with one or two types of QDs, we optimized the size of QDs for the cell with the highest predicted efficiency. As we describe in the Experimental section, we fabricated this solar cell in the laboratory and investigated the effect of different electrodes on its efficiency.
2 Simulation method
If the wavelength of the incident light is less than or equal to the size of the structure, we will no longer be able to use the ray optics analysis methods for obtaining accurate solutions. Therefore, we will need a new optical approach to provide the correct and expected response. For optical simulation, we used the method Finite-difference time-domain (FDTD) because this method can solve Maxwell’s equations directly in the time domain, thereby providing accurate broadband solutions to electromagnetic wave propagation and scattering problems ccapouion . FDTD is a vector-based approach that provides users with information about frequency and time domains and provides a different perspective on issues and applications in electromagnetism and photonics. The FDTD method has been one of the successful methods that do not use matrix inversion, and due to its purely computational nature, the FDTD is free from linear algebra problems that limit other frequency domain analysis methods to one million unknowns chen2004electrical . Hence, models with one billion unknowns are implemented for FDTD, and in theory, there is no high limit on the number of unknowns chen2004electrical . The sources of error in the FDTD method are well known and can be reduced for more accurate answers. Therefore, only a single run of the simulation can achieve a system frequency response over a wide range. The FDTD method is a systematic one, and the analysis of a new structure is reduced to a networking problem by this method, and no need to rewrite complex integral equations tafloval .
As the name implies, the time-domain finite difference method is done in the time domain. So when a simulation is run, the Maxwell equations are, in fact, solved in the time domain to obtain E (t) and H (t). In FDTD Method we solve Maxwell’s equations by dividing the electric and magnetic fields, which are initially continuous functions of time, and obtain the fields in time that we briefly represent with n using step-time equations (see Eqs (1) and (2) xu2014photonics ).
| (1) | |||
| (2) |
Where is the electrical permittivity, and is magnetic permeability. Using Eqs (1) and (2) and having the primary electric field, we can calculate the final value of the electric and magnetic fields. But most of the time we are looking for an electric field in terms of frequency. A single-phase or continuous-wave field in a steady-state should be obtained from the electric field in terms of the Fourier transform time during the simulation as Eq.(3) xu2014photonics . Consequently, by taking the Fourier transform of the electric field in the time domain during the simulation, the electric field will be obtained at any particular frequency or equivalent in any specific wavelength.
| (3) |
Eq.(4) can also be used to calculate the power absorbed by the cell per unit volume per frequency gross2016theoretical . To calculate it, we only need to know the electric field intensity and the imaginary part of the electrical permittivity of the material.
| (4) |
The number of photons absorbed per unit volume per frequency can be calculated by dividing the absorption power in that frequency by the energy of each photon in the same frequency by Eq. (5) xu2014photonics .
| (5) |
If we assume each absorbed photon produces an electron-hole pair, the rate of electron-hole production can be obtained by integrating Eq. (5) over the entire simulated spectral region xu2014photonics .
| (6) | |||
| (7) |
By solving the equations of drift and diffusion for carriers, given separately for electrons and holes by Eqs.(8) and (9), and by considering the continuity equations, the production rate and the recombination rate for each carrier, we can obtain a voltage-current diagram of solar cells xu2014photonics .
| (8) | |||
| (9) |
where represents the electron’s charge, and are the mobility of electrons and holes, , and are the densities of electrons and holes, respectively. is the electric field, and are the diffusion coefficients of electrons and holes, respectively. Efficiency can then be calculated using Eq.(10) luque2011handbook :
| (10) |
where is the power intensity of the incident light (100 ) and Fill Factor is defined by Eq. (11) luque2011handbook .
| (11) |
where is the maximum power of a photovoltaic cell, is short circuit current density and is open circuit voltage.
2.1 The purpose of simulating solar cells
With the goal of reducing production costs and increasing the efficiency of solar cells, research on solar cells is increasingly focused on new solar cell design concepts, including nanostructured solar cells. Solar cell simulation is necessary to predict the behavior of these devices. As the complexity of the design of photovoltaic cells increases, it becomes difficult to obtain analytical solutions to describe their performance. In a real cell, non-ideal processes such as surface and volume recombination of carriers reduce the efficiency of solar cells. A combination of optical and electrical simulations that considers these non-ideal processes is essential to simulate solar cells more accurately.
2.2 Simulation of the effect of quantum dot type on absorption and electrical characteristics of QDSSCs
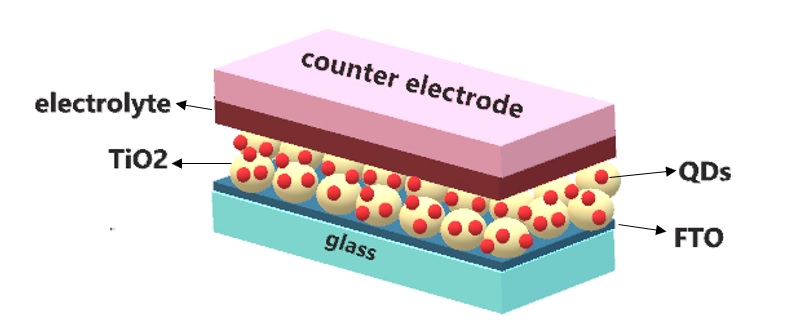
The usual structure of these cells is \ceFTO / \ceTiO2 / \ce QDs / \ceelectrolyte / \cecounter electrode as shown in the Fig. 1. The active area of these cells includes \ceTiO2 and quantum dots. Quantum dots are the major absorbers of sunlight and excitons are produced after absorbing light using QDs. Photocurrent is formed by the transfer of electrons to the \ceTiO2 anode lee2016electron . Based on the previously described relationships, we simulated the solar cells with different sensitizers.
For quantum dot sensitized and dye-sensitized solar cells, the best \ceTiO2 layer thickness is thicktio . We optimized the \ceTiO2 layer thickness for all QDSSCs, which we discuss in the simulation section, to get the most efficiency. The result is shown in Fig. 2, which confirms the access to the highest efficiency at approximately .
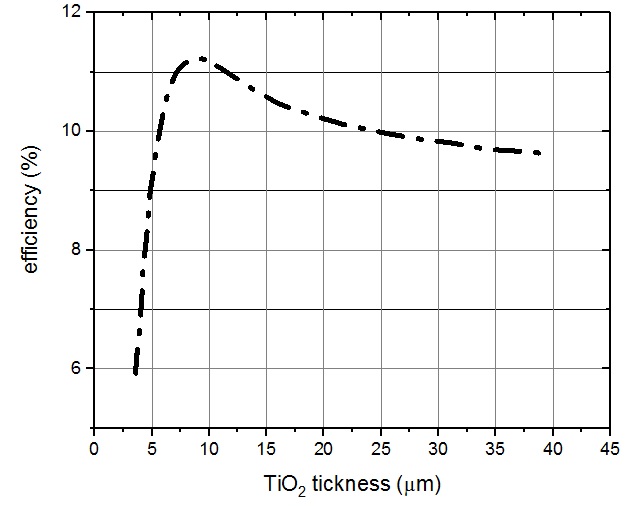
Although the open circuit voltage decreases with increase in thickness of \ceTiO2 layer due to increase in electron diffusion length to the electrode, the short-circuit photocurrent density () increases with film thickness due to enlargement of surface area domtau2017effects . When the thickness of the \ceTiO2 layer increases over an optimum quantity, the carrier recombination rate increases and the short circuit current drops, Which has a negative effect on cell efficiency. In the simulation, we consider the layer thickness and discuss the effect of different quantum dots as sensitizer on the cell characteristics.
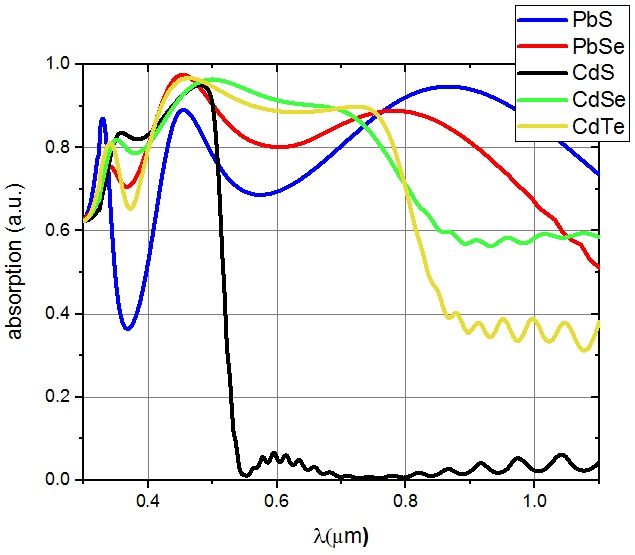
We performed the calculations to obtain the absorption spectrum of cells according to the described equations and the absorption spectrum of QDSSCs with different quantum dots in wavelengths between 300 nm and 110 nm are shown in Fig. 3. Among these nanomaterials, \cePbS and \cePbSe can greatly increase the rate of electron-hole production due to the expansion of the absorption band towards the infrared region. Thus, the current density of cells using these materials should be more than other cells.
As can be seen in the diagram of the current density-voltage of these cells (see Fig. 4), the \cePbSe and \cePbS quantum dots have low despite their very good light absorption, due to the low band-gap. The \ceCdTe, \ceCdS and \ceCdSe quantum dots have higher due to the higher band-gap and thus the accumulation of more energetic electrons.

The cells characterization results are summarized in Table 1, which shows that \ceCdSe has the highest efficiency.
| \cePbS | ||||
|---|---|---|---|---|
| \cePbSe | ||||
| \ceCdS | ||||
| \ceCdSe | ||||
| \ceCdTe |
2.3 Co-sensitized solar cells
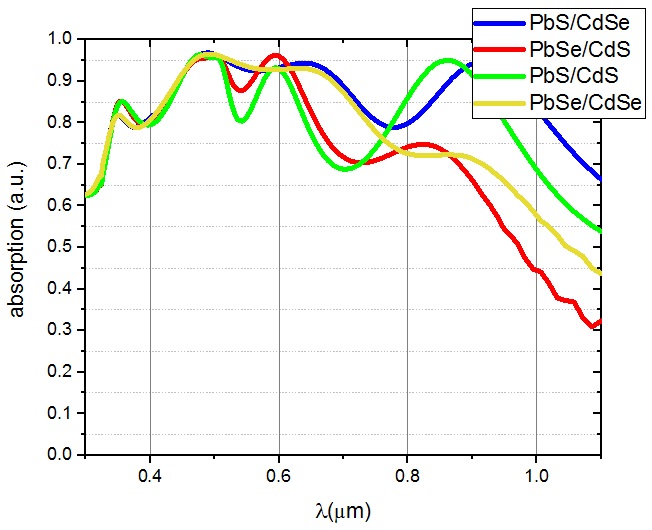
By using two types of QDs, the absorption and efficiency of the solar cell can be controlled by two substances. We performed the calculations to obtain the absorption spectrum of co-sensitized solar cells with different pairs of QDs, and the absorption spectrum of them in wavelengths between 300 nm and 110 nm are shown in Fig. 5. By comparing Fig. 3 and Fig. 5, it can be concluded that using two different sensitizers, one of them is selected from compounds with small band-gap and the other from compounds with larger band-gap, it increases the absorption of the cell.
It has been shown experimentally that in the presence of polysulfide electrolyte, photocurrent of sensitized \ceTiO2 single crystals by \cePbS has a quantum efficiency greater than one electron per photon li2013efficient . However, as mentioned, the cell made only with this material has low . The characterization results for co-sensitized cells are summarized in Table 2, which shows that the \cePbS / \ceCdS sensitized solar cell has higher than \cePbS sensitized solar cell. Fig. 6 shows the current density-voltage of cells sensitized by two types of quantum dots.
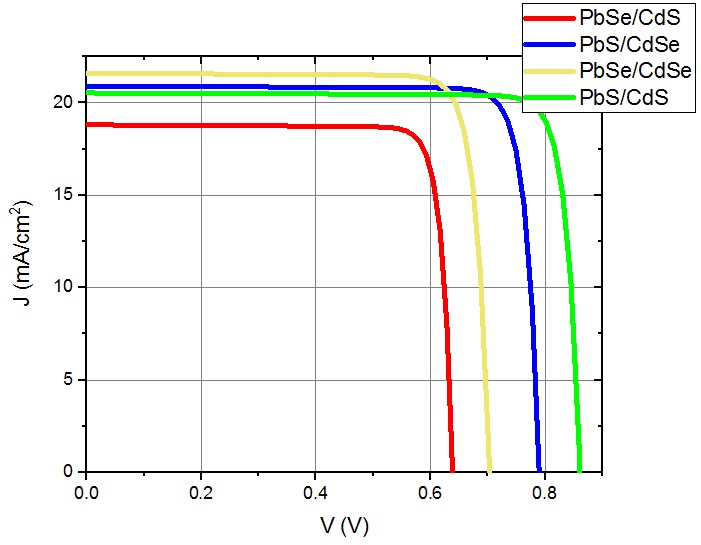
In co-sensitized solar cells that one type of QDs is selected from the \cePbS and \cePbSe compounds to increase the rate of carrier production by extending the absorption range to the infrared region. The other type is selected from compounds by band-gap more than 1 eV to improve the in addition to increasing the absorption at shorter wavelengths, which can achieve higher efficiency than sensitized solar cells with one type of quantum dot. Our simulation results show the highest efficiency for a sensitized cell using \cePbS and \ceCdS. So we chose this cell for the experimental section.
| \cePbSe / CdS | ||||
|---|---|---|---|---|
| \cePbS / CdSe | ||||
| \cePbSe / CdSe | ||||
| \cePbS / CdS |
In the all simulations, quantum dots are considered dome-shaped Which randomly with different sizes are arranged on the \ceTiO2. The refractive index for QDs can be calculated using Eq. (12) that N in this equation is defined as . and are real and imaginary part of refractive index sabaeian2012size .
| (12) |
where , is defined as . , and are linear, second order, and third order susceptibilities, respectively. is a linear x-polarized monochromatic electric field propagate along the z direction (see Eq. (13)) sabaeian2012size .
| (13) |
The relative refractive index change and absorption coefficient of medium can be calculated using Eqs. (14) and (15) vahdani2010intersubband .
| (14) | |||
| (15) |
where is the vacuum permeability and is the real part of permittivity.
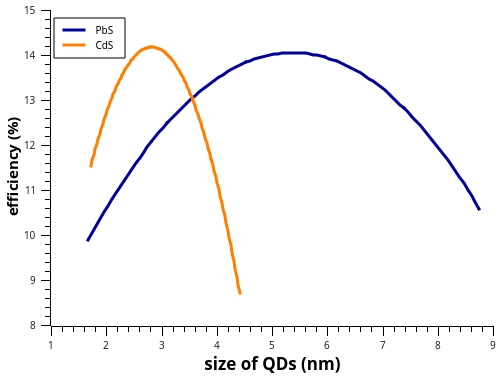
After that we simulated QDs of a certain size instead of different sizes that are randomly positioned on \ceTiO2 and optimized the size of QDs for \cePbS/\ceCdS co-sensitized solar cell. Fig. 7 shows the results of this optimization and we see that the highest efficiency is obtained with 5.5 nm \cePbS QDs and 2.5 nm \ceCdS QDs.
3 Experimental methods
3.1 Anode preparation
FTO (Fluorine-Tin-Oxide (FTO) Coated Glass Plates; sheet resistance / ) were used as substrates and pretreated by rinsing in an ultrasonic bath of detergent and acetone for 10 and 20 minutes in turn, then rinsing with a large amount of deionized water and ethanol, and at last dried with nitrogen gas. Transparent titanium dioxide (TiO2) paste was applied to substrates using the doctor-blade method. \ceTiO2 nanoparticles were in the anatase phase, with an average size of . The nanoporous nature of the \ceTiO2 layer provides a high surface area, which can increase the QDs adsorption and then high photocurrent generation. After the application of transparent \ceTiO2 paste, the substrates were heated at for 0.5 h. Reflector anatase \ceTiO2 paste after that was applied on the previous layer by the same method, and the deposited photoanodes were heated at for 0.5 h. This material provides a high scattering layer as a reflector that increases light harvesting and photocurrent.
For deposition of \cePbS and \ceCdS quantum dots on \ceTiO2 electrode we used successive ionic layer adsorption and reaction (SILAR) method. The electrode first dipped in a 0.02 M \cePb(NO3)2 aqueous solution for 30 s, rinsed with deionized water and then dipped in 0.02 M \ceNa2S aqueous solution for another 30 s followed by rinsing which was termed as one SILAR cycle. The next step is the deposition of \ceCdS quantum dots. Similarly, for the \ceCdS nanoparticles layer, the electrode first dipped in a 0.2 M \ceCd(NO3)2 aqueous solution for 5 min, rinsed and then dipped in 0.2 M \ceNa2S aqueous solution for another 5 min.
The number of immersion cycles can control the size of quantum dots. The method is designed to increase the particle size of a monolayer during an immersion cycle. The optimal number of cycles can be obtained by repeating the experiment several times to maximize cell efficiency. In this study, layers with different cycles were used to sensitize the \ceTiO2 electrode once only with \cePbS quantum dots, once only with \ceCdS quantum dots and then by combining two types, with \cePbS/\ceCdS order as hybrid samples. Four sensitized electrode specimens were thus obtained for use in cell fabrication.
3.2 Electrolyte preparation
In dye-sensitized solar cells, platinum is typically used as the counter electrode and iodide/triiodide as the oxidation/reduction pair, but unfortunately, the well-known pair of is not compatible with low band-gap semiconductors and lead to rapid corrosion of these materials ruhle2010quantum . For QDSSCs, other pairs such as cobalt compounds, ferrocene/ferrocenium, and polysulfide seem to work wellsapp2002substituted ; tachibana2008performance . Although cobalt compounds are suitable for low energy band-gap semiconductors, this is good for low light intensity cases and has a negative effect on cell function in high light intensity cases.
Polysulfide electrolyte were prepared by mixing suitable quantities of \ceNa2S, \ceS and \ceKCl powders in 3:7 water/methanol solution. Then we put it on the magnetic stirrer for two hours to obtain a uniform solution. The color of the solution changes from yellow to orange after stirring.
3.3 Counter electrode
Different materials and different deposition methods were used to prepare the counter electrodes. For this purpose, the \ceFTO is being washed in the same way as in the preparation of the substrates described above. The method for deposition of \cePt and \ceAu was physical vapor deposition (PVD) at the pressure of millibars, and the thickness of the deposited layer was of 100 nm. Another approach was to use \ceCoS nanoparticles, which we applied to the pre-prepared \ceFTOs using the SILAR method. The counter electrodes were prepared by first dipping a clean FTO in 0.5 M \ceCo(CH3COO)2 aqueous solution for 30 s, rinsed with deionized water, and then dipped in 0.5 M \ceNa2S aqueous solution for another 30 s followed by rinsing. This constituted one cycle, and the process was repeated four times.
The sensitized \ceTiO2 electrode was then combined with the counter electrode in the presence of polysulfide electrolyte to assemble a typical QDSSC. Photocurrent-voltage (I-V) characteristics of the QDSSCs were measured using a Keithley 2400 electrometer under illumination from xenon lamp at the intensity of .
3.4 Determination of optimal SILAR cycles for deposition of \cePbS and \ceCdS quantum dots
The prepared \ceTiO2 layer electrodes were sensitized using \cePbS and \ceCdS quantum dots during different cycles. We then integrated these electrodes with the \cePt counter electrodes, and after injecting the electrolyte into them, we characterized the fabricated cells. Fig. 8 shows the voltage-current density of experimental samples that are sensitized by these two types of quantum dots.
Characteristics of these samples, such as efficiency, open-circuit voltage, and short circuit current density and filling factor, were also measured and calculated, as shown in Table 3.

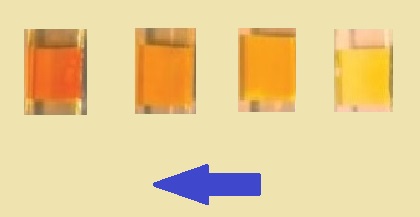
As the number of SILAR cycles in \cePbS deposition changes, the color of the photoelectrodes changes from pale brown to black. According to the results in Table 3, the number of optimal cycles in the deposition of \cePbS is 5, and in the deposition of \ceCdS is 11 for which the maximum cell efficiency was obtained. With the increasing number of SILAR cycles for \ceCdS, the color of the electrodes changes from pale yellow to orange (see Fig. 9).
| \cePbS(X) | \ceCdS(Y) | ||||
|---|---|---|---|---|---|
The results show that in photoanode sensitized with quantum dots by the SILAR method, as the number of solar cycles increases, the short-circuit current density, open-circuit voltage, and subsequently the cell efficiency increase until the optimized cycles, and then they decrease. When quantum dot deposition is performed with a low number of SILAR cycles, the quantum dots cover the \ceTiO2 layer partially, and an increase in the number of deposition cycles results in complete \ceTiO2 layer coverage. If sensitization is performed over an optimal number of cycles, this increase in the cycle reduces cell performance, which can be attributed to poor charge injection and appears to be due to reduction of the quantum effect of larger quantum dots, which reduces the repulsive force for charge injection (electrons and holes) els7 , increasing the number of recombinant traps in large quantum dots els6 and prevention of oxidation/reduction ions transfer due to blocking of pores of the structure by quantum dots jung2012zns .
3.5 Investigation of the effect of different counter electrodes
Generally, the efficiency of QDSSCs is below 5%. But simulation and theory studies have shown that the efficiency of these cells can reach up to 44% hanna2006solar . The recombination of carriers at the boundary of the electrolyte quantum dots and the low activity of some of the counter electrodes in the presence of some electrolytes are two major reasons for this low efficiency fan2009highly . Gold and platinum are commonly used as counter electrodes and polysulfide electrolytes in QDSSCs. But the conductivity of these electrodes is reduced by the absorption of electrolyte sulfur atoms miller1976semiconductor . Therefore, metal sulfides such as \ceCoS are suitable substitutes for \ceAu and \cePt, which in addition to having high electrocatalytic activity, can transfer holes much better than these materials and improve cell efficiency yang2010electrocatalytic . The Hades Research Group showed that the short-circuit current density is and in the presence of polysulfide electrolytes for \ceCoS and \cePt, respectively hodes1980electrocatalytic . We investigated a QDSSC with \cePbS and \ceCdS sensitizers for the three different electrodes \cePt, \ceAu and \ceCoS which current-voltage-density diagram is shown in Fig. 10.
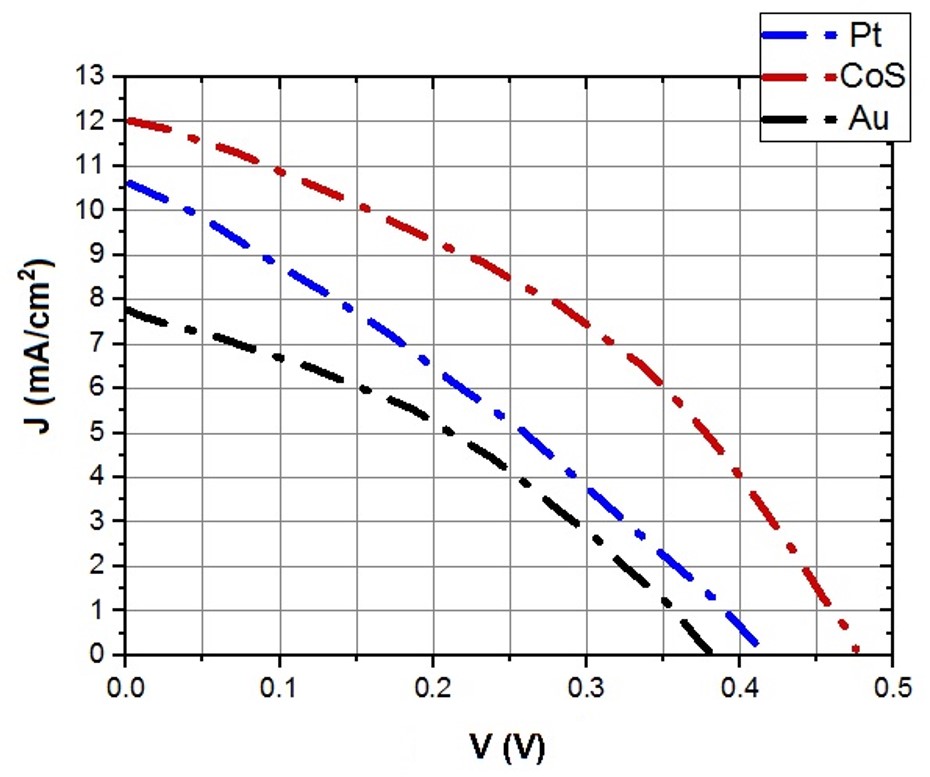
Table 4 shows the results of the characterization of these three cell types. Power conversion efficiency using \ceCoS increased by about 70% compared to \cePt and by about 100% compared to \ceAu. By comparing the current-voltage density diagrams of these three types of cells, it can be seen that the electrodes based on these two metals react strongly with sulfide ions, thereby greatly reduce their catalytic activity and conductivity. However, the \ceCoS electrode is more stable and efficient in the presence of polysulfide electrolyte, and its cost is less than the other two types.
| \ceAu | ||||
|---|---|---|---|---|
| \cePt | ||||
| \ceCoS |
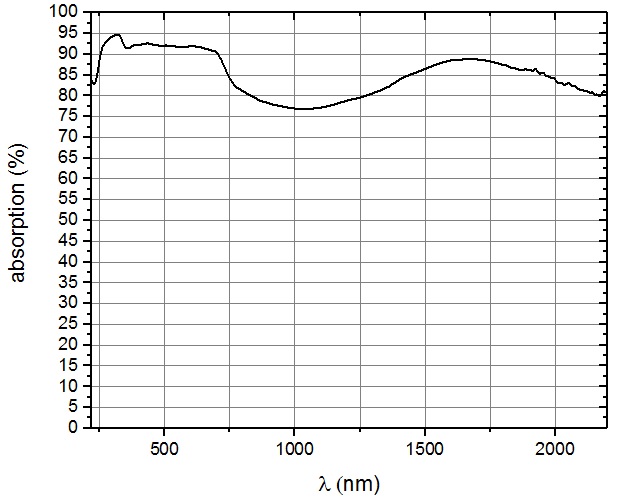
3.6 absorption spectrum of Photoanode made by optimized number of SILAR cycles
Fig. 11 shows the absorption spectrum of anode made up of 5 cycles for \cePbS quantum dots and 11 for \ceCdS quantum dots. The cell absorbs more than 80% throughout the sun’s spectrum. With high absorption of infrared spectra, this anode can have a high carrier production rate.
Using X-ray diffraction characterization of the optimized cell anode, the size of the \ceCdS quantum dots for the optimized cell is approximately 2 nm, and the size of the \cePbS quantum dots was about 5 nm. These magnitudes were obtained by using the Debye-Scherrer relation (Eq. 16) yang2005wet :
| (16) |
where is the wavelength x-ray, is FWHM and is a diffused Bragg’s angle.
4 Conclusion
Quantum dot sensitized solar cells with one type of material can achieve more than 12 % efficiency using \ceCdSe. Due to its good band-gap for use in solar cells, it can absorb a wide range of the visible spectrum. Materials with low energy band-gap such as \cePbS and \cePbSe due to their low band-gap have high absorption in the visible and infrared spectrum of light, but cells made with these materials have a smaller because of more recombination of carriers than other materials. Simultaneous sensitizing using two different materials, one with a large band-gap and the other with a small band-gap, can cause the solar cell to absorb more light in the visible, infrared, and ultraviolet spectrum. Although at co-sensitized solar cells, the decreases, overall, the efficiency of this type of cell is higher than a sensitized cell with one type of quantum dot. The co-sensitized cell with the \cePbS and \ceCdS quantum dots has a higher efficiency (Almost 15 %) than the other types of co-sensitized cells due to its higher than and higher than . The experimental method of fabricating solar cells can greatly influence the characteristics of this cell by changing the number of SILAR cycles. The X-ray diffraction results show that by changing the concentration of precursors, the immersion time, and the number of cycles, the size of the quantum dots can be well controlled. A cathode made of \ceCoS, which costs less than platinum and gold cathodes, can increase relative cell efficiency of \cePbS/\ceCdS co-sensitized solar cell up to 80 %. Although the anode made with \cePbS and \ceCdS quantum dots has high absorption, the efficiency of this cell is low, which can be a result of the strongly recombined carriers in this cell.
5 Compliance with ethical standards
Conflict of interest The authors declare that they have no conflict of interest.
References
- (1) M. Graetzel, R.A. Janssen, D.B. Mitzi, E.H. Sargent, Nature 488(7411), 304 (2012)
- (2) M. Gratzel, nature 414(6861), 338 (2001)
- (3) M.C. Beard, J.M. Luther, O.E. Semonin, A.J. Nozik, Accounts of chemical research 46(6), 1252 (2013)
- (4) I.J. Majoros, B.B. Ward, K.H. Lee, S.K. Choi, B. Huang, A. Myc, J.R. Baker, in Progress in molecular biology and translational science, vol. 95 (Elsevier, 2010), pp. 193–236
- (5) K. Stadelmann, A. Elizabeth, N.M. Sabanés, K.F. Domke, Vibrational Spectroscopy 91, 157 (2017)
- (6) C.A. Leatherdale, W.K. Woo, F.V. Mikulec, M.G. Bawendi, The Journal of Physical Chemistry B 106(31), 7619 (2002)
- (7) P. Yang, Q. Tang, C. Ji, H. Wang, Applied Surface Science 357, 666 (2015)
- (8) D.N. Congreve, J. Lee, N.J. Thompson, E. Hontz, S.R. Yost, P.D. Reusswig, M.E. Bahlke, S. Reineke, T. Van Voorhis, M.A. Baldo, Science 340(6130), 334 (2013)
- (9) M. Wolf, R. Brendel, J. Werner, H. Queisser, Journal of Applied Physics 83(8), 4213 (1998)
- (10) A. Mishra, M.K. Fischer, P. Bäuerle, Angewandte Chemie International Edition 48(14), 2474 (2009)
- (11) Y. Li, L. Wei, X. Chen, R. Zhang, X. Sui, Y. Chen, J. Jiao, L. Mei, Nanoscale research letters 8(1), 67 (2013)
- (12) İ.R. Çapoğlu, A. Taflove, V. Backman, Optics express 16(23), 19208 (2008)
- (13) W.K. Chen, The electrical engineering handbook (Elsevier, 2004)
- (14) A. Taflove, S.C. Hagness, Computational electrodynamics: the finite-difference time-domain method (Artech house, 2005)
- (15) Y. Xu, J. Murray, J.N. Munday, in Quantum Dot Solar Cells (Springer, 2014), pp. 349–382
- (16) P. Gross, N. Javahiraly, N. Geraldini Sabat, T. Cottineau, E. Savinova, V. Keller, Applied Physics Letters 109(15), 153903 (2016)
- (17) A. Luque, S. Hegedus, Handbook of photovoltaic science and engineering (John Wiley & Sons, 2011)
- (18) J.W. Lee, S. Makuta, S. Sukarasep, J. Bo, T. Suzuki, T. Nakayama, H. Suematsu, K. Niihara, Y. Tachibana, Journal of Photopolymer Science and Technology 29(3), 357 (2016)
- (19) P. Selvaraj, H. Baig, T.K. Mallick, J. Siviter, A. Montecucco, W. Li, M. Paul, T. Sweet, M. Gao, A.R. Knox, et al., Solar Energy Materials and Solar Cells 175, 29 (2018)
- (20) D. Domtau, J. Simiyu, E. Ayieta, L. Nyakiti, B. Muthoka, J. Mwabora, Surface Review and Letters 24(05), 1750065 (2017)
- (21) M. Sabaeian, A. Khaledi-Nasab, Applied Optics 51(18), 4176 (2012)
- (22) M. Vahdani, G. Rezaei, Physics Letters A 374(4), 637 (2010)
- (23) S. Rühle, M. Shalom, A. Zaban, ChemPhysChem 11(11), 2290 (2010)
- (24) S.A. Sapp, C.M. Elliott, C. Contado, S. Caramori, C.A. Bignozzi, Journal of the American Chemical Society 124(37), 11215 (2002)
- (25) Y. Tachibana, K. Umekita, Y. Otsuka, S. Kuwabata, Journal of Physics D: Applied Physics 41(10), 102002 (2008)
- (26) T. Sogabe, Q. Shen, K. Yamaguchi, Journal of Photonics for Energy 6(4), 040901 (2016)
- (27) Z. Sun, G. Sitbon, T. Pons, A.A. Bakulin, Z. Chen, Scientific reports 5, 10626 (2015)
- (28) S.W. Jung, J.H. Kim, H. Kim, C.J. Choi, K.S. Ahn, Current Applied Physics 12(6), 1459 (2012)
- (29) M. Hanna, A. Nozik, Journal of Applied Physics 100(7), 074510 (2006)
- (30) S.Q. Fan, D. Kim, J.J. Kim, D.W. Jung, S.O. Kang, J. Ko, Electrochemistry communications 11(6), 1337 (2009)
- (31) B. Miller, A. Heller, Nature 262(5570), 680 (1976)
- (32) Z. Yang, C.Y. Chen, C.W. Liu, H.T. Chang, Chemical Communications 46(30), 5485 (2010)
- (33) G. Hodes, J. Manassen, D. Cahen, Journal of the Electrochemical Society 127(3), 544 (1980)
- (34) Y.J. Yang, B.J. Xiang, Journal of crystal growth 284(3), 453 (2005)