The Splash without a merger 111Released on November, XXth, 2019
Abstract
The Milky Way’s progenitor experienced several merger events which left their imprints on the stellar halo, including the Gaia-Sausage/Enceladus. Recently, it has been proposed that this event perturbed the proto-disk and gave rise to a metal rich ([Fe/H] ), low angular momentum ( km/s) stellar population. These stars have dynamical and chemical properties different from the accreted stellar halo, but are continuous with the canonical thick disk. In this letter, we use a hydrodynamical simulation of an isolated galaxy which develops clumps that produce a bimodal thinthick disk chemistry to explore whether it forms such a population. We demonstrate clump scattering forms a metal-rich, low angular momentum population, without the need for a major merger. We show that, in the simulation, these stars have chemistry, kinematics and density distribution in good agreement with those in the Milky Way.
1 Introduction
Selecting a pure sample of stars in either the stellar halo or in the thick disk in the Solar Neighbourhood is complicated by their significant overlap in both their velocity and metallicity distributions. A common approach for selecting local stellar halo stars uses a kinematic cut to select high transverse velocity stars. By selecting stars with km/s, one expects a negligible contamination by thick disk stars. However, with the high quality data provided by Gaia (Gaia Collaboration et al., 2016, 2018a), recent studies have shown that such a kinematic cut still leaves a population of stars with thick disk chemistry (Gaia Collaboration et al., 2018b; Haywood et al., 2018; Amarante et al., 2020). This imprint is also seen when different kinematic criteria are chosen (e.g. Helmi et al. 2018), challenging our understanding of the formation of the Milky Way’s thick disk.
Furthermore, Di Matteo et al. (2019) and Amarante et al. (2020) found that many counter-rotating stars in the Solar Neighbourhood are too metal-rich to be considered part of the accreted halo. In particular, Di Matteo et al. (2019) noted a low angular momentum population with thick disk chemistry (see, e.g., their figure 13) and proposed that the classical Milky Way (MW) inner-halo is actually composed of two stellar populations: i) heated stars from the thick disk (referred by them as the “Plume”), where the heating mechanism is associated with a major merger event named the Gaia-Sausage/Enceladus222For short, we will just refer to it as the Gaia-Sausage.(Belokurov et al. 2018; Helmi et al. 2018); ii) accreted stars from the Gaia-Sausage.
Belokurov et al. (2019) (hereafter B19), using the Sanders & Das (2018) catalogue, disentangled the aforementioned low angular momentum structure from the canonical thick disk and stellar halo. They suggested that this structure, which they termed the Splash, is chemically and dynamically distinct from the known stellar populations in our Galaxy. Nonetheless, its formation must be linked to the thick disk as there is a smooth transition between the two populations in the kinematic-metallicity space. Moreover, they found Splash-like structures in hydrodynamical simulations where the host galaxy underwent a major merger. Therefore they concluded the proto-galactic disk of the MW was likely heated during the Gaia-Sausage event about Gyr ago, in agreement with other studies (e.g. Di Matteo et al., 2019; Mackereth et al., 2019; Gallart et al., 2019), and thereby formed the Splash. Finally, they argued that the thick disk formation occurred before, during and up to 2 Gyr after the merger.
On the other hand, Clarke et al. (2019) presented a hydrodynamical simulation of an isolated galaxy that formed a thick disk purely via internal evolution driven by clump formation. These clumps dynamically heat the disk creating two chemically distinct disk components, with an overall double-exponential vertical profile (Beraldo e Silva et al., 2020), similar to the MW’s thin and thick disks. They also showed that the model’s clumps are similar to those observed in high redshift galaxies. Therefore a question that naturally arises is whether clumps are able to form stars with properties similar to the Splash, or whether the Splash stars uniquely need to form in a major merger event. In the following sections we demonstrate that clumps in the MW progenitor can produce stars with very similar kinematic and chemical properties as the observed Splash stars. This paper is organized as follows: Section 2 and 3 present the details of the simulated galaxy and shows its dynamical and chemical features, respectively. Section 4 discusses the implications of our results.
2 Simulation
The simulation used in this paper is described in detail in Clarke et al. (2019). The initial conditions are characterized by a spherical hot gas corona embedded in a dark matter halo with a Navarro-Frenk-White (Navarro et al., 1997) density profile with virial radius kpc and mass of . The gas has an initial net rotation and cools via metal-line cooling (Shen et al., 2010). It settles into a disk, and stars form wherever the temperature drops below 15,000 K and the density exceeds 1 . Feedback by supernova explosions follows the blastwave implementation of Stinson et al. (2006), with thermal energy being injected to the interstellar medium with an efficiency of . The feedback of asymptotic giant branch stars is also taken into account. Gas phase diffusion uses the method of Shen et al. (2010).
These initial conditions are self-consistently evolved for 10 Gyrs with the smooth particle hydrodynamics+N-body tree-code gasoline (Wadsley et al., 2004). As shown by Clarke et al. (2019), the metal-line cooling results in the formation of clumps during early times of the simulated galaxy. At the end of the simulation, the galaxy presents a chemical bi-modality and geometric properties very similar to those observed for the MW (as shown by Beraldo e Silva et al., 2020). In particular, a thick disk, composed of old, -rich stars is formed333In the simulation, the [/Fe] abundance is tracked by [O/Fe].. This simulation evolves as an isolated galaxy, i.e. without any merger that could produce the metal-poor and high radial velocity dispersion population associated with the Gaia-Sausage observed for the MW (see Belokurov et al., 2018; Helmi et al., 2018) or any stellar halo component.
For comparison, we also ran another simulation from the same initial conditions and with the same procedure, except for the supernova feedback efficiency, which was set to . This high feedback efficiency inhibits the formation of clumps and the simulation does not form a chemical or a geometric thick disk (Beraldo e Silva et al., 2020). We refer to this simulation as the non-clumpy simulation. This allows us to study the role of the clumps on the formation of the different populations in the simulation.
2.1 Simulated Solar Neighbourhood
In order to reduce contamination from thin disk stars, B19 selected stars in the region . For reliable comparisons to their results, we apply a similar cut to the simulation data and define our mock Solar Neighbourhood as all star-particles in the region and kpc, where is the cylindrical radius centered at the simulated galaxy center, and is the height from the simulated galaxy plane. Unless explicitly mentioned, all our results are based on this geometrical slice. We have tested using the same range as B19 and the difference is the reduced amount of thin disk star-particles. Nonetheless the trends between the simulated thick disk and Splash region discussed below are the same. Finally, throughout the paper the velocities are given in cylindrical coordinates centered on the simulated galaxy center; , and are positive in the direction of the galaxy centre, galaxy rotation and angular momentum vector, respectively.
3 Results
We now compare the kinematics and chemistry of the model to the results of B19. As described in Section 2, our simulation self-consistently evolves as an isolated galaxy and thus has no accreted stellar halo. Therefore it has a lower fraction of metal-poor and of counter-rotating stars than the MW. For better comparison with the observational results, in most of our figures we adopt similar scales and colour schemes as those used by B19. Moreover, whenever we use data from Sanders & Das (2018)444http://www.ast.cam.ac.uk/~jls/data/gaia_spectro.hdf5 we select stars with the same spatial selection, small velocity errors ( km/s), low [Fe/H] uncertainty () and accurate parallax () as in B19.
3.1 Chemistry-kinematics features
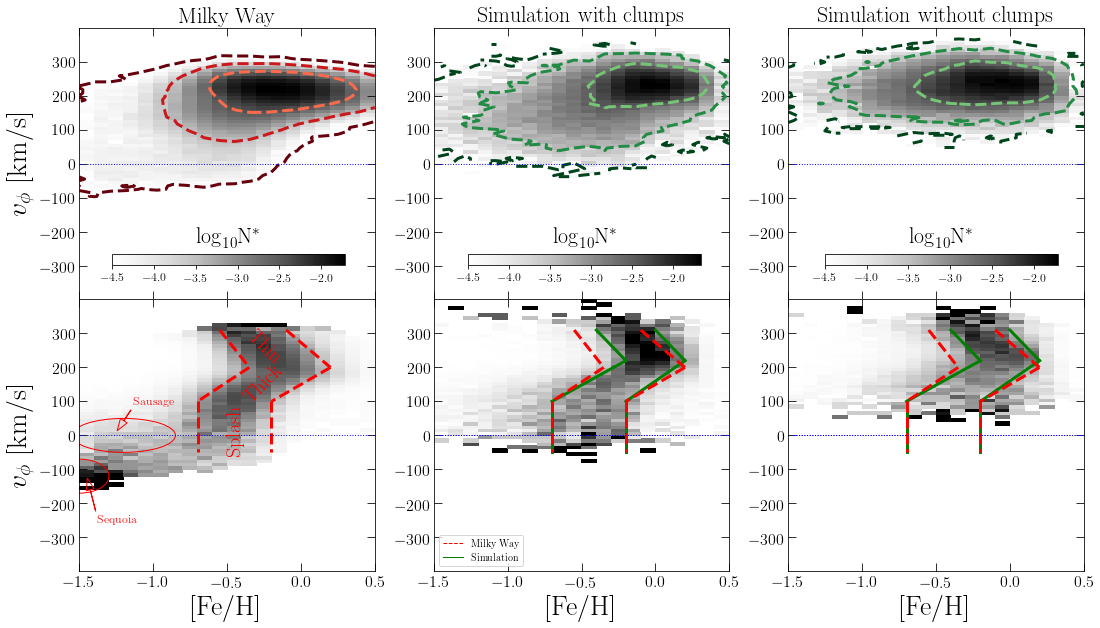
Fig. 1 top row shows the absolute density plot in the [Fe/H]- plane for both the MW (left) and the simulations (center and right). Each bin is divided by the total number of stars/star-particles following the selection criteria in the MW/simulations. As already discussed in B19, the MW has a significant amount of metal-rich ([Fe/H]), low angular momentum ( km/s) stars (see, e.g., Nissen & Schuster 2010; Fernández-Alvar et al. 2019). The simulation with clumps also has a significant amount of such metal-rich low angular momentum stars, but lacks a significant amount of retrograde stars, mainly due to the absence of accreted stars555We note that not all retrograde stars with [Fe/H]-1 observed in the MW are accreted., and has a slight overdensity at [Fe/H] and km/s compared to MW (but see B19 figure 1, where, e.g., the left panels clearly shows stars in this region). For comparison, the simulation without clumps, right panel, lacks a significant low angular momentum population.
The bottom row of Fig. 1 shows the row-normalised density plot in the [Fe/H]- plane for both the MW (left) and simulations (center and right). This normalisation has the advantage of enhancing the known velocity-metallicity correlation for both the thin and thick disk, where the former (latter) has a negative (positive) gradient with [Fe/H]. The red contours in the left panel indicate the different populations in the MW, as identified by B19, where the Splash is defined as the over-density seen at the low angular momentum ( km/s) and relatively metal-rich ([Fe/H]) region. The two known stellar halo over-densities, Gaia-Sausage (Belokurov et al., 2018; Helmi et al., 2018) and Sequoia (Barbá et al., 2019; Myeong et al., 2019), are also indicated. Although the Splash region is defined ad hoc in this plot, it is significantly different from the accreted stellar halo and the classical thick disk (defined as the -rich disk, e.g. Bensby et al. 2003; Hayden et al. 2017) regions, as shown in B19 and later in this work.
The bottom-middle panel of Fig. 1 shows the results from the simulated clumpy galaxy. The same trends observed in the MW’s thin and thick disk are also observed here. In this panel, the red dashed lines are those defined by B19 with the MW data, while the green solid lines are defined from the simulation. The narrowness of the bands for the thin and thick disks in the simulation can be understood as being due to the absence of any observational errors. Nonetheless, the Splash region is exactly the same both in the MW and in the simulation. In the right panel, we show the same plot for the non-clumpy simulation. The solid and dashed red lines are the same as in the middle panel. The trends for the thin and thick disk are not as clear now and this galaxy can be described as having only one disk component (Clarke et al., 2019; Beraldo e Silva et al., 2020). Moreover, it lacks the low angular momentum ( km/s) star particles of the Splash region.
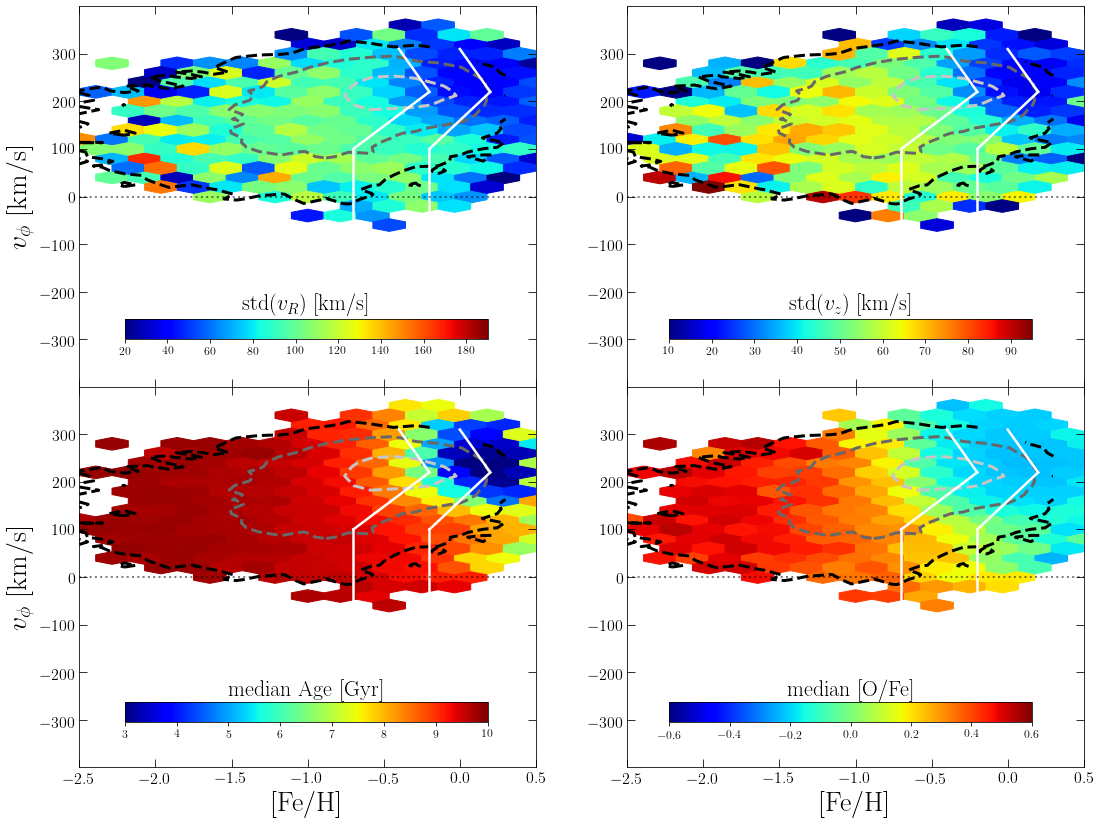
Fig. 2 shows the [Fe/H]- plane for the simulated MW analogue colour-coded according to different properties (see figure 1 of B19 for comparison). The top left panel is colour-coded by dispersion in for each bin. As can be noted, the simulated galaxy has the same trends as in the MW: the thin disk has a mild dispersion and it smoothly increases from the thick disk towards the Splash region. As expected, the large dispersion stars observed for [Fe/H] , associated with the Gaia-Sausage and the Sequoia in the MW, are not present in our simulation as these stars were accreted. As in the MW, a similar trend is also observed for the dispersion in , see top right panel. We stress that not only do trends match between the simulated galaxy and the observed data, but also the velocity dispersion values are very similar.
The bottom panels in Fig. 2 show how the median age and [O/Fe] vary in the [Fe/H]- plane. As in the MW, the thin disk region is mostly comprised of young stars and the disk gets older in its thick component. The oldest stars are located in the Splash region. The thin disk region in our simulation is younger compared with the results in B19; as mentioned in Section 2, the simulation is evolved for only 10 Gyr and thus it will not reflect the same oldest ages as observed in the MW. Nonetheless, the thick disk and Splash region still have similar age gradients compared to the observations. Finally, the trends in [O/Fe] are nicely matched to the [/Fe] trends in the MW, where there is a smooth transition from slightly [O/Fe]-rich for the thick disk to higher values in the Splash region.
Clarke et al. (2019) showed that, in the simulation, a small population of -poor stars forms at the same time as the -rich ones (indeed this is one of the key predictions of the model). We have verified that the publicly available APOGEE-Gaia DR12 catalogue666https://www.sdss.org/dr12/irspec/spectro_data/ indeed confirms that retrograde Splash stars are found both in the -rich and -poor in-situ regions (as defined in Mackereth et al. 2019), supporting our conclusion that scattering by clumps can produce the counter-rotating Splash stars in the MW.
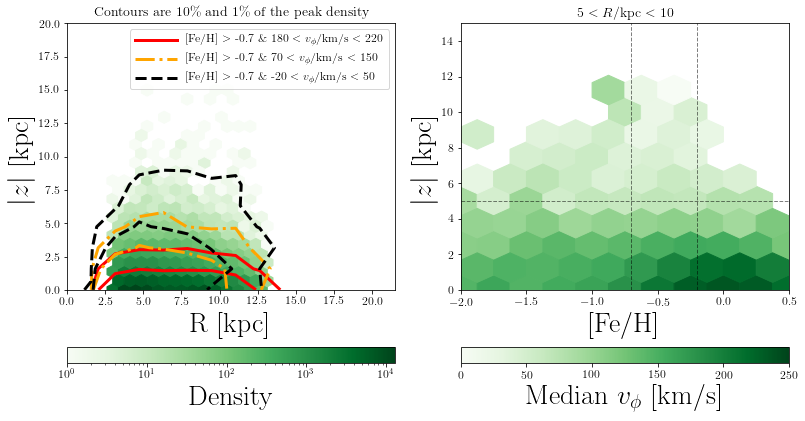
B19 analysed LAMOST K giants (Luo et al., 2015) in order to verify how far from the plane the Splash stars are detected and to determine where the canonical thick disk transitions to the Splash-dominated region. They found that at kpc there is a sharp gradient in median where the low angular momentum Splash stars dominate for higher (see their figure 8). Although the stellar density of the disk in our simulated galaxy decreases faster with compared with the MW’s disk, we are still able to verify the transition region, if any, in the simulation. The left panel in Fig. 3 shows the stellar density in the plane for the simulation. The red and orange curves have the same velocity-metallicity intervals as in B19 and they are a rough representation of the canonical thin and thick disks, respectively. The black dashed curves outline the spatial extent of the Splash stars in our simulation. In order to avoid the tail of the stellar halo distribution, B19 restricted their velocity range to km/s. Even though our simulation does not have an accreted halo, we adopt the same range. We note that both in the simulation and in the MW, the Splash stars extend up to kpc and are also concentrated within kpc.
The right panel in Fig. 3 shows how the median changes in the [Fe/H]- plane. In the Splash metallicity range, defined by the two vertical dashed lines, we note two features similar to those observed in the MW: i. the negative gradient of thick disk’s median with ; ii. a transition at kpc (horizontal dashed line) where the low angular momentum Splash stars start to dominate for larger heights. This reinforces the idea that internal dynamical processes in a clumpy proto-disk can also create Splash stars.
3.2 Simulated Splash number fraction
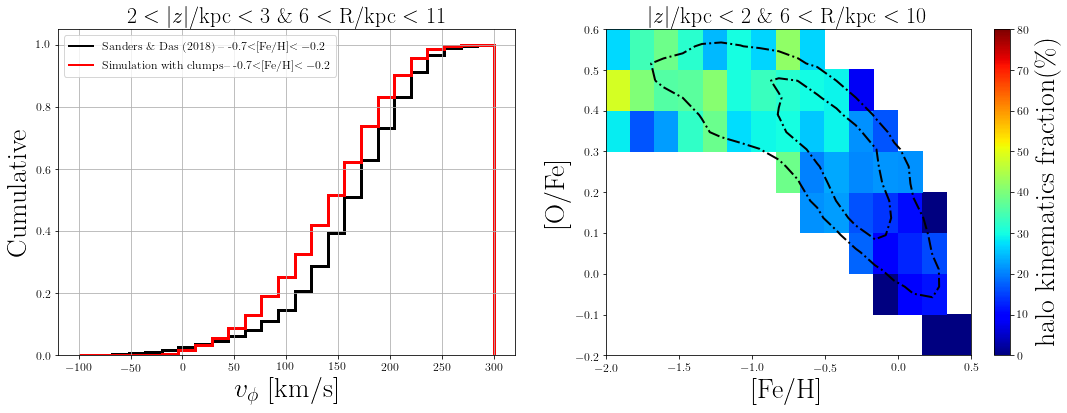
In this subsection, we estimate the Splash-like population in the simulation with clumps and compare with the MW. B19 estimated that in the range /kpc and [Fe/H] the Splash population dominates the tail of the distribution, i.e., km/s. The left panel of Fig. 4 shows the cumulative distribution of for the MW (black) and simulation (red) in the aforementioned metallicity and spatial range: approximately of the stars in the MW have km/s, whereas the simulation with clumps has about of star-particles in the same regime. However, if we scale by the median value for each distribution, the simulation with clumps has of star-particles in the equivalent low angular momentum tail, remarkably similar to the MW.
The right panel of Fig. 4 shows the fraction of star-particles with halo kinematics in the simulation chemical thick disk. We used a spatial range similar to that used in Di Matteo et al. (2019). We also followed their criterion for halo kinematics, km/s, where km/s and it is the velocity at the local standard of rest in the simulation (Clarke et al., 2019). The separation criterion between the thin and thick disks for the simulations follows Clarke et al. (2019). We observe that the simulation follows the same trends as in the MW (see figure 18 in Di Matteo et al. 2019): i. the fraction of halo-like kinematics is in the range where the Splash stars are concentrated; ii. this fraction drops quickly as the metallicity increases. The larger fraction of halo-kinematics stars at [Fe/H]-0.2 in the simulation, compared with the MW, can be due to differences in the details of the later star formation history and/or the selection function of the APOGEE data.
3.3 The age of simulated Splash stars
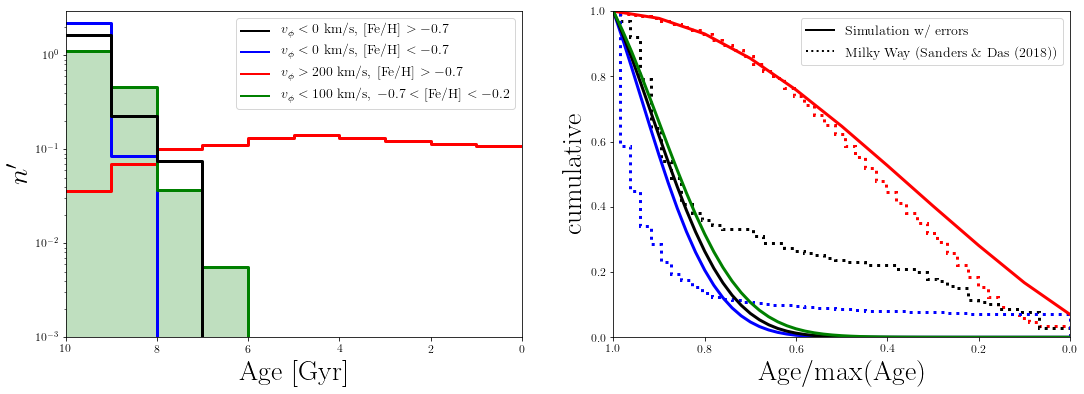
In order to compare the age difference between the accreted halo and the Splash stars, B19 analysed the age distribution of the counter-rotating stars for two distinct metallicity ranges (see their figure 4). The metal-poor ([Fe/H]-0.7) region, corresponding to the accreted halo has a peak at 777Their ages are limited to 12.5 Gyr. Gyr and a sharp drop at Gyr. On the other hand, the age distribution for the Splash stars, -0.7[Fe/H]-0.2, has a slightly younger peak at Gyr and also a sharp drop at Gyr ( of these stars are younger than 10 Gyr). They propose that the Splash is made up of stars from the Galaxy’s proto-disk whose orbits were heated by to the Gaia-Sausage accretion event. Moreover, the star formation for the Splash stars ceased just after the merger, i.e. around 9.5 Gyr ago.
In the left panel of Fig. 5, we show the age distribution in our simulation using the same velocity-metallicity interval as in B19. As already mentioned, our oldest age is 10 Gyr and the fact there is no shift between the metal-poor (blue) and Splash stars (black) curves merely reflects that our simulation represents an isolated galaxy with no old accreted stellar halo. Nonetheless, it is evident that the counter-rotating stars in the simulation are also old and cease to form after 3 Gyr. This fact is qualitatively similar to what is observed in the MW. The red curve in this panel corresponds to the canonical thinthick distribution, km/s and [Fe/H]-0.7. As expected it extends over the full age range in the simulated galaxy in agreement with the observed data. Finally, the green shaded area is the age distribution for the Splash stars defined as in Fig. 1, i.e. km/s and [Fe/H]. Now, the age extends to an extra 1 Gyr, due to the contamination of thick disk, i.e. -rich stars. As shown by Clarke et al. (2019), all the star-particles in the simulation thick disk are older than 6 Gyr. Therefore, our result reinforces the connection between the thick disk and the Splash stars, where the latter could naturally exist in galaxies with a disk dichotomy.
Fig. 5 right panel shows the cumulative distribution for the MW (dotted lines) and the simulation (solid lines) convolved with the median error from the observational data (median Gyr)888We select stars in Sanders & Das (2018) with estimated age error lower than 2 Gyrs.. For a better comparison, we divided the age intervals by the maximum age in the simulation (10 Gyr) and observation (12.5 Gyr). For and [Fe/H] the MW (black dotted line) has a truncated star formation history characterized by: i) approximately of stars are older than , ii) an extended tail towards young ages. B19 associated the truncation with the cessation of the MW’s disc heating during the Gaia-Sausage merger. Similarly to the MW, the simulation also has approximately of stars older than (black and green solid lines). The lack of young Splash-like stars in the simulation is explained by the fact that the clumps, which are responsible for producing the Splash, stop forming after 4 Gyr. The difference between the simulation and the MW, in terms of the extended tail of ages, only happens after both the clumps and the Gaia-Sausage are completed. We also note, by analysing the simulation snapshots, that this old population is already kinematically hot in the first 3 Gyrs of the simulation. Therefore, internal dynamical heating in a MW-like galaxy is enough to heat the primordial disk in its early stages and produce a kinematically hot population with km/s, as shown by the green distribution in Fig. 5.
4 Conclusions
Di Matteo et al. (2019) suggested that the Splash stars (which they refer to as the “Plume”) represent the low angular momentum tail of the thick disk and therefore it is not a distinct component from the MW. On the other hand, B19 argues on the necessity of three components (thin disk, thick disk and Splash) to explain the distribution for [Fe/H] and . Based on their age distribution, they also suggest that the Splash formed only in the early times of the MW, whereas the thick disk had a continuous formation over time.
From B19’s work the existence of four distinct stellar populations in the dynamical-chemical space is suggested: thin disk, thick disk, accreted halo and the Splash, the latter sometimes being referred to as the in-situ halo. The origin of the Splash also relates to the thick disk and it possibly contains the first stars in the proto-disk of our Galaxy’s progenitor. Besides that, there is clear evidence of a major merger event that occurred in the early stages of the MW (e.g. Helmi 2008; Belokurov et al. 2018; Haywood et al. 2018; Di Matteo et al. 2019). Di Matteo et al. (2019) and B19 proposed that this merger event could have excited the proto-disk and given rise to the low angular momentum, high radial velocity dispersion and relatively metal-rich Splash stars.
In this letter we analysed an isolated galaxy simulation in order to investigate the formation of Splash stars. We showed that a clumpy MW analogue can naturally form not just the chemical and geometric thin and thick disks (Clarke et al., 2019; Beraldo e Silva et al., 2020), but also the Splash, with distribution, kinematics and chemistry similar to those observed in our Galaxy. This is a new scenario for the formation of the Splash, as in our case there was no accretion event and therefore no accreted stellar halo. Moreover, in this scenario, the formation of the Splash stars occurs in the simulation’s first Gyrs. The thick-disk and Splash population have a common origin, where the latter is the low angular momentum tail of the former, as initially suggested by Di Matteo et al. (2019). This is due to the smooth transition in kinematics, age and [O/Fe] between the thick-disk and Splash region seen in Fig. 2. We also show that a similar simulation without clumps fails to reproduce the low rotational velocity patterns of the MW. We verified that the simulated Splash has a similar number fraction (Section 3.2) and age trends (Section 3.3) as observed in the MW. Our results suggest that a Splash population is expected in any galaxy which underwent a clumpy star-formation episode.
Finally, we note that the two different formation scenarios for the Splash population, i.e., clumpy star formation (this work) or a major merger (Di Matteo et al. 2019; Belokurov et al. 2019), are not mutually exclusive, since clumps can have an ex-situ origin associated to mergers (e.g. Mandelker et al. 2014). The effect of the merger on the disk depends on several parameters, such as the initial gas fraction and orbit (see e.g. Di Matteo et al. 2011). Moreover, the proximity of the satellite’s disruption, whether close or far from the disk, also plays an important role on the disk heating (Sellwood et al., 1998), and requires further study for the Gaia-Sausage.
References
- Amarante et al. (2020) Amarante, J. A. S., Smith, M. C., & Boeche, C. 2020, MNRAS, 492, 3816, doi: 10.1093/mnras/staa077
- Barbá et al. (2019) Barbá, R. H., Minniti, D., Geisler, D., et al. 2019, ApJ, 870, L24, doi: 10.3847/2041-8213/aaf811
- Belokurov et al. (2018) Belokurov, V., Erkal, D., Evans, N. W., Koposov, S. E., & Deason, A. J. 2018, MNRAS, 478, 611, doi: 10.1093/mnras/sty982
- Belokurov et al. (2019) Belokurov, V., Sanders, J. L., Fattahi, A., et al. 2019, arXiv e-prints, arXiv:1909.04679. https://arxiv.org/abs/1909.04679
- Bensby et al. (2003) Bensby, T., Feltzing, S., & Lundström, I. 2003, A&A, 410, 527, doi: 10.1051/0004-6361:20031213
- Beraldo e Silva et al. (2020) Beraldo e Silva, L., Debattista, V. P., Khachaturyants, T., & Nidever, D. 2020, MNRAS, 492, 4716, doi: 10.1093/mnras/staa065
- Clarke et al. (2019) Clarke, A. J., Debattista, V. P., Nidever, D. L., et al. 2019, MNRAS, 484, 3476, doi: 10.1093/mnras/stz104
- Di Matteo et al. (2019) Di Matteo, P., Haywood, M., Lehnert, M. D., et al. 2019, A&A, 632, A4, doi: 10.1051/0004-6361/201834929
- Di Matteo et al. (2011) Di Matteo, P., Lehnert, M. D., Qu, Y., & van Driel, W. 2011, A&A, 525, L3, doi: 10.1051/0004-6361/201015822
- Fernández-Alvar et al. (2019) Fernández-Alvar, E., Fernández-Trincado, J. G., Moreno, E., et al. 2019, MNRAS, 487, 1462, doi: 10.1093/mnras/stz1299
- Gaia Collaboration et al. (2016) Gaia Collaboration, Prusti, T., de Bruijne, J. H. J., et al. 2016, A&A, 595, A1, doi: 10.1051/0004-6361/201629272
- Gaia Collaboration et al. (2018a) Gaia Collaboration, Brown, A. G. A., Vallenari, A., et al. 2018a, A&A, 616, A1, doi: 10.1051/0004-6361/201833051
- Gaia Collaboration et al. (2018b) Gaia Collaboration, Babusiaux, C., van Leeuwen, F., et al. 2018b, A&A, 616, A10, doi: 10.1051/0004-6361/201832843
- Gallart et al. (2019) Gallart, C., Bernard, E. J., Brook, C. B., et al. 2019, Nature Astronomy, 3, 932, doi: 10.1038/s41550-019-0829-5
- Hayden et al. (2017) Hayden, M. R., Recio-Blanco, A., de Laverny, P., Mikolaitis, S., & Worley, C. C. 2017, A&A, 608, L1, doi: 10.1051/0004-6361/201731494
- Haywood et al. (2018) Haywood, M., Di Matteo, P., Lehnert, M. D., et al. 2018, ApJ, 863, 113, doi: 10.3847/1538-4357/aad235
- Helmi (2008) Helmi, A. 2008, Astronomy and Astrophysics Review, 15, 145, doi: 10.1007/s00159-008-0009-6
- Helmi et al. (2018) Helmi, A., Babusiaux, C., Koppelman, H. H., et al. 2018, Nature, 563, 85, doi: 10.1038/s41586-018-0625-x
- Luo et al. (2015) Luo, A. L., Zhao, Y.-H., Zhao, G., et al. 2015, Research in Astronomy and Astrophysics, 15, 1095, doi: 10.1088/1674-4527/15/8/002
- Mackereth et al. (2019) Mackereth, J. T., Schiavon, R. P., Pfeffer, J., et al. 2019, MNRAS, 482, 3426, doi: 10.1093/mnras/sty2955
- Mandelker et al. (2014) Mandelker, N., Dekel, A., Ceverino, D., et al. 2014, MNRAS, 443, 3675, doi: 10.1093/mnras/stu1340
- Myeong et al. (2019) Myeong, G. C., Vasiliev, E., Iorio, G., Evans, N. W., & Belokurov, V. 2019, MNRAS, 1731, doi: 10.1093/mnras/stz1770
- Navarro et al. (1997) Navarro, J. F., Frenk, C. S., & White, S. D. M. 1997, ApJ, 490, 493, doi: 10.1086/304888
- Nissen & Schuster (2010) Nissen, P. E., & Schuster, W. J. 2010, A&A, 511, L10, doi: 10.1051/0004-6361/200913877
- Sanders & Das (2018) Sanders, J. L., & Das, P. 2018, MNRAS, 481, 4093, doi: 10.1093/mnras/sty2490
- Sellwood et al. (1998) Sellwood, J. A., Nelson, R. W., & Tremaine, S. 1998, ApJ, 506, 590, doi: 10.1086/306280
- Shen et al. (2010) Shen, S., Wadsley, J., & Stinson, G. 2010, MNRAS, 407, 1581, doi: 10.1111/j.1365-2966.2010.17047.x
- Stinson et al. (2006) Stinson, G., Seth, A., Katz, N., et al. 2006, MNRAS, 373, 1074, doi: 10.1111/j.1365-2966.2006.11097.x
- Wadsley et al. (2004) Wadsley, J., Stadel, J., & Quinn, T. 2004, New Astronomy, 9, 137 , doi: https://doi.org/10.1016/j.newast.2003.08.004