subject
Article \Year2019 \MonthJanuary \Vol60 \No1 \DOI \ArtNo000000 \ReceiveDate, 2019 \AcceptDate, 2019
antao@shao.ac.cn
Zhang YK \AuthorCitationZhang, An, Frey
Fast jet proper motion discovered in a blazar at
Abstract
High-resolution observations of high-redshift () radio quasars offer a unique insight into jet kinematics at early cosmological epochs, as well as constraints on cosmological model parameters. Due to the general weakness of extremely distant objects and the apparently slow structural changes caused by cosmological time dilation, only a couple of high-redshift quasars have been studied with parsec-scale resolutions, and with limited number of observing epochs. Here we report on very long baseline interferometry (VLBI) observations of a high-redshift blazar J1430+4204 () in the 8 GHz frequency band at five different epochs spanning 22 years. The source shows a compact core–jet structure with two jet components being identified within 3 milli-arcsecond (mas) scale. The long time span and multiple-epoch data allow for the kinematic studies of the jet components. That results in a jet proper motion of = 0.0170.002 mas yr-1 and =0.1560.015 mas yr-1, respectively. For the fastest-moving outer jet component J2, the corresponding apparent transverse speed is . The inferred bulk jet Lorentz factor and viewing angle indicate highly relativistic beaming. The Lorentz factor and apparent proper motion are the highest measured to date among the jetted radio sources, while the jet kinematics is still consistent with the cosmological interpretation of quasar redshifts.
keywords:
galaxies: nuclei — galaxies: high-redshift — radio continuum: galaxies — quasars: individual: J1430+42041 Introduction
Active galactic nuclei (AGNs) are among the most powerful and energetic objects in the Universe. It is believed that every AGN harbours a supermassive black hole (SMBH) in its central region. Because of their enormous energy production and persistent high luminosity, AGNs are excellent laboratories for studying black hole accretion and galaxy evolution across cosmic times. High-redshift quasars (HRQs) that represent powerful AGNs in the early Universe constitute a unique sample for evolutionary studies of AGNs as well as of the cosmic environment [1, 2]. The most distant AGN known to date is the quasar J1342+0928 at , corresponding to only 5% of the current age of the Universe [3]. The number of quasars known at already exceeds 100 (e.g. [4, 5]). The discovery of extremely HRQs provided strong constraints on the formation history of the first generation of SMBHs [6, 3].
Among the HRQs, the radio-loud subsample is worth for exploring their relativistic jets and radio morphologies. Jets from radio-loud HRQs are useful probes of the intergalactic and interstellar environment in the very early stages (e.g. the epoch of reionization). Imaging of HRQ jets requires milli-arcsecond (mas) resolution or even higher. This can be achieved by using very long baseline interferometry (VLBI), which is the highest-resolution imaging technique. The fact that only 10% of the optically detected quasars are radio-loud, and that radio-loud quasars become too weak to be detected by radio telescopes at very large cosmological distances make high-redshift radio-loud quasars much more rare. The number of radio-detected AGNs with available spectroscopic redshift at is only about 170 [7], and the most distant radio-loud quasar to date is J1429+5447 at [8, 9].
J1430+4204 was discovered as a radio-loud quasar at [10]. Further X-ray and radio observations confirmed its blazar nature with broad-band variability and flat radio spectrum [11, 12, 13]. A distant () jet component was detected in the northwestern direction of the nucleus from Chandra X-ray and Very Large Array (VLA) radio observations, making J1430+4204 the most distant quasar being detected with kiloparsec (kpc) scale radio/X-ray jet known so far [14, 15]. The mas-scale radio structure of J1430+4204 has been studied with VLBI since 1996 [16]. With further more sensitive and higher-resolution VLBI observations, a compact core–jet structure was revealed, with a weak mas-scale jet ejecting towards the west-southwest seen at 2.3, 8.4 and 5 GHz frequencies (e.g. [17, 18, 15]). Veres et al. [19] conducted a two-epoch 15-GHz VLBI study of J1430+4204 before and after a major radio flare from 2005 to 2006. They did not find any evidence of newly ejected jet components. The jet emission in their 15-GHz VLBI images appears diffuse, hampering a direct measurement of jet proper motion.
In this paper, we present a multi-epoch VLBI analysis of J1430+4204. Thanks to the long time span and multiple epochs, we are able to study the jet kinematics of J1430+4204. The five-epoch data were obtained in the 8-GHz frequency band, where the jet components are bright and compact enough for model-fitting. In Sect. 2, we provide the basic information about our VLBI data and describe their analysis. Section 3 presents the high-resolution images, the results of brightness distribution modeling, and the calculation of jet parameters. In Sect. 4, We discuss the properties of J1430+4204 and put them into context with other extremely distant quasars studied with VLBI.
Throughout this paper, a flat CDM cosmological model was adopted, with the parameters of H 70 km s-1 Mpc-1, 0.27, and 0.73. At the redshift of J1430+4204, 1 mas angular size corresponds to 6.68 pc projected linear size and 1 mas yr-1 proper motion to apparent transverse speed ( denotes the speed of light) [20].
2 Methods
Data used for the jet kinematic study were obtained from VLBI observations in a total of five epochs from 1996 June 8 to 2018 May 1 (more details are referred to A). All these observations were made in geodetic/astrometric mode, in which a target source is observed during a few scans, usually for 5 min in each scan. The details of the observation logs are presented in Table 2. Except for the fourth epoch observed only at 8.4 GHz, the other observations were carried out at dual 2/8 GHz frequency bands. The image noise depends on a combination of factors such as on-source integration time, number of telescopes and their diameters, data rate, (u,v) coverage, quality of calibration, etc. The final root-mean-square (rms) noise in the naturally-weighted clean images ranges from 0.25 to 1.27 mJy beam-1. The visibility data were calibrated using the US National Radio Astronomy Observatory (NRAO) Astronomical Image Processing System (AIPS) software package [21]. The calibrated VLBI data were imported into the difmap software package [22] to carry out self-calibration, imaging and model fitting (B).
3 Results
3.1 Parsec-scale radio jet
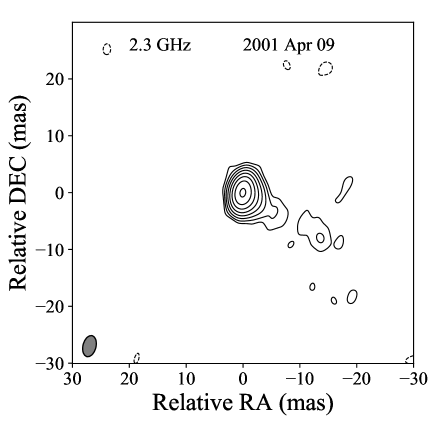
Because of the limited sensitivity of geodetic-style ‘snapshot’ VLBI experiments with short on-source integration times and poor (u,v) coverage (see Table 2), not all epochs are sufficient to produce a reasonably detailed image of the core–jet structure. At 2.3 GHz band, we show only the best-quality image made from the epoch 2001 data (Fig. 1) to indicate that the jet emission continues expanding out to an extent mas (or a projected distance of 130 pc) from the core (the brightest component at the image center) in the southwest direction. Our 2.3-GHz VLBI image (Fig. 1) is qualitatively consistent with that obtained in 1998 [15]. Both images reveal a compact core–jet structure within 10 mas and weaker knotty components beyond 10 mas.
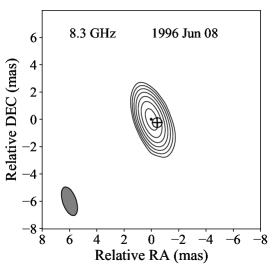
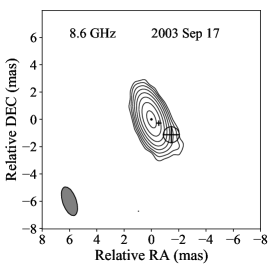
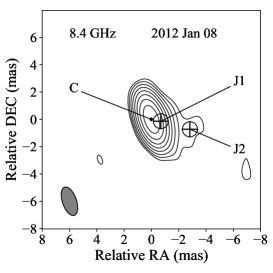
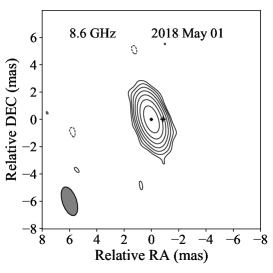
Figure 2 shows the 8-GHz images at five available epochs. The 8-GHz imaging observations resolve out the diffuse emission structure at 10-mas scale and show jet components only within about 3 mas from the core (Fig. 2). The core showed a significant flux density variability from 182.3 mJy at epoch 1996 to 65.7 mJy at epoch 2001, then to 152.8 mJy at epoch 2003. The jet components are located to the west and southwest of the core, roughly in alignment with the 2.3-GHz jet structure (Fig. 1). The VLA image at 1.4 GHz made by Cheung et al. [15] implies an extended jet/lobe at in the northwest. A large difference of position angles () between the mas- and arcsec-scale jet indicates a possible large jet bending. Alternatively, the northwest lobe could be a relic from the past cycle of radio activity. To identify the connection between the VLBI and VLA jets, intermediate-resolution ( mas) radio interferometric imaging would be required.

3.2 Jet proper motion
The typical one-sided apparent jet morphology of blazars provide a unique opportunity for their kinematic study, where the jet component proper motions, the viewing angles and the Lorentz factor of the relativistic jet can be constrained using high-resolution VLBI observations. Due to the cosmological time dilation effect, structural changes in the jet are seen times slower in the observer’s frame than in the rest frame of the high redshift quasars [23]. Thus with an assumption of a continuous jet flow, we are able to link the jet components with each other at five different epochs over an observed period spanning yr that actually corresponds to just about 4 yr in the rest frame of J1430+4204 at .
The 2.3 GHz observing frequency does not provide enough angular resolution to distinguish between the innermost jet components. Moreover, the outermost component seen at 2.3 GHz is too faint and diffuse, preventing us from making reliable proper motion estimates. Therefore the jet kinematic analysis is based on the 8-GHz observations. With model-fitting to our VLBI data, we were able to identify two jet components, named J1 and J2, across the different epochs. Component J1 is located well within 1 mas from the core and was detected at all 5 epochs. Component J2 shows an apparent separation of mas from the core and was detected in the middle 3 epochs. The first and fifth epochs have relatively lower imaging sensitivity (see column 9 in Table B1) due to the smaller number of telescopes (in epoch 5) and short integration time (in epoch 1). These lead to a non-detection of the weaker jet component J2. The parameters of individual components derived from model-fitting are listed in Table 3. The locations and sizes of the fitted model components are also indicated in Fig. 2.
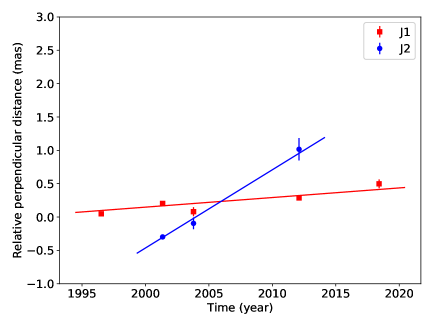
From the parameters in Table 3, we found that both jet components are moving outwards from the core. The trajectory of J2 appears slightly curving towards the north (i.e. counter-clockwise direction in Fig. 2), with the jet position angle gradually changing from at epoch 2001 to at epoch 2012. The component J1 also shows a gradual change of position angle. Small changes in the direction of a relativistic jet flow beaming toward the observer could be amplified by projection effect. For example, apparent jet curvature could be attributed to a low-pitch helical trajectory projected on the sky [24, 25], which is commonly seen in many blazars [26, 27, 28]. The northward rotation of the jet in our VLBI images might be related to the larger, kpc-scale radio structure of J1430+4204, where a distant jet component at from the core is seen in the VLA image [15]. An alternative possibility of a jet deflection off the dense interstellar medium cannot be ruled out [29, 30, 31]. Further polarisation-sensitive VLBI observations and long-term flux density monitoring to reveal periodicity could address the problem of the helical jet.
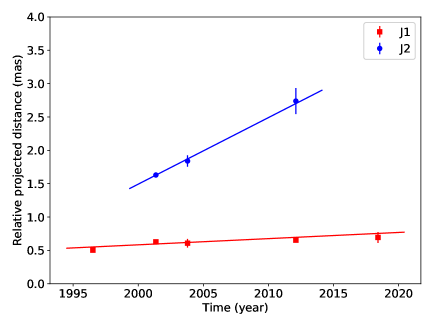
To describe the apparent motions of J1 and J2 relative to the core, we estimated their linear proper motions along the 2.3- jet direction and perpendicular directions, respectively, using least-squares fitting. The component position angles from the best-resolved 2.3-GHz image (Fig. 1) characterize a relativistic jet moving to southwest, where the mean position angle is . This value is adopted to define the pc-scale jet direction here. Figure 3 shows the fitted jet proper motions with respect to the core along and perpendicular to this direction. The values are 0.100 0.017 mas yr-1 and 0.120 0.014 mas yr-1 for J2, 0.009 0.002 mas yr-1 and 0.015 0.002 mas yr-1 for J1, respectively. Veres et al. [19] studied this source based on two-epoch 15-GHz VLBA observations. They estimated the jet parameters but did not detect a moving component due to their short observation period. Another reason is that the jet emission at 15 GHz (corresponding to 86 GHz in the source rest frame) is optically thin and becomes intrinsically weak.
Veres et al. [19] estimated the Doppler factor using three independent approaches: from radio flux density variability, from radio and X-ray data and the inverse Compton process, and from the core brightness temperature measured with VLBI at 15 GHz. A moderate bulk Lorentz factor of 4.6–6.8 was derived from their VLBI study. We also applied the core brightness temperature to estimate the jet beaming parameters, while obtained a higher Lorentz factor and a viewing angle of (C). Our calculated jet parameters are in agreement with the blazar nature of J1430+4204 whose relativistic jet is inclined within a very small angle to the line of sight. The 15 GHz (correponding to a source-rest-frame frequency of about 86 GHz) data of Veres et al. [19] probe an inner jet section, while our 8 GHz data trace a relatively outer region. The difference in Lorentz factors derived from Veres et al. and ours may imply an increase of the jet flow Lorentz factor from a distance 100 pc (deprojected distance of J1) to 500 pc (deprojected distance of J2).
4 Discussion and conclusion
According to the unified scheme of radio-loud (jetted) AGNs, the appearance and luminosity of the objects depend on their jet orientation with respect to the viewing direction [32]. Blazars, whose relativistic jets point nearly towards us, are intriguing sources to probe the early Universe. Their jet emission is strongly enhanced due to the Doppler beaming effect which makes them more easily detectable compared to the coetaneous quasars with unbeamed jets, especially at high redshifts (e.g. [33]). Moreover, the powerful aligned jets are not affected by the obscuring torus that surrounds the central black hole and have more chances to break through the surrounding material [34], making the high- sources prominent in multi-band studies [35, 36].
| Name | redshift | Ref. | ||||
|---|---|---|---|---|---|---|
| (1) | (2) | (3) | (4) | (5) | (6) | (7) |
| J09066930 | 5.47 | 2.50.8 | 6.00.8 | 3.60.5 | 6.82.2∘ | 1 |
| J10262542 | 5.27 | 12.5 3.9 | 5 | 12.5 | 4.6∘ | 2 |
| J14304304 | 4.72 | 2–4.2 | 8.6–12 | 4.6–6.8 | 3∘ ∗ | 3 |
| J21340419 | 4.33 | 4.1 2.7 | 3–8 | 2–7 | 3–20∘ | 4 |
| J14304304 | 4.72 | 19.51.9 | 22.210.6 | 14.63.8 | 2.21.6∘ | 5 |
Col. 3 –Fastest apparent transverse speed in unit of ; Col. 4 – Doppler factor; Col. 5 – bulk Lorentz factor; Col. 6 – jet viewing angle with respect to our line of sight; Col. 7 – reference:
1. [50];
2. [23];
3. [19];
4. [37];
5. This paper
∗ this value is not estimated but fixed to an assumed value of .
Apparent proper motion estimates of AGN jets provide a unique way of understanding their relativistic motions. This requires multi-epoch VLBI observations at a given frequency. The cosmological time dilation effect makes it more difficult to see apparent changes in high-redshift radio jets than in low-redshift ones: any change is observed times slower compared to the rest frame of the quasar. Therefore determination of jet proper motion in HRQs has to possess long enough gaps from epoch to epoch. Among the known radio quasars at , J1430+4204 belongs to the most luminous ones [38], owing to its Doppler-boosted jet emission. Until now, direct estimates of AGN jet proper motion at are rare, available only for 3 objects: J0906+6930 () at 15 GHz (An et al. 2019, in prep.), J1026+2542 () at 5 GHz [23], and J21340419 () at 5 GHz [37]. Their derived jet parameters are collected in Table 1, along with our new results obtained for J1430+4204. Compared with previous proper motion estimates for other HRQs, our results are derived from more epochs over a longer time range, making the structural changes more evident and the estimates more reliable. Our estimated vector proper motion of mas yr-1 () for the component J2 stands as the highest among all the measured values for other quasars. In addition, a -ray flare was also reported to originate from this source [39], indicating that J1430+4204 is an exceptionally powerful blazar in the early Universe and deserves comprehensive multi-band studies.
HRQ jets open a window to explore the earliest activity of the accreting SMBHs [15]. In addition, the jet parameters (e.g., bulk Lorentz factor, viewing angle) yield useful constraints on the X-ray jet emission mechanism of high-redshift quasars [40]. The resulting and of J1430+4204 are at the higher end compared to the known high- jets, but sit in the middle of the large low-redshift blazar samples [41, 42, 43]. The reason why (the most powerful) high-redshift quasar jets do not have extremely high Lorentz factors (as some of the low-redshift blazars) is still an open question and needs more investigations on larger samples.
As the kinematic analysis of VLBI jets in the large sample of the 15-GHz MOJAVE (Monitoring of Jets in Active Galactic Nuclei with VLBA Experiments) survey indicates, accelerations as well as non-ballistic component motions are common in powerful AGN jets [44, 45]. An increase in the Lorentz factor dominates the parallel accelerations which usually take place from the origin until a distance of pc away from the core [44], as may also account for the observed increasing jet speed from J1 to J2 in J1430+4204. Considering that the jet knot may trace a curved path (see Sect. 3.1), an alternative possibility of the apparent jet acceleration might be due to the jet bending; for a highly beamed jet pointing toward us, any small change in the jet inclination angle may cause a large change of the apparent jet speed, even the intrinsic jet bulk speed remains constant.
Our current study helps accumulating kinematic data on high-redshift radio jets. Eventually, with a sufficiently large sample, the possible evolution of jetted radio sources on cosmological time scales, as well as cosmological model parameters could be constrained with such data [51, 41]. The number of blazars at high redshifts can also help constrain the space density of radio-loud high- AGNs. That yields the information on the space distribution of radio sources and cosmological evolution of the number density. If one assumes that AGN jets point in any direction with equal probability, and define blazars with a viewing angle , where is the bulk Lorentz factor of the emitting jet plasma, the total number of radio-loud AGNs could be obtained as = [46, 47]. Taking the highest Lorentz factor of J1430+4204 into account, that implies a total number of radio-loud AGNs at the redshift of 4.72. This number is much higher than that currently detected. High-sensitivity all-sky surveys using the next generation radio telescopes, such as the Square Kilometre Array (SKA) and the next-generation VLA (ngVLA), may boost the detection of radio-emitting HRQs [48, 49], allowing for more sophisticated study of the cosmological evolution of radio sources.
Acknowledgements
This work is supported by SKA pre-research funding granted by the Ministry of Science and Technology of China (MOST, No 2016YFE0100300), the Chinese Academy of Sciences (CAS), and the Hungarian National Research, Development and Innovation Office (grant 2018-2.1.14-TÉT-CN-2018-00001). The authors acknowledge the use of Astrogeo Center database of brightness distributions, correlated flux densities, and images of compact radio sources produced with VLBI. YZ thanks Shu Fengchun, Alexey Melnikov, Jamie McCallum, Bo Xia for providing the Asia-Oceania VLBI (AOV) data and auxiliary telescope system temperature files.
Disclosure of potential conflict of interest
The authors declare no potential conflict of interest.
Data availability
All data used in this study are public and can be accessed through the different data archives of the various instruments. NRAO VLBA archive: https://archive.nrao.edu/archive/advquery.jsp. The authors can provide data supporting this study upon request.
Code availability
Upon reasonable request the authors will provide all code supporting this study. Astronomical Image Processing System (AIPS) software can be found at http://www.aips.nrao.edu/index.shtml. Difmap software can be found at ftp://ftp.astro.caltech.edu/pub/difmap/.
References
References
- [1] Kellermann KI. The cosmological deceleration parameter estimated from the angular-size/redshift relation for compact radio sources. Nat 1993;361:134-136.
- [2] Gurvits LI, Kellermann KI, & Frey S. The “angular size - redshift” relation for compact radio structures in quasars and radio galaxies. Astron and Astrophys 1999;342:378-388.
- [3] Bañados E, Venemans BP, Mazzucchelli C, et al. An 800-million-solar-mass black hole in a significantly neutral Universe at a redshift of 7.5. Nat 2018;553:473-476.
- [4] Jiang L, McGreer ID, Fan X, et al. The Final SDSS High-redshift Quasar Sample of 52 Quasars at z>5.7. The Astrophys J 2016;833:222.
- [5] Bañados E, Venemans BP, Decarli R, et al. The Pan-STARRS1 Distant z > 5.6 Quasar Survey: More than 100 Quasars within the First Gyr of the Universe. The Astrophys J Suppl Ser 2016;227:11.
- [6] Volonteri M, & Rees MJ. Quasars at z=6: The Survival of the Fittest. The Astrophys J 2006;650:669-678.
- [7] Perger K, Frey S, Gabányi K. É, et al. A catalogue of active galactic nuclei from the first 1.5 Gyr of the Universe. Front in Astron and Space Sci 2017;4:9.
- [8] Willott CJ, Albert L, Arzoumanian D, et al. Eddington-limited Accretion and the Black Hole Mass Function at Redshift 6. The Astron J 2010;140:546-560.
- [9] Frey S, Paragi Z, Gurvits LI, et al. Into the central 10 pc of the most distant known radio quasar. VLBI imaging observations of J1429+5447 at z = 6.21. Astron and Astrophys 2011;531:L5.
- [10] Hook IM, & McMahon RG. Discovery of radio-loud quasars with z=4.72 and z=4.010. Mon Not of the R Astron Soc 1998;294:L7-L12.
- [11] Fabian AC, Iwasawa K, McMahon RG, et al. The ASCA spectrum of the z=4.72 blazar GB 1428+4217. Mon Not of the R Astron Soc 1998;295:L25-L28.
- [12] Fabian AC, Celotti A, Pooley G, et al. Variability of the extreme z=4.72 blazar, GB 1428+4217. Mon Not of the R Astron Soc 1999;308:L6-L10.
- [13] Worsley MA, Fabian AC, Pooley GG, et al. Radio and X-ray observations of an exceptional radio flare in the extreme z = 4.72 blazar GBB1428+4217. Mon Not of the R Astron Soc 2006;368:844-850.
- [14] Cheung CC, Stawarz L, Siemiginowska A, et al. The Highest Redshift Relativistic Jets. Astron Soc of the Pca Conf Proc 2008;386:462.
- [15] Cheung CC, Stawarz Ł, Siemiginowska A, et al. Discovery of a Kiloparsec-scale X-Ray/Radio Jet in the z = 4.72 Quasar GB 1428+4217. The Astrophys J 2012;756:L20.
- [16] Paragi Z, Frey S, Gurvits LI, et al. VLBI imaging of extremely high redshift quasars at 5 GHz. Astron and Astrophys 1999;344:51-60.
- [17] Helmboldt JF, Taylor GB, Tremblay S, et al. The VLBA Imaging and Polarimetry Survey at 5 GHz. The Astrophys J 2007;658:203-216.
- [18] Pushkarev AB, & Kovalev YY. Single-epoch VLBI imaging study of bright active galactic nuclei at 2 GHz and 8 GHz. Astron and Astrophys 2012;544:A34.
- [19] Veres P, Frey S, Paragi Z, et al. Physical parameters of a relativistic jet at very high redshift: the case of the blazar J1430+4204. Astron and Astrophys 2010;521:A6.
- [20] Wright, E. L. A Cosmology Calculator for the World Wide Web. Pub of the Astron Soc of the Pac 2006;118:1711-1715.
- [21] Greisen EW. AIPS, the VLA, and the VLBA. In: André H. Information Handling in Astronomy - Historical Vistas. Dordrecht: Kluwer Acad Publ; 2003, p. 109.
- [22] Shepherd MC. Difmap: an Interactive Program for Synthesis Imaging. Astron Soc of the Pac Conf Ser 1997;125:77.
- [23] Frey S, Paragi Z, Fogasy JO, et al. The first estimate of radio jet proper motion at z > 5. Mon Not of the R Astron Soc 2015;446:2921-2928.
- [24] Conway JE, & Murphy DW. Helical Jets and the Misalignment Distribution for Core-dominated Radio Sources. The Astrophys J 1993;411:89.
- [25] Conway JE, & Wrobel JM. Helical Distortions of the Relativistic Jet in the BL Lacertae Object MRK 501 (B1652+398). Am Astron Soc Meet Abstr 1993;183:107.05.
- [26] Kharb P, Lister ML, & Cooper NJ. Extended Radio Emission in MOJAVE Blazars: Challenges to Unification. The Astrophys J 2010;710:764-782.
- [27] Zhao W, Hong XY, An T, et al. Radio structure of the blazar 1156 + 295 with sub-pc resolution. Astron and Astrophys 2011;529:A113.
- [28] Lister ML, Aller MF, Aller HD, et al. MOJAVE. X. Parsec-scale Jet Orientation Variations and Superluminal Motion in Active Galactic Nuclei. The Astron J 2013;146:120.
- [29] Gurvits LI, Schilizzi RT, Miley GK, et al. A compact radio component in 4C 41.17 at z=3.8: a massive clump in a forming galaxy?. Astron and Astrophys 1997;318:11-14.
- [30] Gómez JL, Marscher AP, Alberdi A, et al. Flashing Superluminal Components in the Jet of the Radio Galaxy 3C120. Sci 2000;289:2317-2320.
- [31] Liu Y, Jiang DR, Gu M, et al. Multifrequency VLBA polarimetry of the high-redshift GPS quasar OQ172. Mon Not of the R Astron Soc 2017;468:2699-2712.
- [32] Urry CM, & Padovani P. Unified Schemes for Radio-Loud Active Galactic Nuclei. Publ of the Astron Soc of the Pac 1995;107:803.
- [33] Volonteri, M, Haardt F, Ghisellini G, et al. Blazars in the early Universe. Mon Not of the R Astron Soc 2011;416:216-224.
- [34] Ghisellini G, & Sbarrato T. Dark bubbles around high-redshift radio-loud active galactic nucleus. Mon Not of the R Astron Soc 2016;461:L21-L25.
- [35] Zeimann GR, White RL, Becker RH, et al. Discovery of a Radio-selected z ~6 Quasar. The Astrophys J 2011;736:57.
- [36] Ighina L, Caccianiga A, Moretti A, et al. X-ray properties of z > 4 blazars. Mon Not of the R Astron Soc 2019;489:2732-2745.
- [37] Perger K, Frey S, Gabányi KÉ, et al. Constraining the radio jet proper motion of the high-redshift quasar J2134-0419 at z = 4.3. Mon Not of the R Astron Soc 2018;477:1065-1070.
- [38] Coppejans R, Frey S, Cseh D, et al. On the nature of bright compact radio sources at z > 4.5. Mon Not of the R Astron Soc 2016;463:3260-3275.
- [39] Liao NH, Li S, & Fan YZ. Fermi-LAT Detection of a Transient -Ray Source in the Direction of a Distant Blazar B3 1428+422 at z = 4.72. The Astrophys J 2018;865:L17.
- [40] Siemiginowska A, Smith RK, Aldcroft TL, et al. An X-Ray Jet Discovered by Chandra in the z=4.3 Radio-selected Quasar GB 1508+5714. The Astrophys J 2003;598:L15-L18.
- [41] Kellermann KI, Lister ML, Homan DC, et al. Sub-Milliarcsecond Imaging of Quasars and Active Galactic Nuclei. III. Kinematics of Parsec-scale Radio Jets. The Astrophys J 2004;609:539-563.
- [42] Britzen S, Vermeulen RC, Campbell RM, et al. A multi-epoch VLBI survey of the kinematics of CFJ sources. II. Analysis of the kinematics. Astron and Astrophys 2008;484:119-142.
- [43] Lister ML, Cohen MH, Homan DC, et al. MOJAVE: Monitoring of Jets in Active Galactic Nuclei with VLBA Experiments. VI. Kinematics Analysis of a Complete Sample of Blazar Jets. The Astron J 2009;138:1874-1892.
- [44] Homan DC, Lister ML, Kovalev YY, et al. MOJAVE. XII. Acceleration and Collimation of Blazar Jets on Parsec Scales. The Astrophys J 2015;798:134.
- [45] Lister ML, Aller MF, Aller HD, et al. MOJAVE: XIII. Parsec-scale AGN Jet Kinematics Analysis Based on 19 years of VLBA Observations at 15 GHz. The Astron J 2016;152:12.
- [46] Ghisellini G, Sbarrato T, Tagliaferri G, et al. SDSS J114657.79+403708.6: the third most distant blazar at z = 5.0. Mon Not of the R Astron Soc 2014;440:L111-L115.
- [47] Caccianiga A, Moretti A, Belladitta S, et al. The space density of z > 4 blazars. Mon Not of the R Astron Soc 2019;484:204-217.
- [48] Paragi Z, Godfrey L, Reynolds C, et al. Very Long Baseline Interferometry with the SKA. Adv Astrophys with the Squ Km Array (AASKA14) 2015;1:143.
- [49] Murphy EJ, Condon JJ, Alberdi A, et al. Radio Continuum Emission from Galaxies: An Accounting of Energetic Processes. Astron Soc of the Pca Conf Proc 2018;517:421.
- [50] An T, Mohan P, Zhang Y. et al. Evolving parsec-scale radio structure in the most distant blazar known. Nat Comm 2019; in press.
- [51] Cohen MH, Barthel, PD, Pearson TJ, et al. Expanding Quasars and the Expansion of the Universe. The Astrophys J 1988;329:1.
- [52] Gordon D, Jacobs C, Beasley A, et al. Second Epoch VLBA Calibrator Survey Observations: VCS-II. The Astron J 2016;151:154.
- [53] Petrov L, Gordon D, Gipson J, et al. Precise geodesy with the Very Long Baseline Array. J of Geod 2009;83:859-876.
- [54] McCallum L, Wakasugi T, & Shu F. Current Activities and Plans of the AOV - Asia-Oceania VLBI Group. Int VLBI Ser for Geod and Astrom 2018 Gen Meet Proc 2019;1:131-134.
- [55] Titov O, Girdiuk A, Lambert SB, et al. Testing general relativity with geodetic VLBI. What a single, specially designed experiment can teach us. Astron and Astrophys 2018;618:A8.
- [56] Aksim D, Melnikov A, Pavlov D, et al. Exploring the Asymmetry of the Solar Corona Electron Density with Very Long Baseline Interferometry. The Astrophys J 2019;885:159.
- [57] Shuygina N, D. Ivanov D, A. Ipatov A, et al. Russian VLBI network “Quasar”: Current status and outlook. Geod and Geodyn 2019;10:150-6.
- [58] An T, Sohn BW, Imai H. Capabilities and prospects of the East Asia Very Long Baseline Interferometry Network. Nat Astron 2018;2:118-125.
- [59] Plank L, Lovell JEJ, McCallum, JN, et al. The AUSTRAL VLBI observing program. J of Geod 2017;91:803-817.
- [60] Deller AT, Brisken WF, Phillips CJ, et al. DiFX-2: A More Flexible, Efficient, Robust, and Powerful Software Correlator. Publ of the Astron Soc of the Pac 2011;123:275.
- [61] Diamond PJ. VLBI Data Reduction in Practice. Astron Soc of the Pac Conf Ser 1995;82:227.
- [62] An T., Wu X-P, & Hong X. SKA data take centre stage in China. Nat Astron 2019;3:1030-1030.
- [63] Readhead ACS, Walker RC, Pearson TJ, et al. Mapping radio sources with uncalibrated visibility data. Nat 1980;285:137-140.
- [64] Linfield RP. A modified hybrid mapping technique for VLBI data. The Astron J 1986;92:213-218.
- [65] Kovalev YY, Kellermann KI, Lister ML, et al. Sub-Milliarcsecond Imaging of Quasars and Active Galactic Nuclei. IV. Fine-Scale Structure. The Astron J 2005;130:2473-2505.
- [66] Fomalont EB. Image Analysis. Astron Soc of the Pac Conf Ser 1999;180:301.
- [67] Kellermann KI, & Pauliny-Toth IIK. The Spectra of Opaque Radio Sources. The Astrophys J 1969;155:L71.
- [68] Readhead ACS. Equipartition Brightness Temperature and the Inverse Compton Catastrophe. The Astrophys J 1994;426:51.
Appendix A VLBI observations
A total of five epochs of VLBI data are analysed in this study. The observations were conducted in several different geodetic/astrometric VLBI projects, spanning nearly 22 yr. Table 2 summarizes the basic information of each observation. Calibrated interferometric visibility data for the first four epochs are taken from the Astrogeo database111Maintained by L. Petrov, http://astrogeo.org/vlbi_images/, which is the largest collection of publicly available VLBI imaging data, mostly from the Very Long Baseline Array (VLBA) Calibrator Surveys (e.g. [52]) and a series of geodetic and astrometric projects (e.g. the Research & Development VLBA project, [53]). In the below sections, we only introduced the observation and data calibration of the last epoch.
Data for the epoch 2018 May 1st were observed in the framework of the newly-established Asia–Oceania VLBI project (AOV, [54]) which observes a sample of bright extragalactic radio sources with not only geodetic and astrometric goals, but also for other scientific purposes such as characterising the Sun’s corona and testing general relativity (e.g. [55, 56]). The high-redshift blazar J1430+4204 was observed in the session aov22 (Table 2), with a global network consisting of ten radio telescopes providing baseline lengths up to km. The participating antennas were Badary (32 m diameter), Svetloe (32 m), Zelenchukskaya (32 m) from the Russian “QUASAR” VLBI network [57]; Kunming (40 m), Sheshan (25 m) from China VLBI network [58]; Hobart (26 m), Katherine (12 m), Yarragadee (12 m) from Australian VLBI network [59]; Warkworth (12 m) from New Zeland, and Ishioka (13 m) from Japan. For our target J1430+4204, six scans of 6–8 min were scheduled in this session, spreading over 12 h, and providing a good (u,v) coverage for image reconstruction. A total of 16 intermediate frequency channels (IFs) were used in right-hand circular polarization, with 6 IFs at S band (2.3 GHz) and 10 IFs at X band (8.6 GHz), respectively. Each IF was divided into 32 spectral channels of 500 kHz width, resulting in a total bandwidth of 256 MHz. After observation, the data from each station were transported to the Shanghai Astronomical Observatory (China) for correlation, using the DiFX correlator system [60].
Appendix B Data processing
The phases and amplitudes of the correlated visibility data were calibrated using the US National Radio Astronomy Observatory (NRAO) Astronomical Image Processing System (AIPS) software [21], following a standard procedure (e.g. [61]). The data were downloaded on the China SKA Regional Centre prototype [62] in which the calibration and imaging were carried out. After loading and inspecting the correlated data, we separated the S- and X-band data into individual files for further calibration. The amplitudes were calibrated using the system temperatures measured during the observation and known antenna gain curves from each station.
The manual phase calibration and global fringe-fitting were done using the AIPS task FRING, with the aim of correcting instrumental delays as well as the errors on delays, delay rates and phases. We picked the bright radio source OJ 287 also observed in the same aov22 experiment, to conduct the manual phase calibration. The fringe-fitted data of OJ 287 were exported to the Caltech Difmap software [22] for imaging. After a few iterations of hybrid mapping cycles (e.g. [63, 64]), the gain correction factors for each antenna could be determined through the gscale command. The antenna-based gain correction factors derived from the bright calibrator OJ 287 were then applied to the data in AIPS, which refined the amplitude scales that were mainly based on the system temperatures measured at individual antenna sites.
Since the target source J1430+4204 is bright enough, we performed direct fringe-fitting in AIPS. Quite a few antennas in our AOV session were small in diameter and therefore less sensitive than the antennas used at previous epochs. This resulted in weak fringes for the target source and caused larger rms image noise, as indicated in Table 2. Finally, the calibrated visibility data of J1430+4204 were averaged in frequency within each IF and in time over 2 s, and loaded into Difmap for imaging and model-fitting.
| Project code | Date | Frequency | Time | BW | Array | Ref. | ||||
|---|---|---|---|---|---|---|---|---|---|---|
| YYYYMMDD | (GHz) | (min) | (MHz) | (mas) | (mas) | (∘) | (mJy beam-1) | |||
| (1) | (2) | (3) | (4) | (5) | (6) | (7) | (8) | (9) | (10) | (11) |
| bb023 | 19960608 | 8.3 | 5 | 32 | 1.9 | 0.9 | 8.5 | 0.66 | VLBA | 1 |
| … | … | 2.3 | … | … | 6.9 | 3.2 | 8.8 | 0.90 | … | … |
| rdv27 | 20010409 | 8.6 | 40 | 32 | 1.0 | 0.6 | 15.7 | 0.27 | VLBAGcKkMcNyTsWz | 2 |
| … | … | 2.3 | … | … | 3.8 | 2.3 | 14.1 | 0.27 | … | … |
| rdv41 | 20030917 | 8.6 | 40 | 32 | 0.8 | 0.6 | 2.1 | 0.31 | VLBA (except BR)GcKkNyTsWfWz | 2 |
| … | … | 2.3 | … | … | 3.0 | 2.3 | 8.0 | 0.39 | VLBA (except BR)GcKkNyTsWfWzOn | … |
| bc196zo | 20120108 | 8.4 | 5.5 | 128 | 2.2 | 1.0 | 18.9 | 0.25 | VLBA (except BR MK) | 1 |
| aov22 | 20180501 | 8.6 | 50 | 160 | 1.1 | 0.6 | 31.1 | 0.48 | BdIsKmShSvZc | 3 |
| … | … | 2.3 | … | 96 | 3.7 | 2.6 | 32.7 | 1.27 | BdIsKmShSvZcKe | … |
Col. 4 – integration time; Col. 5 – total observing bandwidth; Cols. 6-7 – major and minor axis sizes of the restoring beam (FWHM); Col. 8 – position angle of the major axis of the restoring beam, measured from north to east; Col. 9 – root-mean-square (rms) noise of the residual map; Col. 10 – antennas participated in the VLBI observation: the Very Long Baseline Array (VLBA) of the USA generally contains the following ten 25-m telescopes: Brewster (BR), Fort Davis (FD), Hancock (HN), Kitt Peak (KP), Los Alamos (LA), Mauna Kea (MK), North Liberty (NL), Owens Valley (OV), Pie Town (PT), and Saint Croix (SC). The extra antennas are: Gilmore Creek in the USA (Gc); Kokee Park in the USA (Kk); Medicina in Italy (Mc); Ny Alesund in Norway (Ny); Westford in the USA (Wf); Wettzell in Germany (Wz); Onsala60 in Sweden (On); Badary in Russia (Bd); Ishioka in Japan (Is); Kunming in China (Km); Sheshan in China (Sh); Svetloe in Russia (Sv); Zelenchukskaya in Russia (Zc); Katherine in Australia (Ke). Col. 11 – 1. Astrogeo database; 2. [18]; 3. This paper.
The already calibrated archival VLBI visibility data downloaded from the Astrogeo database for the first four epochs (Table 2) were also analysed in Difmap. Hybrid mapping procedures were performed, including iterations of cleaning and phase-only self-calibration. Antenna gain correlation, and self-calibration of phases and amplitudes were then applied to the data. The final images (Fig. 1) were produced by applying natural weighting to the visibility data. Based on the self-calibrated visibilities, we used a circular Gaussian brightness distribution model to fit the brightest component in each map. This was considered the ‘core’ of the source, i.e. the optically thick section of the jet at the given frequency. Further along the jet, other features were seen at most of the epochs, located on the western side of the core (Figs. 1-2).
To track the motion of the jet components, we used several circular Gaussian brightness distribution model components to fit the visibility data in Difmap. Wherever the diameter of the fitted circular Gaussian became smaller than the minimum resolvable size [65] with the VLBI array, it was replaced by a point model. During the model-fitting process across all available epochs, we followed the strategy of simplicity and consistency from epoch to epoch. The uncertainties of the fitted component positions are estimated in a conservative way, = , where is the size of the restoring beam (full width at half-maximum, FWHM), and is the signal-to-noise ratio of the corresponding component. For the uncertainties of the remaining parameters, we give the statistical imaging errors introduced by Fomalont [66]. Additional 5% calibration uncertainties were considered for both the image peak intensities and the fitted total flux densities. The parameters obtained from model fitting for J1430+4204 at 8.3/8.6 GHz are listed in Table 3.
| Epoch | Component | |||||||
| YYYYMMDD | (mJy beam-1) | (mJy) | (mas) | (∘) | (mas) | (1010K) | ||
| (1) | (2) | (3) | (4) | (5) | (6) | (7) | (8) | (9) |
| 19960608 | C | 182.39.1 | 174.98.8 | – | – | 0.120.01 | 131.410.0 | 26.32.0 |
| … | J1 | 14.41.0 | 19.31.5 | 0.5050.029 | 119.3 3.3 | 0.720.06 | – | – |
| 20010409 | C | 65.73.3 | 66.13.3 | – | – | 0.070.01 | 120.09.8 | 24.02.0 |
| … | J1 | 6.20.4 | 6.10.5 | 0.6600.017 | 106.9 1.5 | 0.160.04⋆ | – | – |
| … | J2 | 3.40.3 | 6.40.7 | 1.6570.032 | 135.21.1 | 0.880.06 | – | – |
| 20030917 | C | 152.87.6 | 155.27.8 | – | – | 0.090.01 | 178.311.6 | 35.72.3 |
| … | J1 | 3.00.3 | 2.60.4 | 0.613 0.067 | 117.3 6.2 | 0.400.13⋆ | – | – |
| … | J2 | 2.30.3 | 5.70.9 | 1.842 0.088 | 127.82.7 | 1.170.18 | – | – |
| 20120108 | C | 182.29.1 | 181.29.1 | – | – | 0.18 0.01 | 53.82.8 | 10.80.6 |
| … | J1 | 7.00.4 | 11.20.7 | 0.712 0.027 | 101.12.2 | 1.090.05 | – | – |
| … | J2 | 1.10.3 | 2.00.5 | 2.9210.167 | 104.4 3.3 | 1.110.33 | – | – |
| 20180501 | C | 165.0 8.3 | 171.28.6 | – | – | 0.150.01 | 71.84.0 | 14.40.8 |
| … | J1 | 3.10.5 | 3.20.7 | 0.8540.066 | 89.14.4 | 0.330.13⋆ | – | – |
Col. 2 – component label (C: core, J1 and J2: jet components); Col. 3 – peak brightness; Col. 4 – integrated flux density; Col. 5 – radial separation of the component form the core; Col. 6 – position angle with respect to the core; Col. 7 – FWHM size of the fitted Gaussian component; Col. 8 – core brightness temperature; Col. 9 – Doppler factor.
⋆ The sizes of point models are estimated using the minimum resolvable sizes [65].
| Comp | ||||
|---|---|---|---|---|
| (1) | (2) | (3) | (4) | (5) |
| J1 | 0.0090.002 | 0.0150.002 | 0.0170.002 | 0.0110.002 |
| J2 | 0.1000.017 | 0.1200.014 | 0.1560.015 | 0.1120.015 |
Col. 2 – fitted proper motion parallel with the 2.3 GHz jet direction; Col. 3 – fitted proper motion perpendicular to the 2.3 GHz jet direction; Col. 4 – proper motion after vectorial addition; Col. 5 – fitted separation rate assuming simple outward radial motion and not curved trajectory
Appendix C Relativistic beaming parameters
To evaluate the beaming effect form the innermost region of a relativistic jet, the most common method involving VLBI data is to estimate the core brightness temperature (). High values of indicate Doppler-boosted radio emission in the relativistic jet. Without relativistic beaming, the upper limit of the in AGN cores is K caused by inverse Compton scattering [67]. A lower intrinsic value of the brightness temperature, K, was derived under the assumption that there is equipartition between the energy densities of the particles and the magnetic field [68]. Observed brightness temperatures that exceed the equipartition value are usually attributed to the Doppler-boosting effect. The Doppler factor can then be calculated as
| (1) |
The brightness temperature of the VLBI core component is obtained using the following formula:
| (2) |
where Sν is the flux density in Jy at the observing frequency , and is the FWHM diameter of the circular Gaussian component measured in mas. The observing frequency is in GHz. If we take the values in Table 3 and the equipartition brightness temperature as the intrinsic value, then the calculated Doppler factor of the compact core in J1430+4204 varies in the range of 11–36 at the different epochs.
If we use the projected proper motion of J2 (with an absolute value about 0.100 mas yr-1, Table 4) as the apparent bulk motion, the corresponding apparent transverse speed is . Parameters of the radio jets that characterise their orientation and relativistic motion are the viewing angle with respect to the line of sight, , and the Lorentz factor, . They can be derived from the following formulae (e.g. [32]):
| (3) |
| (4) |
where is the apparent transverse speed measured in the units of . We apply the average of the values derived for J2 at the different epochs as the Doppler factor, . This way we obtain for the Lorentz factor and for the jet viewing angle.