Electrochemical Properties and Crystal Structure of \ceLi+ / \ceH+ Cation-exchanged \ceLiNiO2
Abstract
\ceLiNiO2 has high energy density but easily reacts with moisture in the atmosphere and deteriorates. We performed qualitative and quantitative evaluations of the degraded phase of \ceLiNiO2 and the influence of the structural change on the electrochemical properties of the phase. \ceLi_H_xNiO2 phase with cation exchange between \ceLi+ and \ceH+ was confirmed by thermogravimetric analysis and Karl Fischer titration measurement. As the \ceH concentration in \ceLiNiO2 increased, the rate capability deteriorated, especially in the low-temperature range and under low state of charge. Experimental and density functional theory (DFT) calculation results suggested that this outcome was due to increased activation energy of \ceLi+ diffusion owing to cation exchange. Rietveld analysis of X-ray diffraction and DFT calculation confirmed that the lattice parameter and Li-O layer reduced because of the \ceLi+/\ceH+ cation exchange. These results indicate that \ceLiNiO2 modified in the atmosphere has a narrowed Li-O layer, which is the \ceLi diffusion path, and the rate characteristics are degraded.
I Introduction
Increasing environmental awareness has raised the demand for vehicles with low \ceCO2 emissions. In recent years, global environmental concerns have accelerated the development and spread of hybrid electric vehicles (HEVs), plug-in hybrid electric vehicles, pure electric vehicles, and fuel-cell-based electric vehicles equipped with lithium-ion batteries (LIBs). LIBs installed in electric vehicles are required to have high energy density, rate capability, safety, and lifetime. Neubauer et al. (2014) Ni-rich cathode active materials such as \ceLiNiO2 Ohzuku et al. (1993); Kalyani and Kalaiselvi (2005); Moshtev et al. (1999); Ohzuku et al. (1995) and \ceLiNi_xCo_yAl_zO2 Lin et al. (2002); Zhu et al. (2004); Park et al. (2001); Li and Currie (1997); Lee et al. (2001); Liu et al. (2006a) are used in automotive lithium ion secondary battery applications owing to their high energy density. However, Ni-rich cathode active materials have the problem that they easily react with moisture in the atmosphere, causing structural change of the material and generation of residual Li impurities such as \ceLiOH, \ceLi2CO3, and \ceLiHCO3. As a result, the \ceLi+ insertion and desorption reactions with the active material are inhibited, and the electrochemical characteristics are deteriorated. Matsumoto et al. (1999); Liu et al. (2007); Faenza et al. (2017); Zhang et al. (2011); Liu et al. (2006a) Regarding the structural change caused by the reaction between \ceLiNiO2 and \ceH2O, a structure in which \ceLi and \ceH are cation-exchanged as shown in eq (1) has been proposed. Faenza et al. (2017); Moshtev et al. (1999) However, a result that confirms the existence of \ceLi_1-xH_xNiO2 experimentally has not been obtained.
| \ceH2O + \ceLiNiO2 \ceH2O + x\ceLiOH + \ceLi_1-xH_xNiO2 | (1) |
One of the reasons why it is difficult to identify substances experimentally is the extremely low content of the target. Usually, X-ray powder diffraction is effective in identifying the generated heterogeneous phase, but if the amount of phase is very small, such as a phase that has been altered by exposure to the atmosphere, it may be impossible to evaluate it directly because it is below the detection limit of the measuring device.
Herein, we performed experimental and computational approaches, to find out the qualitative and quantitative identification of the structural phase of \ceLi_H_xNiO2 and the investigation of its influence on the electrochemical properties. The qualitative and quantitative identifications of structural change phases were attempted by combining thermogravimetric analysis and Karl Fischer titration measurements. Although it may not be possible to clearly deduce the structural change phase itself in experiments, its influence on the electrochemical properties and lattice parameter can be clearly observed even with a small amount. Therefore, we simulated the crystal structure and electrochemical properties of \ceLi_H_xNiO2 which was estimated structural change phase, using first-principles calculations and confirmed the agreement between the experimental and simulation results. This study is a new initiative that shows the effects of atmospheric exposure of cathode active materials on the crystal structure and electrochemical properties accurately and quantitatively, and proposes factor to be considered especially for Ni-rich cathode active materials.
II Experimental methods
II.1 Substitution of \ceLi+/\ceH+ in \ceLiNiO2
LiNiO2 samples were obtained by solid phase synthesis of \ceNi(OH)2 and \ceLiOH. \ceNi(OH)2 precursors were synthesized by co-precipitation. Huang et al. (2015) A 2.0 M aqueous solution of \ceNiSO4 was pumped into a continuously stirred tank reactor in nitrogen atmosphere. The \cepH of the solution inside the reactor was controlled at approximately 11 by adding \ceNaOH solution. \ceNH4OH solution, which acts as a chelating agent to control the \ceNi ion neutralization reaction time, was separately pumped into the reactor. The \ceNi(OH)2 powder sample was washed, filtered, and dried in an oven at 120 ∘C for several hours. The prepared precursors were thoroughly mixed with \ceLiOH powder at the ratio of \ceLi/\ceNi = 1.01. The mixture was synthesized for 12 h at 710 ∘C in \ceO2 flow. The synthesized \ceLiNiO2 was placed in a chamber (LHL-113, ESPEC) maintained at 30 ∘C and 60% relative humidity under air circulation for 0, 9, 25, and 49 h. The four prepared \ceLiNiO2 samples are denoted as LNO0 h, LNO9 h, LNO25 h, and LNO49 h depending upon the exposure time.
LiNiO2 contains \ceLiOH and \ceLi2CO3 produced by exposure to the atmosphere; therefore, the effects of the structural change phase and the residual Li compounds cannot be distinguished. In order to isolate the influence of the structural change phase, we attempted to remove the residual \ceLi compound by washing the active material. The solvent used for removing the residual \ceLi compound should be selected by considering its reactivity with \ceLiNiO2. For example, excessive extraction of \ceLi (eq.( 1)) from the bulk can occur by using water as the solvent. Excessive delithiation causes significant degradation of the electrochemical properties, Moshtev et al. (1999); Xu et al. (2017) making it difficult to evaluate the effects of atmospheric exposure properly. Therefore, we used ethanol, which has poor reactivity with \ceLi, as the washing solvent. To obtain \ceLiNiO2 without residual \ceLi compound, 10 g \ceLiNiO2 powder was added to 200 mL of distilled ethanol under constant stirring with a magnetic stirrer for 5 min.
II.2 Material characterization
The surface morphologies of the samples were observed by field emission scanning electron microscopy (FE-SEM, JSM-7001, JEOL). The phase transformation of the surface layer was observed by spherical-aberration-corrected scanning transmission electron microscopy (CS-STEM, JEM-ARM200F, JEOL). The samples were sliced to a thickness of 100 nm or less using a focused ion beam (FIB, NIB-5000, Hitachi), and the samples were observed under the acceleration voltage of 200 kV. The crystalline phases of the prepared samples were identified using X-ray powder diffractometer (XRD, X’Pert Pro MPD, PANalytical) with \ceCu-K radiation. The XRD data pattern was recorded at the scan rate of 5∘ min-1 in the 2 range of 15∘ to 100∘. Rietan-FP software Izumi and Momma (2007) was used for Rietveld analysis. The thermal behavior of the \ceLiNiO2 samples were investigated by thermogravimetric analysis (TGA) (DSCX3100SA, NETSZCH). Karl Fischer (KF) titration (CA-200, MITSUBISHI CHEMICAL ANALYTICAL) was used to evaluate to \ceH2O concentration.
II.3 Electrochemical techniques
Electrochemical measurements were carried out with a laminated-type full cell and CR2032 coin-type symmetric cell with positive electrodes facing each other. These cells were used for rate capability test and electrochemical impedance spectroscopy (EIS) measurement, respectively. Each \ceLiNiO2 sample was mixed with a conducting agent (carbon black) and polyvinylidene fluoride (PVDF) at 85:10:5 weight ratio in N-methyl-2-pyrrolidone (NMP) to prepared a slurry. Then, each slurry was applied to an aluminum current collector and dried in a vacuum oven for 8 h at 120 ∘C. The dried coating foil was then compressed to a layer of 20 m thickness using a roll press. Cu foil coated with graphite was used as the negative electrode in the laminate type cell. The electrolyte was 1.0 M \ceLiPF6 in ethylene carbonate (EC) - dimethyl carbonate (DMC) solution (3:7 by volume). For the rate capability test of the laminate-type cells, discharge rates at different current densities varying from 0.1 to 10C were applied using constant current (CC) with fixed charge rate of 0.1C and constant current - constant voltage (CC-CV) within the voltage range from 2.5 to 4.2 V at 25 ∘C. EIS measurements of the symmetric cells were carried out by applying an AC - amplitude of 10 mV at 100 kHz to 1 mHz frequency between -20 ∘C and 45 ∘C. The resulting Nyquist plots were analyzed using ZView software (Scribner Associates, Inc.).
II.4 Computational Methodology
All first-principles calculations using DFT were performed with the Vienna Ab initio Simulation Package (VASP) Kresse and Furthmüller (1996a, b) with projector augmented wave (PAW) potentials. A plane-wave basis set cutoff energy of 650 eV and a Monkhorst-Pack 3 × 3 × 1 k-points mesh was used for all calculations. The calculation was performed using a supercell constructed from the primitive cell by tripling the system along the directions of the and axes. Energy optimizations were based on the tetrahedron method with Blöchl corrections for Brillouin-zone integrations; their convergence criteria for the self-consistent field (SCF) and maximum force were set to 0.1 meV/atm and 1.0 meV/Å, respectively. We adopted the optB86b-vdW functional Klime et al. (2011); Yoshida et al. (2019); Radin and Van Der Ven (2016) as the exchange-correlation (XC) functional because it is known to accurately reproduce experimental results such as voltage and volume in the Li detachment state. Considering the Coulomb interaction of the Ni 3 orbit, a correction of was added to Ni 3. Zhou et al. (2004) In this study, the structural configuration was drawn using VESTA software. Momma and Izumi (2011) In the structure relaxation calculation of the Li desorption structure, all symmetry structures that are Li defect sites were calculated, and the lowest energy configuration was defined as the Li desorption structure. The climbing image nudged elastic band (CI-NEB) method was used to determine the Li-ion diffusion barriers and paths. Henkelman and Jónsson (2000); Henkelman et al. (2000) The initial and final configurations were determined by separately optimizing the structure with a vacancy at each of the two adjacent sites. A group of images generated by linear interpolation between the two endpoint configurations was optimized to converge to points on the minimum energy path. The five intermediate images between the two endpoints were generated by linear interpolation between the two endpoint configurations. The convergence criterion used in the CI-NEB calculations was that the forces acting on each atom was lesser than 0.02 meV/Å.
III Results and Discussion
III.1 Characterization
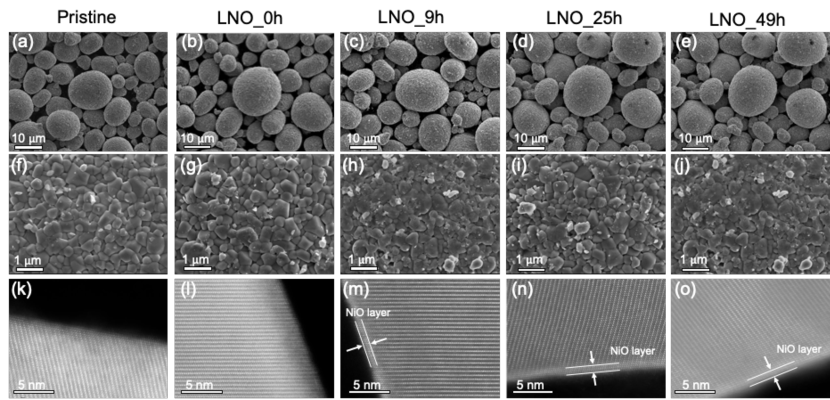
SEM and STEM observations were performed to evaluate the changes in the primary and secondary particles and surface structure changes before and after exposure to the atmosphere and washing. Each sample was confirmed to be free of primary and secondary particle size changes, particle collapse, and deformation (Figure 1(a)-(j)). On the other hand, the particle surface changed smoothly as the exposure time to the atmosphere increased, suggesting structural changes due to exposure. In the HAADF-STEM images of the particle surface (Figure 1(k)-(l)), layered stripes representing the R3̄m structure of \ceLiNiO2 were observed both inside and on the surface of pristine (k) and LNO0 h(l). The results also confirmed that the washing process in this study removed the residual Li compound without changing the structure of the active material. In contrast, the LNO9 h(m), LNO25 h(n), and LNO49 h(o) samples had altered layers with thickness of approximately 1 nm on the outermost surface. This alteration phase on the outermost surface was suggested to be \ceNiO with Fm3̄m structure caused by the change in the arrangement of Ni atoms. Lee et al. (2018); Cho et al. (2013); Hayashi et al. (2014); Makimura et al. (2012); Huang et al. (2019) Because the \ceNiO thickness was almost constant regardless of the samples exposed to the atmosphere, the influence of \ceNiO is considered not to appear as a difference between the samples in the results of the electrochemical evaluation described later.
TGA analysis was performed to identify the structural change phases owing to phenomena such as thermal decomposition and oxidation. Figure 2 shows the TGA results of \ceLiNiO2 after atmospheric exposure.
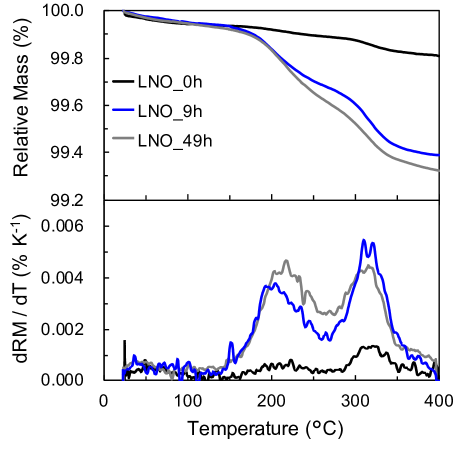
Weight loss from approximately 100-120 ∘C indicates water adsorption–desorption reactions. In the higher temperature region, large weight loss peaks were observed at 200–220 ∘C and 300–320 ∘C. These weight change peaks have been reported to be due to \ceH2O and \ceO2 elimination from \ceNiOOH, as shown in eq. (2). Gu et al. (2011); Pan et al. (2005) \ceNi(OH)2 and \ceNiOOH may also be generated by the mixing of \ceLi+/\ceH+. However, the \ceNi(OH)2 decomposition temperature is approximately 300∘C, and the existence of one weight loss peak has been reported. Tang et al. (2014); Zhu et al. (2011) Therefore, the phase generated by atmospheric exposure is considered to be \ceNiOOH.
| \ceNiOOH \ceNiO + + \ceH2O | (2) |
Because LiNO0h had little weight reduction reaction in the temperature ranges of 200–220 ∘C and 300–320 ∘C, the amount of \ceNiOOH in the active material is considered to be small. On the other hand, in LNO9h and LNO49h, two peak changes at 200 ∘C or higher increased with increasing exposure time. From these results, it was suggested that the cation exchange of \ceLi+/\ceH+ proceeded at atmospheric exposure, and the production of \ceNiOOH increased.
TGA can estimate the relationship between temperature and weight change reaction, but it is difficult to identify and quantitatively analyze the reacted substance. Therefore, quantitative analysis of the amount of \ceNiOOH, that is, the amount of \ceH+ exchange, was attempted by quantifying the amount of \ceH2O produced by the reaction in eq.(2). In order to separate the amount of \ceH2O derived from the adsorbed water and the amount of \ceH2O derived from the decomposition reaction of \ceNiOOH, KF titration analysis was performed under two conditions of 120 ∘C and 300 ∘C. Titration at 120 ∘C detects the adsorbed water, and that at 300 ∘C detects the total amount of \ceH2O generated by decomposition of adsorbed water and \ceNiOOH. Therefore, the amount of \ceH2O derived from the decomposition of \ceNiOOH can be determined by taking the difference between the titration results of 300 ∘C (KF 300∘C) and 120 ∘C(KF 120∘C). Figure 3 shows the results of KF titration.
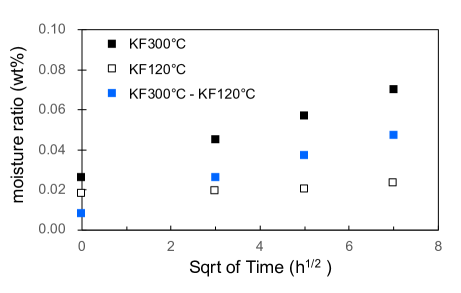
The value of KF300∘C-KF120∘C increased in proportion to the square root of the exposure time, that is, the amount of \ceNiOOH produced increased with the exposure time. We assumed that the \ceH desorption reaction was due to heating during KF titration, as expressed in eq.(3). In this case, the amount of \ceH contained in \ceLiNiO2 can be calculated as shown in eq.(4) by using the amount of \ceH2O derived from NiOOH, ( KF 300∘C - KF 120∘C). The \ceH concentrations of LNO0 h, LNO9 h, LNO25 h, and LNO49 h were determined to be 0.08, 0.28, 0.40, and 0.51 at%, respectively.
| \ceLi_1-H_NiO2 + \ceO2 \ceLi_1-NiO2 + \ceH2O | (3) |
| = | (4) |
XRD evaluation was performed to investigate the crystal structure change due to cation exchange of \ceLi+/\ceH+. Figure 4(a),(b) shows the XRD profile of each sample.
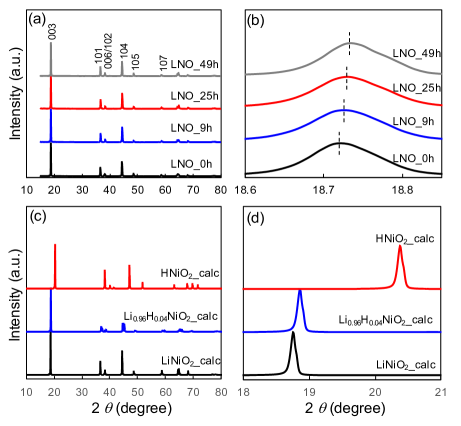
From the results of Fig. 4(a), it was confirmed that no significant heterogeneous formation was observed in any sample, and \ceLiNiO2 was the main phase. The (003) diffraction peak near 18.8∘, i.e., the 3a site (Li site) in the R3̄m structure, showed a shift of the diffraction angle toward the higher angle side with increasing atmospheric exposure time (Figure 4(b)). In order to verify whether this peak shift was caused by \ceLi+/\ceH+ cation exchange, the XRD peak of \ceLi_1-xH_xNiO2 was simulated using first principles calculations. Figure 4(c), (d) shows the XRD profiles calculated for the crystal structure of \ceLiNiO2 obtained by structural relaxation calculation with Li replaced by 0 at%, 3.7 at%, and 100 at% of \ceH. Similar to the experimental results, the relationship between the \ceH content and the shift of the (003) peak position was also confirmed by calculation. From these results, it was found that the (003) peak position shifts to the higher angle side due to the exchange of \ceLi+/\ceH+, i.e., the -axis lattice constant shrinks. In addition, the lattice constants obtained by Rietveld analysis and first-principles calculation are summarized in Table 1.
| Samples | H (at%) | a (Å) | c (Å) |
|---|---|---|---|
| LNO0h | 0.08 | 2.8776 | 14.2057 |
| LNO9h | 0.28 | 2.8766 | 14.2005 |
| LNO25h | 0.40 | 2.8761 | 14.1988 |
| LNO49h | 0.51 | 2.8755 | 14.1962 |
| \ceLiNiO2(calc) | 0 | 2.8500 | 14.1966 |
| \ceLi_0.96H_0.04NiO2(calc) | 3.70 | 2.8446 | 14.1052 |
| \ceHNiO2(calc) | 100 | 2.7554 | 12.9179 |
III.2 Electrochemical properties
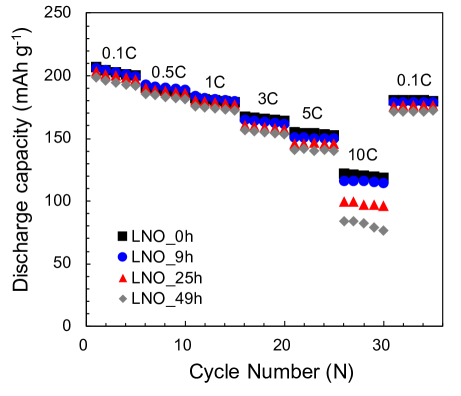
Rate capability test results measured at different current densities (0.1–10C) are shown in Figure 5. At low discharge rate (0.1–1C), all samples showed almost the same discharge capacity. On the other hand, at high discharge rate (3–10C), a significant decrease in the discharge capacity was confirmed in the LNO25 h and LNO49 h samples. This result implies that a material with a large amount of \ceLi+/\ceH+ is slow to exhibit the \ceLi+ transfer reaction at high discharge rate.
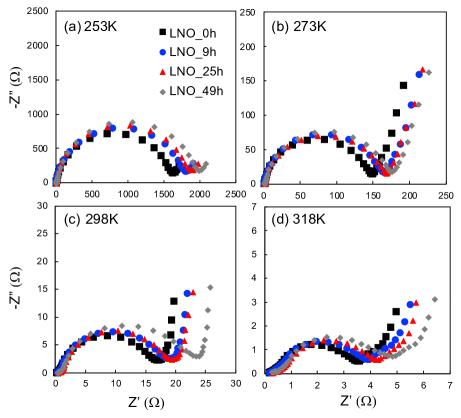
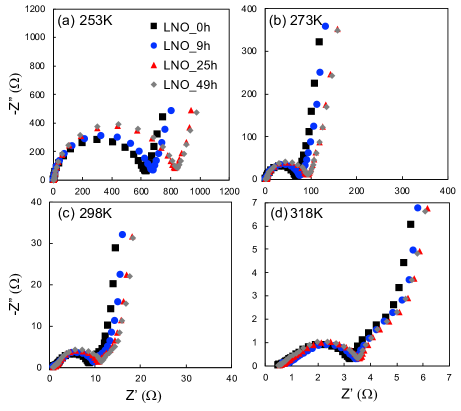
EIS measurements were carried out to investigate the electrochemical resistance. In this study, the positive electrode resistance was measured using a symmetric coin cell with the positive electrodes facing each other. The resistance components of the cathode and anode are intermixed in the impedance spectrum of a normal full cell, and distinguishing the resistance of the positive electrode alone is difficult. Furthermore, in order to evaluate the relationship between the amount of \ceLi contained in \ceLiNiO2 and the resistance, measurements were performed under the conditions of \ceLi0.50NiO2 and \ceLi0.75NiO2. In addition, EIS measurements were performed under four conditions of 253, 273, 298, and 318 K to obtain the temperature dependence of \ceLi+ diffusion coefficient and the activation energy of the diffusion. Figure 6 and Figure 7 show the Nyquist plots of \ceLi0.50NiO2 and \ceLi0.75NiO2, respectively. In \ceLi0.50NiO2, the charge transfer resistance (Rct) increased with increase in the amount of \ceLi+/\ceH+ cation exchange in the temperature range of 253–318 K. On the other hand, in \ceLi0.75NiO2, Rct markedly increased in the LNO25 h and LNO49 h samples in the low-temperature region of 253 K, but no significant difference in Rct was observed in any sample in the region of 273–318 K. To summarize these results, the higher the \ceLi concentration in \ceLiNiO2 or the lower the operating temperature, the greater the effect on Li insertion reaction due to \ceLi+/\ceH+ cation exchange. Some studies have shown that the increase in resistance in the low-temperature range is caused by a decrease in the diffusion rate of \ceLi+ Tan et al. (2015); Keefe et al. (2019); Jin and Duh (2017) and the relationship between the \ceLi concentration in the bulk and the diffusion coefficient of \ceLi+. Ven and Ceder (2000); Montoro and Rosolen (2004) Therefore, we believe that the \ceLi_1-xH_xNiO2 phase that underwent structural change due to atmospheric exposure affected the \ceLi+ diffusion.
The diffusion region of the EIS spectrum was analyzed to obtain the \ceLi diffusion coefficient of each sample. The linear behavior in the low-frequency region of the EIS spectrum shows the \ceLi+ diffusion behavior, and the \ceLi+ diffusion coefficient is calculated using the expression eq.(5). Ho et al. (1980); Liu et al. (2006b); Chen et al. (2016); Jin and Duh (2017); Shi et al. (2018)
| (5) |
where denotes the gas constant, is the absolute temperature, is the area of the cathode/electrolyte interface ( = 1.33cm2), is the charge number of the electroactive species (n=1), is Faraday’s constant, is the concentration of lithium ion, and is the Warburg factor. The Warburg factor was obtained from the slope of the plots of Z’ vs ( is the angular frequency) in the Warburg region .Liu et al. (2006b) obtained by the formula (5) is shown in Figure 8. increased with rising temperature, and the calculated value of was in good agreement with the previously reported \ceLiNiO2 measurement result. Nakamura et al. (2000); Sugiyama et al. (2010)
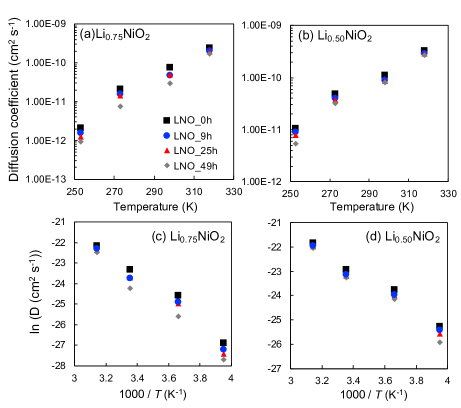
Furthermore, we derived the activation energy of diffusion using the following Arrhenius equation. Nakamura et al. (2000); Okubo et al. (2009); Moriwake et al. (2013); Jin and Duh (2017)
| (6) |
The determined activation energy () is shown in Table2. Increase in was confirmed by increasing \ceLi concentration in \ceLiNiO2 and decreasing temperature, and this result corresponded to the EIS spectrum variation. Therefore, the influence of \ceLi+/\ceH+ cation exchange on the electrochemical properties (increased resistance and degradation of rate capability) is attributed to the increase in the activation energy of \ceLi+ diffusion.
| (eV) | ||||
|---|---|---|---|---|
| Sample | LNO0h | LNO9h | LNO25h | LNO49h |
| \ceLi0.75NiO2 | 0.488 | 0.498 | 0.518 | 0.534 |
| \ceLi0.50NiO2 | 0.351 | 0.351 | 0.364 | 0.396 |
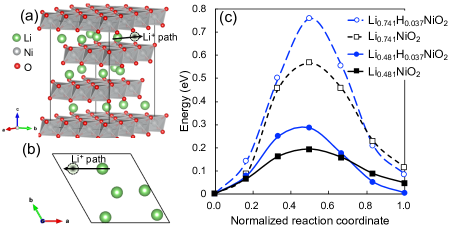
To further verify whether the change in activation energy was due to the effect of \ceLi+/\ceH+ cation exchange, the barrier energy for \ceLi+ diffusion in \ceLi_1-xH_xNiO2 was calculated by the CI-NEB method. The calculation was performed using a structure in which one of the 27 Li atoms contained in the supercell was replaced with an H atom (x = 0.037). In addition, the barrier energies of \ceLi0.481H_NiO2 and \ceLi0.741H_NiO2, which are close to the amount of Li desorption in the experiment, were calculated. Figure 9(a)(b) shows the \ceLi+ diffusion paths of \ceLi0.481NiO2 as an example of the calculated structure. The energy profiles of \ceLi0.741NiO2, \ceLi0.741H_NiO2, \ceLi0.481NiO2, and \ceLi0.481H_NiO2 are shown in Figure 9(c); the barrier energies were determined to be 0.567, 0.760, 0.193, and 0.286 eV, respectively. At the Li concentrations of (1-x) = 0.48 and 0.75, the barrier energy increased with increase in the \ceH+ concentration in \ceLiNiO2, and the same tendency as observed in the experimental results was obtained. In literature Kang and Ceder (2006), the barrier energy of \ceLi0.50NiO2 is reported as approximately 0.20–0.30 eV, and the calculation result of \ceLi0.481NiO2 shows a close value (0.193 eV).
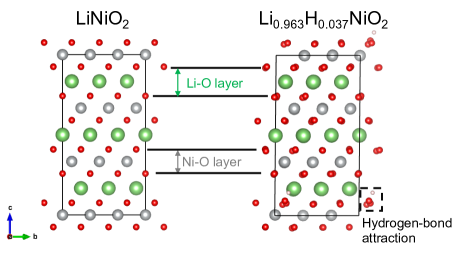
After structural relaxation calculation, Figure 10 shows that \ceO atoms are attracted to \ceH atom in the Li-O layer of \ceLi_H_NiO2. In \ceNiOOH, it has been reported Horànyi (1989); Van der Ven et al. (2006); Li and Selloni (2014); Tkalych et al. (2015) that the \ceNiO2 and \ceNi(OH)2 slabs are alternately stacked by bonding through hydrogen bonds. From the reported phenomenon, it is presumed that the \ceH atoms in the Li-O layer cause an attractive action in the form of hydrogen bonds between the upper and lower \ceNiO2 slabs, resulting in the shrinkage of the Li-O layer thickness. In addition, the inverse relationship between the Li-O layer thickness and the activation energy is known, Kang and Ceder (2006) which is presumed to be the cause of increase in the activation energy due to \ceLi+/\ceH+ cation exchange.
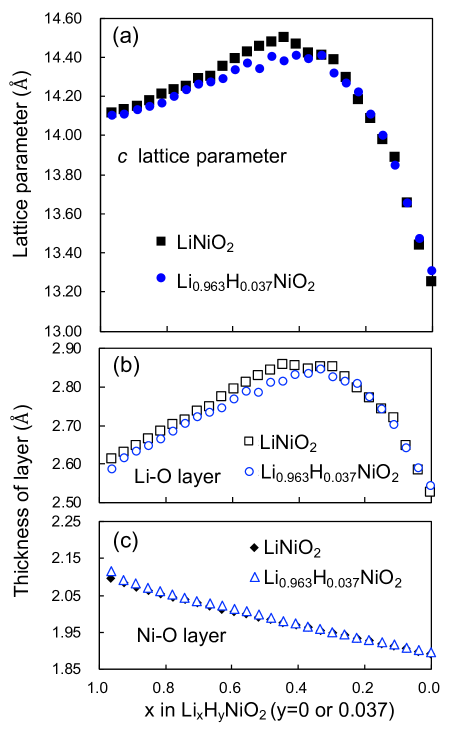
Furthermore, we investigated changes in the c lattice constant, Li-O layer thickness, and Ni-O layer thickness with respect to the amount of Li desorption in \ceLi_xNiO2 and \ceLi_xH0.037NiO2. The structures in which Li was sequentially desorbed one after the other were determined by DFT calculation, and the parameters for each structure were obtained. \ceLi_xNiO2 has larger lattice parameter than \ceLi_xH0.037NiO2 in the region of x = 0.4–1.0 (Figure 11(a)). Based on the trend of the change in the layer thicknesses of the Li-O layer and Ni-O layer, it was confirmed that the change in the c-axis lattice constant due to \ceLi+/\ceH+ cation exchange was dominated by the change in thickness of the Li layer (Figure 11(b),(c)). This result agrees with the change in the activation energy determined by the experiment and CI-NEB method.
IV SUMMARY
The structural changes and their effects on the electrochemical properties of \ceLiNiO2 exposed to the atmosphere were investigated. Thermal and chemical analyses revealed that \ceLiNiO2 exposed to the atmosphere assumes the structure of \ceLi_1-xH_xNiO2 with \ceLi+/\ceH+ cation exchange. We synthesized \ceLiNiO2 with different amounts of \ceH+ exchange, and investigated the influence of \ceLi_1-xH_xNiO2 on the electrochemical properties. As a result, it was found that the activation energy of \ceLi+ diffusion increased by the exchange of \ceH+, resulting in higher resistance and lower rate capability. Our first principles analysis calculation revealed that the increase in the activation energy was caused by decrease in the Li layer thickness, that is, constriction of the diffusion path of \ceLi+.
V Acknowledgments
T. T. is deeply grateful to K. Ryoshi and T. Yoshida for their fruitful discussions and technical support. The computations in this work were performed using the facilities of Research Center for Advanced Computing Infrastructure at JAIST. K. H. is grateful for the financial support from KAKENHI (grant numbers 17K17762 and 19K05029), Grant-in-Aid for Scientific Research on Innovative Areas (16H06439 and 19H05169), the FLAG-SHIP2020 project (MEXT for computational resources, projects hp190169 and hp190167 using K-computer), PRESTO (JPMJPR16NA), and Materials research by Information Integration Initiative (MI2I) project of the Support Program for Starting Up Innovation Hub from Japan Science and Technology Agency (JST). R. M. is grateful for financial support from MEXT-KAKENHI (projects JP19H04692 and JP16KK0097), the FLAG-SHIP2020 project (MEXT for computational resources, projects hp190169 and hp190167 using K-computer), and the Air Force Office of Scientific Research (AFOSR-AOARD/FA2386-17-1-4049;FA2386-19-1-4015).
References
- Neubauer et al. (2014) J. Neubauer, A. Pesaran, C. Bae, R. Elder, and B. Cunningham, J. Power Sources 271, 614 (2014).
- Ohzuku et al. (1993) T. Ohzuku, A. Ueda, and M. Nagayama, J. Electrochem. Soc. 140, 1862 (1993).
- Kalyani and Kalaiselvi (2005) P. Kalyani and N. Kalaiselvi, Sci. Technol. Adv. Mater. 6, 689 (2005).
- Moshtev et al. (1999) R. Moshtev, P. Zlatilova, S. Vasilev, I. Bakalova, and A. Kozawa, J. Power Sources 81-82, 434 (1999).
- Ohzuku et al. (1995) T. Ohzuku, A. Ueda, and M. Kouguchi, J. Electrochem. Soc. 142, 4033 (1995).
- Lin et al. (2002) S. P. Lin, K. Z. Fung, Y. M. Hon, and M. H. Hon, J. Solid State Chem. 167, 97 (2002).
- Zhu et al. (2004) X. Zhu, H. Chen, H. Zhan, D. Yang, and Y. Zhou, Mater. Chem. Phys. 88, 145 (2004).
- Park et al. (2001) S. H. Park, K. S. Park, Y. Sun Kook, K. S. Nahm, Y. S. Lee, and M. Yoshio, Electrochim. Acta 46, 1215 (2001).
- Li and Currie (1997) W. Li and J. C. Currie, J. Electrochem. Soc. 144, 2773 (1997).
- Lee et al. (2001) K. K. Lee, W. S. Yoon, K. B. Kim, K. Y. Lee, and S. T. Hong, J. Power Sources 97-98, 308 (2001).
- Liu et al. (2006a) H. Liu, Y. Yang, and J. Zhang, J. Power Sources 162, 644 (2006a).
- Matsumoto et al. (1999) K. Matsumoto, R. Kuzuo, K. Takeya, and A. Yamanaka, J. Power Sources 81-82, 558 (1999).
- Liu et al. (2007) H. Liu, Y. Yang, and J. Zhang, J. Power Sources 173, 556 (2007).
- Faenza et al. (2017) N. V. Faenza, L. Bruce, Z. W. Lebens-Higgins, I. Plitz, N. Pereira, L. F. Piper, and G. G. Amatucci, J. Electrochem. Soc. 164, A3727 (2017).
- Zhang et al. (2011) X. Zhang, W. J. Jiang, X. P. Zhu, A. Mauger, Qilu, and C. M. Julien, J. Power Sources 196, 5102 (2011).
- Huang et al. (2015) S. Huang, H. Wu, P. Chen, Y. Guo, B. Nie, B. Chen, H. Liu, and Y. Zhang, J. Mater. Chem. A 3, 3633 (2015).
- Xu et al. (2017) S. Xu, C. Du, X. Xu, G. Han, P. Zuo, X. Cheng, Y. Ma, and G. Yin, Electrochim. Acta 248, 534 (2017).
- Izumi and Momma (2007) F. Izumi and K. Momma, Solid State Phenom. 130, 15 (2007).
- Kresse and Furthmüller (1996a) G. Kresse and J. Furthmüller, Comput. Mater. Sci. 6, 15 (1996a).
- Kresse and Furthmüller (1996b) G. Kresse and J. Furthmüller, Phys. Rev. B 54, 11169 (1996b).
- Klime et al. (2011) J. Klime, D. R. Bowler, and A. Michaelides, Phys. Rev. B 83, 1 (2011).
- Yoshida et al. (2019) T. Yoshida, K. Hongo, and R. Maezono, J. Phys. Chem. C 123, 14126 (2019).
- Radin and Van Der Ven (2016) M. D. Radin and A. Van Der Ven, Chem. Mater. 28, 7898 (2016).
- Zhou et al. (2004) F. Zhou, M. Cococcioni, C. A. Marianetti, D. Morgan, and G. Ceder, Phys. Rev. B 70, 1 (2004).
- Momma and Izumi (2011) K. Momma and F. Izumi, J. Appl. Crystallogr. 44, 1272 (2011).
- Henkelman and Jónsson (2000) G. Henkelman and H. Jónsson, J. Chem. Phys. 113, 9978 (2000).
- Henkelman et al. (2000) G. Henkelman, B. P. Uberuaga, and H. Jónsson, J. Chem. Phys. 113, 9901 (2000).
- Lee et al. (2018) W. Lee, S. Muhammad, T. Kim, H. Kim, E. Lee, M. Jeong, S. Son, J. H. Ryou, and W. S. Yoon, Adv. Energy Mater. 8, 1 (2018).
- Cho et al. (2013) Y. Cho, P. Oh, and J. Cho, Nano Lett. 13, 1145 (2013).
- Hayashi et al. (2014) T. Hayashi, J. Okada, E. Toda, R. Kuzuo, N. Oshimura, N. Kuwata, and J. Kawamura, J. Electrochem. Soc. 161, 1007 (2014).
- Makimura et al. (2012) Y. Makimura, S. Zheng, Y. Ikuhara, and Y. Ukyo, J. Electrochem. Soc. 159, 1070 (2012).
- Huang et al. (2019) B. Huang, D. Liu, K. Qian, L. Zhang, K. Zhou, Y. Liu, F. Kang, and B. Li, ACS Appl. Mater. Interfaces 11, 14076 (2019).
- Gu et al. (2011) H. M. Gu, W. Wang, and Y. C. Zhai, Adv. Mater. Res. 239-242, 646 (2011).
- Pan et al. (2005) J. Pan, Y. Sun, P. Wan, Z. Wang, and X. Liu, Electrochem. commun. 7, 857 (2005).
- Tang et al. (2014) A. Tang, X. Li, Z. Zhou, O. Jing, and H. Yang, J. Alloys Compd. 600, 204 (2014).
- Zhu et al. (2011) Z. F. Zhu, N. Wei, H. Liu, Z. L. He, and D. Yang, Adv. Powder Technol. 42, 436 (2011).
- Tan et al. (2015) S. Y. Tan, L. Wang, L. Bian, J. B. Xu, W. Ren, P. F. Hu, and A. M. Chang, J. Power Sources 277, 139 (2015).
- Keefe et al. (2019) A. S. Keefe, S. Buteau, I. G. Hill, and J. R. Dahn, J. Electrochem. Soc. 166, A3272 (2019).
- Jin and Duh (2017) Y.-C. Jin and J.-G. Duh, J. Electrochem. Soc. 164, A735 (2017).
- Ven and Ceder (2000) A. V. D. Ven and G. Ceder, Electrochem. Solid-State Lett. 3, 5 (2000).
- Montoro and Rosolen (2004) L. A. Montoro and J. M. Rosolen, Electrochim. Acta 49, 3243 (2004).
- Ho et al. (1980) C. Ho, I. Raistrick, and R. A. Huggins, J. Electrochem. Soc. 127, 343 (1980).
- Liu et al. (2006b) H. Liu, C. Li, H. P. Zhang, L. J. Fu, Y. P. Wu, and H. Q. Wu, J. Power Sources 159, 717 (2006b).
- Chen et al. (2016) P. Chen, H. Wu, S. Huang, and Y. Zhang, Ceram. Int. 42, 10498 (2016).
- Shi et al. (2018) Y. Shi, M. Zhang, C. Fang, and Y. S. Meng, J. Power Sources 394, 114 (2018).
- Nakamura et al. (2000) K. Nakamura, H. Ohno, K. Okamura, Y. Michihiro, I. Nakabayashi, and T. Kanashiro, Solid State Ionics 135, 143 (2000).
- Sugiyama et al. (2010) J. Sugiyama, Y. Ikedo, K. Mukai, H. Nozaki, M. Månsson, O. Ofer, M. Harada, K. Kamazawa, Y. Miyake, J. H. Brewer, E. J. Ansaldo, K. H. Chow, I. Watanabe, and T. Ohzuku, Phys. Rev. B 82, 1 (2010).
- Okubo et al. (2009) M. Okubo, Y. Tanaka, H. Zhou, T. Kudo, and I. Honma, J. Phys. Chem. B 113, 2840 (2009).
- Moriwake et al. (2013) H. Moriwake, A. Kuwabara, C. A. Fisher, R. Huang, T. Hitosugi, Y. H. Ikuhara, H. Oki, and Y. Ikuhara, Adv. Mater. 25, 618 (2013).
- Kang and Ceder (2006) K. Kang and G. Ceder, Phys. Rev. B 74, 1 (2006).
- Horànyi (1989) T. S. Horànyi, Thermochim. Acta 142, 143 (1989).
- Van der Ven et al. (2006) A. Van der Ven, D. Morgan, Y. S. Meng, and G. Ceder, J. Electrochem. Soc. 153, A210 (2006).
- Li and Selloni (2014) Y. F. Li and A. Selloni, J. Phys. Chem. Lett. 5, 3981 (2014).
- Tkalych et al. (2015) A. J. Tkalych, K. Yu, and E. A. Carter, J. Phys. Chem. C 119, 24315 (2015).