10 January 2020
A search for anomalous Cherenkov rings
V. F. Perepelitsa
ITEP, Moscow
T. Ekelof
Department of Physics and Astronomy, Uppsala University
A. Ferrer
IFIC, Valencia University
B. R. French
bernardfrench@bluewin.ch
The results of a search with the DELPHI Barrel RICH for Cherenkov rings having radii greater than those produced by ultrarelativistic particles are presented. The search for such anomalous rings, associated with tracks from electron-like particles, is based on the data collected by the DELPHI Collaboration at CERN during the LEP1 and LEP2 periods. The DELPHI RICH detector was conceived for the identification of the stable and quasi-stable hadrons (). The present analysis, made with the goal of finding anomalous Cherenkov rings, was aimed at the investigation of electron-like particles. A subsample of events containing anomalous rings has been identified for which the probability that the reconstructed rings in a given event are due to fortuitous combinations of background hits is low ( or less). A detailed study of background sources capable of producing apparently anomalous rings has been done; it indicates that the background hypothesis has a low probability. Additional arguments against this hypothesis are provided by a comparison of rates of events with single and double anomalous rings in the gaseous radiator, indicating a clear tendency for associated production of the anomalous rings, and by the observation of a high degree of correlation between anomalous ring radii in the liquid and gaseous radiators in these events.
This work has been performed by the authors following the rules for external access to the DELPHI archived data, as established in http://delphiwww.cern.ch/delsec/finalrules/FINALrules011203.pdf The opinions, findings and conclusions expressed in this material are those of the authors alone and do not reflect in any way the views of the DELPHI Collaboration.
1 Introduction
The results of a search for anomalous Cherenkov rings produced in the DELPHI detector RICH in the events of interactions recorded in the DELPHI experiment at LEP (CERN) are presented. The term “anomalous rings” here stands for rings having radii greater than those produced by ultrarelativistic particles which are termed here “standard rings”. In this article standard rings are defined as having the ring radius compatible with 667 mrad in the liquid radiator and 62 mrad in the gaseous radiator, while the anomalous rings are defined as having the ring radius exceeding 700 mrad in the liquid radiator and 72 mrad in the gaseous radiator.
The DELPHI detector RICH was conceived for the identification of the stable and quasi-stable hadrons (). The present analysis, made with the goal of finding anomalous Cherenkov rings, is aimed at the investigation of electron-like particles, which implies enhanced background from electromagnetic showers. Therefore a careful study of this background has been carried out as described below.
The data used consist of about non-hadronic events corresponding to an integrated luminosity of 0.76 fb-1.
This note is organized as follows. In Section 2 we describe the experimental method and present several examples of anomalous ring candidates. The topologies of events investigated are described in Section 3. Section 4 itemises the selection cuts used in a preliminary selection of events of the above topologies that are subsequently investigated for a presence of anomalous rings; it terminates with a description of the criteria of the final selection of these rings. Section 5 lists the known systematic effects which could produce hit patterns that imitate anomalous rings. Section 6 describes the studies of physical backgrounds due to statistical effects induced by the fortuitous combinations of the hits presented in the RICH hit patterns. Sections 7 and 8 describe additional tests of the background hypothesis. In Sections 9 and 10 further principal arguments against this hypothesis are given. Sections 11 and 12 provide a summary and conclusion.
There are two Appendices to the paper which are complementary to the main text. They describe the algorithm used to find Cherenkov rings and the method of calculation of the probability that ring, observed in a given RICH hit pattern, can be a fortuitous combination of RICH background hits.
2 Experimental details
2.1 Experimental technique
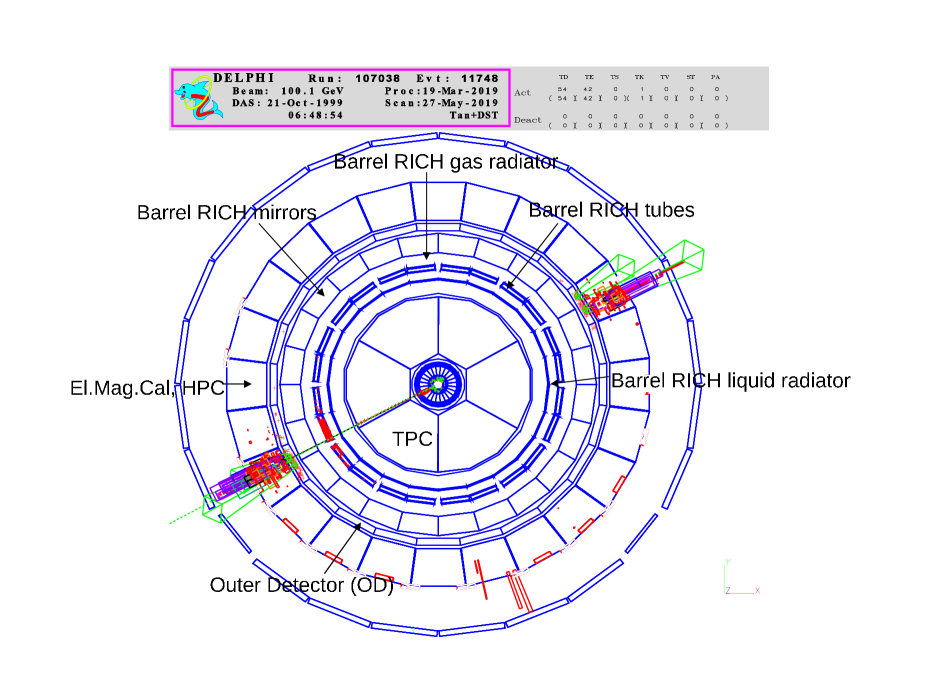
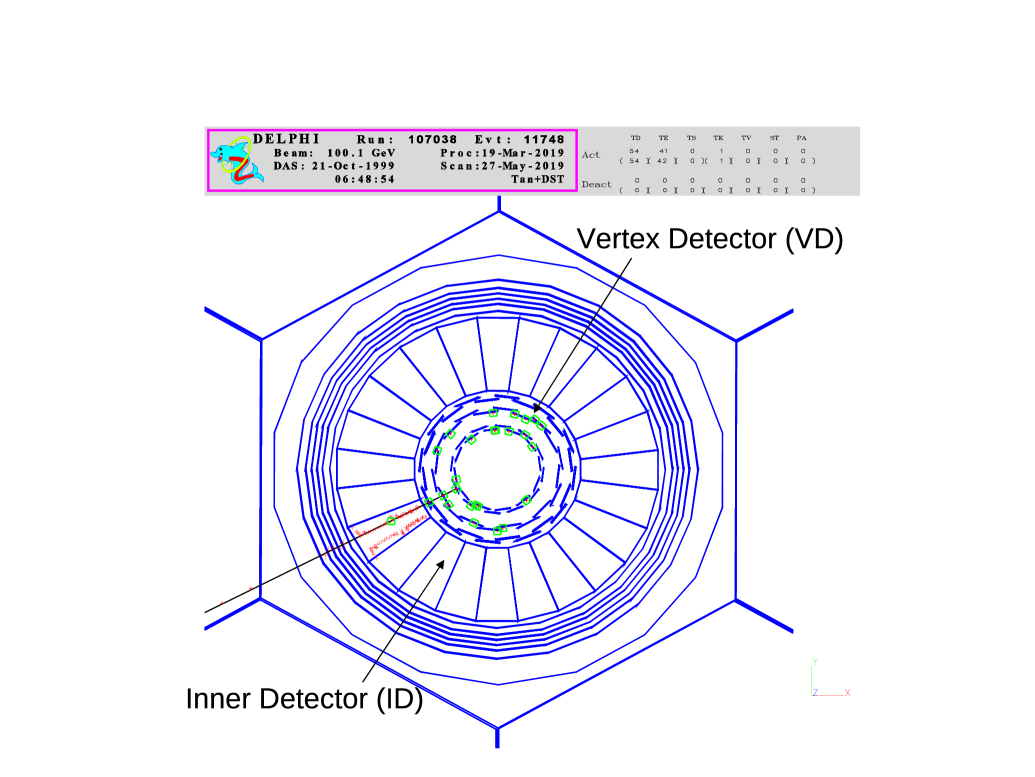
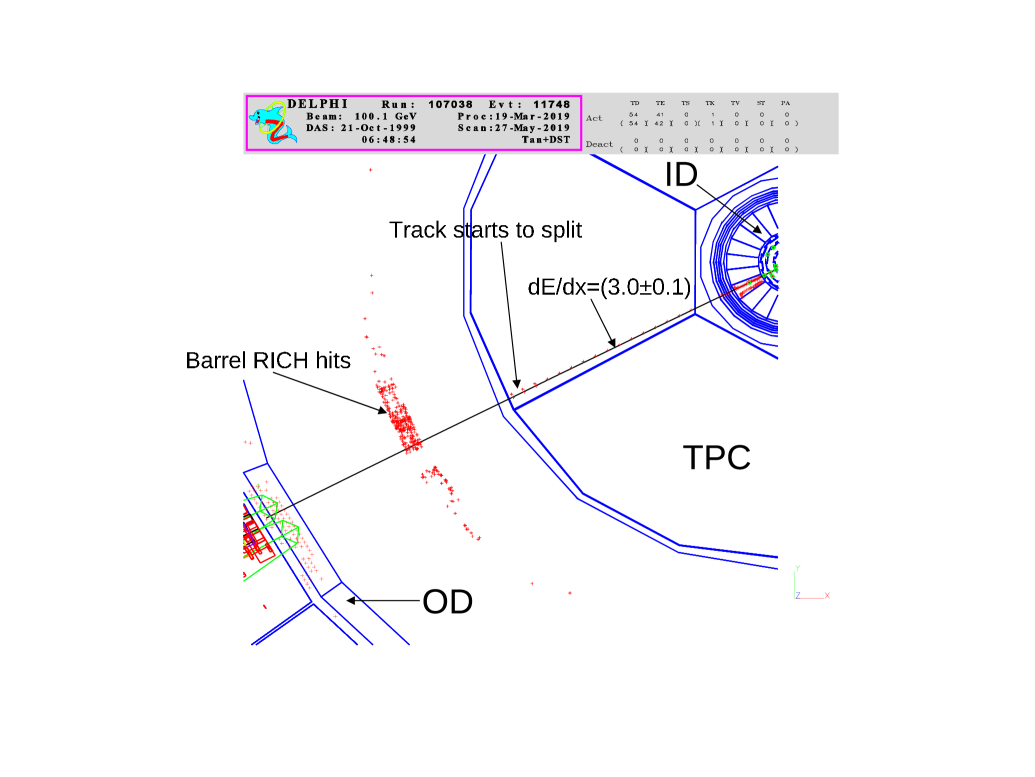
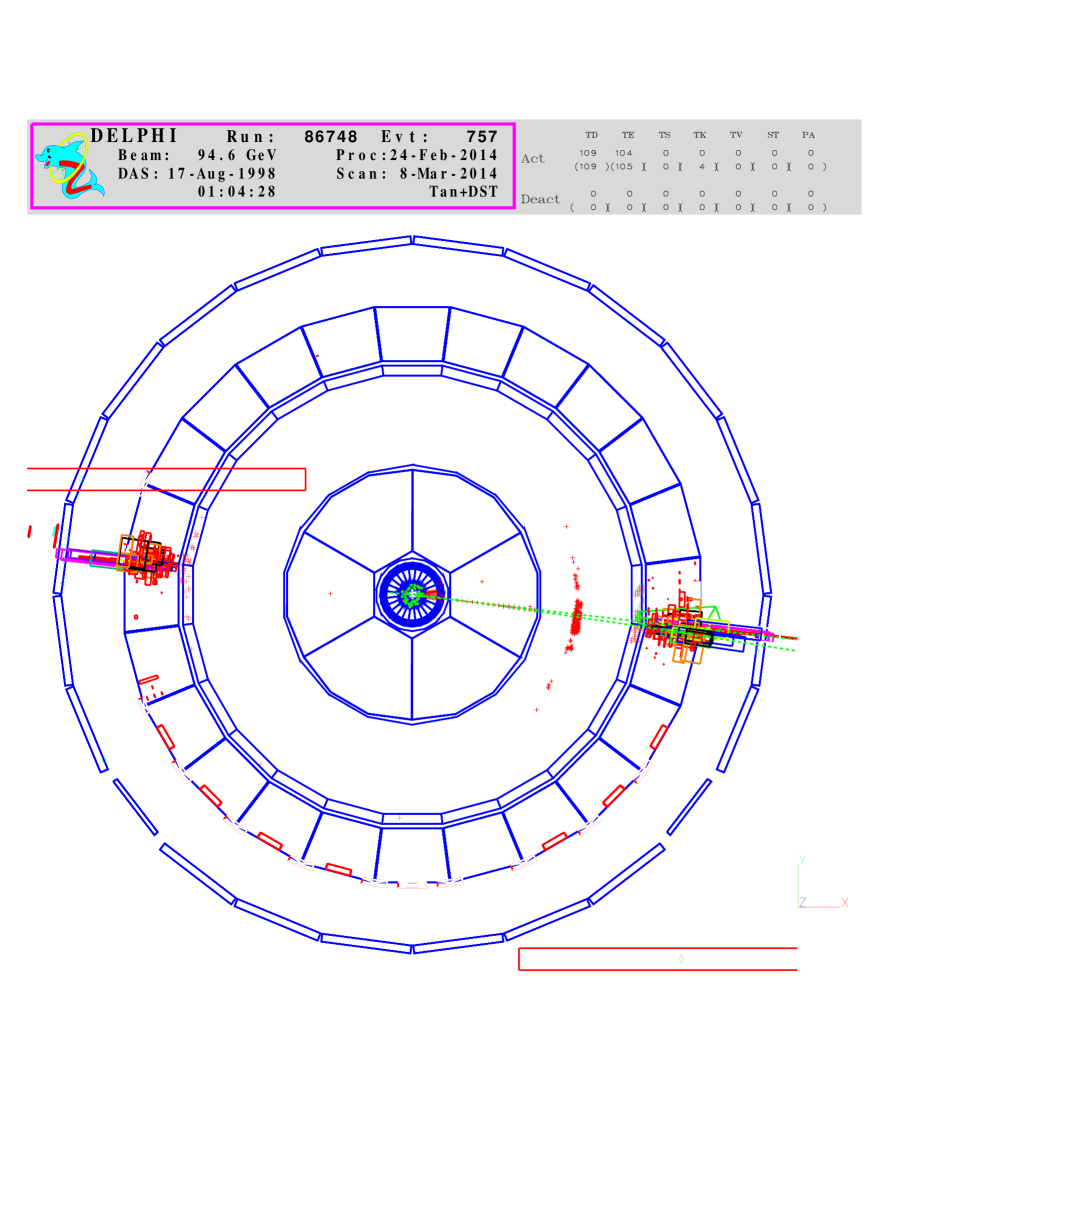
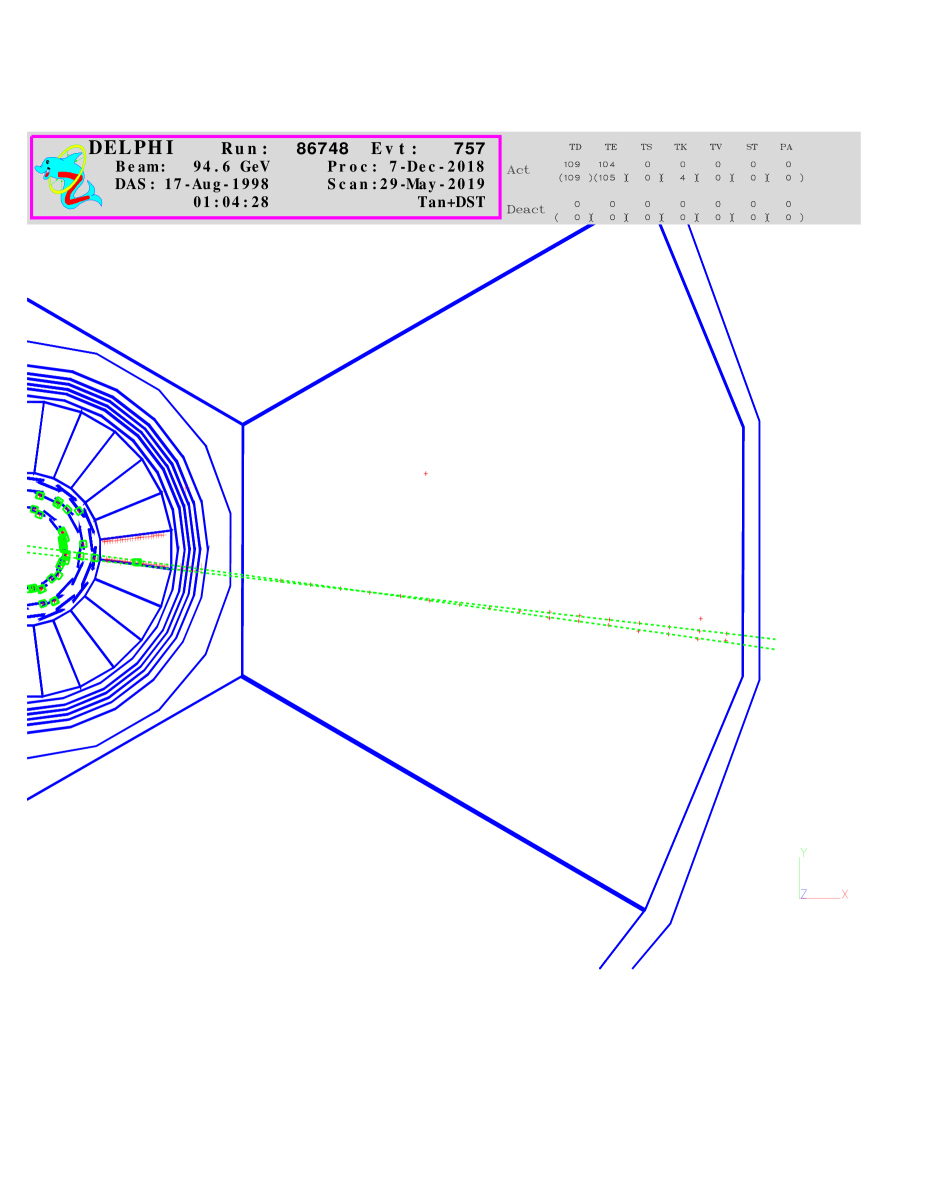
The DELPHI detector is described in detail in [1, 2]. The following is a list of the subdetector units relevant for this analysis: the vertex and inner detectors (VD and ID), the main tracker (the Time Projection Chamber, TPC), the outer detector (OD), the barrel electromagnetic calorimeter (the High-density Projection Chamber, HPC), the hadronic calorimeter (HCAL), and the barrel muon chambers (MUB). The principal detector used in this analysis was the barrel Ring Imaging Cherenkov detector (Barrel RICH).
The DELPHI Barrel RICH is described in detail in [3, 4, 5, 6, 7] and has demonstrated to have high performance for identification of hadrons (). The detector contained two radiators, the liquid radiator (, refraction index ) and the gaseous radiator (). The Cherenkov photons from these two radiators were detected by TPC-like photon detectors consisting of 24 pairs of quartz drift tubes (drift boxes), covering a full azimuthal range with 24 Barrel RICH sectors, extended to cm from the mid-wall. The drift gas (75% methane and 25% ethane ) was doped with 0.1% of the photosensitive agent TMAE, by which the ultraviolet Cherenkov photons were converted into single free photoelectrons, the mean photon conversion length being equal to 1.8 cm. The TMAE photo-ionization threshold of 5.63 eV and the transmission cut-off of the liquid radiator and drift tube quartz windows of 7.50 eV limited the photon wavelength detection range to the band of 165 - 220 nm.
The principles of the creation of Cherenkov ring images in both radiators of
the DELPHI Barrel RICH are illustrated in the following figure:
![[Uncaptioned image]](/html/1912.11839/assets/x1.png) The rings formed by the hits of photons originating from a given radiator were
distinguished by the location of the hits in two different parts of the drift
boxes, separated by the box median plane, the inner part for the liquid and
outer part for the gaseous radiators (in the present paper “inner” and
“outer” positions in the DELPHI detector is with respect to the
colliding beam axis).
The rings formed by the hits of photons originating from a given radiator were
distinguished by the location of the hits in two different parts of the drift
boxes, separated by the box median plane, the inner part for the liquid and
outer part for the gaseous radiators (in the present paper “inner” and
“outer” positions in the DELPHI detector is with respect to the
colliding beam axis).
The standard ring radii in the liquid and gas radiators, expressed in angular units, were 667 and 62 mrad, respectively. The total single photon standard error of the liquid radiator was 18-28 mrad for standard rings. Each sector of the gaseous radiator was equipped with six parabolic mirrors distributed along the axis 111In the DELPHI reference frame the axis is along the direction of the beam. It defined the particle polar angles , while the particle azimuthal angles were defined in the plane., which focused the Cherenkov photons generated in the radiator volume back onto the photon detector. The gas radiator single photon standard error was about 4 mrad for small radius anomalous rings, increasing by an order of magnitude for very big rings due to geometric aberrations intrinsic to parabolic mirror optics. With the average Cherenkov photon numbers per standard ring of 14 and 8 [2] 222These numbers reduce to 9 and 5, respectively, within cited above. for the liquid and gaseous radiators, respectively, the Cherenkov cone angular error for the rings associated with high momentum hadronic tracks was about 9 mrad for the liquid radiator and about 2.7 mrad for the gaseous radiator [10].
After the processing of the raw data with the use of the DELPHI general pattern recognition package [2] to produce the DELPHI data summary tapes (DST’s), the RICH data for each individual track consisted of photon trajectories starting on track segments inside a given radiator volume, and terminating inside the RICH drift boxes on hits detected in the latter. This information was treated rather differently in the standard DELPHI analysis and in the analysis presented here.
The DELPHI standard way was to use the reconstructed Cherenkov angles to identify the particle producing the track by applying the maximum likelihood technique [2]. Five mass hypotheses () were tried and the results were used to identify the particle. Additionally, an independent estimation of the ring radii relevant to each charged particle traversing the RICH was made and the results were stored on the DST’s [10], including the averaged Cherenkov angle, the number of photoelectrons in the ring, an estimation of the background, etc., and these data were used in this analysis as described below. Unfortunately, for the present investigation, the hits which could correspond to Cherenkov angles exceeding certain limits were not tried in this procedure, these limits being 750 mrad for the liquid radiator and 102 mrad for the gaseous one. The information about these large angle hits is not available on any of the types of DELPHI DST’s. This obviously restricted the power of the preliminary selection of events containing anomalous rings at the DST level. Such a selection, described in Sect. 4, was based on other event signatures, though the information about Cherenkov angles within the limits mentioned above was used in part for the selection, as will be further explained.
The events tagged by this preliminary selection were reprocessed, and the RICH data in them were treated following a procedure specially developed for the present analysis. It starts with an analysis of the information stored in raw data tapes extracted by the DELPHI event server. Then several steps of the standard procedure, described above, are performed, to reconstruct the Cherenkov photon directions with respect to tracks, however without any restrictions on the radiation angles. After this the photon directions were used, as described below, to find positions of the photon impact points on the plane perpendicular to the track trajectories in the corresponding radiator which will here be called the Cherenkov plane. The coordinate frame in this plane has its origin at the position of the center of the expected ring as reconstructed from the track parameters. The plane coordinates of the photon impact point, expressed in angular units, are calculated from the polar and azimuthal angles of the Cherenkov photons, and : , . The resulting hit pattern, which as a rule is contaminated by random background hits, constitutes the input to the search for Cherenkov rings. The ring search algorithm is described in Appendix 1. Precautions have been made in order to keep large Cherenkov rings. In particular, the number of sectors to be treated with a given track was increased up to five (instead of 3 in the standard analyis), and number of mirrors to be treated with a given track was increased up to four, instead of one or two in the standard version.
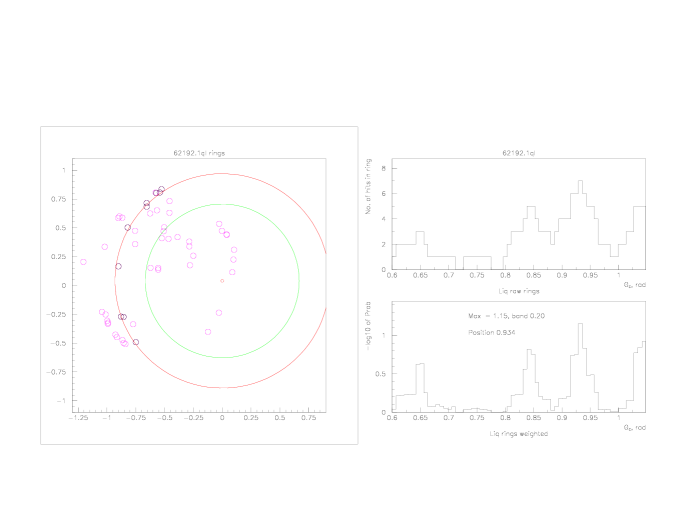
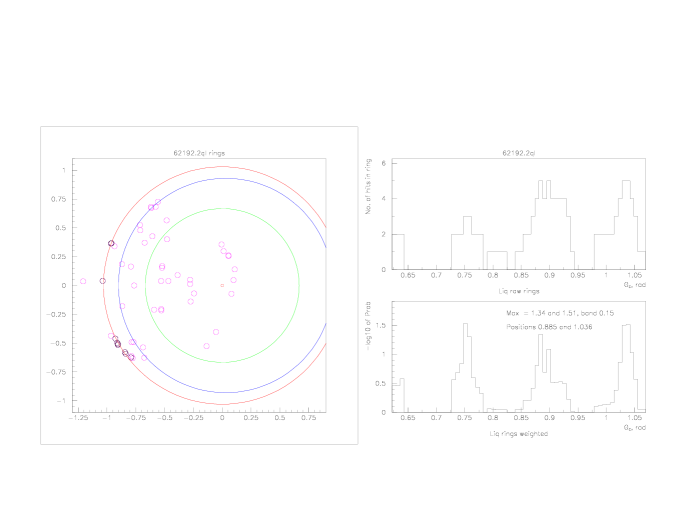
The method of evaluation-of the probability that a given ring is due to background fluctuations, that fortuitously lead to the reconstruction of a ring image, is described in Appendix 2, the method being illustrated in the Figure in this Appendix and by Fig. 1. Only the rings having the background probability below 10% were kept for further consideration.
In order to illustrate the above procedure several anomalous rings and their radial distributions are shown in Figs. 2-6.
2.2 Background noise
As mentioned above, apart from the photon detector hits that are due to Cherenkov light produced by particles, traversing the liquid and gaseous radiators, there are other (background) sources of hits [8, 9]:
-
a)
Electronic noise, induced by the LEP machine and other DELPHI sub-detectors. This source produced several simultaneous hits on anode wires and cathode strips.
-
b)
Feedback photoelectrons. They are created during avalanche development around the anode wires, when UV light emitted during the gas amplification process liberates electrons in the presence of the TMAE. Optical screens were mounted between the anode wires to minimize this effect, confining it to the single wire from which the UV light was emitted. However, sometimes feedback photoelectrons drifted also to neighbour wires.
-
c)
Electronic oscillations, induced by large charges, mainly from ionizing tracks. These are characterized by several consecutive hits on the same channel separated by time intervals equal to the dead time. This gives additional secondary hits in the channel masking the signal hits.
-
d)
Cross-talk between cathode strips. Large signals, mainly from ionizing tracks, induced signals in neighbour strips of the same cathode block, and occasionally in neighbour wires. This effect confused the coordinate defined along wires for other real electrons coming just after.
-
e)
rays, created by the tracks crossing the drift tubes.
-
f)
Ionization electrons (, produced by the passage of the charged particles through the drift tubes and forming accumulations of reconstructed points.
-
g)
Cherenkov photons produced by particles when traversing the quartz windows of the drift tubes.
-
i)
Internal reflection (including total internal reflection): Cherenkov photons, produced in the liquid radiator and quartz windows, underwent internal reflection on the quartz boundaries. Some fraction of them might reach the photodetectors.
-
j)
Hits from soft bremsstrahlung photons produced by electrons and positrons in the DELPHI detector material.
These backgrounds were partially reduced by specific features in the detector construction and by fine tuning of its working parameters (e.g., electronic dead time, discriminator thresholds, MWPC settings). However they represent the main source of spurious rings composed, mainly or in part, of hits of these backgrounds.
3 Event topologies studied
In order to have the RICH patterns as clean as possible we restricted our
analysis to the simplest event topologies; in particular, hadronic events
were excluded from the consideration.
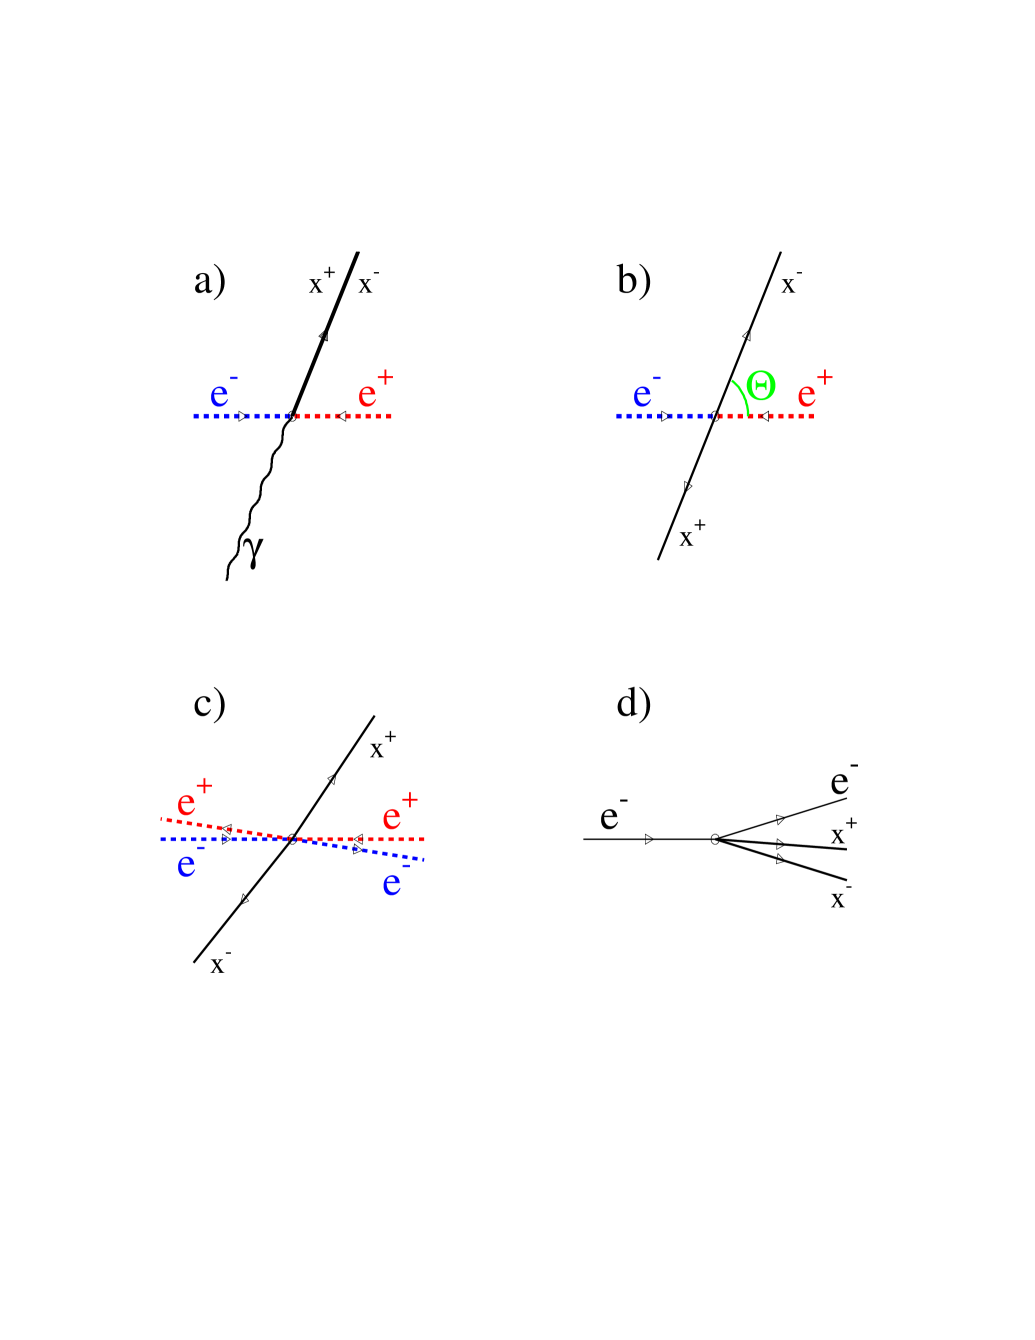
Topology 1. Unlike-sign pair with a small oppening angle opposed by
a high energy photon. Schematically, this topology can be presented by the
diagram given in Fig. 7a (the dashed lines in it represent the
particles which go undetected). This topology corresponds to the reaction
| (3.1) |
where denotes a high energy photon and stand for a pair of
non-specified particles identified to be neither hadrons nor muons,
produced with a vanishingly small opening angle,
the photon and the pair going in opposite directions.
In the case when the two charged particles are non-resolved by the TPC
(topology 1a)
the common track is expected to correspond to 2 mips 333A mip
is the of a minimum ionization particle. or higher;
the case of resolved tracks corresponds to topology 1b.
Two examples of topology 1a and 1b events are given in
Figs. 8-12.
Topology 2. Events with back-to-back or quasi-back-to-back tracks.
The diagram of the back-to-back topology is presented in Fig. 7b.
This configuration corresponds to Bhabha-like events, i.e.
| (3.2) |
called here topology 2a. The diagram of a quasi-back-to-back topology (the final particles are acollinear but coplanar) is shown in Fig. 7c. This topology corresponds to interaction events, i.e.
| (3.3) |
(topology 2b).
Two respective examples of topology 2a and 2b events are shown in
Figs. 13-16.
Topology 3. One-plus-three (2-jet) topology.
A search was also made for anomalous rings associated with tracks produced
by secondary interactions of electrons
(or positrons), generated in the beam-beam or interactions,
when these particles pass through the detector material, with the following
reaction taking place:
| (3.4) |
where and denote a charged object (a nucleus of the detector medium with which the incident electron interacts), before and after the interaction. Excepting the charged object, there are no undetectable charged particles in this reaction (see the reaction diagram in Fig. 7d). Thus a typical topology of events of this kind would be a presence of a “jet” consisting of three tracks, of which at least two have non-zero impact parameters with respect to the primary vertex. The particle producing the three-particle jet is expected to be opposed by another track in the opposite hemisphere, as shown in an example of this topology event in Figs. 17, 18.
4 Selection of events having candidate anomalous rings
The following selection cuts were applied for the preliminary selection of events from the DELPHI DST’s:
The general selection of events was done vetoing the hadronic events defined according to the DELPHI “Team 4” criteria [2] 444The main criterion for selecting hadronic events was the requirement of a multiplicity above 4 of charged particles with MeV/, and a track length of at least 30 cm in the TPC, with a total energy in these charged particles above .. This retained about events (called “quasi-leptonic events”), found in the 1992 - 2000 data 555The transition from LEP1 to LEP2 took place in the year 1995. LEP1 beam energies were centered around the mass of -boson (91.2 GeV/), the LEP2 period was aimed at physics beyond , with beam energies spanning between 161 and 208 GeV (the averaged energy being 196 GeV).. A further reduction of the amount of hadronic events was performed by using the DELPHI electromagnetic calorimeter as described below. Muons were identified (and rejected) with the HPC, HCAL and MUB responses. Another general selection criterion was the requirement that for all tracks of the events the errors of the momenta derived from the curvature of the tracks be below certain limits (). The tracks were furthermore required to be within the geometrical acceptance of the gas radiator of the DELPHI Barrel RICH (), with the barrel RICH being in an operational state.
The further selection of events used the cuts designed to enhance the contents of events of topologies 1, 2 and 3 which are described below (the term here corresponds to a single neutral or charged particle or two or three tightly bunched charged particles), and the results of the application of these selections to the DELPHI DST data is shown in Tables 1 and 2.
4.1 Topology 1
-
1.
Two jets in the opposite hemispheres are required in the event: one neutral jet and one jet consisting of 1 or 2 charged particles; each of the jets should have at least 50% of the beam energy; in the case of the neutral jet this energy should come from the HPC.
-
2.
Track(s) of the charged jet should have associated shower(s) in the HPC with the total jet shower energy exceeding half of the jet momentum, the number of active HPC layers in the shower(s) being greater than or equal to 5 (of 9).
-
3.
Track(s) of the charged jet should have the first measured point(s) in the first layer of the DELPHI vertex detector (VD).
-
4.
In the case of a single-track charged jet (topology 1a) the track ionization has to be within the limits of mips (corresponding to the 2 charged tracks being non-separable in the TPC), with the number of TPC wires available for ionization measurement exceeding 40 out of a total of 192 wires (this cut aimed at the suppression of Compton event background, see Sect. 6.1).
-
5.
In the case of a jet with two separated tracks (topology 1b) the jet mass, calculated under hypothesis of the electron mass for the tracks, has to be below 0.5 GeV/, and the smaller of the two track momenta has to exceed 4 GeV/ 666This cut was applied in order to keep the efficiency of the track association with its HPC shower close to 100%.. To suppress the Compton event background the jet acollinearity was required to be below .
It is worth to note that for a proper finding of Cherenkov rings (standard or anomalous ones) only the track direction in the RICH, and not its momentum value, is required. This direction is considered to be well defined even for the events in which two tracks were not separated (not resolved) in the TPC, identified by double ionization only (the tracks from point 4 above). The reason for that these tracks were not resolved in the TPC was, in an addition to their negligible opening angle, their high momenta leading to a small curvature of their trajectories in the DELPHI detector magnetic field. This resulted in the appearance of these tracks as practically straight lines in the detector; these tracks produced two Cherenkov rings in each of the RICH (liquid and gaseous) radiators (in the case of electron tracks all the rings are standard).
4.2 Topology 2
-
1.
Two tracks of opposite charge are required in a 2-jet event, one track per jet, both tracks having momenta greater than 4 GeV/. Each jet should have at least 60% of the beam energy (topology 2a, Bhabha-like events) or, alternatively, each jet should have less than 60% of the beam energy (topology 2b, events).
-
2.
Both tracks of the event should have associated showers in the HPC with each shower energy exceeding half of the track momentum, the number of active HPC layers in the showers being greater than or equal to 5 (of 9).
-
3.
The tracks have to go in opposite directions in the plane having the track acollinearity lower than (in the case of topology 2a) or, in the case of topology 2b, having the track acollinearity higher than and the track acoplanarity below .
-
4.
Each of the tracks should have a gas Cherenkov angle, stored on the DST, within the region 72 to 102 mrad 777The upper limit is defined by a restriction on the gas Cherenkov radii imposed when producing the DST’s., with at least 5 photoelectrons associated with each ring;
-
5.
or, alternatively, one of the two tracks should have a Cherenkov angle within the region 80 to 102 mrad, with at least 5 associated photoelectrons.
4.3 Topology 3
-
1.
Two jets are required in the event: one jet consisting of a single track, and the other consisting of 3 charged particles, with the overall sum of the track charges equal to zero. All the tracks in the 3-particle jet should have momenta exceeding 3 GeV/.
-
2.
Tracks in the 3-particle jet should have associated showers in the HPC with each shower energy exceeding half of the track momentum, the number of active HPC layers in the showers being greater than or equal to 5 (of 9).
-
3.
For a primary suppression of events (abundant in LEP1 data set) the effective mass of charged particles in the 3-particle jet (calculated prescribing pion masses to the tracks) is demanded to be greater than 0.5 (0.89 GeV/), and the jet momentum is required to be greater than 0.8 of the beam momentum.
-
4.
Two tracks in the 3-particle jet are required to have the first measured point at the detector radius cm (i.e. outside the ID, the DELPHI Inner Detector). And at least one track in this jet should have an impact parameter with respect to the primary vertex in the plane exceeding 6 mm, or two tracks should have impact parameters each exceeding 4 mm, while the impact parameters of all tracks with respect to the primary vertex should be below 10 cm.
-
5.
At least two tracks in the three-track jet should have a non-standard RICH response from the gas radiator (stored on the DST), i.e. either ring radii outside of the standard ring limits of mrad, or no response at all 888This non-standard response was expected in the cases of anomalous rings having radii greater than 102 mrad., while each track is required to have some response from the liquid radiator; these tracks should be within the angular acceptance of the gas radiator i.e. within the range of .
4.4 Final selection
The cuts described in Sects. 4.1 to 4.3 resulted in the selection of 395 events as primary signal candidate events of topologies 1, 2 and 3 (which correspond to the sum of events in the Selection 4 row of Tables 1 and 2 for LEP1 and LEP2 data, respectively).
A further analysis of all the selected events was done retrieving these events from the DELPHI raw data using the DELPHI event server, reconstructing the Barrel RICH hit patterns for all tracks in these events and searching for anomalous rings associated to each track, as described in Appendix 1.
Of the 395 selected events 53 events were found to have at least one anomalous ring with a probability to be composed of background hits below 10%; the distribution of these events over different topologies is shown in Selection 5 rows of Tables 1 and 2. The minimal number of photons per ring was required to be 4. In addition, the events of topologies 1 and 2 were required not to have standard rings in the gas radiator.
Of these 53 events 29 events were found to possess two gaseous anomalous rings (at least one anomalous ring per track in topology 2). All these events were subjected to a further treatment, aimed at the finding of rings, standard and/or anomalous, in the liquid radiator. The search for liquid radiator rings in the events with the found gas rings, combined with the method of evaluation of the probability that the ring is composed of background hits, was performed as described in Appendix 2. The range of the liquid ring radii searched for with this method spanned between 600 and 1100 mrad. In the case of such a ring being found with the ring radius exceeding 700 mrad (excluding quartz ring range, see below) it was considered as an anomalous liquid radiator ring; only those anomalous liquid radiator rings having the background probability below 10% were accepted for further analysis. Then the background probabilities of all anomalous rings in a given event were multiplied, and the product of the probabilities was required to be less than . Of the selected 29 events this left 9 events of topology 1, 6 events of topology 2, and 12 events of topology 3, in total 27 events as given in the Selection 6 rows in Tables 1 and 2. None of the rings in these events were compatible with being due to the systematic effects described in Section 5 below. The characteristics of the anomalous rings contained in all the 27 selected events are given in Tables 3 to 5. In total, the number of selected events with at least two anomalous rings reduced to 27/17/11/6 when the combined probability that the reconstructed rings are due to background, mimicking ring images, is below , respectively.
These results can be considered as a primary evidence for the presence of anomalous rings in the analysed data.
Note that topologies 1 and 2 contain only events coming from LEP2, i.e. no event of these topologies was found in LEP1 data. The significance of this observation will be discussed in Sect. 9.
5 Systematic effects leading to the appearance of rings of radii greater than standard ones
There are several mechanisms which produced rings of radii greater than the standard ring radii, in both radiators of the DELPHI Barrel RICH. They are well understood and were readily identified when encountered in the data.
Quartz rings. The liquid radiator of the DELPHI Barrel RICH has a quartz window of a thickness of 4 mm which acts as an additional radiator. The refraction index of the quartz has a dispersion, ranging from 1.527 to 1.627 within the effective photon wavelength band of the RICH. The corresponding Cherenkov ring radii for ultra-relativistic particles are between 857 and 909 mrad. Due to the rather small angle of the total inner reflection at the boundary quartz-gas (about as compared to for the analogous angle of the liquid radiator) the quartz Cherenkov rings always appear as arcs and vanish at track polar angles greater than and below . They are easily recognized by their specific radius and, in most cases, by a high dispersion of the ring hits 999In several events the quartz radiator also showed anomalous rings (indeed arcs), see e.g. Figs. 19, 20. These rings (arcs) are quoted in Table 5, and after the recalculation of their radii to the liquid radiator ring radii using the proper relation for the refraction indices (1.577 for the quartz and 1.273 for the liquid radiator) enter the correlation plot in Fig. 21 below..
Jacobian rings. The principle of the RICH pattern recognition is the association of the Cherenkov photon emission point on a given track with a hit detected in the RICH photodetector by a light ray transported through the RICH media. When such a ray, transported from the liquid radiator, enters the drift box at a small angle to the box surface this ray can often, in the case of a non-vanishing background hit density in the corresponding region of the drift box, be associated with several different hits in the drift volume at small variations of the initial emission angle in the liquid radiator 101010This happens when the ray incidence angle on the boundary liquid-quartz in the liquid radiator is close to the angle of the total internal reflection on a virtual boundary liquid-gas. Since all quartz window surfaces in a given sector are parallel, the refractions at the inner and outer surfaces of the windows cancel, and the resulting angle of the ray in a given drift box is the same as if the ray had passed a virtual boundary liquid-gas without a separating quartz window.. Mathematically, this means that a Jacobian between a volume element in the drift box to an angular element around a given ray in the liquid radiator is big. This results in the erroneous reconstruction of many rays with incidence angles slightly below the total inner reflection angle on the virtual boundary liquid-gas, which effectively means the appearance of apparently anomalous rings of radii of about 880 mrad. These “Jacobian rings” are readily identified by their radii, by an unusually high hit density, by big Jacobian values and/or by big separations of the hit and the track coordinates in the photodetector. Moreover, if the track polar angle is not close to (which is often the case), Jacobian rings are shifted with respect to the predicted center.
Standard liquid ring hits reconstructed as coming from the gas radiator. Due to statistical fluctuations in the absorption depth of the Cherenkov photons in the the drift gas, the photons from the liquid radiator standard ring sometimes reach the outer part of the drift box in a sufficiently big amount in order to create there a ring-like structure, especially at track polar angles close to (the probability for an individual photon from the liquid radiator to reach the outer part of the drift box varied from 10% to 30% depending primarily on the photon trajectory angle). This structure can then be reconstructed by the gas radiator pattern recognition as being produced by photons generated in the gas radiator and reflected by the focusing mirrors, resulting in an apparently anomalous gas radiator ring of a radius of mrad. Such rings are always shifted with respect to the predicted center, and can be identified by an observation of the ring of a similar radius, reconstructed by the gas radiator pattern recognition over the hits registered in the inner half of the drift box and having an essentially higher number of photoelectrons composing the ring.
Variation of the gas radiator refraction index. Variations of the pressure and temperature of the gas filling the detector which affects the refraction index of the gas were under strict control during the RICH operation since even tiny variations of the gas refraction index would worsen significantly the identification ability of the RICH for ultra-relativistic particles (whose Cherenkov angles are close to , which is 62 mrad in our case). Therefore the refraction index of the DELHI gas radiator was kept within the limits of at Cherenkov photon energy 7 eV [6]. For obtaining the Cherenkov angles exceeding 72 mrad from ultra-relativistic particles one has to vary the refraction index to the values exceeding 1.00260. In particular, in order to obtain such values as a result of an increase of the gas pressure it should be risen beyond 1380 hPa, while the working pressure in the DELPHI Barrel RICH was maintained at hPa. Such an increase of the pressure value is outside of any realistic limit: a differential pressure of only 100 hPa would break the quartz windows [1].
Thus this type of systematics can be excluded from the consideration.
6 Studies of physical backgrounds
Investigations were made under the hypothesis that events with anomalous rings are standard physics events which fit the non-Cherenkov-ring-related parts of selection criteria 1, 2 or 3 in Sects. 4.1-4.3, and in which the appearance of anomalous rings is due to fortuitous combination of photons from several different and closely spaced standard rings plus random background from hits produced by electrons and positrons, showering in the DELPHI detector material, and from noise sources described in Sect. 2.2. Such events can be searched for by modifying slightly the selection criteria described in Section 4 and analyzing them in a way similar to the events having anomalous ring event candidates in order to estimate the expected background level in an event sample of a given topology. Such an analysis, based on real data events, is described below.
6.1 Background studies of topology 1 events
6.1.1 Compton events
In Compton scattering events a beam electron (or positron) scatters elastically off a virtual photon emitted by the beam particle travelling in the opposite direction. The electron (or positron) that emits the photon usually escapes undetected into beam pipe, and the typical signature of a Compton scattering event consists in a photon, an acollinear (though coplanar) recoil electron (or positron) and nothing else, thus mimicking the events of topology 1a. The momentum of the recoil electron (or positron) and the directions of the two particles visible in the final state are tightly constrained by the relation [11]:
| (6.1) |
where ’s are the electron/positron and photon polar angles, respectively.
The selection of Compton scattering events for the cross-check analysis was done, from the whole LEP2 data set, with the same criteria as those listed in Sect. 4.1, with the requirement that the number of particles in the charged jet should be one and with the replacement of cut 4 by the requirement for the momentum of this particle to agree with the prediction by formula (6.1) within 20%. We note that the requirement for both particles of this reaction to be within the barrel angular range and the energy cut of the selection criterion 1 (Sect. 4.1) eliminate the vast majority of the Compton scattering events constituting this type of background, resulting in a reduction of the sample of these events to 277 candidates, 140 of which were in the 20% band around the formula (6.1) predictions. However, after reinserting the cut 4 of Sect. 4.1 all these events have been removed, thus demonstrating that background from this process is negligible.
6.1.2 Background of two-photon events
Two photon events with one photon converted in the beam pipe or in the 1st layer of the VD can imitate events of topology 1. This type of background can be studied by analyzing events with visible photon conversions which occur outside the 1st layer of the VD, but before the photons enter the TPC.
The selection of events of this type for a cross-check of the analysis was done using the same criteria as those listed in Sect. 4.1 with the replacement of cut 3 by the requirement that the first measured point on the track(s) is outside the 1st layer of the VD. 225 events were found in the whole LEP2 data with the radial distance of the first measured point distributed between 7.5 cm and 46 cm. All events were scanned looking for anomalous rings. 3 events were found containing anomalous rings satisfying all the conditions listed in Sect. 4.4.
By comparison, the number of topology 1 candidate events in LEP2 data, satisfying selection criteria 1-5 of Sect. 4.1, i.e. events having track(s) with the first measured point in the 1st layer of the VD, was found to be 25 (in what follows, this subsample consisting of 25 events will be called “the enriched sample of topology 1 candidates”). Among them there are 9 events containing two gaseous anomalous rings, satisfying the selection of Sect. 4.4. Having found 9 events among the 25 of this sample one expects 81 events in the background sample of 225 events if they are of the same origin. Assuming that there are no correlations between the samples (this assumption will be generally applied to all similar estimations below) the probability to find 3 events in the background sample while expecting 81 is negligible.
6.1.3 Events of topology 1 after a tight selection
Another estimation of the probability that the anomalous rings of events of topology 1 are rings fortuitously reconstructed from background hits was done using the enriched sample of topology 1 candidate events, as defined above. As mentioned above, of the 25 events of this sample 9 events have been found to contain two gaseous anomalous rings and to satisfy all the selection criteria for events of topology 1 described in Sects. 4.1 and 4.4, including the absence of standard rings in the gaseous radiator.
Among the remaining 16 events 10 events were found to contain 1 or 2 standard rings in the gaseous radiator associated with the one- or two-particle jets and having no anomalous rings. These 10 events are therefore identified as standard physics (background) events. The remaining 6 events have no standard rings in the gas radiator, while 2 of them have two anomalous rings per event, but the combined background probability per event is higher than , two other events have single anomalous rings, and the remaining 2 have no rings at all; so these 6 events are ambiguous in the sense that their identification as anomalous ring candidates or as background remains undecided. Thus among the 25 events of the enriched sample there are 9 topology 1 candidate events with two gaseous anomalous rings, 6 ambiguous events and 10 standard physics background events. The fraction of the 9 topology 1 candidate events in the enriched sample, from which the identified background events are excluded (retaining 15 events), is . If these 9 topology 1 candidates would be standard physics background events containing fortuitous anomalous rings, the expected number of such events among the identified standard physics events (10 events) is 6.0. Under the general assumption of no correlation between the samples the probability to find zero events containing two anomalous rings (i.e. topology 1 candidates) while 6 such events are expected is small, being below .
Conclusion of the sub-Section.
Of these two independent estimations of the background levels the latter one
(p-value less than ) is retained as being
obtained with a more conservative approach to the background sample.
6.2 Background studies of topology 2 events
6.2.1 Topology 2a
An estimation of the probability that a standard ring in a Standard Model Bhabha event would be mis-reconstructed as an anomalous ring was performed using a set of LEP2 events selected with the topology 2a cuts 1, 2 and 3 of Sect. 4.2. A program-based search was made for an anomalous ring associated with one track in the event while the opposite track in the event was required to have a standard ring, thus ensuring that a given event is a standard physics event and the apparently anomalous ring found in it (if any) is a spurious one. The number of spurious anomalous rings in 3341 Bhabha events thus selected was found to be 27, the fraction of such rings being equal to per track.
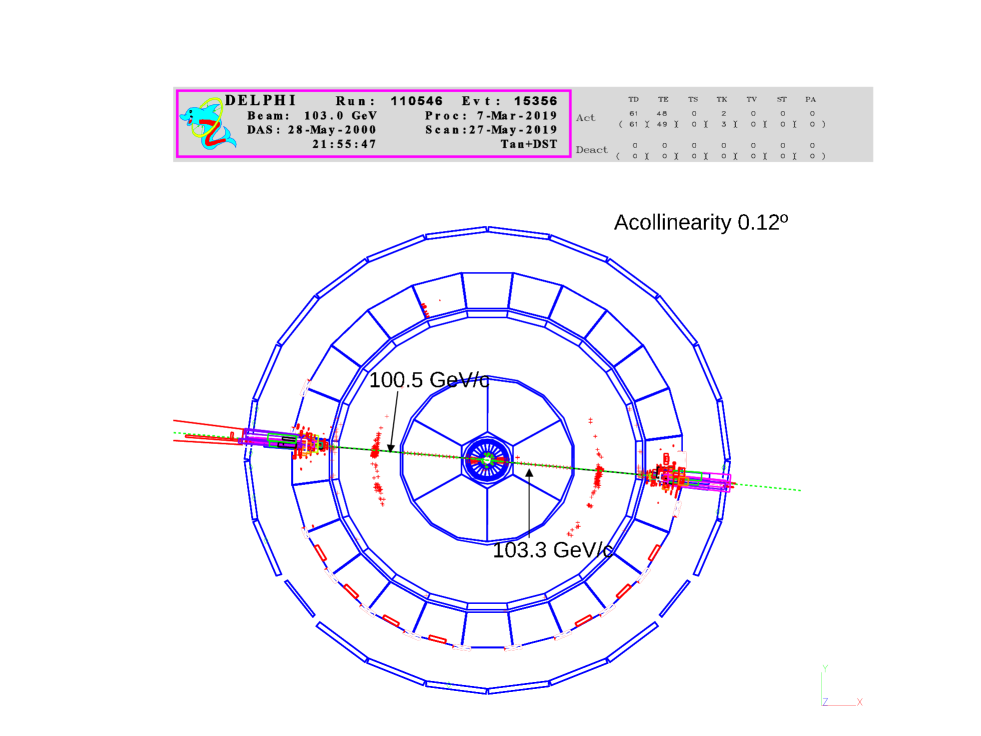
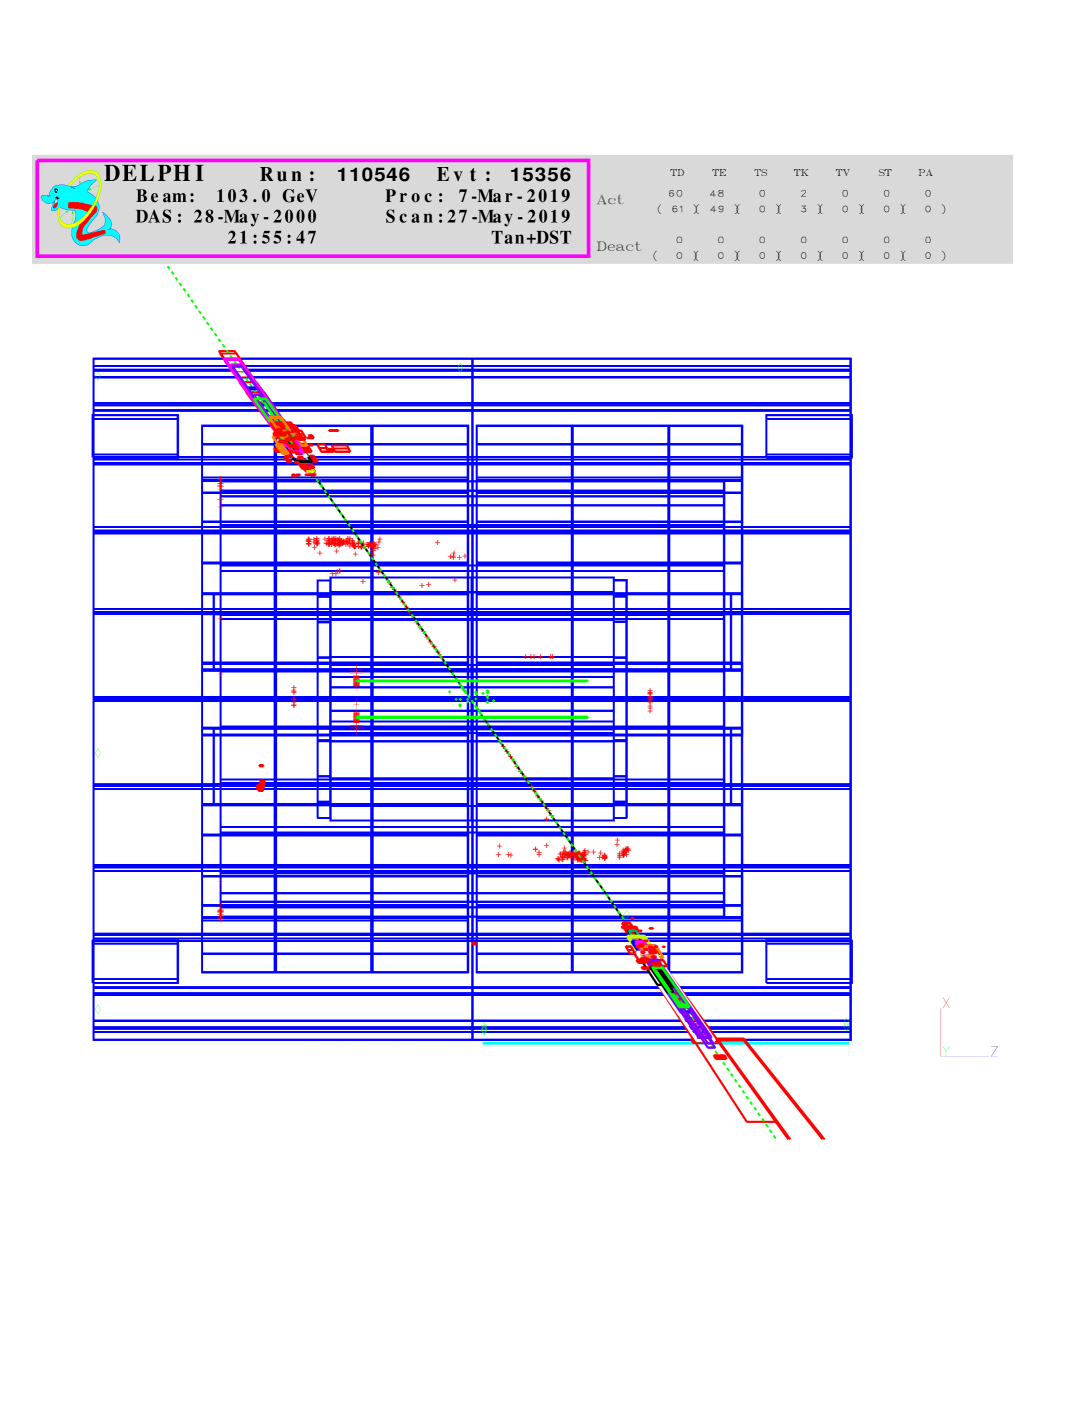
Having 24 candidate events of topology 2a in LEP2 data that have passed the preliminary selection as described in Sect. 4.2 (displayed on the Table 2 row 4) containing 48 tracks the expected number of spurious anomalous rings in these events is calculated to be . One event of topology 2a (the event 110546:15356) containing two anomalous rings was found in this data set (see Table 4 and Figs. 13, 14). The probability to find at least 2 (spurious) anomalous rings while the expected number of such rings is 0.19 equals to as calculated using the cumulative Poisson distribution 111111The situation when two anomalous rings are found in the same event, decreasing the above probability, is considered in Sect. 8 below..
6.2.2 Topology 2b
Two tests of a background of the anomalous rings in events of topology 2b were performed.
The first estimation used minimally biased two-electron events, topologically equivalent to those selected for the anomalous ring search in this topology candidate events. Relaxing the selection criteria described in Sect. 4.2, point 4 namely, requiring at least one gas anomalous ring of a radius exceeding 72 mrad with the minimal number of the hits on the ring to be 4, instead of requiring two rings of such a radius in the event with at least 5 hits on each ring, 550 events were found in the LEP2 event sample; these 550 events contained all the 38 events of topology 2b quoted in the Selection 4 row of Table 2, of which 5 events have passed the full set of selection criteria of Sect 4.4 to be retained as good anomalous ring event candidates of a given topology. An equal number of 550 events was selected with the replacement of the requirement to have the DST information about possible anomalous rings by a requirement of having a photon with GeV. The latter condition lowered the track momenta and led to a track acollinearity, both features being observed in anomalous ring candidate events of topology 2b. This sample was used to represent a background sample, unbiased with respect to the possible presence of anomalous rings since the two samples did not contain common events.
No events of the background sample passed the full set of selection criteria for anomalous ring event candidates requiring two rings in the event, each of the two rings to have the probability less than 10% of being fortuitous ring and the product of these probabilities to be less than , as described in Sect. 4.4 though five events, each containing a single apparently anomalous ring, were found. The purely statistical significance of the above analysis, resulting in zero background sample events versus 5 observed events found in the work sample is low (under the general assumption of no correlations between the samples it corresponds to a probability less than ).
The second estimation used the method of the background probability estimation analogous to that described in Sect. 6.2.1. The probability that a standard ring in a Standard Model event would be mis-reconstructed as an anomalous ring was estimated using a set of LEP2 events selected with the topology 2b cuts 1, 2 and 3 of Sect. 4.2. A program-based search for an anomalous ring associated with one track in the event was carried out while the opposite track in the event was required to have a standard ring, thus ensuring that a given event is a standard physics event and the apparently anomalous ring found in it (if any) is a spurious one. The number of spurious anomalous rings was found to be 62 in 819 events thus selected, the fraction of such rings being equal to per track.
Having 38 candidate events of this topology in LEP2 data which have passed the preliminary selection with topology 2b cuts as described in Sect. 4.2 (displayed on the Table 2 row 4) containing 76 tracks, the expected number of spurious anomalous rings in these events is calculated to be . Five events of this type, each containing two anomalous rings (see row 6 in Table 2), and four events, each containing a single anomalous ring, were found in this data set, i.e. 14 anomalous rings in a total. The probability to find at least 14 (spurious) anomalous rings while the expected number of such rings is 2.9 is small, being less than as calculated using the cumulative Poisson distribution.
For the further application the result of the first test of a background
hypothesis for the topology 2b will be used as giving a more conservative
estimation of the background probability value, i.e.
less than .
Conclusion of the sub-Section.
Assuming that there is no correlation between two subsamples of topology 2
the combined probability value of the background hypothesis for this topology
is below .
6.3 Background studies of topology 3 events
The probability for the anomalous rings in topology 3 to be the result of fortuitous combinations of background hits was estimated in a similar way as that of the conservative approach described in Sect. 6.2.2. The control sample of the standard physics events was constituted of events selected under the same criteria as described in Sect. 4.3 with the replacement of the requirement 5 of a non-standard RICH response in the gas radiator for tracks in the three-track jets by the requirement for these tracks to have at least 2 standard rings in this radiator. 145 such events were found in the data, containing no anomalous ring events satisfying our selection criteria. This should be compared to 12 events satisfying these criteria which were found in 125 events selected according to the complete set of the criteria described in Sects. 4.3, 4.4 (8 events from LEP1 and 4 events from LEP2 data, see Tables 1 and 2, last column). The probability to obtain zero event yield from the control sample, while the expected number of such events is calculated to be , is low (under general assumption of no correlations between the samples the probability is below ).
Conclusion of the Section.
It follows from the studies described in this Section that the probabilities
that the events with the observed anomalous rings are due to fortuitous hit
combinations in the topology 1, 2 and 3 event samples are low, being below
, and ,
respectively, assuming no correlation between the samples. Under the
assumption of no correlations and assuming further that there are no other
systematic effects which we have overlooked, this results in a very low
probability
that all the 3 topology event samples are composed entirely of events
with fortuitous rings.
7 An additional test of the background of fortuitous rings (“night sky” method)
An additional study of the background of fortuitous rings using a method of a random shift of the coordinate frame origin of the Cherenkov plane (called “the night sky” analysis) was done and is described in this Section.
7.1 Description of the method
In this study the hit patterns were used which have been associated with 108 tracks (the choice of this amount will be explained below) found in events selected with the criteria described in Sects. 4 and 6, in which at least one candidate anomalous gas ring was found.
Since the goal of the present test was to search for rings composed fortuitously from background hits produced by the gaseous pattern recognition in the gaseous half of the drift boxes only these “gaseous” hits were treated by the test, in the following way.
The predicted center of the Cherenkov ring associated with a given track (i.e. the origin of the coordinate frame of the Cherenkov plane for that track) has been randomly displaced in this plane by a radial shift ranging, with the equal probability, from 30 to 200 mrad and (simultaneously) by a random azimuthal turn through an angle in the Cherenkov plane distributed uniformly from to . Thus the original hit pattern lost the direct association with the corresponding track. Since the results resembled a night sky, this test was dubbed correspondingly.
Each of the 108 aforementioned gaseous hit patterns, primarily associated with a given track, was used to make the above displacements 50 times thus giving 50 new “track directions” providing in this way 5400 hit patterns for spurious ring finding trials. This number was chosen in order to greatly outnumber the number of 908 hit patterns produced by tracks of 395 pre-selected events referred to in Sect. 4.4.
The radial scan method described in the Appendix 2 was used to search for ring patterns. A ring was accepted if had 4 or more signal hits and the upper limit for the background probability was below 10%. This selection of the rings reproduces the analogous procedure implemented for the selection of anomalous rings in the main analysis, as described in Sect. 4.
7.2 Results of the method
In 5,400 displaced hit patterns obtained from the original ones by random shifts of the origin of the coordinate frame of the Cherenkov plane and scanned by the method of an automatic ring finding procedure, 37 apparently anomalous rings were found, consisting of at least 4 hits and satisfying the criterion to have an upper limit for the probability to be combined of background hits of 10%. This corresponds to the probability of finding a spurious ring by the above method in the DELPHI Barrel RICH background environment of quasi-leptonic events of .
To compare, 82 anomalous gas rings were found with the origin of the coordinate frame of the Cherenkov plane not shifted coming from the 908 hit patterns mentioned in Sect. 7.1: 58 rings in the events with 2 gas anomalous rings per event and 24 rings in the events with single gas anomalous rings 121212These numbers account for 27 signal events listed in Tables 3, 4 and 5, plus 2 events of uncertain status having two anomalous rings mentioned in Sect. 6.1.3, while 24 events with single anomalous rings can be counted summing up the differences between the numbers in 5th and 6th rows of Tables 1 and 2 minus 2 aforementioned uncertain events.. The corresponding rate equals to , which is times higher than the “night sky” background rate.
Conclusion of the Section.
The “night sky” analysis background rate, scaled to the present analysis
event sample statistics, predicts gaseous
anomalous rings in this sample, versus 82 observed.
The difference of rings
is consistent with the sum of the 54 gaseous anomalous rings
listed in Tables 3 to 5 (containing the final sample of 27 “good” events)
and the 24 single gaseous anomalous rings, found in the events
satisfying the selection criteria given in Sect. 4.4.
8 Comparison of the rates of events with single and double anomalous rings
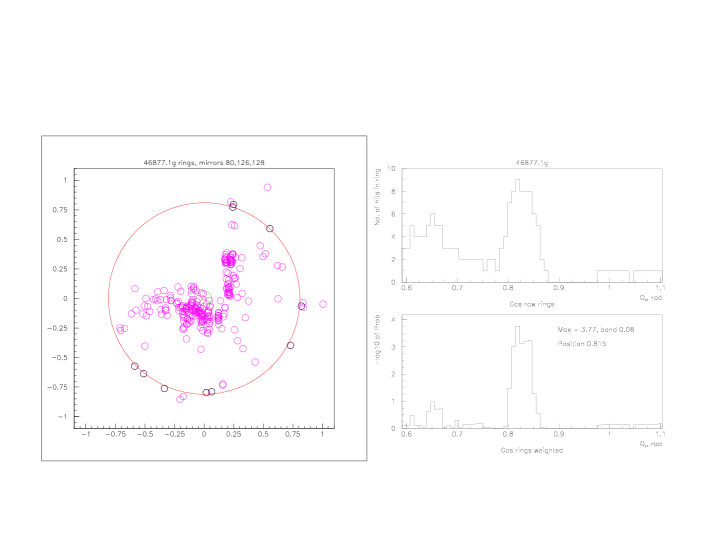
An estimation of the probability of the hypothesis that the anomalous rings observed in main analysis are fortuitous combinations of background hits can be carried out comparing the rate of events with a single anomalous ring observed in the gaseous radiator with the rate of events containing two such rings (an example of the event containing two gaseous anomalous rings, one ring per track, is presented in Figs. 2, 3). These two samples consisting of 29 and 24 events, respectively, contain, in total, 82 gaseous anomalous rings (each ring having the background probability less than 10%) found in the initial sample of 395 events. Thus the average number of gaseous anomalous rings in these events is . Assuming that the rings are fortuitous combinations of hits and are independent leads to the expected number of events in the sample containing two such rings equal to . The probability to observe 29 events with two (gaseous) rings while the expected number of such events equals to 17.0 is, according to the cumulative Poisson distribution, below , which shows that the above assumption is unlikely to be valid.
This conclusion is applicable to any type of a background producing spurious rings when the processes underlying such a ring production are independent, i.e. obeying Poisson statistics. This furthermore indicates a clear tendency for the observed anomalous rings to be produced in pairs.
9 LEP2 versus LEP1
9.1 Topology 1
There are 9 candidates of topology 1 events in the final sample, listed in Table 3, all of them coming from LEP2 data. With the selection criteria applied to candidates of topology 1 events, described in Sect 4.1, the principal background channel in this topology is the reaction
| (9.1) |
with one of the ’s converted to pair in the beam pipe or in the 1st layer of the VD, with the subsequent production of at least two fortuitous anomalous rings in the RICH from hits resulting from showering electrons of the pair. Then one should expect that the number of events of this type in LEP1 data, satisfying all the selection criteria listed in Sect. 4 for events of this topology, can be estimated using the ratio of the cross-sections of the reaction (9.1) at LEP1 [12] and LEP2 [13] which is 131313This ratio is valid for the Barrel-region restricted cross-sections., multiplied by the ratio of the integrated luminosities corresponding to each data set (96 pb-1 and 665 pb-1, respectively), resulting in a factor 0.64. Thus, the expected number of events of this type of background is obtained to be 5.7. The probability to find zero events in LEP1 data, while the expected number is 5.7 is low (the probability derived using Poisson statistics is below ). This furthermore indicates that topology 1 events with anomalous rings seem to have an energy dependence of the production cross-section and, in turn, the production mechanism which differ from those of the reaction (9.1).
9.2 Topology 2
Among 6 events in the topology 2 final sample, listed in Table 4, all of them coming from LEP2 data, there is only one Bhabha-like (topology 2a) event, i.e. an event containing two collinear tracks. The track acollinearity in this event equals to and its track momenta are measured to be GeV/ and GeV/, which agree well with the beam momentum of 103.0 GeV/, thus corresponding to reaction (3.2) (the event 110546:15356, shown in Figs. 13, 14). Assuming that the tracks in this event are electron tracks and the anomalous rings found in this event are fortuitous, one expects that the number of events with the same signatures (a high track collinearity and momenta agreeing with the beam one) in LEP1 data (coming from decays to ) and containing two anomalous rings (one per track as the above event does), satisfying all the selection criteria listed in Sect. 4 for events of this topology, is 5.9 times higher. This number has been obtained as the ratio of the cross-sections of the reaction
| (9.2) |
at LEP1 [14] and LEP2 [15] reported for the Barrel region, which is , multiplied by the ratio of the integrated luminosities corresponding to each data set (96 pb-1 and 665 pb-1, respectively). The probability to find zero events in LEP1 data, while the expected number is 5.9 is low (the probability derived using Poisson statistics is ). This furthermore indicates that also topology 2 events with anomalous rings seem to have an energy dependence of the production cross-section and, in turn, the production mechanism which differ from those underlying the reaction (9.2); we note however that this conclusion is only indicative being based on a single event of this type found at LEP2.
The comparison of LEP2 to LEP1 yields for topology 3 events was not tried because of uncertainties in the required analysis.
Conclusion of the Section.
When trying to find an explanation of anomalous rings within the framework of
the standard physics, one principal source resulting in the appearance of
spurious anomalous rings could be related to electrons (positrons) showering
in the DELPHI detector material, thereby producing background hits with
possible mutual hit correlations.
If so, when comparing LEP1 and LEP2 data, one would expect that the number
of standard physics events with spurious anomalous rings (in the samples of
events of topology 1 and 2) should be proportional
to the product of integrated luminosity times the relevant standard physics
cross-section, which does not at all seem to be the case.
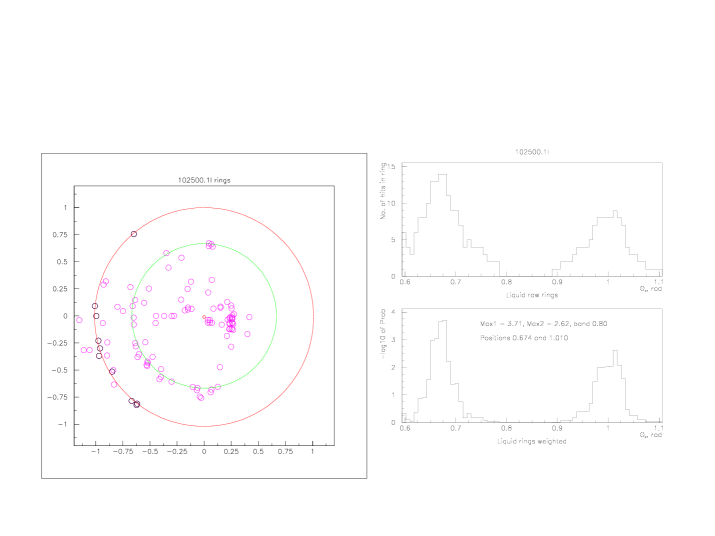
10 Correlation between gaseous and liquid radiator rings
An important feature of the DELPHI RICH was the presence of two radiators: the liquid radiator and outside it, the gaseous one. With the use of the relationship originating from Cherenkov formula
| (10.1) |
the ring radius expected in the liquid radiator can be derived from the gaseous ring radius and vice versa. So, the question has been raised: whether the radii of the rings, found in the liquid and the gaseous radiators, obey formula (10.1)?
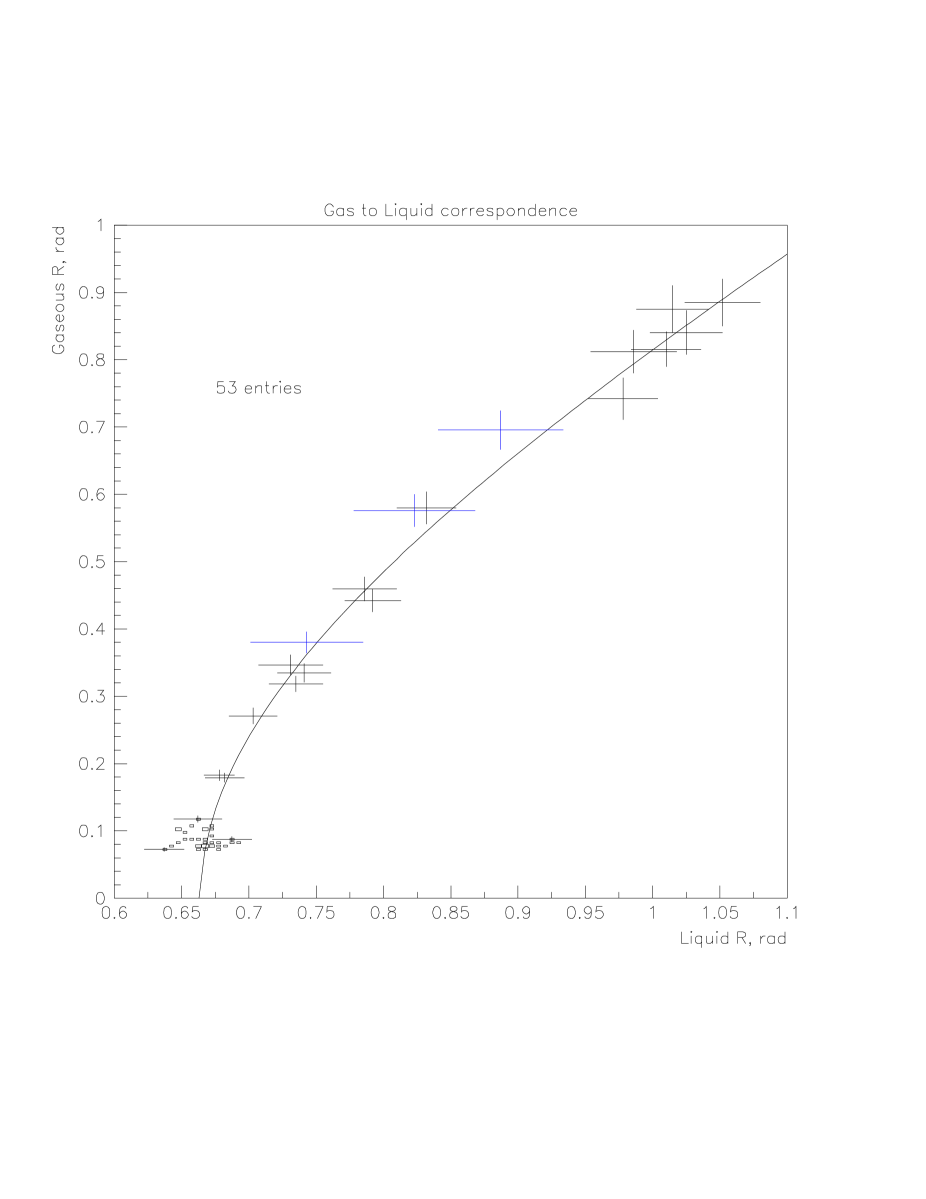
Fig. 21 shows the anomalous ring radii observed in the gas radiator plotted against the ring radii observed for the same track in the liquid radiator for 27 events listed in Tables 3, 4 and 5 (with some exceptions mentioned in the description of these Tables, see page 25), showing a clear correlation between the radii. The curved line in the figure is not a fit to the data, but has been derived using the relation (10.1) with and .
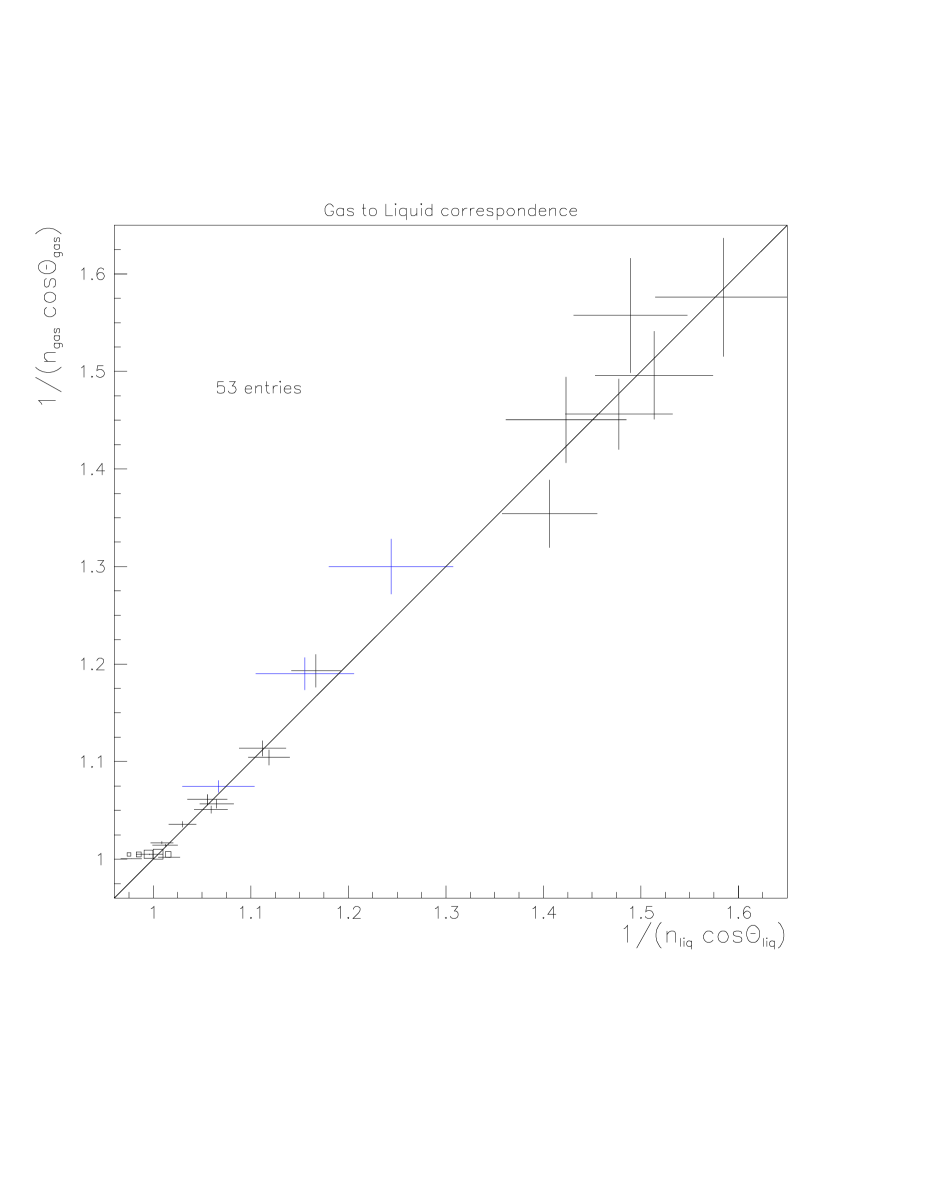
The same correlation can be seen in Fig. 23, in which the variables on the axes have been transformed to and , according to formula (10.1), which linearize the plot. The correlation coefficient calculated for 53 points of Fig. 23 equals 0.992. The probability of obtaining such a coefficient for uncorrelated variables was estimated on the basis of an analysis of MC “toy experiments” in each of which the values of the 53 variable pairs were generated as distributed randomly according to the corresponding projections of the plot in Fig. 23. The probability resulting from this analysis is .
The sum of for deviations of 53 points in Fig.23 from the main diagonal is 40.1 The corresponding p-value for that these points are in agreement with the predictions of formula (10.1) is near 95%.
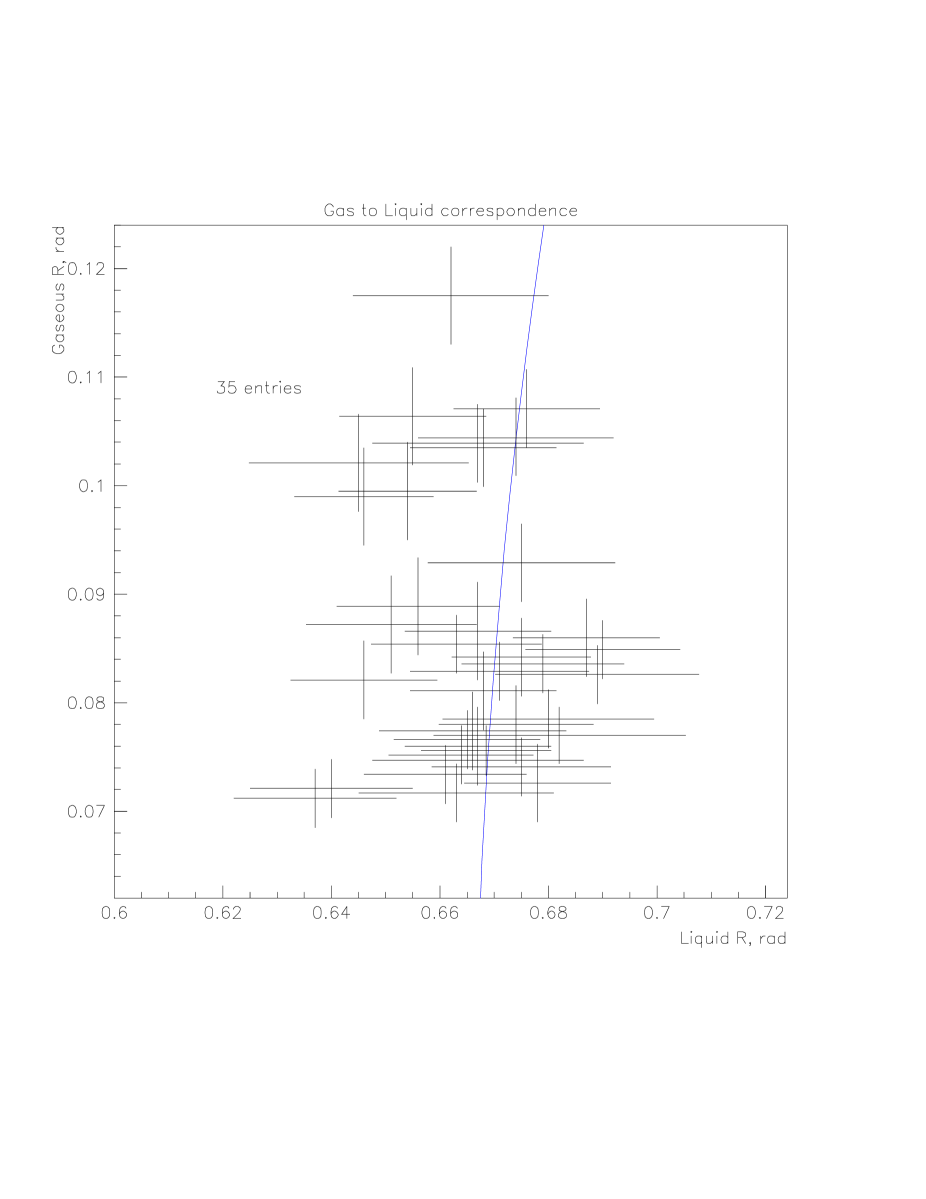
The accumulation of points in the left bottom corner of Fig. 21 (a blow-up of this corner is shown in Fig. 22) is explained by the fact that of the 53 gas rings, represented in Fig. 21, as many as 35 rings have a radius less than 120 mrad. In particular, all the events of topology 2 are concentrated in this corner owing to the selection cuts used, see Sect. 4.2 and Table 4: the anomalous gas rings with the radii below 120 mrad referred to in this Table correspond to the liquid radiator ring radii below 674 mrad, which are very close to the standard liquid ring radii mrad; a similar conclusion is applicable also for anomalous gas rings with radii below 240 mrad in the events of other topologies.
11 Summary
-
1).
The anomalous rings seen in the selected events, all with the radii significantly exceeding the standard ones, are well centered around the directions of the tracks with which they are associated.
-
2).
All these tracks have the associated electromagnetic (HPC) showers with the shower energies agreeing with the track momenta 141414In several events of topology 1 with two tracks non-resolved in the TPC the HPC shower energies exceed the measured track momenta, being however in a good agreement with the beam momenta., showing that the corresponding particles behave in the electromagnetic calorimeters like electrons.
-
3).
Each of the 27 selected events has at least two anomalous rings (several have more than two, up to four), with each ring having a probability less than 10% of being reconstructed fortuitously from background hits, with a condition for the product of these probabilities (for all the rings in a given event, and assuming that the individual ring probabilities are non-correlated) to be below .
-
4).
The events selected do not contain standard gaseous rings unless such rings should be present in a given event (in events of topology 3). On the other hand, if a given track produces an anomalous ring in the gaseous radiator with the radius smaller than 200 mrad, the expected close to standard ring associated with this track is seen in the liquid radiator.
-
5).
Careful studies of backgrounds based on data-driven tests (described in Sect. 6) result in the combined probability that the reconstructed rings are due to fortuitous combinations of background hits which is very low, assuming that there are no correlation between the background samples.
-
6).
An independent (“night sky”) analysis of spurious rings composed of hits in the hit patterns, randomly shifted with respect to the expected impact positions of the corresponding detected tracks, gives an estimate for the number of fortuitous anomalous rings coming from background hits equal to , while the actual observed number of anomalous rings associated with tracks is 82, the difference being .
-
7).
A comparison of rates of events with single and double gaseous anomalous rings indicates a clear tendency for the observed anomalous rings to be produced in pairs.
-
8).
A comparison of the number of anomalous rings observed in the analysis of events of topologies 1 an 2 shows that there are significantly more anomalous rings found in LEP2 data than in LEP1 data which, after accounting for the cross-sections of the relevant background reaction (9.1) and (9.2), makes improbable the hypothesis that the events with anomalous rings, presented in Tables 3 and 4, are fortuitously composed by hits from several standard rings produced by electrons (positrons) showering in the DELPHI detector material. This comparison also indicates that the production mechanisms of events of topologies 1 and 2, containing anomalous rings, are most likely to differ from the production mechanisms of the corresponding background reactions.
-
9).
In all the cases when anomalous rings associated with a given track are observed in both the liquid and the gaseous radiators, the ring radii are highly correlated in accordance with the respective refractive indices of these radiators (see formula (10.1) and Figs. 21 and 23). The correlation coefficient for the points in Fig. 23 is very high (0.992) and the probability to obtain such a correlation coefficient for uncorrelated data is very low.
-
10).
At the time of the construction and subsequent operation of the DELPHI detector computing capacity had not yet reached a level allowing a fully-fledged simulation program based on standard physics and a fully detailed description of the detector. And there is not enough detailed information preserved about the DELPHI experiment to produce such a description today. Therefore, in the evaluation of probabilities quoted in this paper, it has not been possible to consider possible correlations between event samples analysed, implying that the validity of the evidence for the existence of anomalous rings that we have presented in this paper needs to be confirmed by other experiments.
12 Conclusion
The results of a search for events containing anomalous Cherenkov rings, based on an analysis of the data of the DELPHI Barrel RICH, are presented in this work.
A detailed study of backgrounds indicates that the probability that the reconstructed rings are the result of fortuitous combinations of background hits is low. An important argument against the hypothesis that the observed anomalous rings are due to random combinations of background hits, is provided by the observation of a high degree of correlation between anomalous ring radii found in the liquid and gaseous radiators, obeying the Cherenkov cone formula.
Although the results of the present analysis provide an interesting indication of the existence of anomalous Cherenkov rings, it is clear, that further searches for anomalous rings need to be made in future dedicated experiments in order to corroborate or refute the results of this analysis. In particular, an analysis of events of interactions in Pb-Pb collisions at the LHC looks rather promising due to expected enhancement factor in the cross-sections of these interactions which provide usually rather clean events.
Acknowledgements
We acknowledge with gratitude the effort provided by the DELPHI Collaboration for the production of the valuable experimental data used in the present analysis.
We thank Profs. Yu G. Abov, K. G. Boreskov, F. S. Dzheparov, O. V. Kancheli and Drs. D. Barberis, O. N. Ermakov, A. I. Golutvin, A. A. Grigoryan and S. Sila-Novitsky for fruitful discussions and Drs. U. Schwickerath, R. M. Shahoyan for technical assistance.
Appendix 1. Finding the rings by a computer-coded algorithm
In order to find Cherenkov rings, composed of the hits in the hit patterns of the Barrel RICH gas radiator produced by the DELPHI pattern recognition from the data stored in the DELPHI raw data sets, at the stage of the event selection, a computer-coded algorithm was developed. Dubbed as 3-point method, it was used to search for standard and anomalous rings in the events which have passed the preliminary selections based on topological and kinematic characteristics of the events, described in Sect. 4.1 to Sect. 4.3.
The principle of the algorithm was to try all the combinations of 3 hits, present in the hit pattern associated with a given track (hence the name “the 3-point method”) and calculate the parameters of the ring going through these 3 points: the ring radius and the two coordinates of the ring center on the Cherenkov plane (for the definition of the plane see Sect. 2.1).
The ring center coordinates and were allowed to deviate from the plane frame origin by 10 mrad in the direction (i.e. in the magnetic-field bending plane) and by 5 mrad in the direction (perpendicular to the magnetic-field bending plane) in the case of the potential ring radius below 110 mrad. When searching for rings of larger radii (up to 1000 mrad), the tolerances for the ring center deviations were increased proportionally to the ring radii.
For each ring selected in this way a search for additional hits, lying within of the individual photo-electron error, was carried out, the minimal number of hits lying on the ring being required to be 4. Of the many ring candidates reconstructed from 3-hit combinations those giving the minimal probability for the ring to be composed of background hits, calculated with the Poisson formula as described in Appendix 2, were retained, both standard and anomalous rings. In order to accept a ring (of both types) these probabilities were required to be below 10%. The information about the rings found, standard and anomalous, was used in the final selection of events as described in Sect. 4.4.
Appendix 2. The method of estimating the probability that an anomalous ring can be composed of RICH background hits
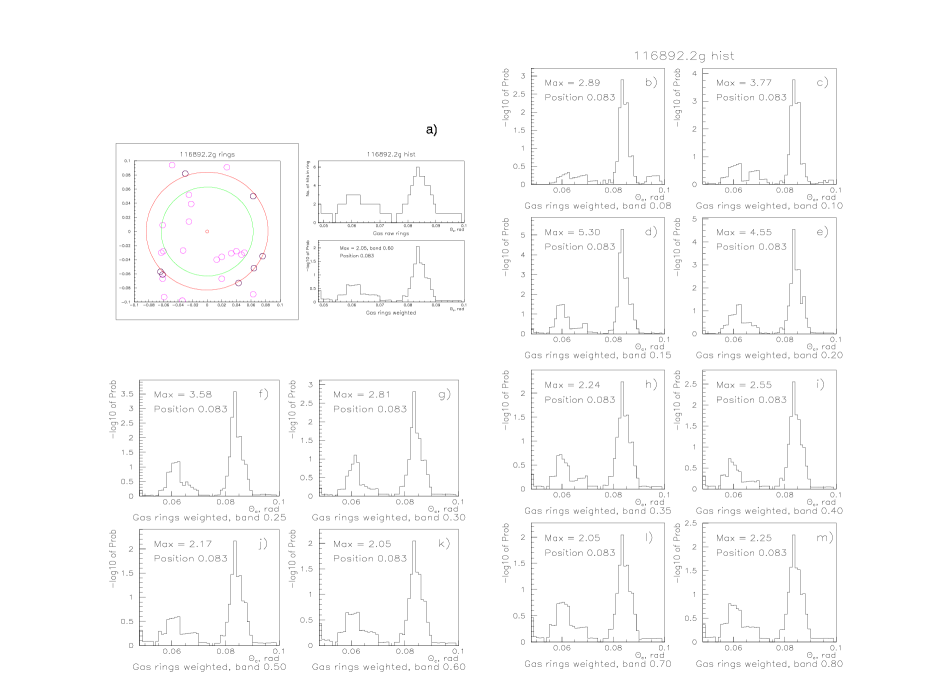
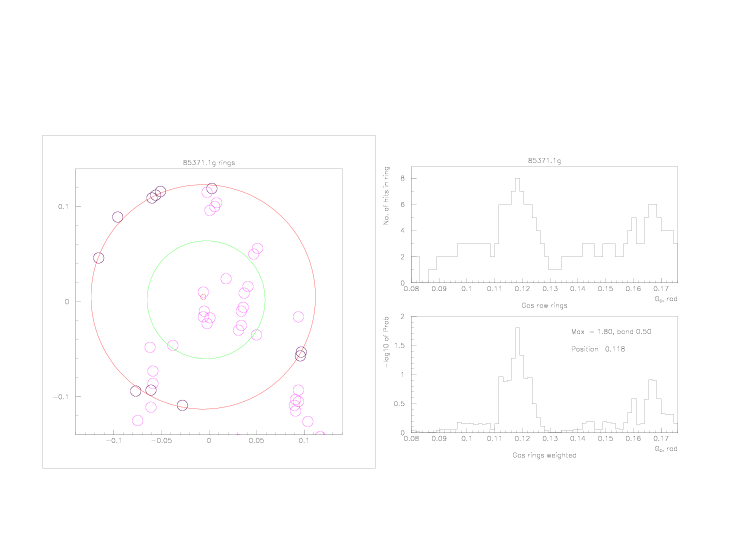
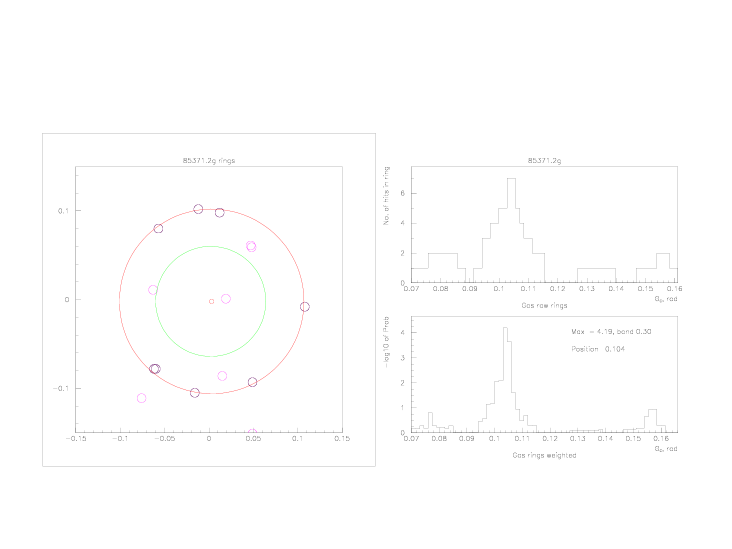
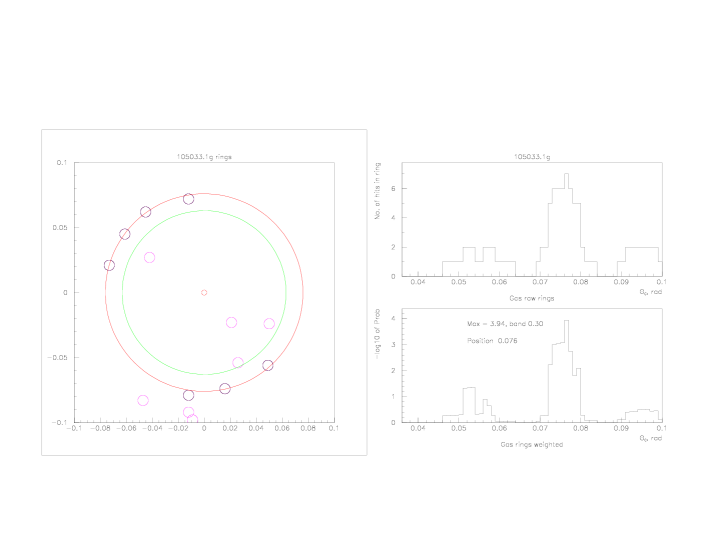
The raw data RICH hit patterns produced by tracks in the selected events were scanned using an algorithm with a sliding radial window. The full widths of the sliding windows were fixed to be 8 mrad for gas ring radii below 100 mrad, 12 mrad for gas ring radii between 100 and 200 mrad, 24 mrad for gas ring radii between 200 and 400 mrad and 48 mrad for gas ring radii exceeding 400 mrad. For liquid rings the full width of the sliding window was 48 mrad in the whole liquid ring radii range studied which was spanned between 600 and 1100 mrad. The scanning step used was equal to 1/8 of the window width. The number of hits inside the window was counted at each step of the scanning procedure (hits overlapping within the individual photon angular error were counted as a single hit) and fed into a histogram, called the raw radial distribution, the histogram bin width being equal to the scanning step. The maxima in this raw radial distribution indicate the most probable Cherenkov cone angles. In parallel, another histogram, called weighted radial distribution, was filled. The content of each bin of the raw radial distribution was transformed to the probability of the hypothesis that the content of this bin was a result of an accumulation of background hits. Then the negative decimal logarithm of this probability was plotted for each radial bin. The probability was calculated assuming a Poisson distribution for the background hits inside the bin, the mean level of the background being estimated from the hit density in two adjacent annuli 151515An area between two concentric rings will in this paper be called an “annulus”. inside and outside of the scanning window (called background annuli), as shown in the following figure:
![[Uncaptioned image]](/html/1912.11839/assets/x2.png)
Since the background hit density was not uniformly distributed, the widths of the background annuli were varied in 12 steps from 8% to 80% of the scanning radius. For hits found in a given scanning window (i.e. in the central annulus) the probability of the number of background hits in this annulus was calculated using the cumulative Poisson distribution. After these calculations had been performed for all background annuli widths, the width giving the maximal probability for the anomalous ring under consideration to be composed of background hits was selected to represent the weighted radial distribution, as illustrated in Fig. 1a. This maximal probability is quoted, in this analysis, as the upper limit for the background probability for a given ring, only those anomalous rings being accepted which had this probability below 10%. The peak position in the corresponding distribution determined the Cherenkov angle.
References
- [1] DELPHI Collaboration, P. Aarnio et al., Nucl. Instr. and Meth. A 303 (1991) 233.
- [2] DELPHI Collaboration, P. Abreu et al., Nucl. Instr. and Meth. A 378 (1996) 57.
- [3] W. Adam et al., Nucl. Instr. and Meth. A 343 (1994) 68.
- [4] W. Adam et al., Nucl. Instr. and Meth. A 360 (1995) 416.
- [5] W. Adam et al., Nucl. Instr. and Meth. A 367 (1995) 233.
- [6] W. Adam et al., Nucl. Instr. and Meth. A 371 (1996) 12.
- [7] E. Albrecht et al., Nucl. Instr. and Meth. A 433 (1999) 47.
- [8] D. Bloch, M. Dracos, S. Tsamarios, Nucl. Instr. and Meth. A 371, 236 (1996)
- [9] J. García Pérez, A. López Agüera, Nucl. Instr. and Meth. A 371, 232 (1996); ibid, 343, 276 (1994)
- [10] M. Battaglia, P.M. Kluit, DELPHI note, DELPHI 96-133 RICH 90, http://inspirehep.net/record/1659476
- [11] S. Paiano, A. Perrotta, DELPHI note, DELPHI 98-37 CAL 139, http://inspirehep.net/record/1661282
- [12] DELPHI Collaboration, P. Abreu et al., Phys. Lett. B 327 (1994) 386.
- [13] DELPHI Collaboration, J. Abdallah et al., Euro. Phys. J. C 37 (2004) 405.
- [14] DELPHI Collaboration, P. Abreu et al., Euro. Phys. J. C 16 (2000) 371.
- [15] DELPHI Collaboration, J. Abdallah et al., Euro. Phys. J. C 45 (2006) 589.
Description of the contents of Tables 1 and 2 below.
Topologies 1 and 2 are subdivided in two sub-topologies, and , as
defined in the table heads. Selection 1 means the general selection and primary
topological cuts (point 1 in the list of selection cuts, Sects. 4.1-4.3).
Selection 2 retains the tracks having electron-like nature
(point 2 in the list of selection cuts);
thus these two selections precede the application of special cuts which depend
on a particular topology. Selection 3 means final topological and kinematic
cuts preceding the application of cuts based on the Barrel RICH information:
for topologies 1a, 1b this means cuts 3, 4 and 5 specified in Sect. 4.1;
for topologies 2a, 2b this means the cut 3 specified in Sect. 4.2; and the
cuts 3 and 4 for topology 3 (Sect. 4.3). Selection 4 means the application of
cuts based on the Barrel RICH information stored in the DST’s, these cuts being
specified: for topologies 1a, 1b: not applied;
for topologies 2a and 2b the cuts in points 4 and 5 of Sect. 4.2;
for topology 3 the cut in point 5 of Sect. 4.3.
Selection 5 gives the number of events passed the 3-point method processing
with the use of the RICH information from the raw data,
found to contain at least one anomalous ring with the upper limit for the
background probability less than 10%,
and which have no standard gas rings in the events of topologies 1 and 2.
Selection 6 means the final selection which requires the presence of at least
two anomalous rings in each event with the combined background probability
below ; the numbers in this row
present the events which are stored in Tables 3 to 5.
Table 1. Selection of LEP 1 events: the number of events retained after an application of sequential cuts described in the comments to the Tables 1, 2 above and in the text, Sect. 4.
| Selection | Topology 1a, | Topology 1b, | Topology 2a, | Topology 2b, | Topology 3 |
|---|---|---|---|---|---|
| non-resolved tracks | resolved tracks | Bhabha-like | |||
| 1 | 13897 | 522 | 206089 | 26985 | 9528 |
| 2 | 7134 | 198 | 69223 | 2352 | 1050 |
| 3 | 22 | 43 | 47771 | 268 | 247 |
| 4 | 22 | 43 | 87 | 30 | 117 |
| 5 | 3 | 1 | 7 | 0 | 13 |
| 6 | 0 | 0 | 0 | 0 | 8 |
Table 2. Selection of LEP 2 events: the number of events retained after an application of sequential cuts (see comments to Tables 1 and 2 above and the text, Sect. 4).
| Selection | Topology 1a, | Topology 1b, | Topology 2a, | Topology 2b, | Topology 3 |
|---|---|---|---|---|---|
| non-resolved tracks | resolved tracks | Bhabha-like | |||
| 1 | 2302 | 131 | 10644 | 19589 | 214 |
| 2 | 1975 | 82 | 5889 | 3050 | 42 |
| 3 | 19 | 7 | 4658 | 1752 | 10 |
| 4 | 19 | 7 | 24 | 38 | 8 |
| 5 | 9 | 4 | 1 | 9 | 6 |
| 6 | 6 | 3 | 1 | 5 | 4 |
Description of the contents of Tables 3-5 below.
These Tables contain only events in which there are for each track both a gas
and a liquid ring (with two exceptions described below).
If in the “Ring radius” column there is a liquid ring,
marked “Liq”, preceded by a gas ring, marked “Gas”, this means that the
liquid ring is anomalous and pertains to the same track as the gas
ring. If a gas ring is not accompanied by a liquid ring this means that
the liquid ring pertaining to the same track as the gas ring has a radius
mrad, in which case the liquid ring parameters have been omitted from
the Tables. However, both the gas and the liquid rings for each track have been
plotted in Figs. 21 and 23 below (there are two exceptional
events: the event 107038:11748 of topology 1a in which the expected liquid
radiator ring, with the radius of 854 mrad predicted from the gaseous anomalous
ring radius, overlaps strongly with the quartz ring making its unambiguous
identification impossible, and the event 49062:2354 of topology 3 in which a
track producing an anomalous ring of a radius of 220 mrad in the gas radiator
went through the crack in the liquid radiator).
The OD tag indicates the state of the association of the Outer
Detector track element with the track to which a given gas ring was assigned:
2 means a clear association, 1 means that a cluster of OD hits exists in the
OD region intersected by the track, which prevents establishing a clear
association, and 0 means that no association was found. The numbers in the
4th column of the Tables indicate the number of RICH hits found in the radial
window of a width of two times of the expected single photon angular accuracy,
corresponding to the ring radius. The numbers in the 5th column of the Tables
present the expectations for the background hit levels in these windows
calculated on the base of the hit density in the vicinity of the ring, as
explained in Appendix 2. The numbers in the 6th column present the upper
limits for the probability of the ring to be composed of background hits.
Table 3. Characteristics of anomalous rings found in events of topology 1.
| Run | Ring radius, | OD tag | No. of hits | Expected | BG p-value | Product of BG |
|---|---|---|---|---|---|---|
| Event | mrad | found | BG level | per ring | p-values per event | |
| 71768 | Gas | 1 | 6 | 2.72 | 0.0587 | |
| 6277 | Liq | 10 | 3.84 | 0.0062 | ||
| Gas | 1 | 6 | 2.26 | 0.0280 | ||
| 84451 | Gas | 2 | 16 | 10.46 | 0.0667 | |
| 478 | Liq | 7 | 2.69 | 0.0560 | ||
| Gas | 2 | 4 | 1.61 | 0.0801 | ||
| 86748 | Gas | 2 | 5 | 0.90 | 0.0024 | |
| 757 | Liq | 11 | 6.08 | 0.0459 | ||
| Gas | 2 | 5 | 1.26 | 0.0094 | ||
| 101830 | Gas | 1 | 9 | 2.77 | 0.0022 | |
| 15719 | Gas | 1 | 9 | 4.29 | 0.0315 | |
| 102500 | Gas | 0 | 5 | 1.74 | 0.0320 | |
| 9258 | Liq | 9 | 2.79 | 0.0024 | ||
| Gas | 0 | 5 | 1.96 | 0.0492 | ||
| 106061 | Gas | 2 | 9 | 3.57 | 0.0111 | |
| 3293 | Liq | 7 | 2.62 | 0.0180 | ||
| Gas | 2 | 7 | 2.06 | 0.0053 | ||
| 107038 | Gas | 1 | 7 | 2.41 | 0.0117 | |
| 11748 | Gas | 1 | 7 | 3.07 | 0.0369 | |
| 116892 | Gas | 1 | 4 | 1.44 | 0.0578 | |
| 5928a | Liq | 10 | 4.43 | 0.0155 | ||
| Gas | 1 | 6 | 1.74 | 0.0090 | ||
| 116892 | Gas | 2 | 10 | 4.90 | 0.0283 | |
| 5228b | Liq | 5 | 1.67 | 0.0279 | ||
| Gas | 2 | 14 | 4.14 | 0.0001 |
Comment to Table 3. Events having event numbers printed in italic pertain to topology 1b; the rest events are of topology 1a. Comments to Tables 3, 4 and 5: Multiplying the background p-values of the individual anomalous rings in an event to obtain a combined p-value requires that the anomalous rings found in a given event are uncorrelated. We have found it difficult to evaluate the correlations of the rings, but assume that they are very small. In consequence, the values of the products of p-values in the rightmost columns of these Tables provide only indicative upper limits for the probability of that all of the anomalous rings in each event are due to fortuitous background combinations.
Table 4. Characteristics of anomalous rings found in events of topology 2.
| Run | Ring radius, | OD tag | No. of hits | Expected | BG p-value | Product of BG |
|---|---|---|---|---|---|---|
| Event | mrad | found | BG level | per ring | p-values per event | |
| 77190 | Gas | 2 | 7 | 1.52 | 0.0010 | |
| 2950 | Gas | 2 | 4 | 1.45 | 0.0589 | |
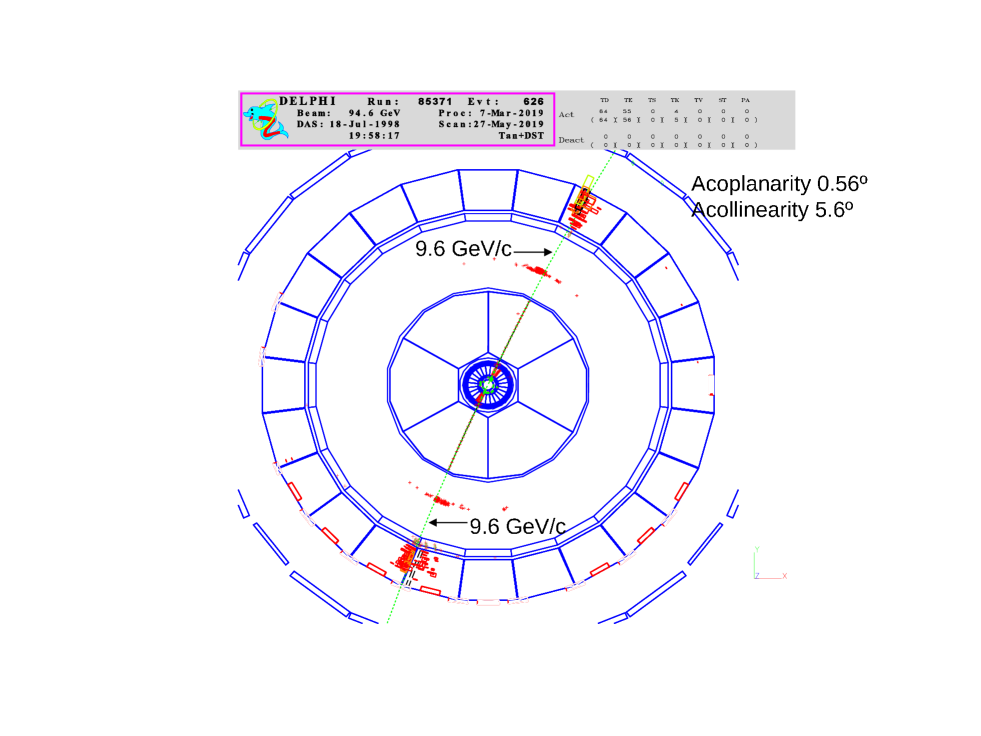
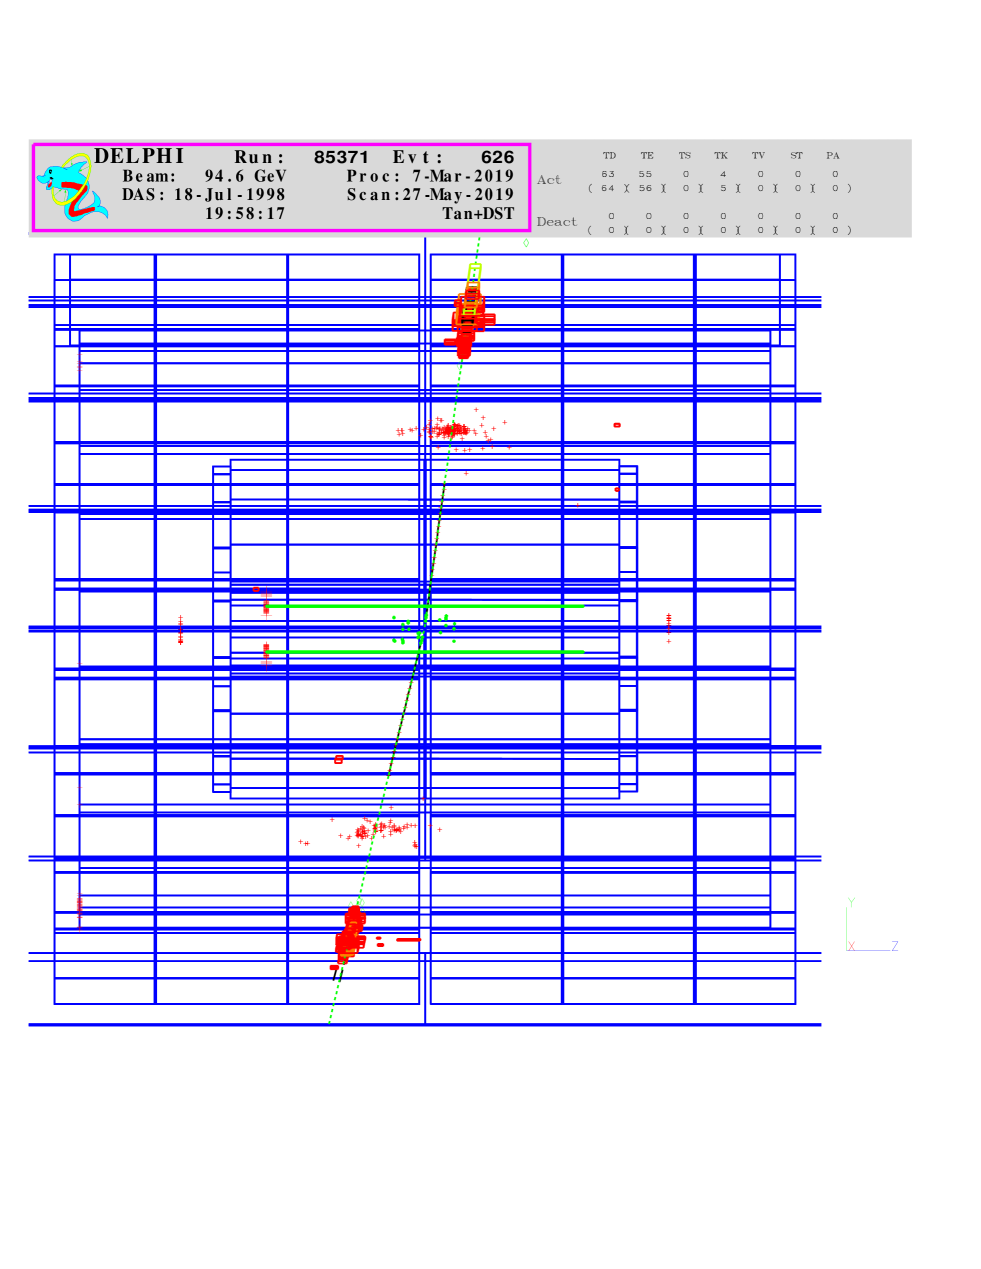
| 85371 | Gas | 0 | 8 | 3.16 | 0.0158 | |
| 626 | Gas | 2 | 7 | 0.96 | 0.0001 | |
| 88975 | Gas | 0 | 5 | 1.23 | 0.0086 | |
| 84 | Gas | 2 | 4 | 1.67 | 0.0895 | |
| 105033 | Gas | 2 | 7 | 1.06 | 0.0001 | |
| 3999 | Gas | 0 | 7 | 2.13 | 0.0064 | |
| 110546 | Gas | 2 | 4 | 0.92 | 0.0147 | |
| 15356 | Gas | 2 | 4 | 1.34 | 0.0470 | |
| 115187 | Gas | 1 | 5 | 1.65 | 0.0268 | |
| 4860 | Gas | 1 | 4 | 1.04 | 0.0215 |
Comments to Table 4. The event 110546:15356, having event number printed in italic, pertains to topology 2a; the rest events are of topology 2b. The absence of liquid rings in this table is explained by the fact that the liquid rings seen associated with the gas rings all have radius less than 674 mrad , very close to the standard liquid ring radius 667 mrad.
Table 5. Characteristics of anomalous rings found in events of topology 3.
| Run | Ring radius, | OD tag | No. of hits | Expected | BG p-value | Product of BG |
|---|---|---|---|---|---|---|
| Event | mrad | found | BG level | per ring | p-values per event | |
| 41633 | Gas | 2 | 6 | 2.22 | 0.0260 | |
| 1568 | Gas | 2 | 7 | 2.45 | 0.0129 | |
| 42495 | Gas | 2 | 8 | 4.10 | 0.0570 | |
| 24853 | Gas | 2 | 11 | 5.10 | 0.0156 | |
| 46877 | Gas | 2 | 9 | 3.77 | 0.0002 | |
| 4278 | Liq | 6 | 3.06 | 0.0897 | ||
| Gas | 2 | 12 | 6.25 | 0.0263 | ||
| 49062 | Gas | 2 | 8 | 2.34 | 0.0028 | |
| 2354 | Gas | 0 | 10 | 4.35 | 0.0336 | |
| 49316 | Gas | 2 | 5 | 1.89 | 0.0430 | |
| 584 | Gas | 2 | 7 | 2.51 | 0.0146 | |
| 50971 | Gas | 2 | 6 | 1.64 | 0.0068 | |
| 4331 | Gas | 1 | 4 | 1.37 | 0.0504 | |
| 58547 | Gas | 2 | 6 | 2.20 | 0.0248 | |
| 23906 | Gas | 2 | 10 | 3.48 | 0.0032 | |
| 62192 | Gas | 2 | 6 | 1.11 | 0.0010 | |
| 20534 | Qua | 6 | 2.37 | 0.0339 | ||
| Gas | 2 | 4 | 1.54 | 0.0708 | ||
| Qua | 5 | 1.67 | 0.0275 | |||
| 79940 | Gas | 0 | 7 | 3.50 | 0.0661 | |
| 2890 | Liq | 6 | 2.19 | 0.0246 | ||
| Qua | 5 | 1.72 | 0.0306 | |||
| Gas | 1 | 6 | 1.94 | 0.0145 | ||
| 104949 | Gas | 2 | 8 | 4.59 | 0.0942 | |
| 27827 | Liq | 9 | 5.21 | 0.0827 | ||
| Gas | 0 | 6 | 3.07 | 0.0912 | ||
| Liq | 7 | 3.79 | 0.0900 |
Table 5, continued. Characteristics of anomalous rings found in events of topology 3.
| Run | Ring radius, | OD tag | No. of hits | Expected | BG p-value | Product of BG |
|---|---|---|---|---|---|---|
| Event | mrad | found | BG level | per ring | p-values per event | |
| 105892 | Gas | 0 | 5 | 1.14 | 0.0063 | |
| 13127 | Gas | 2 | 7 | 1.83 | 0.0029 | |
| 114204 | Gas | 1 | 10 | 5.22 | 0.0407 | |
| 2668 | Liq | 11 | 6.60 | 0.0726 | ||
| Gas | 1 | 11 | 4.53 | 0.0071 | ||
| Liq | 8 | 3.29 | 0.0195 |
Comments to Table 5. “Qua” means the quartz radiator ring. When it is preceded by a gas (liquid) ring this means that the quartz ring pertain to the same track as the preceding gas (liquid) ring.
Note, the quartz ring of a radius of 990 mrad, found in the event 79940:2890, after recalculation of its radius to the expected liquid radiator ring radius (823 mrad) and combined with the radius of the gaseous ring of 580 mrad associated with the same track, gives additional entries (marked in dark blue) to Figs. 21, 23.