Radial Evolution of Coronal Mass Ejections Between MESSENGER, Venus Express, STEREO, and L1: Catalog and Analysis
Abstract
\justifyOur knowledge of the properties of Coronal Mass Ejections (CMEs) in the inner heliosphere is constrained by the relative lack of plasma observations between Sun and 1 AU. In this work, we present a comprehensive catalog of 47 CMEs measured in situ measurements by two or more radially aligned spacecraft (MESSENGER, Venus Express, STEREO, or Wind/ACE). We estimate the CME impact speeds at Mercury and Venus using a drag-based model and present an average propagation profile of CMEs (speed and deceleration/acceleration) in the inner heliosphere. We find that CME deceleration continues past Mercury’s orbit but most of the deceleration occurs between the Sun and Mercury. We examine the exponential decrease of the maximum magnetic field strength in the CME with heliocentric distance using two approaches: a modified statistical method and analysis from individual conjunction events. Findings from both the approaches are on average consistent with previous studies but show significant event-to-event variability. We also find the expansion of the CME sheath to be well fit by a linear function. However, we observe the average sheath duration and its increase to be fairly independent of the initial CME speed, contradicting commonly held knowledge that slower CMEs drive larger sheaths. We also present an analysis of the 3 November 2011 CME observed in longitudinal conjunction between MESSENGER, Venus Express, and STEREO-B focusing on the expansion of the CME and its correlation with the exponential fall-off of the maximum magnetic field strength in the ejecta.
JGR: Space Physics
Space Science Center and Department of Physics, University of New Hampshire, Durham, NH, USA.
T. M. Salmants1090@wildcats.unh.edu
Comprehensive catalog of 47 CMEs observed in conjunction between radially aligned spacecraft in the inner heliosphere.
Conjunction events reveal that the sheath duration expands nearly linearly but independently of the initial CME speed.
Average decrease of the maximum magnetic field strength in the CME agrees with past results, but individual CMEs may deviate significantly from the average.
1 Introduction
Coronal Mass Ejections (CMEs) are large-scale, episodic transient events in which large amounts (on average 1015-1016 g of plasma) of material from the solar atmosphere are ejected in the solar wind [Hundhausen (\APACyear1988)]. CMEs remove the built-up magnetic flux and helicity over the solar magnetic cycle from the solar corona [Chen (\APACyear2017), Green \BOthers. (\APACyear2018), Low (\APACyear1996)]. Most of the ejected material comes from the low corona, although cooler, denser material likely of chromospheric or photospheric origin is also sometimes involved [Webb \BBA Howard (\APACyear2012)]. CMEs are commonly associated with different forms of solar activity such as eruptive prominences and solar flares [Gosling \BOthers. (\APACyear1974)]. CME ejected material in the solar wind is a crucial link between solar activity and disturbances in the heliosphere [E. Kilpua \BOthers. (\APACyear2017), Y. Liu \BOthers. (\APACyear2010)].
CMEs are responsible for the most extreme space weather effects at Earth [Baker \BOthers. (\APACyear2008)]. \citeAZhang:2007 found 87% of the 88 intense geomagnetic storms (Dst-100 nT) that occurred during 1996-2005 to be caused by CMEs. Long-duration (>3 h), large and negative (<-10 nT) southward Bz lead to intense geo-magnetic storms [Gonzalez \BBA Tsurutani (\APACyear1987)]. The key reasons why CMEs drive the strongest geomagnetic storms are their enhanced speed and magnetic field inside the magnetic ejecta and the sheath regions, which can provide strong southward fields for several hours [Farrugia \BOthers. (\APACyear1997), Huttunen \BOthers. (\APACyear2005), J. Zhang \BOthers. (\APACyear2007)]. As a result, reliable and actionable space weather forecasting relies on the ability to predict the magnetic field structure and longevity of a CME before arrival at Earth [E\BPBIK\BPBIJ. Kilpua \BOthers. (\APACyear2019)], provided that the magnetic field direction does not change drastically during the remaining propagation time [Winslow \BOthers. (\APACyear2016)]. As the geoeffectiveness of CMEs strongly depends on the magnetic field direction within them, present efforts are focused on inferring their general magnetic topology in real time from space-based solar observatories [<]e.g.,¿[]Palmerio:2018,Salman:2018,Savani:2015.
In situ measurements along with spaceborne and ground-based remote observations have improved our knowledge of the origins and development of CMEs [T\BPBIA. Howard \BBA DeForest (\APACyear2012), Lugaz \BBA Roussev (\APACyear2011)]. Before the launch of STEREO [<]Solar Terrestrial Relations Observatory:¿[]Kaiser:2005, most modern-day CME observations were primarily constrained to two domains: near-Earth space borne observations extending out to 30 solar radius and in situ measurements near L1 (first Lagrangian Point). With the launch of STEREO in 2006, CMEs have been routinely observed from the Sun to the Earth combining observations from extreme ultraviolet imager (EUVI: range of 1-1.7 Rs), coronagraphs (COR1: observes white light ranging from 1.5-4 Rs and COR2: observes white light ranging from 2.5-15 Rs) and Heliospheric Imagers (HI-1: range of 15-84 Rs and HI-2: 66-318 Rs) on board the STEREO spacecraft [Davis \BOthers. (\APACyear2009), Harrison \BOthers. (\APACyear2005), Harrison \BOthers. (\APACyear2018), R\BPBIA. Howard \BOthers. (\APACyear2008)]. However, there is often a mismatch between the inferred magnetic configuration of CMEs near the Sun as determined from various indirect proxies (coronagraph and heliospheric imagers do not give direct information about the magnetic field inside CMEs) and what is measured in situ [<]e.g.,¿[]Palmerio:2018. Probable reasons for this mismatch can be: the flux rope orientation (and, hence magnetic field rotation) is difficult to determine directly from white-light observations [Isavnin \BOthers. (\APACyear2013), Thernisien \BOthers. (\APACyear2009)], the magnetic structure can drastically change during the CME propagation (see next paragraph), and existing methods cannot link in situ signatures to coronal observations with reasonable precision. On the other hand, in situ solar wind measurements provide a detailed but extremely limited and potentially localized view of a CME at the position of the spacecraft near 1 AU [Lugaz \BOthers. (\APACyear2018)]. Due to expansion, at this distance the CME can cover up to around 100∘ in heliocentric longitude and several tenths of an AU along the radial direction to the Sun [Bothmer \BBA Schwenn (\APACyear1998), Y. Liu \BOthers. (\APACyear2005), Möstl \BOthers. (\APACyear2012), Richardson \BBA Cane (\APACyear2010), Wood \BOthers. (\APACyear2010)]. \citeAGood:2016 focused on the longitudinal extent of CMEs based on the proportion of CMEs measured by two spacecraft for various longitudinal separations. They found that when two spacecraft were within 30∘ from each other, signatures of the flux rope are observed by both spacecraft 65% of the time. In addition, there is a lack of plasma and compositional data at sub-1 AU heliocentric distances as recent planetary missions in the inner heliosphere such as MESSENGER [<]MErcury Surface, Space ENvironment, GEochemistry, and Ranging:¿[]Solomon:2001 and Venus Express [Titov \BOthers. (\APACyear2006)] do not typically provide solar wind plasma measurements. Therefore, we have a key observational gap in our understanding of CME evolution and propagation into interplanetary space between these domains [Forsyth \BOthers. (\APACyear2006)]. However, with MAVEN [<]Mars Atmosphere and Volatile Evolution:¿[]Jakosky:2015, Parker Solar Probe [Fox \BOthers. (\APACyear2016)], and BepiColombo [Benkhoff \BOthers. (\APACyear2010)] already in space and the future launch of Solar Orbiter [Müller \BOthers. (\APACyear2013)], all missions including solar wind plasma measurements, we are approaching a new era of inner heliosphere exploration through dedicated missions.
Coronal magnetic field and plasma carried by a CME in the heliosphere has distinctive signatures with a large amount of variation. However, except for a few studies that used multi-point spacecraft observations [L. Burlaga \BOthers. (\APACyear1981), Cane \BOthers. (\APACyear1997), Farrugia \BOthers. (\APACyear2011), Good \BOthers. (\APACyear2015), Good \BOthers. (\APACyear2018), Janvier \BOthers. (\APACyear2019), E\BPBIK\BPBIJ. Kilpua \BOthers. (\APACyear2011), Möstl, Farrugia, Biernat\BCBL \BOthers. (\APACyear2009), Möstl, Farrugia, Miklenic\BCBL \BOthers. (\APACyear2009), Möstl (\APACyear2015), Prise \BOthers. (\APACyear2015), Y. Wang \BOthers. (\APACyear2018), Winslow \BOthers. (\APACyear2016), Winslow \BOthers. (\APACyear2018)], CME measurements are largely restricted to single-point observations in space [<]see also discussion in¿[]Lugaz:2018. \citeALeitner:2007 previously listed 7 magnetic cloud (MC) events which were observed at two or more spacecraft during solar cycles 20 and 21. These lineup events were observed at heliocentric distances ranging from 0.62-9.4 AU, with longitudinal separations between the observing spacecraft being less than 20∘. Recently, \citeAGood:2019 examined the self similarity in the time series profiles of magnetic field structures of 18 interplanetary flux ropes. These flux ropes were observed by radially aligned spacecraft in the inner heliosphere (combinations of MESSENGER, Venus Express, and STEREO) with the latitudinal and longitudinal separations between the observing spacecraft not exceeding 15∘.
Given this localized nature of CME observations, global configuration of a CME can be difficult to extrapolate as it is not always clear which part of the CME is being sampled, as a single spacecraft can only sample a narrow trajectory through the larger CME structure [Reinard \BOthers. (\APACyear2012)]. Also the motion of a CME in the solar wind depends on the heliospheric environment it encounters during its propagation [E\BPBIK\BPBIJ. Kilpua \BOthers. (\APACyear2012), Temmer \BOthers. (\APACyear2011)]. Therefore, CME signatures observed with near-Earth in situ measurements can drastically change from its coronal counterpart or other measurements in the inner heliosphere because of interaction with the background solar wind [<]e.g. deceleration/acceleration, deformation, shock wave formation etc., see¿[]Manchester:2017, deflection [<]e.g.,¿[]Gosling:1987b,Isavnin:2013,Kay:2013,Kay:2015,Kilpua:2009,Lugaz:2011c,Vandas:1996,Wang:2004,Wang:2014,Zhuang:2019, rotation [Cohen \BOthers. (\APACyear2010), Isavnin \BOthers. (\APACyear2014), Nieves-Chinchilla \BOthers. (\APACyear2013)], interaction with another CME [Lugaz \BOthers. (\APACyear2015), Lugaz \BOthers. (\APACyear2017)]. With currently no plasma measurements at sub-1 AU heliocentric distances, we rely on models to simulate CME evolution in the inner heliosphere. Although present models based on numerical simulations [Jin \BOthers. (\APACyear2017), Lugaz \BOthers. (\APACyear2007), Odstrčil \BOthers. (\APACyear2002), Odstrčil \BOthers. (\APACyear2004)] or empirical methods [Gopalswamy \BOthers. (\APACyear2001), Kay \BOthers. (\APACyear2017), Kim \BOthers. (\APACyear2007), Vršnak \BOthers. (\APACyear2013)] can forecast the basic characteristics of CMEs (speed, arrival time), it cannot predict the exact magnetic structure of the CME and the development of the sheath region. As a result, it is important to have multi-point observations to understand the governing physics behind CME propagation and evolution in the inner heliosphere. That prompted us to search for conjunction events between radially aligned spacecraft in the inner heliosphere. Due to the orbital periods of Mercury (88 days) and Venus (225 days), the occurrence of radial conjunctions are frequent between these spacecraft and the ones at 1 AU (e.g. ACE, Wind, STEREO). As a result, MESSENGER, Venus Express, STEREO, and Wind/ACE have the potential to offer unprecedented in situ coverage of interplanetary space and radial measurements of CMEs. Such events can allow us to determine the radial evolution of CMEs with much better cohesiveness. From an observational perspective, detailed analysis of these events can provide a continuous picture of CME propagation in realistic background solar wind conditions and improve the accuracy of the CME magnetic structure prediction by linking solar observations with in situ measurements. In this study, we combine two distinct issues/types of research: multi-spacecraft measurements of the same CME with the spacecraft at the same radial distance [L. Burlaga \BOthers. (\APACyear1981), E\BPBIK\BPBIJ. Kilpua \BOthers. (\APACyear2011), Möstl, Farrugia, Biernat\BCBL \BOthers. (\APACyear2009)] and multi-spacecraft measurements of the same CME with the spacecraft at the same longitude [Farrugia \BOthers. (\APACyear2011), Good \BOthers. (\APACyear2015), Good \BOthers. (\APACyear2018), Möstl (\APACyear2015), Prise \BOthers. (\APACyear2015), Y. Wang \BOthers. (\APACyear2018), Winslow \BOthers. (\APACyear2016), Winslow \BOthers. (\APACyear2018)]. Recently, \citeAJanvier:2019 used data from MESSENGER, Venus Express, and ACE to determine statistically how CME magnetic field, of both ejecta and sheath, evolve with radial distance [<]see also¿[]Gulisano:2010,Winslow:2015. Here, we take a different approach, where we focus on events where two or more spacecraft measure the same CME. By doing so, we do not have to rely on statistical techniques to determine how properties change with distance. We can also better evaluate how individual CME events have an evolution that deviate from the average statistical behavior of CMEs.
In this study, we list 45 CMEs observed in conjunction between at least two spacecraft (47 two-spacecraft conjunctions). Coronagraph observations and database timings are used in association to identify potential multi-spacecraft conjunction events. For each of these events, we require the longitudinal separation between the spacecraft to be less than 35∘ (except one, see Section 2.4). LASCO [<]Large Angle Spectroscopic Coronagraph:¿[]Brueckner:1995 CMEs (with angular width >30∘) have an average angular width of 60∘ [Gopalswamy \BOthers. (\APACyear2010)]. Therefore a longitudinal separation less than 35∘ increases the likelihood of two or more radially aligned spacecraft observing both the sheath and the ejecta, rather than only the sheath itself [<]see statistical results of¿[]Good:2016. However, CMEs measured at longitudinal separations as small as 1∘ can have significant differences in measurements from one observing spacecraft to another [E\BPBIK\BPBIJ. Kilpua \BOthers. (\APACyear2011), Lugaz \BOthers. (\APACyear2018)]. We discuss how this may affect the results later on in the text.
The paper is organized as follows. In Section 2, we explain the method used to identify the coronal source of a CME counterpart observed at multi-spacecraft locations. We list 47 conjunction events between MESSENGER, Venus Express, STEREO, and/or Wind/ACE in Section 3. In Section 4, we present an analysis of the 3 November 2011 CME event observed at three different points in space (MESSENGER, Venus Express, STEREO-B). A brief summary and discussion are stated in Section 5.
2 Methodology
2.1 Description of the Data Set
The MESSENGER spacecraft launched on 3 August 2004 was inserted into orbit about Mercury on 18 March 2011 following a 7-year cruise phase. MESSENGER is the first spacecraft since Helios 1 and 2 in the 1980s to make in situ measurements of the interplanetary medium at heliocentric distances <0.5 AU. The initial orbit had a 12 h period. MESSENGER remained in this orbit until 16 April 2012, when the apoapsis was decreased and the orbital period reduced to 8 h. During the initial orbit phase, MESSENGER typically spent 2-4 h per orbit inside Mercury’s bow shock and magnetosphere and the rest of the time in the interplanetary medium. After the orbital period was lowered to 8 h, the time inside Mercury’s magnetosphere increased to 3-5 h on average per orbit. The mission was terminated on 30 April 2015. In the present study, we have used 1-s high-resolution data from the magnetometer [<]MAG:¿[]Anderson:2007 instrument on-board the MESSENGER spacecraft.
The Venus Express spacecraft was launched on 9 November 2005 to study the atmosphere of Venus, from the surface to the ionosphere. The spacecraft entered orbit on 11 April 2006 where it remained until the end of its mission in December 2014. In the present study, Venus Express’s MAG [T\BPBIL. Zhang \BOthers. (\APACyear2006)] data with 1-min resolution is used.
STEREO, launched in 2006 employs two nearly identical Sun-pointed space-based observatories- one ahead of Earth in its orbit (STEREO-A), the other trailing behind (STEREO-B). Communications with the STEREO-B spacecraft were interrupted on 1 October 2014. In the present study, we have used 1-minute resolution plasma data from the PLASTIC instrument [Galvin \BOthers. (\APACyear2008)] and 1/8 s high resolution magnetic field data from the IMPACT instrument [Luhmann \BOthers. (\APACyear2008)] on-board the twin STEREO spacecraft.
The Wind and Advanced Composition Explorer [<]ACE:¿[]Stone:1998 were launched on 1 November 1994 and 25 August 1997 respectively and both now orbits the L1 point. In the present study, we have used 1-minute resolution data from the Wind Magnetic Field Investigation [<]MFI:¿[]Lepping:1995 instrument and 16-s high resolution data from the ACE Magnetic Fields Experiment instrument [Smith \BOthers. (\APACyear1998)].
We use the catalogs of CMEs observed by MESSENGER [<]69 CMEs in the time interval 2011-2015:¿Winslow:2015,Winslow:2017, Venus Express [<]84 events in the time interval 2006-2013:¿Good:2016, STEREO [<]2007-2016:¿Jian:2018, and ACE [<]1996-2018:¿Richardson:2010 to build our conjunction database of multi-point CME observations.
2.2 Identification of Probable CME Candidate/s for a Conjunction Event
For a CME to be listed as a possible conjunction between two or more spacecraft, we first require the longitudinal separation between the spacecraft to be less than 35∘ in Heliographic Inertial (HGI) Coordinates during the event. We start by examining the CMEs observed by the MESSENGER Magnetometer between 2011 and 2015. For each CME observed by MESSENGER during this time span, we list the longitudinal separations between MESSENGER and Venus Express, STEREO, and Wind/ACE. For any longitudinal separation greater than 35∘, we remove that specific event from consideration. Then we search for CME signatures measured by Venus Express, STEREO, and Wind/ACE spacecraft in their corresponding databases within an expected interval after the CME was initially measured at MESSENGER. Any CME satisfying this criterion is listed as a possible conjunction between the spacecraft. We repeat the same procedure using the Venus Express CME catalog spanning 7.5 years (2006-2013) to list possible conjunctions between Venus Express and STEREO and Venus Express and Wind/ACE. Therefore, the conjunction database inherently splits into three sections: events observed in conjunction by MESSENGER and Venus Express between 2011 and 2013, MESSENGER and STEREO or Wind or ACE between 2011 and 2015, and Venus Express and STEREO or Wind or ACE between 2006 and 2013.
For each conjunction event, we identify the date and time of the CME’s first appearance in the LASCO/C2 field of view. As we lack plasma measurements of the CMEs encountered by MESSENGER and Venus Express, with the help of the Drag-Based model (DBM) formulated by \citeAVrsnak:2012, we provide estimated impact speeds at Mercury and Venus. As an input for this estimate, we use the ambient solar wind speed measured near 1 AU. For estimation of impact speeds at Mercury and Venus for any MESSENGER-Venus Express conjunction, we use 392 km s-1 as the solar wind speed (average upstream speed of 113 CME-driven shocks measured by the STEREO spacecraft from 2007-2016) as an input for the DBM. To determine the date and time of the likely CME’s first C2 appearance, we use the CDAW (Coordinated Data Analysis Workshops) CME catalog [Yashiro \BOthers. (\APACyear2004)] and SECCHI [<]Sun Earth Connection Coronal and Heliospheric Investigation:¿[]Howard:2008 CME lists [Robbrecht \BOthers. (\APACyear2009)], automatically generated by CACTus (Computer Aided CME Tracking software). To identify a potential CME candidate, we search for agreement between the CME launch direction and positioning of the corresponding spacecraft during the event interval. We approximate the CME propagation direction (halo, west/east limb, and backsided) using three different field of views: the CME observed from SOHO (LASCO observations) and the two STEREO spacecraft (COR2 observations). This is achieved by comparing the relative heliographic longitudes of the spacecraft on the day of interest. We perform this for each CME upto a period of 3-5 days (3 if spacecraft 1 is MESSENGER and 5 if spacecraft 1 is Venus Express) before the CME was observed at spacecraft 1. After this initial process of elimination, we use the DBM to estimate the CME arrival time at the spacecraft in consideration and match them with the timings listed in their corresponding catalogs. If the arrival time predicted by the DBM is in reasonable agreement with the listed timing, we list the CME as a possible candidate for the conjunction event.
For a two spacecraft conjunction, spacecraft 1 (MESSENGER or Venus Express) represents the first spacecraft to observe the signatures of the CME during its propagation and spacecraft 2 (Venus Express or STEREO or Wind/ACE) represents the second spacecraft to observe signatures of the same CME later on. In the case of a three spacecraft conjunction event, we have a third spacecraft where the same CME which was observed at spacecraft 1 and 2 is also observed.
In our catalog, we have 18 events for which the longitudinal separations between the observing spacecraft are 0-9.9∘, 14 events for which the longitudinal separations are 10-19.9∘, 9 events for which the longitudinal separations are 20-29.9∘, and 6 events for which the longitudinal separations are 30-44.2∘. The average longitudinal separation of our catalog events is 16.2∘. The 6 events for which the longitudinal separations are >30∘, two of them have longitudinal separations >35∘ (37.6∘ and 44.2∘) and they are actually the same CME. The reason for including this event with such a large longitudinal separation is explained in Section 2.4. Table-S1 of the Supporting Information lists our full database of conjunction events. Further details about this database is given later on in the text (see Section 3.1).
2.3 Estimation of Impact Speeds at Mercury and Venus
We calculate the average transit speeds between the Sun and spacecraft 1 (VS-SC1), spacecraft 1 and spacecraft 2 (VSC1-SC2), and the Sun and spacecraft 2 (VS-SC2) using the CME take-off time at the Sun and listed arrival times at spacecraft 1 and 2. For consistency, we use the shock/discontinuity arrival times if available at all spacecraft for the calculation of average transit speeds. We use the magnetic ejecta arrival time if shock arrival time is not available at one of the spacecraft in consideration (e.g. due to the spacecraft being inside the magnetosphere). In 12 out of 47 cases, we observe disagreement (VSC1-SC2 VS-SC1) in the expected average transit speeds. This discrepancy could be due to the CME still accelerating in the low corona. In such cases, we use the CME time at 20 Rs rather than the CME take-off time at the Sun to calculate the average transit speeds. However, using the CME time at 20 Rs only fixed 2 out of the 12 discrepancies. Such trends are not entirely unexpected from slow CMEs, where the CMEs actually go through acceleration far out from the Sun. Checking the CME counterparts for these 12 events, we do indeed observe that most of these discrepancies (10 out of 12) are features of slow CMEs (initial speeds less than 700 km s-1).
We use the DBM for an estimate of impact speeds at Mercury and Venus. The DBM relies on the assumption that the driving Lorentz force, which launches a CME, ceases in the upper corona and after this propagation distance, the sole dominant force governing the CME propagation is the magnetohydrodynamical equivalent of the aerodynamic drag. This model treats CMEs as single expanding bodies, propagating through an isotropic environment to which Newton’s second law is applied. This model provides analytical solutions of the equation of motion where the drag acceleration has a quadratic dependence on the CME relative speed. Under the assumptions of constant drag coefficient and constant solar wind flow, with no CME-CME interaction, this model provides predictions for the arrival of the front boundary of the ejecta and its impact speed. However, the DBM has certain intrinsic drawbacks which can result in significant amount of uncertainties for events in which the CME still considerably accelerates beyond 20 Rs, the ambient solar-wind regime does not remain constant throughout the CME propagation, when there is CME-CME interaction, etc. [Vršnak (\APACyear2001), Vršnak \BOthers. (\APACyear2010), Vršnak \BOthers. (\APACyear2013), Žic \BOthers. (\APACyear2015)]
For a given set of seven input parameters (CME start date, CME start time, starting radial distance of the CME, speed of the CME at the starting radial distance, drag parameter with unit of km-1, asymptotic solar wind speed, and target heliocentric distance), the DBM provides the impact speed for any target in the heliosphere. We use 20 Rs as the starting radial distance (to minimize the effects of Lorentz force) and the 2nd-order speed at 20 Rs (second-order polynomial fit to the height-time measurements evaluated when the CME is at a height of 20 Rs) listed in the CDAW catalog as the CME speed. For the asymptotic solar wind speed, we use the solar wind speed from in situ measurements at STEREO or Wind or ACE before they encounter the CME. For MESSENGER and STEREO or L1 and Venus Express and STEREO or L1 conjunctions, we perform a three-step measurement process to get estimated impact speeds at Mercury and Venus using the DBM. In the first step, we change the only variable (drag parameter) in the DBM to match the CME arrival time at STEREO or L1. Then, we use that same drag parameter to get an estimated impact speed at Mercury or Venus. In the second step, as we have in situ plasma measurements available at STEREO and L1, we change the drag parameter to match the maximum CME speed measured at STEREO or L1. After that, we use that drag parameter to get the second estimated impact speed at Mercury or Venus. The third estimated impact speed at Mercury or Venus is obtained by matching the listed CME arrival time at MESSENGER or Venus Express using the DBM. These three estimated impact speeds are then averaged. It is important to highlight here that with large longitudinal separations, there is a significant probability of different parts of the ejecta/sheath impacting different observing spacecraft at different times, related to the radius of curvature of the CME. This will be specifically discussed for our case study (in Section 4.2 and Section 4.3). Without knowing the true CME shape, it is impossible to fully estimate the errors of these estimates. In Table-S2 of the Supporting Information, we list the three speed estimates obtained from the three constraints (arrival time at SC1, arrival time at SC2, arrival speed at SC2) as well as the input parameters used in the DBM calculation (drag parameter, initial CME speed, solar wind speed). These three estimates give us an estimate of the error of the procedure, listed as the standard deviation between the various speed estimates in Table-S2.
For any conjunction between only MESSENGER and Venus Express, we adopt a slightly modified technique since there are no in situ measurements available at both the spacecraft. In the first step, we try to match the listed CME arrival time at MESSENGER by changing the drag parameter in the DBM. It provides an estimation of the impact speed at Mercury and using the same drag parameter, we get an estimated impact speed at Venus. In the second step, we simply reverse the technique by using the DBM to match the listed CME arrival time at Venus Express.
2.4 Conjunction Events with Three Point Observations
We have two events with three point observations (MESSENGER, Venus Express, and STEREO) in our catalog which are the most promising for studies of CME evolution in the inner heliosphere. The first event appears three times in our catalog: as a MESSENGER-Venus Express conjunction event (1-2011, number tags explained in Section 3.1), a MESSENGER-STEREO A conjunction event (6-2011), and a Venus Express-STEREO A conjunction event (34-2011). The longitudinal separation between Mercury and Venus was 6.6∘, Mercury and STEREO-A was 44.2∘, and Venus and STEREO-A was 37.6∘. The heliocentric distances of MESSENGER, Venus Express, and STEREO-A were 0.32 AU, 0.72 AU, and 0.96 AU respectively at the CME onset time. Though the longitudinal separation between Mercury-STEREO A and Venus-STEREO A exceeds our predefined criterion, the CME in question is a really fast halo CME with substantial angular extent and non-linear speed at 20 Rs approaching 2281 km s-1 (listed in the CDAW catalog). Therefore, we approximate this CME to be observerd at the three spacecraft in consideration.
The second event also appears three times in our catalog: as a MESSENGER-Venus Express conjunction event (3-2011), a MESSENGER-STEREO B conjunction event (8-2011) and a Venus Express-STEREO B conjunction event (35-2011). The longitudinal separation between Mercury and Venus was 23.1∘, Mercury and STEREO-B was -4.8∘, and Venus and STEREO-B was -27.2∘. The heliocentric distances of MESSENGER, Venus Express, and STEREO-B were 0.44 AU, 0.73 AU, and 1.09 AU respectively at the CME onset time. Analysis of the second conjunction event is presented in Section 4. Previouly, radial evolution of this event has been extensively studied by \citeAGood:2015, Good:2018.
3 Catalog of Conjunction Events with Multi-Spacecraft Observations
3.1 Database and List of Parameters
In Table-S1 of the Supporting Information, we list our full database. We first list the onset date and time of the probable CME candidate. If the CME was observed by LASCO, we report the average CME onset time as calculated in the CDAW catalog (average between first-order-constant speed and second-order-constant acceleration onset times). Otherwise, we report the time of the first STEREO/COR image containing the CME. We then list the arrival times of the shock/discontinuity, magnetic ejecta leading edge and trailing edge at spacecraft 1 and 2. Arrival times at MESSENGER are listed from \citeAWinslow:2015, Venus Express from \citeAGood:2016, STEREO from \citeAJian:2018, and L1 from \citeARichardson:2010. We place a number tag on each conjunction event (e.g. 1-2011, 2-2011 etc.,) to recall it if necessary.
We also list the heliocentric distances of the spacecraft at the CME onset time, longitudinal separation between the spacecraft when the discontinuity/ejecta arrives at spacecraft 1, and the maximum magnetic field strength observed in the CME (including both the sheath and the ejecta) at each spacecraft in Table-S1. The heliocentric distances and longitudinal separations [in HGI coordinates] are listed from HelioWeb (https://cohoweb.gsfc.nasa.gov/coho/helios/heli.html). In Table-S1, we also list the initial speed of the CME. For the speed, we select the coronagraph which observed the CME closest to a limb event. When LASCO observed the CME as a limb event, we report the second-order CME speed at 20 Rs listed in the CDAW catalog. For STEREO observations, we report the maximum speed as listed in the CACTus catalog.
In Table-S2 of the Supporting Information, we provide detailed information regarding our three-step DBM procedure. We list the drag parameters associated with each of the three estimates (two estimates for a MESSENGER-Venus Express conjunction), the averaged impact speeds at Mercury and Venus, standard deviation of these estimates, solar wind speed and the maximum CME speed (when spacecraft 2 is STEREO/Wind/ACE) from in situ measurements near Earth. We also list the average transit speeds between the Sun and spacecraft 1 (VS-SC1), spacecraft 1 and spacecraft 2 (VSC1-SC2), and the Sun and spacecraft 2 (VS-SC2).
In most of the cases, we are able to find one CME candidate in coronagraphic observations which fits the temporal and directional requirements of a specific conjunction event. If there is more than one potential CME candidate, we aim to isolate one candidate based on the estimated arrival time at the corresponding spacecraft using the DBM. We understand that there is some uncertainty in determining the CME counterpart based on arrival time agreements. As a result, if there are more than one CME candidate for a single conjunction event and all of them appear to be suitable matches, we list them all (conjunction events with number tags 31-2011, 35-2011, 37-2011, 40-2012). For the 31-2011 event, we highlight two potential CME counterparts on 9 April 2011 with LASCO onset times of 15:48 UT and 18:00 UT. We believe the consequent CME signatures observed at Venus Express and STEREO-A are either due to an interaction between these two CMEs or the first one is the more suitable candidate. There are, however, two events in our CME catalog that do not have a well-defined CME counterpart. The first one is event: 30-2011 for which we did not identify a corresponding CME at the Sun (due to LASCO data gap). We have three events bearing number tags 28-2010 for which we are not confident in their CME counterparts. These events correspond to three CME measurements at Venus Express within a day (1 August 2010 - 2 August 2010). The longitudinal separations between Venus Express and STEREO-B was 16.5∘ on 1 August 2010 and 17.3∘ on 2 August 2010 in HGI coordinates. However, in the expected arrival interval at STEREO-B, only two CMEs were measured (both of these CMEs did not drive shocks and had no sheath regions). Therefore, we have two potential conjunction events. We list the CMEs observed at 3:39 UT and 8:24 UT on 1 August 2010 as the suitable CME counterparts. However, without the availavility of plasma measurements at Venus Express, we were not able to link in a unique manner the Venus Express and STEREO-B events with a particular CME counterpart at the Sun.
3.2 Speed Profile
The basic characteristics of CME propagation is: CMEs that are faster than the ambient solar wind are decelerated, whereas those slower than the solar wind are accelerated by the ambient flow [Gopalswamy \BOthers. (\APACyear2000), Lindsay \BOthers. (\APACyear1999)]. Figure 1, Figure 2, and Figure 3 show the propagation speed profiles of the CMEs from the Sun to spacecraft 2. The initial speed mentioned here is either the second-order CME speed at 20 Rs listed in the CDAW catalog or the maximum speed listed in the CACTus catalog. For MESSENGER-STEREO/L1 conjunction events, we have the initial CME speed, average estimated impact speed at Mercury from the DBM, and the maximum CME speed measured at STEREO/Wind/ACE. For Venus Express-STEREO/L1 conjunction events, we have the initial CME speed, average estimated impact speed at Venus using the DBM, and the maximum CME speed measured at STEREO/Wind/ACE. For MESSENGER-Venus Express conjunction events, we have the initial CME speed and average estimated impact speeds at Mercury and Venus from the DBM. For coronagraphic observations, we use the speed obtained from the best observing spacecraft, for which the CME is close to a limb event. Limb views significantly minimize projection effects as compared to halo views and provide a better estimate of CME speeds. While we chose the best-observing spacecraft to minimize any projection effects, using speeds obtained from catalogs come with large error bars. Typical uncertainty range for these catalogs have been reported to be of the order of 150-200 km s-1, both for individual events and for the difference between the two catalogs themselves [<]see¿[]Michalek:2017,Robbrecht:2009. Error associated with each DBM estimate is listed in Table-S2 of the Supporting Information. We also cannot rule out the possibility of different parts of the ejecta being sampled at different observing spacecraft due to a large longitudinal extent. To further highlight the importance of longitudinal separations, in the propagation speed profiles, we bin the CMEs based on the longitudinal separations between the spacecraft observing the conjunction event to qualitatively represent potential scenarios concerning higher uncertainties due to large longitudinal separations between two observation points. The four shaded regions in Figure 1, Figure 2, and Figure 3 represent the following domains (from left to right): i) region closer to the Sun extending out to 20 Rs, ii) region of MESSENGER measurements (0.31-0.44 AU), iii) region of Venus Express measurements (0.72-0.73 AU), iv) region of in situ measeurements near 1 AU with STEREO and Wind/ACE (0.96-1.09 AU). Each line connecting the three individual CME speeds at different heliocentric domains represents the propagation profile of the same CME in the inner heliosphere after its eruption and are color-coded depending on the longitudinal separation between the two measuring in situ spacecraft. The CMEs are separated into three categories based on their initial speeds as measured by coronagraphs: fast (initial speeds greater than 900 km s-1, see Figure 1), slow (initial speeds less than 700 km s-1, see Figure 3) and intermediate (initial speeds between 700-900 km s-1, see Figure 2).
For fast CMEs, we observe on average a 45% decrease in speeds through their propagation from the Sun to spacecraft 2 (Venus Express or STEREO or Wind/ACE). Most of the variation (30%) occurs in the innermost heliosphere, within Mercury’s orbit, while the rest (15%) occurs past 0.44 AU. For intermediate-speed CMEs, this average decrease in speeds drops to 24% through their propagation from the Sun to spacecraft 2. Similar to fast CMEs, most of this variation takes place within Mercury’s orbit (14%). Slower CMEs tend to undergo the least amount of variation in speeds during their propagation in the inner heliosphere as the average decrease in speeds for them is only 5%. For fast CMEs, the speed decreases by a factor of 3.8 per AU during their propagation from the Sun to spacecraft 2 while this factor is 3.1 per AU and 2.8 per AU for intermediate and slow CMEs respectively. We find that for CMEs with initial speeds >700 km s-1, there is still significant deceleration past Mercury’s orbit.
We also examine the radial evolution of the average transit speed of CMEs. We use the heliocentric distances of the two observation points and the time interval for the transit of the shock/discontinuity (or ejecta if shock/discontinuity arrival time is not available at one of the spacecraft observing the conjunction) to determine the average transit speed. The average transit speeds are then assigned to the average heliocentric distances (mid-points between the two observation points used to determine the average transit speeds). Using a multilinear robust regression fitting technique in logarithmic space, the best fit power law curve to the average transit speed with average heliocentric distance (in Figure 4) is given by: = where is the average transit speed (in unit of km s-1) and is the average heliocentric distance (in unit of AU). The uncertainties represent the 95% confidence interval associated with the fits. The large uncertainty associated with the radial dependency maybe a direct consequence of sampling of average transit speeds concerning different portions of the CME. From MESSENGER and ACE observations, using the same fitting technique, \citeAWinslow:2015 found a much faster fall-off of the maximum shock speed with heliocentric distance: = , although their results were not for CMEs measured in conjunction but obtained statistically for all CMEs measured at Mercury and ACE during 2011-2014. In addition, they used the transit speeds between the Sun and Mercury as the estimated speed at Mercury rather than the speed at the mid-point, as done here.
Analyzing the plot, it is evident that events with the highest differences between the initial CME speeds and solar wind speeds measured near 1 AU have a steeper fall-off of average transit speed with distance compared to the rest. Our observations also suggest that deceleration does not become negligible past Mercury’s orbit, though the rate of deceleration becomes considerably smaller.
3.3 CME Deceleration/Acceleration
For testing real-time space weather prediction models [<]e.g.,¿[and others]Siscoe:2006, it is important to have the exact arrival times of a CME at multiple locations in the inner heliosphere. However, the deceleration/acceleration process is one of the key challenges in predicting the timing of CME arrival at Earth. With scarcity of plasma measurements at sub-1 AU heliocentric distances, it has not yet been possible to construct an average CME deceleration/acceleration profile. That encouraged us to use the estimated impact speeds at Mercury and Venus from the DBM in an attempt to present an average deceleration/acceleration profile of CMEs in the inner heliosphere. CMEs with propagation speeds above that of the ambient solar wind tend to decelerate, while slow ones with propagation speeds below the solar wind speed, get accelerated up to the solar wind speed. This general trend is clearly visible by comparing the fast and slow CMEs in Figure 1 and Figure 3 respectively, although there is significant event-to-event variability. Previous studies have indicated the deceleration to stop at different heliocentric distances: within Mercury’s orbit [Y\BPBID. Liu \BOthers. (\APACyear2013)] or at 0.76 AU [Gopalswamy \BOthers. (\APACyear2001)] or anywhere between 0.3 AU and 1 AU [Reiner \BOthers. (\APACyear2007), Winslow \BOthers. (\APACyear2015)].
Figure 5 shows the distribution of average CME deceleration/acceleration (calculated as ) against the average heliocentric distance between the two points where we have speed observations/measurements/estimations, with the relative difference between the initial CME speed and the solar wind speed measured near 1AU for that specific conjunction event as a second variable. We use the initial CME speed, average estimated impact speed at Mercury and Venus from the DBM, and the maximum CME speed measured at STEREO/Wind/ACE to determine the average deceleration/acceleration of CMEs. The scatter plot highlights that the rate of deceleration/acceleration is predominantly driven by the relative speed difference between the CME and the solar wind, resembling assumptions from previous studies [<]e.g.¿[]Gopalswamy:2000,Vrsnak:2004,Yashiro:2004 that beyond 20 Rs, CME dynamics is solely governed by the drag force, hence depends on the quantity (VCME - VSW)2 [<]e.g.,¿[]Cargill:2004. Figure 5 uses the average heliocentric distance as the mid-point between the two points used to calculate the deceleration/acceleration. For example, a heliocentric distance of 0.27 AU in Figure 5 represents the average CME deceleration/acceleration between the first point of CME observation (at the Sun: 0.09 AU) and the second point of in situ measurement (at MESSENGER: 0.44 AU). We observe the CMEs to undergo the maximum amount of deceleration in their propagation from the Sun to MESSENGER with an average (median) deceleration of 10.9 (2.5) m s-2. With increasing heliocentric distance, this deceleration decreases but does not become negligible, until beyond Venus’s orbit, with an average (median) deceleration of 7.4 (1.5) m s-2 from MESSENGER to Venus Express, and 0.2 (0.1) m s-2 from Venus Express to STEREO/L1. This provides additional evidence for the argument that CME deceleration continues past the orbit of Mercury [<]e.g.,¿[]Winslow:2015, at least to Venus’s orbit. In the case of some slow CMEs [with initial (measured CME speeds near 1 AU) CME speeds of 177 (340), 282 (375), 313 (350), 318 (460), and 643 (780) km s-1], however, we do observe an actual increase in speeds during their propagation from the Sun to near 1 AU. A similar trend was observed for only one intermediate CME [with initial (measured CME speed near 1 AU) CME speed of 716 (720) km s-1] and the relative speed difference between the Sun and near 1 AU was negligible and well within the uncertainty of the various measurements.
3.4 Magnetic Field Intensity
We list the mean and the standard deviation of the maximum magnetic field intensity within each of the substructures (sheath and ejecta) measured at MESSENGER, Venus Express, and STEREO/Wind/ACE in Table 1. As expected, the values of the magnetic field intensities decrease from MESSENGER to near 1 AU. We also list the ratios between the maximum magnetic field intensity measured in the sheath to that of the ejecta in Table 1. We find this ratios to remain relatively constant even with increasing heliocentric distance: 1.04 at MESSENGER, 1.04 at Venus Express, and 1.18 at STEREO/Wind/ACE, consistent with the statistical findings obtained for non-conjunction events in \citeAJanvier:2019. It is important to note here that these ratios should only be considered rough estimates, as CME distortion and the possibility of the observing spacecraft traversing through different structures within the CME were not considered in the analysis. However, interpreting multi-spacecraft observations of the same CME can be really difficult, as seen from the analysis of six possible multi-spacecraft observations by STEREO-A, Wind, and STEREO-B, listed by \citeAKilpua:2011. For the CME in the interval of 21-22 May 2007, both STEREO-A and STEREO-B observed this CME at a longitudinal separation of 9∘. Even for this small amount of separation, clear differences were reported in the magnetic field structures from the STEREO observations. At STEREO-B, the flux rope strucutre was clearly evident, while at STEREO-A, the CME strucutre was more complex. The maximum magnetic field measured at the spacecraft differed by a factor of 2 (9.9 nT at STEREO-A and 17.6 at STEREO-B). They presumed that the magnetic cloud was crossed through the center by STEREO-B while STEREO-A encountered the flank. However, for the 19 November 2007 CME, even for a large longitudinal separation of 40.8∘, the maximum magnetic field measured at the spacecraft were more comparable (12.3 nT at STEREO-A and 17.2 nT at STEREO-B). \citeAFarrugia:2011 conducted a comprehensive analysis of this event and found almost similar fitted magnetic field strength at STEREO-B and Wind (21.9 nT at STEREO-B and 23.2 nT at Wind). \citeALugaz:2018 analyzed 35 CMEs with Wind and ACE observations and highlighted that differences in the total magnetic field strength from one observing spacecraft to another at 1 AU varies slowly with increasing non-radial separation compared to the magnetic field components. They indicated that even with non-radial separation of 4-7∘ between the measuring spacecraft, almost zero correlation can be expected in the observed magnetic field components, where as in the case of the total magnetic field strength, this separation range is clearly higher (14-20∘).
| Bmax | MESSENGER | Venus Express | Near 1 AU |
|---|---|---|---|
| Sheath (in nT) | 9963 | 2811 | 188 |
| Sheath:Fast CMEs (in nT) | 11884 | 3612 | 248 |
| Sheath:Slow CMEs (in nT) | 6926 | 205 | 145 |
| ME (in nT) | 9547 | 2818 | 167 |
| ME:Fast CMEs (in nT) | 10964 | 4723 | 2010 |
| ME:Slow CMEs (in nT) | 7524 | 207 | 134 |
| Bmax,sheath/Bmax,ejecta | 1.040.27 | 1.040.41 | 1.180.45 |
We plot the maximum magnetic field strength measured in the sheath and the ejecta (Figure 6) as a function of heliocentric distance using MESSENGER, Venus Express, STEREO, and Wind/ACE measurements. We use a multilinear robust regression fitting technique in logarithmic space to fit a power law curve to our data set. Robust regression uses iteratively reweighted least squares with a bisquare weighting function to ensure that less weight is attributed to outliers than in ordinary least squares fitting. The best fit power law to the maximum magnetic field strength data is: Bmax,sheath= , Bmax,ejecta= where Bmax,sheath and Bmax,ejecta are the maximum magnetic field strength in nT measured in the sheath and the ejecta respectively and r is in unit of AU. The uncertainties represent the 95% confidence interval associated with the fits.
The maximum magnetic field strength in the sheath falls off as [see \citeADumbovic:2018 for a discussion of logarithmic decrease of magnetic field and increase in size of CMEs and their relation] where is -1.70.21. In the case of the ejecta, the maximum magnetic field strength falls off as where is -1.910.25, which is in reasonable agreement with previous theoretical considerations [Démoulin \BBA Dasso (\APACyear2009)] and empirical fits [Farrugia \BOthers. (\APACyear2005), Leitner \BOthers. (\APACyear2007), C. Wang \BOthers. (\APACyear2005), Winslow \BOthers. (\APACyear2015)].
We can also calculate this drop-off not only in a statistical way using all data, as done above, but using the fact that we have conjunction between two spacecraft for each event. Rather than fitting Bmax vs rH, we calculate the exponential decrease of Bmax,sheath and Bmax,ejecta between the two spacecraft for each conjunction event. Using this, we find an average (median) for the sheath to be -1.55 (-1.60). The 25th-75th percentile range is between -1.85 and -1.29. In the case of the ejecta, average (median) is -1.75 (-1.65) and 50% of the values lie in the range between -2.29 and -1.35. Here, we find that the average behavior (obtained as the fit to the data) is not the same as the typical individual behavior. This highlights the fact that there might not be one unique behavior for all CMEs, which is masked by performing fits. It also shows that there can be CME-to-CME variability much larger than the typical reported error bar on these fits as the 95% confidence interval for the exponential decrease of the maximum magnetic field strength in the ejecta according to our fit is -2.16 to -1.66. Such large spread in radial dependencies can be a direct consequence of the longitudinal separations between the measuring spacecraft. If longitudinal separation is indeed the primary influencing factor, we expect larger deviations from the regression line for events with higher separations. In Figure 6, we make an attempt to qualitatively represent this correlation between longitudinal separation and event-to-event variability. For small longitudinal separations (less than 10∘), we observe the scaling of the maximum magnetic field strength in the sheath to more or less follow the power law fit equation (see top panel of Figure 6). However, in the case of the maximum magnetic field strength in the ejecta, the trend is not straightforward. For even smaller longitudinal separations (less than 6∘), we find the scaling of the maximum magnetic field strength in the ejecta of a higher number of events to show significant deviation from the regression line (see bottom panel of Figure 6).
This finding prompted us to further explore the possible correlation between longitudinal separations and deviations from the regression line. We make an attempt to quantify it in a statistical manner. Using the maximum magnetic field strength measured in the ejecta at spacecraft 1, we use the scaling constant derived from our robust regression fitting (= -1.91) to find the expected maximum magnetic field strength in the ejecta at spacecraft 2 using the following equation: Bmax2,expected= Bmax1,measured , here R is the ratio of positioning of spacecraft 2 (in AU) to positioning of spacecraft 1 (also in AU). Then, we determine the difference between this expected value and the actual measured maximum magnetic field strength in the ejecta at spacecraft 2 and call it B. We normalize the values of B to the measured maximum magnetic field strength in the ejecta at spacecraft 2. We fit the normalized values against longitudinal separations (LS) between the measuring spacecraft, using a linear least squares fitting technique in Figure 7. The fit results confirms the randomness of the maximum magnetic field strength in the ejecta (seen in bottom panel of Figure 6) and finds almost zero correlation with longitudinal separations.
Next, we attempt to find if the maximum magnetic field strength inside the CME depends on other parameters in addition to the radial distance. However, our Bmax,ejecta values are measured at different heliocentric distances, not just at 1 AU. Therefore, we use one representative measurement for each conjunction event which is the closest to 1AU and multiply with rα to scale it to 1 AU. Now, all but 5 of our magnetic field measurements are in the range of 0.96-1.09 AU, which we scale back to 1AU. The other 5 measurements are in the range of 0.72-0.73 AU. In this way the uncertainty associated with the scaling parameter (, found from the multilinear robust regression) shall have the least effect on the analysis. Based on past work [Démoulin \BBA Dasso (\APACyear2009)], we expect this quantity Bmax,ejecta rα to be a constant of CME propagation. We examine the dependence of this quantity on the initial CME speed in Figure 8. We perform a linear least squares fitting of Bmax,ejecta r1.91 against the initial CME speed. The correlation is very weak and the best fit linear regression line has a minimal slope which implies that this quantity is fairly independent of the initial CME speed. The slope is 3 times less (0.0063 compared to 0.0189) than that found by \citeAMoestl:2014 using measurements only at 1 AU and the average propagation speed from HI observations, as well as the correlation found here is much weaker. Part of the reason for this discrepancy could be that we use the initial (not propagation) speed or because we use scaled magnetic field measurements at various heliocentric distances.
3.5 Sheath Duration
We use the CME shock/discontinuity and the ejecta arrival times to estimate the sheath duration at MESSENGER, Venus Express, STEREO, and Wind/ACE. We use a linear least squares fitting of the sheath duration (in hours) against heliocentric distance (in AU) and find the relationship between them to be Tsheath= 15.28 rH - 3.67 (Figure 9). R2 of the linear regression line is 0.60 which represents a decent correlation between the parameters. The large positive slope indicates a linear increase in sheath duration with increasing heliocentric distance. This confirms commonly held knowledge that the CME sheath increases with heliocentric distance. We do not have enough data to test whether this increase is anything but linear. It is important to note that the large intercept of -3.67 of the fit implies that the formation of the sheath starts around 0.24 AU. However, we find the sheath duration on average to be fairly independent of the initial CME speed throughout the inner heliosphere. At Mercury, we find on average the sheath duration of fast CMEs to be 1.74 hours and slow CMEs to be 2.22 hours. At Venus, the average sheath duration for fast and slow CMEs increase by a factor of 4 and 3 respectively compared to Mercury with an avearge sheath duration of 7.30 and 6.57 hours for fast and slow CMEs respectively. Near 1 AU, the average sheath duration for fast and slow CMEs are 13.74 hours and 10.98 hours respectively. This finding runs contrary to commonly held expectation that slower CMEs have larger sheaths than fast CMEs, though our sample size for the analysis is small. This belief is mostly based on comparison with magnetosheaths. However, as explained by \citeASiscoe:2008, CME sheaths differ in many respects from magnetosheaths. It should also be noted that if sheath thickness is considered rather than sheath duration, according to this finding, fast CMEs have even thicker sheaths. It is an interesting revelation contradicting the results of \citeARussell:2002,Savani:2011b where stand-off distance of the shock (the separation distance from the obstacle boundary to the shock) decreases with Mach number (ratio of the speed of the shock in the solar wind frame to the fast-magnetosonic speed) meaning slower CMEs, rather than fast ones should have thicker sheaths. Important thing to note that we do not take into consideration (for lack of measurements) the CME shape, radius of curvature, and the distance to the CME nose for this analysis. This finding does not take advantage of the conjunction (same analysis could be done even if these events were not in conjunction). For pairs of measurements done in conjunction, we observe the sheath duration to increase by a factor of 14.90, 6, and 13.90 per AU for fast, intermediate, and slow CMEs respectively. However, for the fast and slow CMEs especially, these averages are clearly driven by some irregular values arising from the effect of longitudinal separation between the observing spacecraft.
4 Case Study of the 3 Nov 2011 Event
4.1 CME Propagation
Good:2015,Good:2018 studied this same CME event to examine the change in the expansion speed, self-similarity nature and flux rope fit. However, our primary focus is on the relation between the expansion speed and change of Bmax as well as the development of the sheath. We also present it as an example to highlight the processes we conducted to build the conjunction catalog.
The CME counterpart first appeared in the LASCO C2 field of view as a halo on 3 November 2011 at 23:48 UT. This CME emerged from the Sun’s western limb at 22:54 UT on 3 November when viewed from STEREO-A and from the Sun’s eastern limb at 23:10 UT on 3 November when viewed from STEREO-B (Figure 10). The listed non-linear speed at 20 Rs for the CME in the CDAW catalog is 946 km s-1.
We expect the non-linear speeds listed in the CDAW catalog to produce comparable estimated arrival times to observed arrival times at different heliocentric distances. Even under the assumption of minimum drag (drag parameter of ), the DBM estimated arrival time of this CME at MESSENGER was not in reasonable agreement with the listed arrival time at MESSENGER by \citeAWinslow:2015. We attribute this discrepancy in timing to the listed non-linear speed at 20 Rs being an estimate from coronagraph observations. As a result, we use two known constraints: listed CME onset time at 20 Rs in the CDAW catalog and the listed shock arrival time at MESSENGER under the assumption of minimum drag to estimate the speed of the CME at 20 Rs. Under these conditions, the DBM requires the CME speed at 20 Rs to be at least 1140 km s-1. With this minimum speed of 1140 km s-1 at 20 Rs, we also estimate the arrival time of the CME at Venus Express under the assumption of minimum drag. We find the DBM estimated arrival time at Venus Express to be in perfect agreement with the time listed by \citeAGood:2016 which verifies our assumption about the listed non-linear speed at 20 Rs for this CME in the CDAW catalog to be not entirely accurate. This process also eliminates a second coronagraphic CME candidate (LASCO onset time of 01:25 UT on 4 November 2011 with 716 km s-1 as the listed non-linear speed at 20 Rs) as it is considerably slower than the chosen event. However, the observed complex in situ signatures of the magnetic field at Venus Express prompted us to query about possible interaction between these two CME candidates. Interaction of the two candidate CMEs as they propagate is unlikely, especially at MESSENGER and STEREO-B, in light of the clear magnetic ejecta signatures, quite different from the possible in situ manifestations of CME-CME interactions [<]see¿[]Lugaz:2017b. The coronal speed of the two CMEs also make their interaction highly unlikely.
Figure 11 shows the positioning of the inner heliosphere planets and spacecraft and WSA-ENLIL model with cone extension [Odstrčil \BOthers. (\APACyear2003), Odstrčil \BOthers. (\APACyear2004)] simulated propagation of the CME at three different time steps of interest: at Mercury, Venus, and STEREO-B. The simulations are illustrations of the CME arrival at the points of interest and are not meant for precise timing of arrival. These simulations are taken from SWRC CATALOG of Space Weather Database Of Notifications, Knowledge, Information (DONKI). Initial CME speed of 1100 km s-1 and half angular width of 65∘ was used for this simulation.
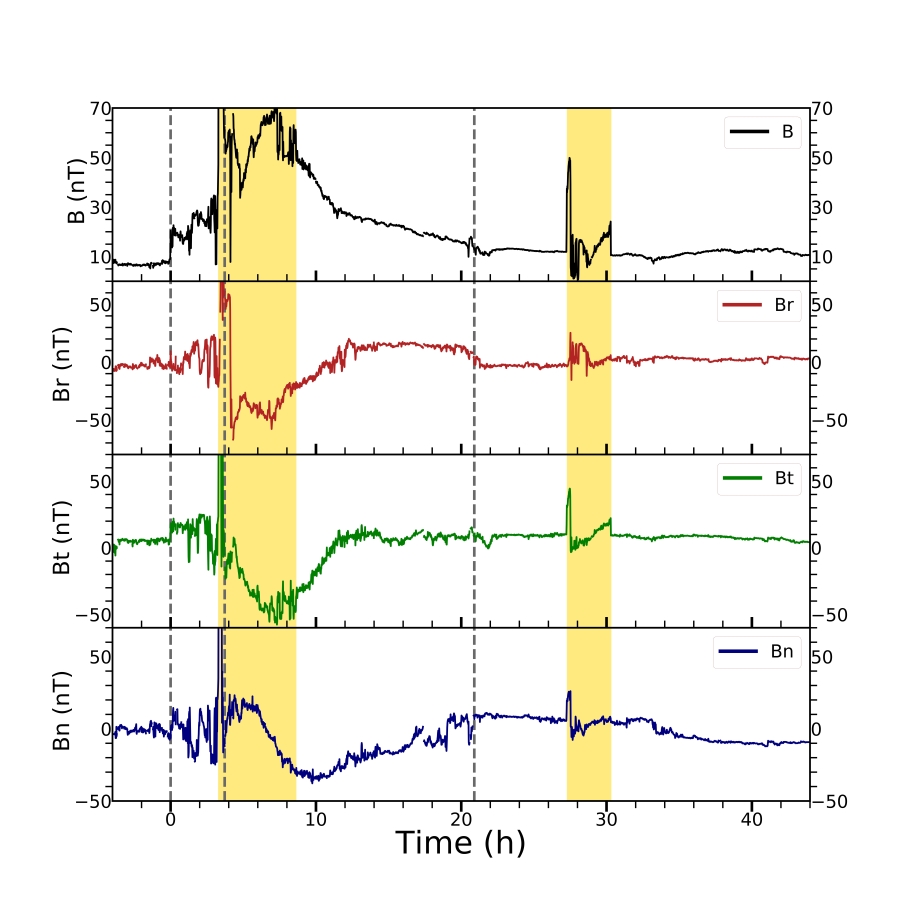
Due to the close longitudinal alignment of the inner solar system planets at the time, about 15 hours after the CME eruption, the shock arrived at MESSENGER on 4 November at 15:09 UT (observed in the magnetic field data) with estimated impact speed of 834 km s-1 (from the DBM). The heliocentric distance of MESSENGER was 0.44 AU. The signatures of the magnetic flux rope are observed at MESSENGER from 00:21 UT to 15:21 UT on 5 November with the arrival of the leading edge, 9.2 hours after the shock arrival. Using 1 s high-resolution data from the MAG on-board the MESSENGER spacecraft, the magnetic field profile of the sheath and the ejecta are presented in Figure 12. In the plot, t=0 h corresponds to the shock arrival. Intervals when MESSENGER traversed the magnetosphere of Mercury are excluded. The start time and end time of the ejecta at MESSENGER were estimated to lie at the start period of the Bn rotation (t=9.2 h) to the period after which the magnetic field returns to its pristine condition (t=24.2 h). Our choice of the ejecta boundaries is consistent with \citeAWinslow:2015 except the start time of the ejecta, which is significantly different. They define the start of the ejecta at t=2.23 h and end of the ejecta at t=24.5 h. The reason behind adjusting the ejecta boundaries is that \citeAWinslow:2015 defined the boundaries using only magnetic field measurements. In our case, we have the knowledge that this same event is also observed at STEREO-B where we have plasma measurements. So, we use both magnetic field and plasma measurements at STEREO-B to determine the CME sheath and then back-tracked to MESSENGER.
The shock signature was observed in the MAG on-board the Venus Express spacecraft on 5 November 3:42 UT with estimated impact speed of 768 km s-1 (from the DBM). The heliocentric distance of Venus Express was 0.73 AU. We define the ejecta boundaries in the same manner as MESSENGER. The magnetic flux rope is approximated to start at 07:25 UT on 5 November and end at 00:36 UT on 6 November. Figure 13 shows the magnetic field measurements in the sheath and the ejecta at Venus Express. In the plot, t=0 h corresponds to the shock arrival. Intervals of induced magnetic field when Venus Express was inside the magnetosphere of Venus are shaded. Our choice of the start of the ejecta is consistent with \citeAGood:2016. They approximate the ejecta to start anywhere between 3.23 and 7.37 hours after the shock arrival while we define the ejecta boundary to start at t=3.72 h. However, we define the end of the ejecta to be at t=20.9 h where they list the ejecta to end at t=12.12 h.
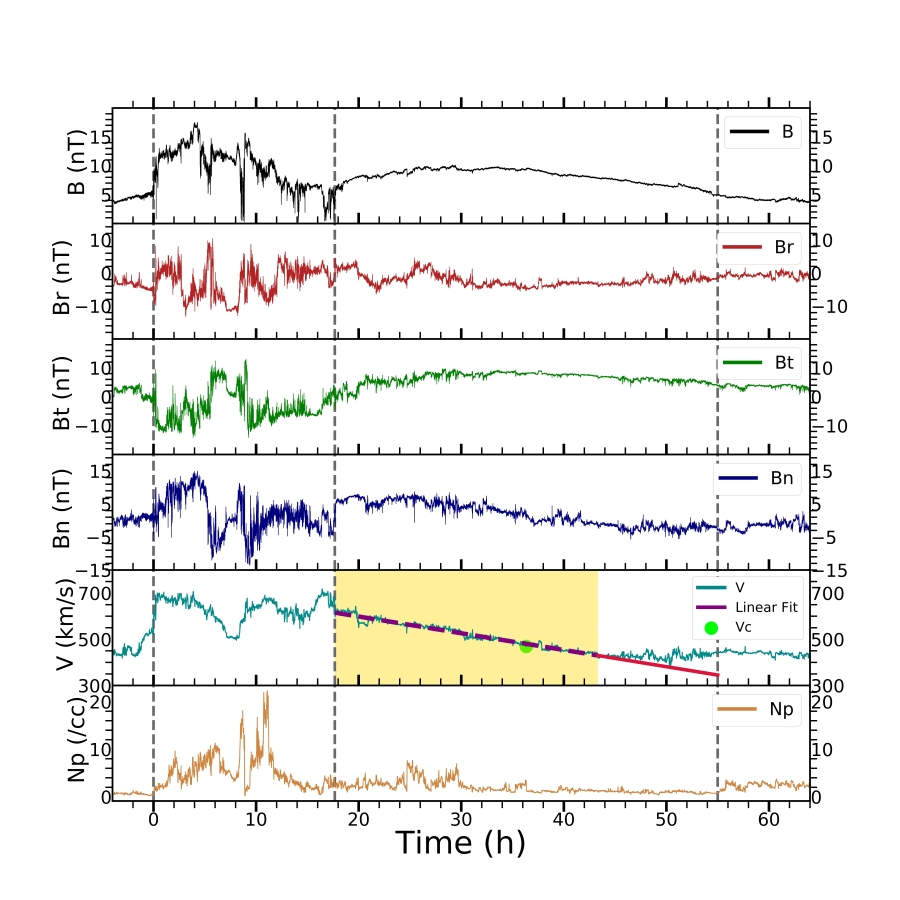
A weak shock-like discontinuity was observed at 5:11 UT on 6 November at STEREO-B (in the plasma and magnetic field data). The heliocentric distance of STEREO-B was 1.09 AU. At 22:50 UT on 6 November, 47 hours after the arrival of the flux rope at MESSENGER, the same rope arrived at STEREO-B. The spacecraft encountered the cloud for a period of 37 hours with the trailing edge arriving on 8 November at 12:11 UT. The leading edge of the flux rope had a speed of 617 km s-1 while the trailing edge had a speed of 446 km s-1. The considerable difference between the speeds of the leading edge and the trailing edge represents an expanding magnetic cloud. Using magnetic field data from the IMPACT instrument and plasma data from the PLASTIC instrument on-board STEREO-B, the sheath and the ejecta measurements are presented in Figure 14. In the plot, t=0 h corresponds to the discontinuity arrival. The boundaries of the ejecta at STEREO-B were estimated in a similar way to MESSENGER but in this case we also had in situ plasma data. We define the flux rope to start at t=17.67 h and end at t=55h. Our leading edge boundary is consistent with \citeAJian:2018. However, our trailing edge approximation is 16 h ahead of them.
4.2 Sheath and Ejecta
In Table 2, we present the total magnetic field intensities measured at the three spacecraft. The ratio of the measured maximum magnetic field strength in the sheath to the measured maximum magnetic field strength in the ejecta at MESSENGER, Venus Express, and STEREO-B is found to be 1.86, 0.66, and 1.80 respectively. Except at Venus Express, this ratio stayed almost constant, which is consistent with our findings (see Table 1). At Mercury, the duration of the sheath is 9 h with MESSENGER observing the ejecta for a period of 15 h. Venus Express spent 4 h in the sheath and 17 h in the ejecta. The same sheath is observed by STEREO-B for a 18 h period with the ejecta lasting 37 h. Looking at the WSA-ENLIL model with cone extension simulated propagation of the CME (see Figure 11), it is evident that both MESSENGER and STEREO-B observed the flank of the ejecta while Venus Express observed its nose. We believe this to be the reason for a much shorter sheath period than expected at Venus Express and a more magnetized ejecta than the sheath.
| Spacecraft | Avg Bsh (nT) | Avg Bej (nT) | Bm,sh (nT) | Bm,ej (nT) |
|---|---|---|---|---|
| MESSENGER | 40 | 35 | 80 | 43 |
| Venus Express | 22 | 25 | 35 | 53 |
| STEREO-B | 10 | 8 | 18 | 10 |
4.3 Expansion Speed and Expansion of the Magnetic Ejecta
We want to take advantage of the conjunction to compare the expansion speed and profile measured at 1 AU and the change in the magnetic field strength during propagation. We determine the full expansion speed of the ejecta at STEREO-B through a linear least squares fit of the solar wind speed in the time interval where a near linear trend is present (yellow shaded region in the fifth panel of Figure 14), like \citeAGulisano:2010. Then we use the linear fit to define the speeds at the ejecta boundaries. The expansion speed [, LE=leading edge, TE=trailing edge] of the ejecta at STEREO-B is 135 km s-1.
Without linear fitting, the expansion speed [] is 86 km s-1 for a central speed of 469 km s-1, an average speed of 493 km s-1, a front speed of 617 km s-1 and a back speed of 446 km s-1. This expansion speed is nearly identical to that obtained by using the relation between leading edge and expansion speed [Vexp (km s-1)= 0.266VLE (km s-1) - 70.6 (km s-1), \citeAOwens:2005] which is 94 km s-1. Typical expansion speeds at 1 AU are 40-60 km s-1 [Richardson \BBA Cane (\APACyear2010)] and this CME is found to be expanding fast based on this metrics.
We also estimate the non-dimensional expansion rate [Gulisano \BOthers. (\APACyear2010)] of the ejecta at STEREO-B (1.09 AU). is defined as:
Here is the slope of the best linear-fit, D is the distance to the Sun, and Vc is the plasma speed measured at the center of the flux rope (see fifth panel of Figure 14). We measure Vc to be 469 km s-1. We find to be 1.5 which represents a very fast expanding CME as for non-perturbed MCs, typical 0.8 [Gulisano \BOthers. (\APACyear2010)] with the typical spread being 0.19 [Démoulin (\APACyear2010)]. We examine the variation of this expansion parameter, as \citeADemoulin:2009 showed this parameter to stay relatively constant with distance. According to them, the magnetic field in the ejecta fall off as [<]see also¿[]Dumbovic:2018 where -2. Thus for this conjunction event with the value of being 1.5, we expect the magnetic field in the ejecta to fall off as . The maximum magnetic field strength in the ejecta at 0.44 AU (Mercury) is 43 nT, it is 53 nT at 0.73 AU (Venus) and 10 nT at 1.09 AU (STEREO-B). The exponent decrease of the magnetic field is therefore = 0.41 between Mercury and Venus, = -4.16 between Venus and STEREO-B and = -1.61 between Mercury and STEREO-B. We do not consider the values for Venus as it encountered the nose of the ejecta whereas Mercury and STEREO-B encountered the flank. The value of between Mercury and STEREO-B is smaller than the median found in section 3.4. This shows that the decrease of B is slower than typical inside this CME. We are left with an unexpected result: the CME is found to expand quickly at 1 AU, but the decrease of the magnetic field is consistent with a weaker-than-average expansion. This might be due to the fact that the CME flank is encountered at MESSENGER and STEREO-B.
5 Discussion and Conclusions
In general, the evolution of CME properties in the inner heliosphere are inferred from statistical approaches concerning different CME events measured at different heliocentric distances, because multi-point analysis of CME events are mostly limited to case studies. However, statistical laws are only true on average. Therefore, statistical results have the tendency to mask the heterogeneous nature of CME events, which can be captured through tracking and analyzing individual CME events with multi-point measurements. On the other hand, studies of individual events do not reveal global trends. As a result, statistical studies of CME events that have multi-point measurements, are needed. This is what we perform here.
This paper presents a comprehensive list of 47 CME events observed in longitudinal conjunction in the inner heliosphere. Previously compiled databases of CME events observed at MESSENGER, Venus Express, STEREO, and L1 are used in association to build our conjunction database. Each conjunction event is identified based on strict directional and temporal criteria. Coronal CME counterparts to the conjunction events, the shock/discontinuity and ejecta arrival times, maximum magnetic field strength within the sheath and the ejecta, average estimated impact speeds at Mercury and Venus from the DBM, the drag parameters and standard deviations associated with various speed estimates and the measured maximum CME speed at different spacecraft as well as the average transit speeds are listed in Table-S1 and Table-S2 of the Supporting Information. We examined the variation of CME properties (propagation speed, deceleration/acceleration, magnetic field intensity, and sheath duration) with heliocentric distance, using both a statistical approach and individual analysis. We note that our statistical approach differs from previously carried out approaches because we group pairs of measurements made in conjunction rather than sampling scattered data points with no relation.
With temporal and speed constraints, we estimated the impact speeds at Mercury and Venus using the DBM. For 94% (44 out of 47) of the conjunction events in our catalog, we have plasma measurements near 1 AU. It enabled us to use the upstream solar wind speed measured near 1 AU as an input parameter of the DBM for better precision. As expected, we observed the fast CMEs to experience significantly higher speed variations on average from their propagation from the Sun to spacecraft 2 (Venus Express, STEREO, Wind/ACE) compared to slow CMEs (45% for fast CMEs to 5% for slow CMEs). Investigating where the major portion of this variation takes place in the innermost heliosphere, we found that 58-67% of it happens sunward of Mercury’s orbit. We also performed an analysis of the radial evolution of average transit speeds using a multilinear robust regression fitting technique (see Figure 4). Our fit results represented a slower fall-off of the average transit speed with heliocentric distance, compared to \citeAWinslow:2015. It was also evident from the plot that events with the highest differences between the initial CME speeds and solar wind speeds (measured near 1 AU) had a steeper fall-off of average transit speeds compared to the rest.
We also determined the average deceleration/acceleration of CMEs between pairs of observation points in space (see Figure 5). Similar to the speed profiles, we observed the average deceleration/acceleration that the CMEs undergo during their propagation from the Sun to Mercury to be 47% higher than the average between Mercury and Venus. After Venus, both the variation in propagation speeds and therefore average CME deceleration/acceleration becomes negligible. These findings lend further confirmation to past studies [<]e.g.¿[]Gopalswamy:2001b,Reiner:2007,Winslow:2015 which suggest that variation in CME propagation speeds do occur at heliocentric distances greater than Mercury’s orbit, at least to Venus’s orbit.
We examined the variation of magnetic field intensity with increasing heliocentric distance. We observed on average the maximum magnetic field strength in the ejecta to decrease by a factor of 3.4 from MESSENGER to Venus Express and 2 from Venus Express to near 1 AU. However, the ratio of the maximum magnetic field intensity measured in the sheath to that of the ejecta remained relatively constant throughout, which is consistent with \citeAJanvier:2019. We employed a multilinear robust regression fitting to investigate the dependence of the maximum magnetic field intensity measured in the sheath and the ejecta on heliocentric distance (see Figure 6). It is important to note that our findings (scaling of the peak magnetic field strength in the ejecta with heliocentric distance) are in good agreement with previous statistical studies. Using a multilinear robust regression fitting technique, we found the following best fit power law equation for the decrease of the peak magnetic field strength in the ejecta with heliocentric distance: Bmax,ejecta= . Applying the same fitting technique for MESSENGER and STEREO measurements, \citeAWinslow:2015 reported this power law equation to be: Bmax,ejecta= . From Helios observations between 0.3-1 AU, \citeAFarrugia:2005 showed that the central axial field strength of MCs varies as . \citeALeitner:2007 performed the freely expanding Lundquist flux rope fitting [Farrugia \BOthers. (\APACyear1992), Farrugia \BOthers. (\APACyear1995)] of the magnetic field for 7 MC events observed in conjunction between two or more spacecraft and found a faster decrease (Bmax,ejecta). In a study published after the initial submission of this manuscript, \citeAGood:2019 performed a static Lundquist flux rope fitting [L\BPBIF. Burlaga (\APACyear1988), Lepping \BOthers. (\APACyear1990)] for 18 interplanetary flux ropes observed in conjunction between radially aligned spacecraft in the inner heliosphere. Among these, Lundquist fits for 13 events (<1.5 and fit uncertainty, <10∘) reproduced the observations well. They fitted the 26 ensemble values of the axial magnetic field strength (Bo, found from the flux rope fitting) against r, using an unweighted least squares linear fit to the logarithmic values of the parameters. They found the following power law equation corresponding to the radial dependence of the axial magnetic field strength: Bo= .
Again, all of these results are derived from purely statistical approaches. Taking advantage of successive observations of the same events, we found on average this decrease of the peak magnetic field strength in the ejecta to occur at a slower rate (Bmax,ejecta), similar to the value reported by \citeAFarrugia:2005 for their nonaveraged values. The discrepancies between different statistical results can be attributed to the different fitting techniques employed. Individual analysis of pairs of measurements demonstrated this exponent decrease of the maximum magnetic field intensity in the ejecta to differ from our multilinear fit in a significant manner. This highlighted the fact that CME-to-CME variability is not well represented by fits and that many CMEs (37 out of 45 CMEs in our catalog) have a rate of decrease outside of the 95% confidence interval based on our statistical approach. We highlighted this variability for both substructures in Figure 6. For events with small longitudinal separations (<10∘), the drop-off of the peak magnetic field strength in the sheath with heliocentric distance generally follows the power law fit equation. However, in the case for the scaling of the peak magnetic field strength in the ejecta, a higher number of events showed considerable deviations from the regression trend even for much smaller longitudinal separations (<6∘).
A similar trend for the axial magnetic field strength was observed by \citeAGood:2019. From their individual analysis of 13 well fitted events, the average fit parameters for the power law equation, Bo= displayed large standard deviations. They attributed these considerable uncertainties being a reflection of the large spread in radial dependencies of the axial magnetic field strength displayed by individual events. Here, we find that a large event-to-event variability can still be found even if we are analyzing 3.5 times more events.
We investigated the typical duration of the sheath at different heliocentric distances, from the orbit of Mercury (0.31-0.44 AU), to that of Venus (0.72-0.73 AU) and near 1 AU. We found the sheath duration to increase with solar distance due to CME expansion. We observed the sheath duration on average to increase by a factor of 3 from MESSENGER (average sheath duration is 2.30 hours) to Venus Express (average sheath duration is 7.07 hours) and 2 from Venus Express to near 1 AU (average sheath duration is 11.76 hours). The sheath duration showed decent correlation with heliocentric distance when fit by a linear function (see Figure 9). From this fit, we approximated the formation of the sheath to start around 0.24 AU. However, we observed the sheath duration to be fairly independent of the initial CME speed throughout the inner heliosphere with comparable sheath durations for fast and slow CMEs at Mercury, Venus, and near 1 AU. This finding provides more argument to the assumption that CME sheaths are significantly different from magnetosheaths, as suggested by \citeASiscoe:2008.
We provide an example of our procedure using three spacecraft measurements for a well-studied event, also studied in \citeAGood:2015,Good:2018. The sheath expanded slowly from MESSENGER to STEREO-B compared to our findings. We also observed a much shorter sheath period at Venus than expected which can be due to Venus Express measuring the nose of the ejecta rather than the flank as in the case of MESSENGER and STEREO-B. The ratio of the maximum magnetic field strength measured in the sheath to that of the ejecta remained constant except at Venus Express, again which can be attributed to a front on encounter with the ejecta. We compared the expansion of the ejecta based on the speed profile measured at 1 AU and from the decrease of the maximum magnetic field strength in the ejecta between pairs of spacecraft. Based on the metrics of typical expansion speed [Richardson \BBA Cane (\APACyear2010)] and expansion parameter [Gulisano \BOthers. (\APACyear2010)] at 1 AU, we found the ejecta to be expanding quickly. However, the exponent decrease of the maximum magnetic field strength from MESSENGER to STEREO-B revealed a much weaker expansion. This unexpected mismatch again confirms the argument that individual CME behavior can significantly differ from an average comparison.
This study provides valuable insights on the evolution of CMEs in the inner heliosphere. Though statistical approaches of CME profiles are of importance, individual case studies from this catalog can capture the significant variability observed in the evolution and magnetic topology from event to event. With the catalog comprising of events observed in longitudinal separations ranging from 2 to 44∘, analysis of such wide range of events can provide important information regarding radial evolution and longitudinal variations in CME signatures. This catalog provides a continuous profile of CME events in terms of observations from the CME eruption at the Sun to being measured at two distinct points in space. As a result, this catalog can serve as a model validation for the prediction of CME arrival. In the coming years, missions such as Parker Solar Probe and Solar Orbiter will present more opportunities to complete the catalog of in situ detected CMEs even closer to the Sun, but it will certainly take several years to obtain more than 40 CMEs measured at multiple spacecraft as presented here. Until then, we hope this new catalog of CMEs observed in conjunction between inner heliosphere spacecraft will prove valuable to the community.
Acknowledgements.
\justifyThe authors acknowledge the use of MESSENGER data available at Planetary Data System (https://pds.nasa.gov/), Venus Express data available at European Space Agency’s Planetary Science Archive (https://www.cosmos.esa.int/web/psa/venus-express) and NASA/GSFC’s Space Physics Data Facility’s CDAWeb service for STEREO, Wind, and ACE data available at CDAWeb (https:cdaweb.gsfc.nasa.gov/index.html/). The authors acknowledge Christian Möstl and Miho Janvier for providing Venus Express data and helping in the coordinate transformation. We also thank the two anonymous reviewers for their contribution in improving the manuscript. Associated datasets for this research are available at http://doi.org/10.5281/zenodo.3592426. T. M. S. was supported by NASA grant 80NSSC17K0556 and NSF grant AGS1435785. N. L. acknowledges support from NASA grants NNX15AB87G and 80NSSC17K0556 and NSF grant AGS1435785. R. M. W. acknowledges support from NSF grant AGS1622352, and NASA grants NNX15AW31G and 80NSSC19K0914.References
- Anderson \BOthers. (\APACyear2007) \APACinsertmetastarAnderson:2007{APACrefauthors}Anderson, B\BPBIJ., Acuňa, M\BPBIH., Lohr, D\BPBIA., Scheifele, J., Raval, A., Korth, H.\BCBL \BBA Slavin, J\BPBIA. \APACrefYearMonthDay2007. \BBOQ\APACrefatitleThe Magnetometer Instrument on MESSENGER The Magnetometer Instrument on MESSENGER.\BBCQ \APACjournalVolNumPagesSpace Science Reviews131417-450. \PrintBackRefs\CurrentBib
- Baker \BOthers. (\APACyear2008) \APACinsertmetastarBaker:2008{APACrefauthors}Baker, D\BPBIN., Balstad, R., Bodeau, J\BPBIM., Cameron, E., Fennell, J\BPBIF., Fisher, G\BPBIM.\BDBLGruber, C\BPBIA. \APACrefYearMonthDay2008. \BBOQ\APACrefatitleSevere Space Weather Events- Understanding Societal and Economic Impacts: A Workshop Report Severe Space Weather Events- Understanding Societal and Economic Impacts: A Workshop Report.\BBCQ \APACjournalVolNumPagesThe National Academies Press, Washington DC. \PrintBackRefs\CurrentBib
- Benkhoff \BOthers. (\APACyear2010) \APACinsertmetastarBenkhoff:2010{APACrefauthors}Benkhoff, J., Casteren, J\BPBIv., Hayakawa, H.\BCBL \BBA Fujimoto, M. \APACrefYearMonthDay2010. \BBOQ\APACrefatitleBepiColombo-Comprehensive exploration of Mercury: Mission overview and science goals BepiColombo-Comprehensive exploration of Mercury: Mission overview and science goals.\BBCQ \APACjournalVolNumPagesPlanetary and Space Science582-20. {APACrefDOI} 10.1016/j.pss.2009.09.020 \PrintBackRefs\CurrentBib
- Bothmer \BBA Schwenn (\APACyear1998) \APACinsertmetastarBothmer:1998{APACrefauthors}Bothmer, V.\BCBT \BBA Schwenn, R. \APACrefYearMonthDay1998. \BBOQ\APACrefatitleThe structure and origin of magnetic clouds in the solar wind The structure and origin of magnetic clouds in the solar wind.\BBCQ \APACjournalVolNumPagesAnnales Geophysicae161-24. {APACrefDOI} 10.1007/s00585-997-0001-x \PrintBackRefs\CurrentBib
- Brueckner \BOthers. (\APACyear1995) \APACinsertmetastarBrueckner:1995{APACrefauthors}Brueckner, G\BPBIE., Howard, R\BPBIA., Koomen, M\BPBIJ., Korendyke, C\BPBIM., Michels, D\BPBIJ., Moses, J\BPBID.\BDBLEyles, C\BPBIJ. \APACrefYearMonthDay1995. \BBOQ\APACrefatitleThe Large Angle Spectroscopic Coronagraph (LASCO) The Large Angle Spectroscopic Coronagraph (LASCO).\BBCQ \APACjournalVolNumPagesSolar Phys.162357-402. {APACrefDOI} 10.1007/BF00733434 \PrintBackRefs\CurrentBib
- L. Burlaga \BOthers. (\APACyear1981) \APACinsertmetastarBurlaga:1981{APACrefauthors}Burlaga, L., Sittler, E., Mariani, F.\BCBL \BBA Schwenn, R. \APACrefYearMonthDay1981. \BBOQ\APACrefatitleMagnetic loop behind an interplanetary shock - Voyager, Helios, and IMP 8 observations Magnetic loop behind an interplanetary shock - Voyager, Helios, and IMP 8 observations.\BBCQ \APACjournalVolNumPagesJ. Geophys. Res.866673-6684. \PrintBackRefs\CurrentBib
- L\BPBIF. Burlaga (\APACyear1988) \APACinsertmetastarBurlaga:1988{APACrefauthors}Burlaga, L\BPBIF. \APACrefYearMonthDay1988\APACmonth07. \BBOQ\APACrefatitleMagnetic clouds and force-free fields with constant alpha Magnetic clouds and force-free fields with constant alpha.\BBCQ \APACjournalVolNumPagesJ. Geophys. Res.937217-7224. {APACrefDOI} 10.1029/JA093iA07p07217 \PrintBackRefs\CurrentBib
- Cane \BOthers. (\APACyear1997) \APACinsertmetastarCane:1997{APACrefauthors}Cane, H\BPBIV., Richardson, I\BPBIG.\BCBL \BBA Wibberenz, G. \APACrefYearMonthDay1997. \BBOQ\APACrefatitleHelios 1 and 2 observations of particle decreases, ejecta, and magnetic clouds Helios 1 and 2 observations of particle decreases, ejecta, and magnetic clouds.\BBCQ \APACjournalVolNumPagesJournal of Geophysical Research: Space Physics1027075-7086. {APACrefDOI} 10.1029/97JA00149 \PrintBackRefs\CurrentBib
- Cargill (\APACyear2004) \APACinsertmetastarCargill:2004{APACrefauthors}Cargill, P\BPBIJ. \APACrefYearMonthDay2004\APACmonth05. \BBOQ\APACrefatitleOn the Aerodynamic Drag Force Acting on Interplanetary Coronal Mass Ejections On the Aerodynamic Drag Force Acting on Interplanetary Coronal Mass Ejections.\BBCQ \APACjournalVolNumPagesSolar Phys.221135-149. {APACrefDOI} 10.1023/B:SOLA.0000033366.10725.a2 \PrintBackRefs\CurrentBib
- Chen (\APACyear2017) \APACinsertmetastarChen:2017{APACrefauthors}Chen, J. \APACrefYearMonthDay2017. \BBOQ\APACrefatitlePhysics of erupting solar flux ropes: Coronal mass ejections- Recent advances in theory and observation Physics of erupting solar flux ropes: Coronal mass ejections- Recent advances in theory and observation.\BBCQ \APACjournalVolNumPagesPhysics of Plasmas24. {APACrefDOI} 10.1068/1.4993929 \PrintBackRefs\CurrentBib
- Cohen \BOthers. (\APACyear2010) \APACinsertmetastarCohen:2010{APACrefauthors}Cohen, O., Attrill, G\BPBID\BPBIR., Schwadron, N\BPBIA., Crooker, N\BPBIU., Owens, M\BPBIJ., Downs, C.\BCBL \BBA Gombosi, T\BPBII. \APACrefYearMonthDay2010\APACmonth10. \BBOQ\APACrefatitleNumerical Simulation of the May 12, 1997 CME Event - the Role of Magnetic Reconnection Numerical Simulation of the May 12, 1997 CME Event - the Role of Magnetic Reconnection.\BBCQ \APACjournalVolNumPagesJournal of Geophysical Research: Space Physics115A10104. {APACrefDOI} 10.1029/2010JA015464 \PrintBackRefs\CurrentBib
- Davis \BOthers. (\APACyear2009) \APACinsertmetastarDavis:2009{APACrefauthors}Davis, C\BPBIJ., Davies, J\BPBIA., Lockwood, M., Rouillard, A\BPBIP., Eyles, C\BPBIJ.\BCBL \BBA Harrison, R\BPBIA. \APACrefYearMonthDay2009. \BBOQ\APACrefatitleStereoscopic imaging of an Earth-impacting solar coronal mass ejection: A major milestone for the STEREO mission Stereoscopic imaging of an Earth-impacting solar coronal mass ejection: A major milestone for the STEREO mission.\BBCQ \APACjournalVolNumPagesGeophys. Res. Lett.36L08102. {APACrefDOI} 10.1029/2009GL038021 \PrintBackRefs\CurrentBib
- Démoulin (\APACyear2010) \APACinsertmetastarDemoulin:2010{APACrefauthors}Démoulin, P. \APACrefYearMonthDay2010. \BBOQ\APACrefatitleInteraction of ICMEs with the Solar Wind Interaction of ICMEs with the Solar Wind.\BBCQ \APACjournalVolNumPagesTWELFTH INTERNATIONAL SOLAR WIND CONFERENCE. AIP Conference Proceedings1216329-334. {APACrefDOI} 10.1063/1.3395866 \PrintBackRefs\CurrentBib
- Démoulin \BBA Dasso (\APACyear2009) \APACinsertmetastarDemoulin:2009{APACrefauthors}Démoulin, P.\BCBT \BBA Dasso, S. \APACrefYearMonthDay2009. \BBOQ\APACrefatitleCauses and consequences of magnetic cloud expansion Causes and consequences of magnetic cloud expansion.\BBCQ \APACjournalVolNumPagesAstron. Astrophys.498551-566. \PrintBackRefs\CurrentBib
- Dumbović \BOthers. (\APACyear2018) \APACinsertmetastarDumbovic:2018{APACrefauthors}Dumbović, M., Heber, B., Vršnak, B., Temmer, M.\BCBL \BBA Kirin, A. \APACrefYearMonthDay2018. \BBOQ\APACrefatitleAn Analytical Diffusion-Expansion Model for Forbush Decreases Caused by Flux Ropes An Analytical Diffusion-Expansion Model for Forbush Decreases Caused by Flux Ropes.\BBCQ \APACjournalVolNumPagesThe Astrophysical Journal86012. {APACrefDOI} 10.3847/1538-4357/aac2de \PrintBackRefs\CurrentBib
- Farrugia \BOthers. (\APACyear2011) \APACinsertmetastarFarrugia:2011{APACrefauthors}Farrugia, C\BPBIJ., Berdichevsky, D\BPBIB., Möstl, C., Galvin, A\BPBIB., Leitner, M., Popecki, M\BPBIA.\BDBLSauvaud, J\BPBIA. \APACrefYearMonthDay2011. \BBOQ\APACrefatitleMultiple, distant (40∘) in situ observations of a magnetic cloud and a corotating interaction region complex Multiple, distant (40∘) in situ observations of a magnetic cloud and a corotating interaction region complex.\BBCQ \APACjournalVolNumPagesJ. Atmos. Solar-Terr. Phys.731254-1269. {APACrefDOI} 10.1016/j.jastp.2010.09.011 \PrintBackRefs\CurrentBib
- Farrugia \BOthers. (\APACyear1997) \APACinsertmetastarFarrugia:1997{APACrefauthors}Farrugia, C\BPBIJ., Burlaga, L\BPBIF.\BCBL \BBA Lepping, R\BPBIP. \APACrefYearMonthDay1997. \BBOQ\APACrefatitleMagnetic Clouds and the quiet/storm effect at Earth: A review, in Magnetic Storms, edited by B. T. Tsurutani, W. D. Gonzalez, Y. Kamide, and J. K. Arballo Magnetic Clouds and the quiet/storm effect at Earth: A review, in Magnetic Storms, edited by B. T. Tsurutani, W. D. Gonzalez, Y. Kamide, and J. K. Arballo.\BBCQ \APACjournalVolNumPagesGeophysical Monogr. Ser.9891. \PrintBackRefs\CurrentBib
- Farrugia \BOthers. (\APACyear1992) \APACinsertmetastarFarrugia:1992{APACrefauthors}Farrugia, C\BPBIJ., Burlaga, L\BPBIF., Osherovich, V\BPBIA.\BCBL \BBA Lepping, R\BPBIP. \APACrefYearMonthDay1992. \BBOQ\APACrefatitleA comparative study of dynamically expanding force-free, constant-alpha magnetic configurations with applications to magnetic clouds A comparative study of dynamically expanding force-free, constant-alpha magnetic configurations with applications to magnetic clouds.\BBCQ \BIn E. Marsch and R. Schwenn (\BED), \APACrefbtitleSolar Wind Seven Colloquium Solar wind seven colloquium (\BPG 611-614). \PrintBackRefs\CurrentBib
- Farrugia \BOthers. (\APACyear2005) \APACinsertmetastarFarrugia:2005{APACrefauthors}Farrugia, C\BPBIJ., Leitner, M., Biernat, H\BPBIK., Schwenn, R., Ogilvie, K\BPBIW., Matsuil, H.\BDBLLepping, R\BPBIP. \APACrefYearMonthDay2005. \BBOQ\APACrefatitleEvolution of interplanetary magnetic clouds from 0.3 AU to 1 AU: A joint Helios-Wind investigation Evolution of interplanetary magnetic clouds from 0.3 AU to 1 AU: A joint Helios-Wind investigation.\BBCQ \APACjournalVolNumPagesProceedings of the Solar Wind 11 / SOHO 16, Connecting Sun and Heliosphere Conference (ESA SP-592), 12–17 June 2005 Whistler, Canada, 723. \PrintBackRefs\CurrentBib
- Farrugia \BOthers. (\APACyear1995) \APACinsertmetastarFarrugia:1995{APACrefauthors}Farrugia, C\BPBIJ., Osherovich, V\BPBIA.\BCBL \BBA Burlaga, L\BPBIF. \APACrefYearMonthDay1995\APACmonth07. \BBOQ\APACrefatitleMagnetic flux rope versus the spheromak as models for interplanetary magnetic clouds Magnetic flux rope versus the spheromak as models for interplanetary magnetic clouds.\BBCQ \APACjournalVolNumPagesJ. Geophys. Res.10012293. {APACrefDOI} 10.1029/95JA00272 \PrintBackRefs\CurrentBib
- Forsyth \BOthers. (\APACyear2006) \APACinsertmetastarForsyth:2006{APACrefauthors}Forsyth, R\BPBIJ., Bothmer, V., Cid, C., Crooker, N\BPBIU., Horbury, T\BPBIS., Kecskemety, K.\BDBLWimmer-Schweingruber, R\BPBIF. \APACrefYearMonthDay2006. \BBOQ\APACrefatitleICMEs in the Inner Heliosphere: Origin, Evolution and Propagation Effects. Report of Working Group G ICMEs in the Inner Heliosphere: Origin, Evolution and Propagation Effects. Report of Working Group G.\BBCQ \APACjournalVolNumPagesSpace Science Reviews123383-416. {APACrefDOI} 10.1007/s11214-006-9022-0 \PrintBackRefs\CurrentBib
- Fox \BOthers. (\APACyear2016) \APACinsertmetastarFox:2016{APACrefauthors}Fox, N\BPBIJ., Velli, M\BPBIC.\BCBL \BBA Bale, S\BPBID. \APACrefYearMonthDay2016. \BBOQ\APACrefatitleThe Solar Probe Plus Mission: Humanity’s First Visit to Our Star The Solar Probe Plus Mission: Humanity’s First Visit to Our Star.\BBCQ \APACjournalVolNumPagesSpace Science Reviews2047-48. {APACrefDOI} 10.1007/s11214-015-0211-6 \PrintBackRefs\CurrentBib
- Galvin \BOthers. (\APACyear2008) \APACinsertmetastarGalvin:2008{APACrefauthors}Galvin, A\BPBIB., Kistler, L\BPBIM., Popecki, M\BPBIA., Farrugia, C\BPBIJ., Simunac, K\BPBID\BPBIC., Ellis, L.\BDBLSteinfeld, D. \APACrefYearMonthDay2008. \BBOQ\APACrefatitleThe Plasma and Suprathermal Ion Composition (PLASTIC) Investigation on the STEREO Observatories The Plasma and Suprathermal Ion Composition (PLASTIC) Investigation on the STEREO Observatories.\BBCQ \APACjournalVolNumPagesSpace Science Reviews136437-486. {APACrefDOI} 10.1007/s11214-007-9296-x \PrintBackRefs\CurrentBib
- Gonzalez \BBA Tsurutani (\APACyear1987) \APACinsertmetastarGonzalez:1987{APACrefauthors}Gonzalez, W\BPBID.\BCBT \BBA Tsurutani, B\BPBIT. \APACrefYearMonthDay1987. \BBOQ\APACrefatitleCriteria of interplanetary parameters causing intense magnetic storms (Dst of less than -100 nT) Criteria of interplanetary parameters causing intense magnetic storms (Dst of less than -100 nT).\BBCQ \APACjournalVolNumPagesPlanetary and Space Science35. {APACrefDOI} 10.1016/0032-0633(87)90015-8 \PrintBackRefs\CurrentBib
- Good \BBA Forsyth (\APACyear2016) \APACinsertmetastarGood:2016{APACrefauthors}Good, S\BPBIW.\BCBT \BBA Forsyth, R\BPBIJ. \APACrefYearMonthDay2016. \BBOQ\APACrefatitleInterplanetary Coronal Mass Ejections Observed by MESSENGER and Venus Express Interplanetary Coronal Mass Ejections Observed by MESSENGER and Venus Express.\BBCQ \APACjournalVolNumPagesSolar Phys.291239–263. {APACrefDOI} 10.1007/s11207-015-0828-3 \PrintBackRefs\CurrentBib
- Good \BOthers. (\APACyear2018) \APACinsertmetastarGood:2018{APACrefauthors}Good, S\BPBIW., Forsyth, R\BPBIJ., Eastwood, J\BPBIP.\BCBL \BBA Möstl, C. \APACrefYearMonthDay2018. \BBOQ\APACrefatitleCorrelation of ICME Magnetic Fields at Radially Aligned Spacecraft Correlation of ICME Magnetic Fields at Radially Aligned Spacecraft.\BBCQ \APACjournalVolNumPagesSolar Phys.29352. {APACrefDOI} 10.1007/s11207-018-1264-y \PrintBackRefs\CurrentBib
- Good \BOthers. (\APACyear2015) \APACinsertmetastarGood:2015{APACrefauthors}Good, S\BPBIW., Forsyth, R\BPBIJ., Raines, J\BPBIM., Gershman, D\BPBIJ., Slavin, J\BPBIA.\BCBL \BBA Zurbuchen, T\BPBIH. \APACrefYearMonthDay2015\APACmonth07. \BBOQ\APACrefatitleRadial Evolution of a Magnetic Cloud: MESSENGER, STEREO, and Venus Express Observations Radial Evolution of a Magnetic Cloud: MESSENGER, STEREO, and Venus Express Observations.\BBCQ \APACjournalVolNumPagesThe Astrophysical Journal807177. {APACrefDOI} 10.1088/0004-637X/807/2/177 \PrintBackRefs\CurrentBib
- Good \BOthers. (\APACyear2019) \APACinsertmetastarGood:2019{APACrefauthors}Good, S\BPBIW., Kilpua, E\BPBIK\BPBIJ., LaMoury, A\BPBIT., Forsyth, R\BPBIJ., Eastwood, J\BPBIP.\BCBL \BBA Möstl, C. \APACrefYearMonthDay2019. \BBOQ\APACrefatitleSelf‐Similarity of ICME Flux Ropes: Observations by Radially Aligned Spacecraft in the Inner Heliosphere Self‐Similarity of ICME Flux Ropes: Observations by Radially Aligned Spacecraft in the Inner Heliosphere.\BBCQ \APACjournalVolNumPagesJournal of Geophysical Research: Space Physics124. {APACrefDOI} 10.1029/2019JA026475 \PrintBackRefs\CurrentBib
- Gopalswamy \BOthers. (\APACyear2010) \APACinsertmetastarGopalswamy:2010a{APACrefauthors}Gopalswamy, N., Akiyama, S., Yashiro, S.\BCBL \BBA Makela, P. \APACrefYearMonthDay2010. \BBOQ\APACrefatitleCoronal Mass Ejections from Sunspot and Non-Sunspot Regions Coronal Mass Ejections from Sunspot and Non-Sunspot Regions.\BBCQ \APACjournalVolNumPagesin Magnetic Coupling between the Interior and the Atmosphere of the Sun, (Eds.) Hasan, S.S., Rutten, R.J., Astrophysics and Space Science Proceedings289-307. \PrintBackRefs\CurrentBib
- Gopalswamy \BOthers. (\APACyear2000) \APACinsertmetastarGopalswamy:2000{APACrefauthors}Gopalswamy, N., Lara, A., Lepping, R\BPBIP., Kaiser, M\BPBIL., Berdichevsky, D.\BCBL \BBA St. Cyr, O\BPBIC. \APACrefYearMonthDay2000. \BBOQ\APACrefatitleInterplanetary Acceleration of Coronal Mass Ejections Interplanetary Acceleration of Coronal Mass Ejections.\BBCQ \APACjournalVolNumPagesGeophys. Res. Lett.27145-148. {APACrefDOI} 10.1029/1999GL003639 \PrintBackRefs\CurrentBib
- Gopalswamy \BOthers. (\APACyear2001) \APACinsertmetastarGopalswamy:2001b{APACrefauthors}Gopalswamy, N., Lara, A., Yashiro, S., Kaiser, M\BPBIL.\BCBL \BBA Howard, R\BPBIA. \APACrefYearMonthDay2001. \BBOQ\APACrefatitlePredicting the 1-AU arrival times of coronal mass ejections Predicting the 1-AU arrival times of coronal mass ejections.\BBCQ \APACjournalVolNumPagesJ. Geophys. Res.10629207-29218. {APACrefDOI} 10.1029/2001JA000177 \PrintBackRefs\CurrentBib
- Gosling \BOthers. (\APACyear1974) \APACinsertmetastarGosling:1974{APACrefauthors}Gosling, J\BPBIT., Hildner, E., MacQueen, R\BPBIM., Munro, R\BPBIH., Poland, A\BPBII.\BCBL \BBA Ross, C\BPBIL. \APACrefYearMonthDay1974. \BBOQ\APACrefatitleMass ejections from the Sun: A view from Skylab Mass ejections from the Sun: A view from Skylab.\BBCQ \APACjournalVolNumPagesJ. Geophys. Res.794581. \PrintBackRefs\CurrentBib
- Gosling \BOthers. (\APACyear1987) \APACinsertmetastarGosling:1987b{APACrefauthors}Gosling, J\BPBIT., Thomsen, M\BPBIF., Bame, S\BPBIJ.\BCBL \BBA Zwickl, R\BPBID. \APACrefYearMonthDay1987. \BBOQ\APACrefatitleThe eastward deflection of fast coronal mass ejecta in interplanetary space The eastward deflection of fast coronal mass ejecta in interplanetary space.\BBCQ \APACjournalVolNumPagesJ. Geophys. Res.9212399-12406. {APACrefDOI} 10.1029/JA092iA11p12399 \PrintBackRefs\CurrentBib
- Green \BOthers. (\APACyear2018) \APACinsertmetastarGreen:2018{APACrefauthors}Green, L\BPBIM., Török, T.\BCBL \BBA Vršnak, B. \APACrefYearMonthDay2018. \BBOQ\APACrefatitleThe Origin, Early Evolution and Predictability of Solar Eruptions The Origin, Early Evolution and Predictability of Solar Eruptions.\BBCQ \APACjournalVolNumPagesSpace Science Reviews21452. {APACrefDOI} 10.1007/s11214-017-0462-5 \PrintBackRefs\CurrentBib
- Gulisano \BOthers. (\APACyear2010) \APACinsertmetastarGulisano:2010{APACrefauthors}Gulisano, A\BPBIM., Démoulin, P., Dasso, S., Ruiz, M\BPBIE.\BCBL \BBA Marsch, E. \APACrefYearMonthDay2010. \BBOQ\APACrefatitleGlobal and local expansion of magnetic clouds in the inner heliosphere Global and local expansion of magnetic clouds in the inner heliosphere.\BBCQ \APACjournalVolNumPagesAstron. Astrophys.509A39. {APACrefDOI} 10.1051/0004-6361/200912375 \PrintBackRefs\CurrentBib
- Harrison \BOthers. (\APACyear2018) \APACinsertmetastarHarrison:2018{APACrefauthors}Harrison, R\BPBIA., Davies, J\BPBIA., Barnes, D., Byrne, J\BPBIP., Perry, C\BPBIH., Bothmer, V.\BDBLOdstrčil, D. \APACrefYearMonthDay2018. \BBOQ\APACrefatitleCMEs in the Heliosphere: I. A statistical analysis of the observational properties of CMEs detected in the heliosphere from 2007 to 2017 by STEREO/HI‐1 CMEs in the Heliosphere: I. A statistical analysis of the observational properties of CMEs detected in the heliosphere from 2007 to 2017 by STEREO/HI‐1.\BBCQ \APACjournalVolNumPagesSolar Phys.29377. {APACrefDOI} 10.1007/s11207-018-1297-2 \PrintBackRefs\CurrentBib
- Harrison \BOthers. (\APACyear2005) \APACinsertmetastarHarrison:2005{APACrefauthors}Harrison, R\BPBIA., Davis, C\BPBIJ.\BCBL \BBA Eyles, C\BPBIJ. \APACrefYearMonthDay2005. \BBOQ\APACrefatitleThe STEREO heliospheric imager: How to detect CMEs in the heliosphere The STEREO heliospheric imager: How to detect CMEs in the heliosphere.\BBCQ \APACjournalVolNumPagesAdvances in Space Research361512-1523. {APACrefDOI} 10.1016/j.asr.2005.01.024 \PrintBackRefs\CurrentBib
- R\BPBIA. Howard \BOthers. (\APACyear2008) \APACinsertmetastarHoward:2008{APACrefauthors}Howard, R\BPBIA., Moses, J\BPBID., Vourlidas, A., Newmark, J\BPBIS., Socker, D\BPBIG., Plunkett, S\BPBIP.\BDBLCarter, T. \APACrefYearMonthDay2008. \BBOQ\APACrefatitleSun Earth Connection Coronal and Heliospheric Investigation (SECCHI) Sun Earth Connection Coronal and Heliospheric Investigation (SECCHI).\BBCQ \APACjournalVolNumPagesSpace Science Reviews13667-115. {APACrefDOI} 10.1007/s11214-008-9341-4 \PrintBackRefs\CurrentBib
- T\BPBIA. Howard \BBA DeForest (\APACyear2012) \APACinsertmetastarHoward:2012{APACrefauthors}Howard, T\BPBIA.\BCBT \BBA DeForest, C\BPBIE. \APACrefYearMonthDay2012. \BBOQ\APACrefatitleInner Heliospheric Flux Rope Evolution via Imaging of Coronal Mass Ejections Inner Heliospheric Flux Rope Evolution via Imaging of Coronal Mass Ejections.\BBCQ \APACjournalVolNumPagesThe Astrophysical Journal74664. {APACrefDOI} 10.1088/0004-637X/746/1/64 \PrintBackRefs\CurrentBib
- Hundhausen (\APACyear1988) \APACinsertmetastarHundhausen:1988{APACrefauthors}Hundhausen, A\BPBIJ. \APACrefYearMonthDay1988. \BBOQ\APACrefatitleThe origin and propagation of coronal mass ejections, in Proceedings of the Sixth International Solar Wind Conference, edited by V. J. Pizzo, T. E. Holzer, and D. G. Sime The origin and propagation of coronal mass ejections, in Proceedings of the Sixth International Solar Wind Conference, edited by V. J. Pizzo, T. E. Holzer, and D. G. Sime.\BBCQ \APACjournalVolNumPagesTech. NoteNCAR/TN-306+Proc181. \PrintBackRefs\CurrentBib
- Huttunen \BOthers. (\APACyear2005) \APACinsertmetastarHuttunen:2005{APACrefauthors}Huttunen, K\BPBIE\BPBIJ., Schwenn, R., Bothmer, V.\BCBL \BBA Koskinen, H\BPBIE\BPBIJ. \APACrefYearMonthDay2005. \BBOQ\APACrefatitleProperties and geoeffectiveness of magnetic clouds in the rising, maximum and early declining phases of solar cycle 23 Properties and geoeffectiveness of magnetic clouds in the rising, maximum and early declining phases of solar cycle 23.\BBCQ \APACjournalVolNumPagesAnnales Geophysicae23625. {APACrefDOI} 10.5194/angeo-23-625-2005 \PrintBackRefs\CurrentBib
- Isavnin \BOthers. (\APACyear2013) \APACinsertmetastarIsavnin:2013{APACrefauthors}Isavnin, A., Vourlidas, A.\BCBL \BBA Kilpua, E\BPBIK\BPBIJ. \APACrefYearMonthDay2013. \BBOQ\APACrefatitleThree-Dimensional Evolution of Erupted Flux Ropes from the Sun (2 - 20 R s) to 1 AU Three-Dimensional Evolution of Erupted Flux Ropes from the Sun (2 - 20 R s) to 1 AU.\BBCQ \APACjournalVolNumPagesSolar Phys.284203-215. {APACrefDOI} 10.1007/s11207-012-0214-3 \PrintBackRefs\CurrentBib
- Isavnin \BOthers. (\APACyear2014) \APACinsertmetastarIsavnin:2014{APACrefauthors}Isavnin, A., Vourlidas, A.\BCBL \BBA Kilpua, E\BPBIK\BPBIJ. \APACrefYearMonthDay2014. \BBOQ\APACrefatitleThree-Dimensional Evolution of Flux-Rope CMEs and Its Relation to the Local Orientation of the Heliospheric Current Sheet Three-Dimensional Evolution of Flux-Rope CMEs and Its Relation to the Local Orientation of the Heliospheric Current Sheet.\BBCQ \APACjournalVolNumPagesSolar Phys.2892141-2156. {APACrefDOI} 10.1007/s11207-013-0468-4 \PrintBackRefs\CurrentBib
- Jakosky \BOthers. (\APACyear2015) \APACinsertmetastarJakosky:2015{APACrefauthors}Jakosky, B\BPBIM., Lin, R\BPBIP.\BCBL \BBA Grebowsky, J\BPBIM. \APACrefYearMonthDay2015. \BBOQ\APACrefatitleThe Mars Atmosphere and Volatile Evolution (MAVEN) Mission The Mars Atmosphere and Volatile Evolution (MAVEN) Mission.\BBCQ \APACjournalVolNumPagesSpace Science Reviews1953-48. {APACrefDOI} 10.1007/s11214-015-0139-x \PrintBackRefs\CurrentBib
- Janvier \BOthers. (\APACyear2019) \APACinsertmetastarJanvier:2019{APACrefauthors}Janvier, M., Winslow, R\BPBIM., Good, S., Bonhomme, E., Démoulin, P.\BCBL \BBA Dasso, S. \APACrefYearMonthDay2019. \BBOQ\APACrefatitleGeneric Magnetic Field Intensity Profiles of Interplanetary Coronal Mass Ejections at Mercury, Venus, and Earth From Superposed Epoch Analyses Generic Magnetic Field Intensity Profiles of Interplanetary Coronal Mass Ejections at Mercury, Venus, and Earth From Superposed Epoch Analyses.\BBCQ \APACjournalVolNumPagesJournal of Geophysical Research: Space Physics124. {APACrefDOI} 10.1029/2018JA025949 \PrintBackRefs\CurrentBib
- Jian \BOthers. (\APACyear2018) \APACinsertmetastarJian:2018{APACrefauthors}Jian, L\BPBIK., Russell, C\BPBIT., Luhmann, J\BPBIG.\BCBL \BBA Galvin, A\BPBIB. \APACrefYearMonthDay2018. \BBOQ\APACrefatitleSTEREO Observations of Interplanetary Coronal Mass Ejections in 2007–2016 STEREO Observations of Interplanetary Coronal Mass Ejections in 2007–2016.\BBCQ \APACjournalVolNumPagesThe Astrophysical Journal885114. {APACrefDOI} 10.3847/1538-4357/aab189 \PrintBackRefs\CurrentBib
- Jin \BOthers. (\APACyear2017) \APACinsertmetastarJin:2017{APACrefauthors}Jin, M., Manchester, W\BPBIB., van der Holst, B., Sokolov, I., Toth, G., Mullinix, R\BPBIE.\BDBLGombosi, T\BPBII. \APACrefYearMonthDay2017. \BBOQ\APACrefatitleData-constrained Coronal Mass Ejections in a Global Magnetohydrodynamics Model Data-constrained Coronal Mass Ejections in a Global Magnetohydrodynamics Model.\BBCQ \APACjournalVolNumPagesThe Astrophysical Journal8349. {APACrefDOI} 10.3847/1538-4357/834/2/173 \PrintBackRefs\CurrentBib
- Kaiser (\APACyear2005) \APACinsertmetastarKaiser:2005{APACrefauthors}Kaiser, M\BPBIL. \APACrefYearMonthDay2005. \BBOQ\APACrefatitleThe STEREO mission: an overview The STEREO mission: an overview.\BBCQ \APACjournalVolNumPagesAdvances in Space Research361483-1488. \PrintBackRefs\CurrentBib
- Kay \BOthers. (\APACyear2017) \APACinsertmetastarKay:2017{APACrefauthors}Kay, C., Gopalswamy, N., Reinard, A.\BCBL \BBA Opher, M. \APACrefYearMonthDay2017. \BBOQ\APACrefatitlePredicting the Magnetic Field of Earth-impacting CMEs Predicting the Magnetic Field of Earth-impacting CMEs.\BBCQ \APACjournalVolNumPagesThe Astrophysical Journal83510. {APACrefDOI} 10.3847/1538-4357/835/2/117 \PrintBackRefs\CurrentBib
- Kay \BOthers. (\APACyear2013) \APACinsertmetastarKay:2013{APACrefauthors}Kay, C., Opher, M.\BCBL \BBA Evans, R\BPBIM. \APACrefYearMonthDay2013. \BBOQ\APACrefatitleForecasting a Coronal Mass Ejection’s Altered Trajectory: ForeCAT Forecasting a Coronal Mass Ejection’s Altered Trajectory: ForeCAT.\BBCQ \APACjournalVolNumPagesThe Astrophysical Journal7755. {APACrefDOI} 10.1088/0004-637X/775/1/5 \PrintBackRefs\CurrentBib
- Kay \BOthers. (\APACyear2015) \APACinsertmetastarKay:2015{APACrefauthors}Kay, C., Opher, M.\BCBL \BBA Evans, R\BPBIM. \APACrefYearMonthDay2015. \BBOQ\APACrefatitleGlobal trends of CME deflections based on CME and solar parameters Global trends of CME deflections based on CME and solar parameters.\BBCQ \APACjournalVolNumPagesThe Astrophysical Journal805168. \PrintBackRefs\CurrentBib
- E. Kilpua \BOthers. (\APACyear2017) \APACinsertmetastarKilpua:2017b{APACrefauthors}Kilpua, E., Koskinen, H\BPBIE\BPBIJ.\BCBL \BBA Pulkkinen, T\BPBII. \APACrefYearMonthDay2017. \BBOQ\APACrefatitleCoronal mass ejections and their sheath regions in interplanetary space Coronal mass ejections and their sheath regions in interplanetary space.\BBCQ \APACjournalVolNumPagesLiving Reviews in Solar Physics14. {APACrefDOI} 10.1007/s41116-017-0009-6 \PrintBackRefs\CurrentBib
- E\BPBIK\BPBIJ. Kilpua \BOthers. (\APACyear2011) \APACinsertmetastarKilpua:2011{APACrefauthors}Kilpua, E\BPBIK\BPBIJ., Jian, L\BPBIK., Li, Y., Luhmann, J\BPBIG.\BCBL \BBA Russell, C\BPBIT. \APACrefYearMonthDay2011. \BBOQ\APACrefatitleMultipoint ICME encounters: Pre-STEREO and STEREO observations Multipoint ICME encounters: Pre-STEREO and STEREO observations.\BBCQ \APACjournalVolNumPagesJ. Atmos. Solar-Terr. Phys.731228-1241. {APACrefDOI} 10.1016/j.jastp.2010.10.012 \PrintBackRefs\CurrentBib
- E\BPBIK\BPBIJ. Kilpua \BOthers. (\APACyear2019) \APACinsertmetastarKilpua:2019{APACrefauthors}Kilpua, E\BPBIK\BPBIJ., Lugaz, N., Mays, M\BPBIL.\BCBL \BBA Temmer, M. \APACrefYearMonthDay2019. \BBOQ\APACrefatitleForecasting the Structure and Orientation of Earthbound Coronal Mass Ejections Forecasting the Structure and Orientation of Earthbound Coronal Mass Ejections.\BBCQ \APACjournalVolNumPagesSpace Weather17498-526. {APACrefDOI} 10.1029/2018SW001944 \PrintBackRefs\CurrentBib
- E\BPBIK\BPBIJ. Kilpua \BOthers. (\APACyear2012) \APACinsertmetastarKilpua:2012{APACrefauthors}Kilpua, E\BPBIK\BPBIJ., Mierla, M.\BCBL \BBA Rodriguez, L. \APACrefYearMonthDay2012. \BBOQ\APACrefatitleEstimating Travel Times of Coronal Mass Ejections to 1 AU Using Multi-spacecraft Coronagraph Data Estimating Travel Times of Coronal Mass Ejections to 1 AU Using Multi-spacecraft Coronagraph Data.\BBCQ \APACjournalVolNumPagesSolar Phys.279477-496. {APACrefDOI} 10.1007/s11207-012-0005-x \PrintBackRefs\CurrentBib
- E\BPBIK\BPBIJ. Kilpua \BOthers. (\APACyear2009) \APACinsertmetastarKilpua:2009{APACrefauthors}Kilpua, E\BPBIK\BPBIJ., Pomoell, J., Vourlidas, A., Vainio, R., Luhmann, J., Li, Y.\BDBLSimunac, K. \APACrefYearMonthDay2009\APACmonth12. \BBOQ\APACrefatitleSTEREO observations of interplanetary coronal mass ejections and prominence deflection during solar minimum period STEREO observations of interplanetary coronal mass ejections and prominence deflection during solar minimum period.\BBCQ \APACjournalVolNumPagesAnnales Geophysicae274491-4503. {APACrefDOI} 10.5194/angeo-27-4491-2009 \PrintBackRefs\CurrentBib
- Kim \BOthers. (\APACyear2007) \APACinsertmetastarKim:2007{APACrefauthors}Kim, K\BHBIH., Moon, Y\BHBIJ.\BCBL \BBA Cho, K\BHBIS. \APACrefYearMonthDay2007. \BBOQ\APACrefatitlePrediction of the 1‐AU arrival times of CME-associated interplanetary shocks: Evaluation of an empirical interplanetary shock propagation model Prediction of the 1‐AU arrival times of CME-associated interplanetary shocks: Evaluation of an empirical interplanetary shock propagation model.\BBCQ \APACjournalVolNumPagesJ. Geophys. Res.112. {APACrefDOI} 10.1029/2006JA011904 \PrintBackRefs\CurrentBib
- Leitner \BOthers. (\APACyear2007) \APACinsertmetastarLeitner:2007{APACrefauthors}Leitner, M., Farrugia, C\BPBIJ., MöStl, C., Ogilvie, K\BPBIW., Galvin, A\BPBIB., Schwenn, R.\BCBL \BBA Biernat, H\BPBIK. \APACrefYearMonthDay2007. \BBOQ\APACrefatitleConsequences of the force-free model of magnetic clouds for their heliospheric evolution Consequences of the force-free model of magnetic clouds for their heliospheric evolution.\BBCQ \APACjournalVolNumPagesJournal of Geophysical Research: Space Physics112A06113. {APACrefDOI} 10.1029/2006JA011940 \PrintBackRefs\CurrentBib
- Lepping \BOthers. (\APACyear1995) \APACinsertmetastarLepping:1995{APACrefauthors}Lepping, R\BPBIP., Acuna, M\BPBIH.\BCBL \BBA Burlaga, L\BPBIF. \APACrefYearMonthDay1995. \BBOQ\APACrefatitleThe WIND magnetic field investigation The WIND magnetic field investigation.\BBCQ \APACjournalVolNumPagesSpace Science Reviews71207-229. {APACrefDOI} 10.1007/BF00751330 \PrintBackRefs\CurrentBib
- Lepping \BOthers. (\APACyear1990) \APACinsertmetastarLepping:1990{APACrefauthors}Lepping, R\BPBIP., Burlaga, L\BPBIF.\BCBL \BBA Jones, J\BPBIA. \APACrefYearMonthDay1990\APACmonth08. \BBOQ\APACrefatitleMagnetic field structure of interplanetary magnetic clouds at 1 AU Magnetic field structure of interplanetary magnetic clouds at 1 AU.\BBCQ \APACjournalVolNumPagesJ. Geophys. Res.9511957-11965. \PrintBackRefs\CurrentBib
- Lindsay \BOthers. (\APACyear1999) \APACinsertmetastarLindsay:1999{APACrefauthors}Lindsay, G\BPBIM., Luhmann, J\BPBIG., Russell, C\BPBIT.\BCBL \BBA Gosling, J\BPBIT. \APACrefYearMonthDay1999. \BBOQ\APACrefatitleRelationships between coronal mass ejection speeds from coronagraph images and interplanetary characteristics of associated interplanetary coronal mass ejections Relationships between coronal mass ejection speeds from coronagraph images and interplanetary characteristics of associated interplanetary coronal mass ejections.\BBCQ \APACjournalVolNumPagesJ. Geophys. Res.10412515-12524. {APACrefDOI} 10.1029/1999JA900051 \PrintBackRefs\CurrentBib
- Y. Liu \BOthers. (\APACyear2005) \APACinsertmetastarLiu:2005{APACrefauthors}Liu, Y., Richardson, J\BPBID.\BCBL \BBA Belcher, J\BPBIW. \APACrefYearMonthDay2005. \BBOQ\APACrefatitleA statistical study of the properties of interplanetary coronal mass ejections from 0.3 to 5.4 AU A statistical study of the properties of interplanetary coronal mass ejections from 0.3 to 5.4 AU.\BBCQ \APACjournalVolNumPagesPlanetary and Space Science533-17. {APACrefDOI} 10.1016/j.pss.2004.09.023 \PrintBackRefs\CurrentBib
- Y. Liu \BOthers. (\APACyear2010) \APACinsertmetastarLiu:2010{APACrefauthors}Liu, Y., Thernisien, A., Luhmann, J\BPBIG., Vourlidas, A., Davies, J\BPBIA., Lin, R\BPBIP.\BCBL \BBA Bale, S\BPBID. \APACrefYearMonthDay2010. \BBOQ\APACrefatitleReconstructing Coronal Mass Ejections with Coordinated Imaging and in Situ Observations: Global Structure, Kinematics, and Implications for Space Weather Forecasting Reconstructing Coronal Mass Ejections with Coordinated Imaging and in Situ Observations: Global Structure, Kinematics, and Implications for Space Weather Forecasting.\BBCQ \APACjournalVolNumPagesThe Astrophysical Journal7221762-1777. {APACrefDOI} 10.1088/0004-637X/722/2/1762 \PrintBackRefs\CurrentBib
- Y\BPBID. Liu \BOthers. (\APACyear2013) \APACinsertmetastarLiu:2013{APACrefauthors}Liu, Y\BPBID., Luhmann, J\BPBIG., Lugaz, N., Möstl, C., Davies, J\BPBIA., Bale, S\BPBID.\BCBL \BBA Lin, R\BPBIP. \APACrefYearMonthDay2013. \BBOQ\APACrefatitleOn Sun-to-Earth Propagation of Coronal Mass Ejections On Sun-to-Earth Propagation of Coronal Mass Ejections.\BBCQ \APACjournalVolNumPagesThe Astrophysical Journal76945. {APACrefDOI} 10.1088/0004-637X/769/1/45 \PrintBackRefs\CurrentBib
- Low (\APACyear1996) \APACinsertmetastarLow:1996{APACrefauthors}Low, B\BPBIC. \APACrefYearMonthDay1996. \BBOQ\APACrefatitleSolar Activity and the Corona Solar Activity and the Corona.\BBCQ \APACjournalVolNumPagesSolar Phys.167217-265. \PrintBackRefs\CurrentBib
- Lugaz \BOthers. (\APACyear2011) \APACinsertmetastarLugaz:2011c{APACrefauthors}Lugaz, N., Downs, C., Shibata, K., Roussev, I\BPBII., Asai, A.\BCBL \BBA Gombosi, T\BPBII. \APACrefYearMonthDay2011\APACmonth09. \BBOQ\APACrefatitleNumerical Investigation of a Coronal Mass Ejection from an Anemone Active Region: Reconnection and Deflection of the 2005 August 22 Eruption Numerical Investigation of a Coronal Mass Ejection from an Anemone Active Region: Reconnection and Deflection of the 2005 August 22 Eruption.\BBCQ \APACjournalVolNumPagesThe Astrophysical Journal738127. {APACrefDOI} 10.1088/0004-637X/738/2/127 \PrintBackRefs\CurrentBib
- Lugaz \BOthers. (\APACyear2015) \APACinsertmetastarLugaz:2015a{APACrefauthors}Lugaz, N., Farrugia, C\BPBIJ., Smith, C\BPBIW.\BCBL \BBA Paulson, K. \APACrefYearMonthDay2015. \BBOQ\APACrefatitleShocks inside CMEs: A survey of properties from 1997 to 2006 Shocks inside CMEs: A survey of properties from 1997 to 2006.\BBCQ \APACjournalVolNumPagesJ. Geophys. Res.1202409-2427. {APACrefDOI} 10.1002/2014JA020848 \PrintBackRefs\CurrentBib
- Lugaz \BOthers. (\APACyear2018) \APACinsertmetastarLugaz:2018{APACrefauthors}Lugaz, N., Farrugia, C\BPBIJ., Winslow, R\BPBIM., Al-Haddad, N., Galvin, A\BPBIB., Nieves-Chinchilla, T.\BDBLJanvier, M. \APACrefYearMonthDay2018. \BBOQ\APACrefatitleOn the Spatial Coherence of Magnetic Ejecta: Measurements of Coronal Mass Ejections by Multiple Spacecraft Longitudinally Separated by 0.01 au On the Spatial Coherence of Magnetic Ejecta: Measurements of Coronal Mass Ejections by Multiple Spacecraft Longitudinally Separated by 0.01 au.\BBCQ \APACjournalVolNumPagesThe Astrophys. Journ. Lett.8646. {APACrefDOI} 10.3847/2041-8213/aad9f4 \PrintBackRefs\CurrentBib
- Lugaz \BOthers. (\APACyear2007) \APACinsertmetastarLugaz:2007{APACrefauthors}Lugaz, N., Manchester, W\BPBIB., Roussev, I\BPBII., Tóth, G.\BCBL \BBA Gombosi, T\BPBII. \APACrefYearMonthDay2007. \BBOQ\APACrefatitleNumerical Investigation of the Homologous Coronal Mass Ejection Events From Active Region 9236 Numerical Investigation of the Homologous Coronal Mass Ejection Events From Active Region 9236.\BBCQ \APACjournalVolNumPagesThe Astrophysical Journal659788-800. {APACrefDOI} 10.1086/512005 \PrintBackRefs\CurrentBib
- Lugaz \BBA Roussev (\APACyear2011) \APACinsertmetastarLugaz:2011a{APACrefauthors}Lugaz, N.\BCBT \BBA Roussev, I\BPBII. \APACrefYearMonthDay2011. \BBOQ\APACrefatitleNumerical modeling of interplanetary coronal mass ejections and comparison with heliospheric images Numerical modeling of interplanetary coronal mass ejections and comparison with heliospheric images.\BBCQ \APACjournalVolNumPagesJ. Atmos. Solar-Terr. Phys.731187-1200. {APACrefDOI} 10.1016/j.jastp.2010.08.016 \PrintBackRefs\CurrentBib
- Lugaz \BOthers. (\APACyear2017) \APACinsertmetastarLugaz:2017b{APACrefauthors}Lugaz, N., Temmer, M., Wang, Y.\BCBL \BBA Farrugia, C\BPBIJ. \APACrefYearMonthDay2017. \BBOQ\APACrefatitleThe Interaction of Successive Coronal Mass Ejections: A Review The Interaction of Successive Coronal Mass Ejections: A Review.\BBCQ \APACjournalVolNumPagesSolar Phys.29264. {APACrefDOI} 10.1007/s11207-017-1091-6 \PrintBackRefs\CurrentBib
- Luhmann \BOthers. (\APACyear2008) \APACinsertmetastarLuhmann:2008{APACrefauthors}Luhmann, J\BPBIG., Curtis, D\BPBIW., Schroeder, P., McCauley, J., Lin, R\BPBIP., Larson, D\BPBIE.\BDBLGosling, J\BPBIT. \APACrefYearMonthDay2008. \BBOQ\APACrefatitleSTEREO IMPACT Investigation Goals, Measurements, and Data Products Overview STEREO IMPACT Investigation Goals, Measurements, and Data Products Overview.\BBCQ \APACjournalVolNumPagesSpace Science Reviews136117-184. {APACrefDOI} 10.1007/s11214-007-9170-x \PrintBackRefs\CurrentBib
- Manchester \BOthers. (\APACyear2017) \APACinsertmetastarManchester:2017{APACrefauthors}Manchester, W., Kilpua, E\BPBIK\BPBIJ., Liu, Y\BPBID., Lugaz, N., Riley, P., Török, T.\BCBL \BBA Vršnak, B. \APACrefYearMonthDay2017. \BBOQ\APACrefatitleThe Physical Processes of CME/ICME Evolution The Physical Processes of CME/ICME Evolution.\BBCQ \APACjournalVolNumPagesSpace Science Reviews2121159-1219. {APACrefDOI} 10.1007/s11214-017-0394-0 \PrintBackRefs\CurrentBib
- Michalek \BOthers. (\APACyear2017) \APACinsertmetastarMichalek:2017{APACrefauthors}Michalek, G., Gopalswamy, N.\BCBL \BBA Yashiro, S. \APACrefYearMonthDay2017. \BBOQ\APACrefatitleCME Velocity and Acceleration Error Estimates Using the Bootstrap Method CME Velocity and Acceleration Error Estimates Using the Bootstrap Method.\BBCQ \APACjournalVolNumPagesSolar Phys.292. {APACrefDOI} 10.1007/s11207-017-1143-y \PrintBackRefs\CurrentBib
- Möstl (\APACyear2015) \APACinsertmetastarMoestl:2015{APACrefauthors}Möstl, C. \APACrefYearMonthDay2015. \BBOQ\APACrefatitleStrong coronal channelling and interplanetary evolution of a solar storm up to Earth and Mars Strong coronal channelling and interplanetary evolution of a solar storm up to Earth and Mars.\BBCQ \APACjournalVolNumPagesNat. Commun.67135. {APACrefDOI} 10.1038/ncomms8135 \PrintBackRefs\CurrentBib
- Möstl \BOthers. (\APACyear2014) \APACinsertmetastarMoestl:2014{APACrefauthors}Möstl, C., Amla, K., Hall, J\BPBIR., Liewer, P\BPBIC., De Jong, E\BPBIM., Colaninno, R\BPBIC.\BDBLGalvin, A\BPBIB. \APACrefYearMonthDay2014. \BBOQ\APACrefatitleConnecting Speeds, Directions and Arrival Times of 22 Coronal Mass Ejections from the Sun to 1 AU Connecting Speeds, Directions and Arrival Times of 22 Coronal Mass Ejections from the Sun to 1 AU.\BBCQ \APACjournalVolNumPagesThe Astrophysical Journal7872119. {APACrefDOI} 10.1088/0004-637X/787/2/119 \PrintBackRefs\CurrentBib
- Möstl, Farrugia, Biernat\BCBL \BOthers. (\APACyear2009) \APACinsertmetastarMoestl:2009b{APACrefauthors}Möstl, C., Farrugia, C\BPBIJ., Biernat, H\BPBIK., Leitner, M., Kilpua, E\BPBIK\BPBIJ., Galvin, A\BPBIB.\BCBL \BBA Luhmann, J\BPBIG. \APACrefYearMonthDay2009. \BBOQ\APACrefatitleOptimized Grad - Shafranov Reconstruction of a Magnetic Cloud Using STEREO- Wind Observations Optimized Grad - Shafranov Reconstruction of a Magnetic Cloud Using STEREO- Wind Observations.\BBCQ \APACjournalVolNumPagesSolar Phys.256427-441. {APACrefDOI} 10.1007/s11207-009-9360-7 \PrintBackRefs\CurrentBib
- Möstl \BOthers. (\APACyear2012) \APACinsertmetastarMoestl:2012{APACrefauthors}Möstl, C., Farrugia, C\BPBIJ., Kilpua, E\BPBIK\BPBIJ., Jian, L\BPBIK., Liu, Y., Eastwood, J\BPBIP.\BDBLAnderson, B\BPBIJ. \APACrefYearMonthDay2012. \BBOQ\APACrefatitleMulti-point Shock and Flux Rope Analysis of Multiple Interplanetary Coronal Mass Ejections around 2010 August 1 in the Inner Heliosphere Multi-point Shock and Flux Rope Analysis of Multiple Interplanetary Coronal Mass Ejections around 2010 August 1 in the Inner Heliosphere.\BBCQ \APACjournalVolNumPagesThe Astrophysical Journal75810. {APACrefDOI} 10.1088/0004-637X/758/1/10 \PrintBackRefs\CurrentBib
- Möstl, Farrugia, Miklenic\BCBL \BOthers. (\APACyear2009) \APACinsertmetastarMoestl:2009c{APACrefauthors}Möstl, C., Farrugia, C\BPBIJ., Miklenic, C., Temmer, M., Galvin, A\BPBIB., Luhmann, J\BPBIG.\BDBLBiernat, H\BPBIK. \APACrefYearMonthDay2009. \BBOQ\APACrefatitleMultispacecraft recovery of a magnetic cloud and its origin from magnetic reconnection on the Sun Multispacecraft recovery of a magnetic cloud and its origin from magnetic reconnection on the Sun.\BBCQ \APACjournalVolNumPagesJ. Geophys. Res.1144102. {APACrefDOI} 10.1029/2008JA013657 \PrintBackRefs\CurrentBib
- Müller \BOthers. (\APACyear2013) \APACinsertmetastarMueller:2013{APACrefauthors}Müller, D., Marsden, R\BPBIG., St. Cyr, O\BPBIC.\BCBL \BBA Gilbert, H\BPBIR. \APACrefYearMonthDay2013. \BBOQ\APACrefatitleSolar Orbiter . Exploring the Sun-Heliosphere Connection Solar Orbiter . Exploring the Sun-Heliosphere Connection.\BBCQ \APACjournalVolNumPagesSolar Phys.28525-70. {APACrefDOI} 10.1007/s11207-012-0085-7 \PrintBackRefs\CurrentBib
- Nieves-Chinchilla \BOthers. (\APACyear2013) \APACinsertmetastarNieves:2013{APACrefauthors}Nieves-Chinchilla, T., Vourlidas, A., Stenborg, G., Savani, N\BPBIP., Koval, A., Szabo, A.\BCBL \BBA Jian, L\BPBIK. \APACrefYearMonthDay2013. \BBOQ\APACrefatitleInner Heliospheric Evolution of a “Stealth” CME Derived from Multi-view Imaging and Multipoint in Situ observations. I. Propagation to 1 AU Inner Heliospheric Evolution of a “Stealth” CME Derived from Multi-view Imaging and Multipoint in Situ observations. I. Propagation to 1 AU.\BBCQ \APACjournalVolNumPagesThe Astrophysical Journal77955. {APACrefDOI} 10.1088/0004-637X/779/1/55 \PrintBackRefs\CurrentBib
- Odstrčil \BOthers. (\APACyear2002) \APACinsertmetastarOdstrcil:2002{APACrefauthors}Odstrčil, D., Linker, J\BPBIA., Lionello, R., Mikic, Z., Riley, P., Pizzo, V\BPBIJ.\BCBL \BBA Luhmann, J\BPBIG. \APACrefYearMonthDay2002. \BBOQ\APACrefatitleMerging of coronal and heliospheric numerical two-dimensional MHD models Merging of coronal and heliospheric numerical two-dimensional MHD models.\BBCQ \APACjournalVolNumPagesJ. Geophys. Res.107. \PrintBackRefs\CurrentBib
- Odstrčil \BOthers. (\APACyear2003) \APACinsertmetastarOdstrcil:2003{APACrefauthors}Odstrčil, D., Riley, P.\BCBL \BBA Zhao, X\BPBIP. \APACrefYearMonthDay2003. \BBOQ\APACrefatitleModeling 3-D solar wind structure Modeling 3-D solar wind structure.\BBCQ \APACjournalVolNumPagesAdv. Space Res.32497. {APACrefDOI} 10.1016/S0273-1177(03)00332-6 \PrintBackRefs\CurrentBib
- Odstrčil \BOthers. (\APACyear2004) \APACinsertmetastarOdstrcil:2004{APACrefauthors}Odstrčil, D., Riley, P.\BCBL \BBA Zhao, X\BPBIP. \APACrefYearMonthDay2004. \BBOQ\APACrefatitleNumerical simulation of the 12 May 1997 interplanetary CME event Numerical simulation of the 12 May 1997 interplanetary CME event.\BBCQ \APACjournalVolNumPagesJ. Geophys. Res.109. \APACrefnoteA02116 {APACrefDOI} 10.1029/2003JA010135 \PrintBackRefs\CurrentBib
- Owens \BOthers. (\APACyear2005) \APACinsertmetastarOwens:2005{APACrefauthors}Owens, M\BPBIJ., Cargill, P\BPBIJ., Pagel, C., Siscoe, G\BPBIL.\BCBL \BBA Crooker , N\BPBIU. \APACrefYearMonthDay2005. \BBOQ\APACrefatitleCharacteristic magnetic field and speed properties of interplanetary coronal mass ejections and their sheath regions Characteristic magnetic field and speed properties of interplanetary coronal mass ejections and their sheath regions.\BBCQ \APACjournalVolNumPagesJ. Geophys. Res.110A01105. {APACrefDOI} 10.1029/2004JA010814 \PrintBackRefs\CurrentBib
- Palmerio \BOthers. (\APACyear2018) \APACinsertmetastarPalmerio:2018{APACrefauthors}Palmerio, E., Kilpua, E\BPBIK\BPBIJ., Möstl, C., Bothmer, V., James, A\BPBIW., Green, L\BPBIM.\BDBLHarrison, R\BPBIA. \APACrefYearMonthDay2018. \BBOQ\APACrefatitleCoronal Magnetic Structure of Earthbound CMEs and In Situ Comparison Coronal Magnetic Structure of Earthbound CMEs and In Situ Comparison.\BBCQ \APACjournalVolNumPagesSpace Weather16442-460. {APACrefDOI} 10.1002/2017SW001767 \PrintBackRefs\CurrentBib
- Prise \BOthers. (\APACyear2015) \APACinsertmetastarPrise:2015{APACrefauthors}Prise, A\BPBIJ., Harra, L\BPBIK., Matthews, S\BPBIA., Arridge, C\BPBIS.\BCBL \BBA Achilleos, N. \APACrefYearMonthDay2015. \BBOQ\APACrefatitleAnalysis of a coronal mass ejection and corotating interaction region as they travel from the Sun passing Venus, Earth, Mars, and Saturn Analysis of a coronal mass ejection and corotating interaction region as they travel from the Sun passing Venus, Earth, Mars, and Saturn.\BBCQ \APACjournalVolNumPagesJournal of Geophysical Research: Space Physics1201566-1588. {APACrefDOI} 10.1002/2014JA020256 \PrintBackRefs\CurrentBib
- Reinard \BOthers. (\APACyear2012) \APACinsertmetastarReinard:2012{APACrefauthors}Reinard, A\BPBIA., Lynch, B\BPBIJ.\BCBL \BBA Mulligan, T. \APACrefYearMonthDay2012. \BBOQ\APACrefatitleComposition Structure of Interplanetary Coronal Mass Ejections From Multispacecraft Observations, Modeling, and Comparison with Numerical Simulations Composition Structure of Interplanetary Coronal Mass Ejections From Multispacecraft Observations, Modeling, and Comparison with Numerical Simulations.\BBCQ \APACjournalVolNumPagesThe Astrophysical Journal761175. {APACrefDOI} 10.1088/0004-637X/761/2/175 \PrintBackRefs\CurrentBib
- Reiner \BOthers. (\APACyear2007) \APACinsertmetastarReiner:2007{APACrefauthors}Reiner, M\BPBIJ., Kaiser, M\BPBIL.\BCBL \BBA Bougeret, J\BHBIL. \APACrefYearMonthDay2007. \BBOQ\APACrefatitleCoronal and interplanetary propagation of CME/shocks from radio, in situ and white-light observations Coronal and interplanetary propagation of CME/shocks from radio, in situ and white-light observations.\BBCQ \APACjournalVolNumPagesThe Astrophysical Journal6631369-1385. {APACrefDOI} 10.1029/2004JA010943 \PrintBackRefs\CurrentBib
- Richardson \BBA Cane (\APACyear2010) \APACinsertmetastarRichardson:2010{APACrefauthors}Richardson, I\BPBIG.\BCBT \BBA Cane, H\BPBIV. \APACrefYearMonthDay2010. \BBOQ\APACrefatitleNear-Earth Interplanetary Coronal Mass Ejections During Solar Cycle 23 (1996-2009): Catalog and Summary of Properties Near-Earth Interplanetary Coronal Mass Ejections During Solar Cycle 23 (1996-2009): Catalog and Summary of Properties.\BBCQ \APACjournalVolNumPagesSolar Phys.264189-237. {APACrefDOI} 10.1007/s11207-010-9568-6 \PrintBackRefs\CurrentBib
- Robbrecht \BOthers. (\APACyear2009) \APACinsertmetastarRobbrecht:2009{APACrefauthors}Robbrecht, E., Berghmans, D.\BCBL \BBA Van der Linden, R\BPBIA\BPBIM. \APACrefYearMonthDay2009. \BBOQ\APACrefatitleAutomated LASCO CME Catalog for Solar Cycle 23: Are CMEs Scale Invariant? Automated LASCO CME Catalog for Solar Cycle 23: Are CMEs Scale Invariant?\BBCQ \APACjournalVolNumPagesThe Astrophysical Journal6911222-1234. {APACrefDOI} 10.1088/0004-637X/691/2/1222 \PrintBackRefs\CurrentBib
- Russell \BBA Mulligan (\APACyear2002) \APACinsertmetastarRussell:2002{APACrefauthors}Russell, C\BPBIT.\BCBT \BBA Mulligan, T. \APACrefYearMonthDay2002. \BBOQ\APACrefatitleOn the magnetosheath thicknesses of interplanetary coronal mass ejections On the magnetosheath thicknesses of interplanetary coronal mass ejections.\BBCQ \APACjournalVolNumPagesPlanetary and Space Science50527-534. {APACrefDOI} 10.1016/s0032-0633(02)00031-4 \PrintBackRefs\CurrentBib
- Salman \BOthers. (\APACyear2018) \APACinsertmetastarSalman:2018{APACrefauthors}Salman, T\BPBIM., Lugaz, N., Farrugia, C\BPBIJ., Winslow, R\BPBIM., Galvin, A\BPBIB.\BCBL \BBA Schwadron, N\BPBIA. \APACrefYearMonthDay2018. \BBOQ\APACrefatitleForecasting Periods of Strong Southward Magnetic Field Following Interplanetary Shocks Forecasting Periods of Strong Southward Magnetic Field Following Interplanetary Shocks.\BBCQ \APACjournalVolNumPagesSpace Weather16. {APACrefDOI} 10.1029/2018SW002056 \PrintBackRefs\CurrentBib
- Savani \BOthers. (\APACyear2011) \APACinsertmetastarSavani:2011b{APACrefauthors}Savani, N\BPBIP., Owens, M\BPBIJ., Rouillard, A\BPBIP., Forsyth, R\BPBIJ., Kusano, K., Shiota, D.\BDBLBothmer, V. \APACrefYearMonthDay2011\APACmonth05. \BBOQ\APACrefatitleEvolution of Coronal Mass Ejection Morphology with Increasing Heliocentric Distance. II. In Situ Observations Evolution of Coronal Mass Ejection Morphology with Increasing Heliocentric Distance. II. In Situ Observations.\BBCQ \APACjournalVolNumPagesThe Astrophysical Journal732117-+. {APACrefDOI} 10.1088/0004-637X/732/2/117 \PrintBackRefs\CurrentBib
- Savani \BOthers. (\APACyear2015) \APACinsertmetastarSavani:2015{APACrefauthors}Savani, N\BPBIP., Vourlidas, A., Szabo, A., Mays, M\BPBIL., Richardson, I\BPBIG., Thompson, B\BPBIJ.\BDBLNieves-Chinchilla, T. \APACrefYearMonthDay2015. \BBOQ\APACrefatitlePredicting the magnetic vectors within coronal mass ejections arriving at Earth: 1. Initial architecture Predicting the magnetic vectors within coronal mass ejections arriving at Earth: 1. Initial architecture.\BBCQ \APACjournalVolNumPagesSpace Weather13374-385. {APACrefDOI} 10.1002/2015SW001171 \PrintBackRefs\CurrentBib
- Siscoe \BBA Odstrcil (\APACyear2008) \APACinsertmetastarSiscoe:2008{APACrefauthors}Siscoe, G.\BCBT \BBA Odstrcil, D. \APACrefYearMonthDay2008. \BBOQ\APACrefatitleWays in which ICME sheaths differ from magnetosheaths Ways in which ICME sheaths differ from magnetosheaths.\BBCQ \APACjournalVolNumPagesJ. Geophys. Res.113A00B07. {APACrefDOI} 10.1029/2008JA013142 \PrintBackRefs\CurrentBib
- Siscoe \BBA Schwenn (\APACyear2006) \APACinsertmetastarSiscoe:2006{APACrefauthors}Siscoe, G.\BCBT \BBA Schwenn, R. \APACrefYearMonthDay2006. \BBOQ\APACrefatitleCME Disturbance Forecasting CME Disturbance Forecasting.\BBCQ \APACjournalVolNumPagesSpace Science Reviews123453-470. {APACrefDOI} 10.1007/s11214-006-9024-y \PrintBackRefs\CurrentBib
- Smith \BOthers. (\APACyear1998) \APACinsertmetastarSmith:1998{APACrefauthors}Smith, C\BPBIW., L’Heureux, J., Ness, N\BPBIF.\BCBL \BBA Acuna, M\BPBIH. \APACrefYearMonthDay1998. \BBOQ\APACrefatitleThe ACE Magnetic Field Experiment The ACE Magnetic Field Experiment.\BBCQ \APACjournalVolNumPagesSpace Science Reviews86613-632. \PrintBackRefs\CurrentBib
- Solomon \BOthers. (\APACyear2001) \APACinsertmetastarSolomon:2001{APACrefauthors}Solomon, S\BPBIC., McNutt, R\BPBIL.\BCBL \BBA Gold, R\BPBIE. \APACrefYearMonthDay2001. \BBOQ\APACrefatitleThe MESSENGER mission to Mercury: scientific objectives and implementation The MESSENGER mission to Mercury: scientific objectives and implementation.\BBCQ \APACjournalVolNumPagesPlanetary and Space Science491445. {APACrefDOI} 10.1016/S0032-0633(01)00085-X \PrintBackRefs\CurrentBib
- Stone \BOthers. (\APACyear1998) \APACinsertmetastarStone:1998{APACrefauthors}Stone, E\BPBIC., Frandsen, A\BPBIM., Mewaldt, R\BPBIA., Christian, E\BPBIR., Margolies, D., Ormes, J\BPBIF.\BCBL \BBA Snow, F. \APACrefYearMonthDay1998. \BBOQ\APACrefatitleThe Advanced Composition Explorer The Advanced Composition Explorer.\BBCQ \APACjournalVolNumPagesSpace Science Reviews861-22. {APACrefDOI} 10.1023/A:1005082526237 \PrintBackRefs\CurrentBib
- Temmer \BOthers. (\APACyear2011) \APACinsertmetastarTemmer:2011{APACrefauthors}Temmer, M., Rollett, T., Möstl, C., Veronig, A\BPBIM., Vršnak, B.\BCBL \BBA Odstrčil, D. \APACrefYearMonthDay2011. \BBOQ\APACrefatitleInfluence of the Ambient Solar Wind Flow on the Propagation Behavior of Interplanetary Coronal Mass Ejections Influence of the Ambient Solar Wind Flow on the Propagation Behavior of Interplanetary Coronal Mass Ejections.\BBCQ \APACjournalVolNumPagesThe Astrophysical Journal743101. {APACrefDOI} 10.1088/0004-637X/743/2/101 \PrintBackRefs\CurrentBib
- Thernisien \BOthers. (\APACyear2009) \APACinsertmetastarThernisien:2009{APACrefauthors}Thernisien, A., Vourlidas, A.\BCBL \BBA Howard, R\BPBIA. \APACrefYearMonthDay2009. \BBOQ\APACrefatitleForward Modeling of Coronal Mass Ejections Using STEREO/SECCHI Data Forward Modeling of Coronal Mass Ejections Using STEREO/SECCHI Data.\BBCQ \APACjournalVolNumPagesSolar Phys.256111-130. {APACrefDOI} 10.1007/s11207-009-9346-5 \PrintBackRefs\CurrentBib
- Titov \BOthers. (\APACyear2006) \APACinsertmetastarTitov:2006{APACrefauthors}Titov, D\BPBIV., Svedhem, H.\BCBL \BBA McCoy, D. \APACrefYearMonthDay2006. \BBOQ\APACrefatitleVenus Express: Scientific goals, instrumentation, and scenario of the mission Venus Express: Scientific goals, instrumentation, and scenario of the mission.\BBCQ \APACjournalVolNumPagesCosmic Research44334. {APACrefDOI} 10.1134/S0010952506040071 \PrintBackRefs\CurrentBib
- Žic \BOthers. (\APACyear2015) \APACinsertmetastarZic:2015{APACrefauthors}Žic, T., Vršnak, B.\BCBL \BBA Temmer, M. \APACrefYearMonthDay2015. \BBOQ\APACrefatitleHeliospheric Propagation of Coronal Mass Ejections: Drag-Based Model Fitting Heliospheric Propagation of Coronal Mass Ejections: Drag-Based Model Fitting.\BBCQ \APACjournalVolNumPagesThe Astrophysical Journal218. {APACrefDOI} 10.1088/0067-0049/218/2/32 \PrintBackRefs\CurrentBib
- Vandas \BOthers. (\APACyear1996) \APACinsertmetastarVandas:1996{APACrefauthors}Vandas, M., Fischer, S., Dryer, M., Smith, Z.\BCBL \BBA Detman, T. \APACrefYearMonthDay1996. \BBOQ\APACrefatitleSimulation of magnetic cloud propagation in the inner heliosphere in two dimensions 2. A loop parallel to the ecliptic plane and the role of helicity Simulation of magnetic cloud propagation in the inner heliosphere in two dimensions 2. A loop parallel to the ecliptic plane and the role of helicity.\BBCQ \APACjournalVolNumPagesJ. Geophys. Res.1012505-2510. {APACrefDOI} 10.1029/95JA02446 \PrintBackRefs\CurrentBib
- Vršnak (\APACyear2001) \APACinsertmetastarVrsnak:2001{APACrefauthors}Vršnak, B. \APACrefYearMonthDay2001. \BBOQ\APACrefatitleDeceleration of Coronal Mass Ejections Deceleration of Coronal Mass Ejections.\BBCQ \APACjournalVolNumPagesSolar Phys.202173-189. \PrintBackRefs\CurrentBib
- Vršnak \BOthers. (\APACyear2004) \APACinsertmetastarVrsnak:2004{APACrefauthors}Vršnak, B., Ruždjak, D., Sudar, D.\BCBL \BBA Gopalswamy, N. \APACrefYearMonthDay2004\APACmonth08. \BBOQ\APACrefatitleKinematics of coronal mass ejections between 2 and 30 solar radii. What can be learned about forces governing the eruption? Kinematics of coronal mass ejections between 2 and 30 solar radii. What can be learned about forces governing the eruption?\BBCQ \APACjournalVolNumPagesAstron. Astrophys.423717-728. {APACrefDOI} 10.1051/0004-6361:20047169 \PrintBackRefs\CurrentBib
- Vršnak \BOthers. (\APACyear2010) \APACinsertmetastarVrsnak:2010{APACrefauthors}Vršnak, B., Žic, T., Falkenberg, T\BPBIV., Moëstl, C., Vennerstrom, S.\BCBL \BBA Vrbanec, D. \APACrefYearMonthDay2010\APACmonth03. \BBOQ\APACrefatitleThe Role of Aerodynamic Drag in Propagation of Interplanetary Coronal Mass Ejections The Role of Aerodynamic Drag in Propagation of Interplanetary Coronal Mass Ejections.\BBCQ \APACjournalVolNumPagesAstron. Astrophys.512A43. {APACrefDOI} 10.1051/0004-6361/200913482 \PrintBackRefs\CurrentBib
- Vršnak \BOthers. (\APACyear2013) \APACinsertmetastarVrsnak:2012{APACrefauthors}Vršnak, B., Žic, T., Vrbanec, D., Temmer, M., Rollett, T., Möstl, C.\BDBLShanmugaraju, A. \APACrefYearMonthDay2013. \BBOQ\APACrefatitlePropagation of Interplanetary Coronal Mass Ejections: The Drag-Based Model Propagation of Interplanetary Coronal Mass Ejections: The Drag-Based Model.\BBCQ \APACjournalVolNumPagesSolar Phys.285295-315. {APACrefDOI} 10.1007/s11207-012-0035-4 \PrintBackRefs\CurrentBib
- C. Wang \BOthers. (\APACyear2005) \APACinsertmetastarWang:2005{APACrefauthors}Wang, C., Du, D.\BCBL \BBA Richardson, J\BPBID. \APACrefYearMonthDay2005. \BBOQ\APACrefatitleCharacteristics of the interplanetary coronal mass ejections in the heliosphere between 0.3 and 5.4 AU Characteristics of the interplanetary coronal mass ejections in the heliosphere between 0.3 and 5.4 AU.\BBCQ \APACjournalVolNumPagesJ. Geophys. Res.110A10107. {APACrefDOI} 10.1029/2005JA011198 \PrintBackRefs\CurrentBib
- Y. Wang \BOthers. (\APACyear2018) \APACinsertmetastarWang:2018{APACrefauthors}Wang, Y., Shen, C., Liu, R., Liu, J., Guo, J., Li, X.\BDBLZhang, T. \APACrefYearMonthDay2018. \BBOQ\APACrefatitleUnderstanding the Twist Distribution Inside Magnetic Flux Ropes by Anatomizing an Interplanetary Magnetic Cloud Understanding the Twist Distribution Inside Magnetic Flux Ropes by Anatomizing an Interplanetary Magnetic Cloud.\BBCQ \APACjournalVolNumPagesJournal of Geophysical Research: Space Physics1233238-3261. {APACrefDOI} 10.1002/2017JA024971 \PrintBackRefs\CurrentBib
- Y. Wang \BOthers. (\APACyear2004) \APACinsertmetastarWang:2004{APACrefauthors}Wang, Y., Shen, C., Wang, S.\BCBL \BBA Ye, P. \APACrefYearMonthDay2004\APACmonth08. \BBOQ\APACrefatitleDeflection of coronal mass ejection in the interplanetary medium Deflection of coronal mass ejection in the interplanetary medium.\BBCQ \APACjournalVolNumPagesSolar Phys.222329-343. {APACrefDOI} 10.1023/B:SOLA.0000043576.21942.aa \PrintBackRefs\CurrentBib
- Y. Wang \BOthers. (\APACyear2014) \APACinsertmetastarWang:2014{APACrefauthors}Wang, Y., Wang, B., Shen, C., Shen, F.\BCBL \BBA Lugaz, N. \APACrefYearMonthDay2014. \BBOQ\APACrefatitleDeflected propagation of a coronal mass ejection from the corona to interplanetary space Deflected propagation of a coronal mass ejection from the corona to interplanetary space.\BBCQ \APACjournalVolNumPagesJournal of Geophysical Research: Space Physics1195117-5132. {APACrefDOI} 10.1002/2013JA019537 \PrintBackRefs\CurrentBib
- Webb \BBA Howard (\APACyear2012) \APACinsertmetastarWebb:2012{APACrefauthors}Webb, D\BPBIF.\BCBT \BBA Howard, T\BPBIA. \APACrefYearMonthDay2012. \BBOQ\APACrefatitleCoronal Mass Ejections: Observations Coronal Mass Ejections: Observations.\BBCQ \APACjournalVolNumPagesLiving Reviews in Solar Physics93. {APACrefDOI} 10.12942/lrsp-2012-3 \PrintBackRefs\CurrentBib
- Winslow \BOthers. (\APACyear2015) \APACinsertmetastarWinslow:2015{APACrefauthors}Winslow, R\BPBIM., Lugaz, N., Philpott, L\BPBIC., Schwadron, N\BPBIA., Farrugia, C\BPBIJ., Anderson, B\BPBIJ.\BCBL \BBA Smith, C\BPBIW. \APACrefYearMonthDay2015. \BBOQ\APACrefatitleInterplanetary coronal mass ejections from MESSENGER orbital observations at Mercury Interplanetary coronal mass ejections from MESSENGER orbital observations at Mercury.\BBCQ \APACjournalVolNumPagesJournal of Geophysical Research: Space Physics1206101-6118. {APACrefDOI} 10.1002/2015JA021200 \PrintBackRefs\CurrentBib
- Winslow \BOthers. (\APACyear2016) \APACinsertmetastarWinslow:2016{APACrefauthors}Winslow, R\BPBIM., Lugaz, N., Schwadron, N\BPBIA., Farrugia, C\BPBIJ., Yu, W., Raines, J\BPBIM.\BDBLZurbuchen, T\BPBIH. \APACrefYearMonthDay2016. \BBOQ\APACrefatitleLongitudinal conjunction between MESSENGER and STEREO A: Development of ICME complexity through stream interactions Longitudinal conjunction between MESSENGER and STEREO A: Development of ICME complexity through stream interactions.\BBCQ \APACjournalVolNumPagesJournal of Geophysical Research: Space Physics1216092-6106. {APACrefDOI} 10.1002/2015JA022307 \PrintBackRefs\CurrentBib
- Winslow \BOthers. (\APACyear2017) \APACinsertmetastarWinslow:2017{APACrefauthors}Winslow, R\BPBIM., Philpott, L., Paty, C\BPBIS., Lugaz, N., Schwadron, N\BPBIA., Johnson, C\BPBIL.\BCBL \BBA Korth, H. \APACrefYearMonthDay2017. \BBOQ\APACrefatitleStatistical study of ICME effects on Mercury’s magnetospheric boundaries and northern cusp region from MESSENGER Statistical study of ICME effects on Mercury’s magnetospheric boundaries and northern cusp region from MESSENGER.\BBCQ \APACjournalVolNumPagesJournal of Geophysical Research: Space Physics1224960-4975. {APACrefDOI} 10.1002/2016JA023548 \PrintBackRefs\CurrentBib
- Winslow \BOthers. (\APACyear2018) \APACinsertmetastarWinslow:2018{APACrefauthors}Winslow, R\BPBIM., Schwadron, N\BPBIA., Lugaz, N., Guo, J., Joyce, C\BPBIJ., Jordan, A\BPBIP.\BDBLMays, M\BPBIL. \APACrefYearMonthDay2018. \BBOQ\APACrefatitleOpening a Window on ICME-driven GCR Modulation in the Inner Solar System Opening a Window on ICME-driven GCR Modulation in the Inner Solar System.\BBCQ \APACjournalVolNumPagesThe Astrophysical Journal856139. {APACrefDOI} 10.3847/1538-4357/aab098 \PrintBackRefs\CurrentBib
- Wood \BOthers. (\APACyear2010) \APACinsertmetastarWood:2010{APACrefauthors}Wood, B\BPBIE., Howard, R\BPBIA.\BCBL \BBA Socker, D\BPBIG. \APACrefYearMonthDay2010. \BBOQ\APACrefatitleReconstructing the Morphology of an Evolving Coronal Mass Ejection Reconstructing the Morphology of an Evolving Coronal Mass Ejection.\BBCQ \APACjournalVolNumPagesThe Astrophysical Journal7151524-1532. {APACrefDOI} 10.1088/0004-637X/715/2/1524 \PrintBackRefs\CurrentBib
- Yashiro \BOthers. (\APACyear2004) \APACinsertmetastarYashiro:2004{APACrefauthors}Yashiro, S., Gopalswamy, N., Michalek, G., St. Cyr, O\BPBIC., Plunkett, S\BPBIP., Rich, N\BPBIB.\BCBL \BBA Howard, R\BPBIA. \APACrefYearMonthDay2004. \BBOQ\APACrefatitleA catalog of white light coronal mass ejections observed by the SOHO spacecraft A catalog of white light coronal mass ejections observed by the SOHO spacecraft.\BBCQ \APACjournalVolNumPagesJournal of Geophysical Research: Space Physics109A10102. {APACrefDOI} 10.1029/2003JA010282 \PrintBackRefs\CurrentBib
- J. Zhang \BOthers. (\APACyear2007) \APACinsertmetastarZhang:2007{APACrefauthors}Zhang, J., Richardson, I\BPBIG., Webb, D\BPBIF., Gopalswamy, N., Huttunen, E., Kasper, J\BPBIC.\BDBLZhukov, A\BPBIN. \APACrefYearMonthDay2007. \BBOQ\APACrefatitleSolar and interplanetary sources of major geomagnetic storms (Dst-100 nT) during 1996-2005 Solar and interplanetary sources of major geomagnetic storms (Dst-100 nT) during 1996-2005.\BBCQ \APACjournalVolNumPagesJ. Geophys. Res.112A10102. {APACrefDOI} 10.1029/2007JA012321 \PrintBackRefs\CurrentBib
- T\BPBIL. Zhang \BOthers. (\APACyear2006) \APACinsertmetastarZhang:2006{APACrefauthors}Zhang, T\BPBIL., Baumjohann, W., Delva, M., Auster, H\BPBIU., Balogh, A\BPBIV.\BCBL \BBA Russell, C\BPBIT. \APACrefYearMonthDay2006. \BBOQ\APACrefatitleMagnetic field investigation of the Venus plasma environment: Expected new results from Venus Express Magnetic field investigation of the Venus plasma environment: Expected new results from Venus Express.\BBCQ \APACjournalVolNumPagesPlanetary and Space Science541336-1343. {APACrefDOI} 10.1016/j.pss.2006.04.018 \PrintBackRefs\CurrentBib
- Zhuang \BOthers. (\APACyear2019) \APACinsertmetastarZhuang:2019{APACrefauthors}Zhuang, B., Wang, Y., Hu, Y., Shen, C., Liu, R., Gou, T.\BDBLLi, X. \APACrefYearMonthDay2019. \BBOQ\APACrefatitleNumerical Simulations on the Deflection of Coronal Mass Ejections in the Interplanetary Space Numerical Simulations on the Deflection of Coronal Mass Ejections in the Interplanetary Space.\BBCQ \APACjournalVolNumPagesThe Astrophysical Journal87673. {APACrefDOI} 10.3847/1538-4357/ab139e \PrintBackRefs\CurrentBib