Mathematical models and methods for crowd dynamics control
Abstract
In this survey we consider mathematical models and methods recently developed to control crowd dynamics, with particular emphasis on egressing pedestrians. We focus on two control strategies: The first one consists in using special agents, called leaders, to steer the crowd towards the desired direction. Leaders can be either hidden in the crowd or recognizable as such. This strategy heavily relies on the power of the social influence (herding effect), namely the natural tendency of people to follow group mates in situations of emergency or doubt. The second one consists in modify the surrounding environment by adding in the walking area multiple obstacles optimally placed and shaped. The aim of the obstacles is to naturally force people to behave as desired. Both control strategies discussed in this paper aim at reducing as much as possible the intervention on the crowd. Ideally the natural behavior of people is kept, and people do not even realize they are being led by an external intelligence. Mathematical models are discussed at different scales of observation, showing how macroscopic (fluid-dynamic) models can be derived by mesoscopic (kinetic) models which, in turn, can be derived by microscopic (agent-based) models.111Authors would like to thank the Italian Ministry of Instruction, University and Research (MIUR) to support this research with funds coming from PRIN Project 2017 (No. 2017KKJP4X entitled “Innovative numerical methods for evolutionary partial differential equations and applications”).
1 Introduction
This paper aims at presenting a brief survey of some recent developments in the mathematical modeling and control techniques for human crowd dynamics. Here, we define crowd dynamics control as the art of steering large masses of people in the desired direction, minimizing verbal directives to individuals and preserving as much as possible their natural behavior. In the extreme case, we get methods to steer crowds along predefined paths without the crowd being aware of it, i.e. individuals do not even perceive that their (apparently) natural decisions are guided. Such control techniques are expected to be effective in all situations characterized by the impossibility of directly communicating with the crowd (e.g., in case of very large groups, emergencies, violent crowds reluctant to follow directions indicated by event organizers or police).
Crowd control stems on different research topics and benefits from a multidisciplinary approach. First, physics and psychology are called upon to point out the main behavioral aspects which represent the constitutive ingredients of mathematical models. Models will then be used to create a digital twin of the moving crowd. After a careful choice of the scale of observation (mainly depending on the size of the crowd and computing resources), numerical analysis is used to solve the equations and get a reproduction of virtual crowds, while real observations and data acquisition are crucial to calibrate the models. Calibration is particularly challenging, considering the high variability among persons and the difficulty of measuring some parameters like pushiness, degree of rationality, knowledge of the surrounding environment, etc. After that, we have to set up the control problem, defining the control (design) variables. Roughly speaking, this means that we need to identify which part of the system is subject to modifications and which part is instead left to the natural state. Then, we must define the objective function, i.e. the goal of the optimization procedure. Here optimization techniques come into play to solve the control problem and get the optimal strategy to apply to steer the crowd as desired. Finally, experiments with real crowds are desirable to check the effectiveness of the strategy found in virtual environments.
Curiously, some metaheuristic optimization techniques like the one adopted in Section 4.2 are inspired precisely by models for collective behavior: many agents spread in the abstract space of control variables hunting for the optimal strategy of the crowd. This creates a surreal parallelism between the physical space, where people move, and the space of control variables, where people’s behaviour lies. In the two spaces, the same abstract mathematical methods can be then used to make agents reach their goals.
Scale of observation, models, and degree of rationality
Pedestrian dynamics can be observed at different scales, and the choice of the point of view drastically changes the modeling framework. A nanoscopic approach consists in tracking every single agent, including the position of torso and head arechavaleta2008IEEETR ; chitour2012SICON . A microscopic approach consists instead in tracking every single agent assuming s/he is a -dimensional point or a small circle. A mesoscopic approach is based on the description of average quantities like the density of people, but it keeps the possibility to distinguish one-to-one interactions. Finally, macroscopic approach describes only average quantities loosing any kind of granularity. Multiscale approaches are also possible: One can adopt different scales of observation in different parts of the domain (passing information across an interface) or one can employ two or more scales at the same time and space, to get a fully hybridized description, as in cristiani2011MMS ; cristiani2014book .
Concerning pedestrian modeling, virtually any kind of models have been investigated so far and several reviews and books are available. For a quick introduction, we refer the reader to the surveys bellomo2011SR ; helbing2001RMP and the books cristiani2014book ; kachroo2008book ; NaPaTo10 . Some papers deal specifically with egressing/evacuating pedestrians: a very good source of references is the paper abdelghany2014EJOR , where evacuation models both with and without optimal planning search are discussed. The paper abdelghany2014EJOR itself proposes a cellular automata model coupled with a genetic algorithm to find a top-down optimal evacuation plan. Evacuation problems were studied by means of lattice models cirillo2013PhysA ; guo2012TRB , social force models helbing2000N ; parisi2005PhysA , cellular automata models abdelghany2014EJOR ; wang2015PhysA , mesoscopic models agnelli2015M3AS ; albi2016SIAP ; FTW18 , and macroscopic models carrillo2016M3AS . Limited visibility issues were considered in carrillo2016M3AS ; cirillo2013PhysA ; guo2012TRB . Real experiments involving people can be found in albi2016SIAP ; guo2012TRB .
It can be useful to recall here that pedestrians can show different degrees of rationality, depending on the situation and their knowledge of the surrounding environment. In an unknown environment with limited visibility we expected people to follow basically a full instinctive behavior, being impossible to make predictions. Conversely, an ideal rational pedestrian with a specific target and full knowledge of the environment can compute her/his path in an optimal manner, is able to forecast the behavior of other pedestrians (even for long time) and is able to understand the impact of the presence of the others at any time along her/his path. In this case dynamics of people are fully coupled in space and time, and a competition among pedestrians naturally arises. Nash equilibria or similar concepts help to find the strategy eventually adopted by the participants. For a deep discussion in this direction we refer the reader to the book (cristiani2014book, , Sect. 4.4) and papers cristiani2015NHM ; cristiani2015SIAP .
Crowd dynamics control
The problem of controlling crowds falls in the larger line of research dedicated to self-organizing agents. For this, a vast mathematical literature is available and first principles as well as the most important qualitative results are already known. The toy model for such investigations is the Cucker-Smale model cucker2007IEEE , introduced in 2007. Controlled versions of the model are widely studied, see, e.g., AlHePa15 ; AP18a ; BBCK18 ; BFK15 ; CFPT13 ; FS14 ; HePaSt15 . Let us also mention the seminal paper couzin2005N , where authors pointed out that in a group of individuals with tendency to move together, a small percentage of informed individuals is able to steer the whole group in the desired direction.
In this paper we focus on two control strategies:
-
•
The first one consists in using special agents, called leaders, to steer the crowd towards the desired direction. Leaders can be either hidden in the crowd albi2016SIAP ; couzin2005N ; duan2014SR ; han2006JSSC ; han2013PLOSONE or recognizable as such ABFHKPPS ; albi2014Phil ; AlPaZa19 ; borzi2015M3ASa ; during2009PRSA ; motsch2011JSP . This strategy heavily relies on the power of the social influence (or herding effect), namely the natural tendency of people to follow group mates in situations of emergency or doubt.
En passant, let us stress that the term “herding” is largely ambiguous in the literature, as pointed out in the recent paper haghani2019JAT .
-
•
The second one consists in modify the surrounding environment by adding in the walking area multiple obstacles optimally placed and shaped. The aim of the obstacles is to smoothly force people to behave as desired, changing surrounding conditions in such a way that the modified behaviour of people naturally matches the optimal one. This approach can be seen as an inverse application of the Braess’s paradox braess2005TS ; hughes2003ARFM , originally proposed in the context of traffic flow on network. In that case it was noted that adding a new road (i.e. a new connection) in the network can lead to a higher degree of congestion. In our framework, an additional constraints lead paradoxically to an improvement of the pedestrian flow. Several papers investigate numerically the effectiveness of the Braess’s paradox by means of both microscopic models (e.g., Helbing’s social force model) and macroscopic models. Some papers report the effect of additional obstacles manually placed in the walking area, see, among others, escobar2003LNCS ; frank2011PA ; helbing2005TS ; hughes2002TRB ; matsuoka2015 ; twarogowska2014AMM . Other papers, instead, employ optimization algorithms, see cristiani2017AMM ; cristiani2019AMM ; cristiani2015SIAP ; jiang2014PLOS ; johansson2007 ; shukla2009 ; zhao2017PhysA . Note that, the resulting optimization problem typically is non convex and high dimensional. Efficient optimization algorithms, including Particle Swarm Optimization (PSO), genetic algorithms, differential evolution, and random compass search were used.
Manuscript organization
The rest of the manuscript is organized as follows. In Sect. 2 we introduce the mathematical model for egressing pedestrians which will serve as a guideline for the rest of the paper. Main ingredients are introduced and three scales of observation (microscopic, mesoscopic, macroscopic) are discussed. In addition, we discuss methods to manage obstacles in models, i.e. how to prevent pedestrians from entering forbidden zones of the walking area. In Sect. 3 we present crowd control techniques based on the use of leaders, either visible (i.e. recognizable from the crowd as such) or not. In Sect. 4 we analyze crowd control techniques based on the use of smart obstacles suitably located in the walking area to modify the perception of the environment and suitably modify the optimal paths. Finally, in Sect. 5 we sketch some conclusions and future research directions.
2 Different levels of description
In this section we describe the model at a general level. In particular we will focus on the different levels of description: microscopic, mesoscopic and macroscopic.
2.1 Preliminary notions
Hereafter, we divide the population between leaders, which are the controllers and behave in some optimal way (to be defined), and followers, which represent the mass of agents to be controlled. Followers typically cannot distinguish between followers and leaders. Our approach consists in describing leaders by a first order model (positions are the only state variables), while followers are described by a second order model (both positions and velocities are state variables). In the latter case, the small inertia typical of pedestrian motion is obtained by means of a fast relaxation towards the target velocity.
Concerning the way interactions between individuals are modelled, we adopt a mixed approach, assuming short-range interactions to be metrical and long-range ones to be topological. We recall that, the individual interactions are said to be metrical if they involve only mates within a predefined sensory region, regardless of the number of individuals which actually fall in it. Interactions are instead said topological if it involves a predefined number of group mates regardless their distance from the considered agent.
We assume here that pedestrians have a target to reach in minimal time, but the environment is in general unknown. Therefore, since individuals have no idea of the location of their target, we expect that they often look around to explore the environment and see the behavior of the others. This is why we prefer to adhere to isotropic (all-around) interactions.
Next, before introducing the details of the model, let us briefly describe the social forces acting on the agents.
-
•
Leaders.
-
–
Leaders are subject to an isotropic metrical short-range repulsion force directed against all the others, translating the fact that they want to avoid collisions and that a maximal density exists.
-
–
Leaders are assumed to know the environment and the self-organizing features of the crowd. They respond to an optimal force which is the result of an offline optimization procedure, defined as to minimize some cost functional.
-
–
-
•
Followers.
-
–
Similarly to leaders, followers respond to an isotropic metrical short-range repulsion force directed against all the others.
-
–
Followers tend to a desired velocity which corresponds to the velocity the would follow if they were alone in the domain. Since they do not know the environment, we assume that followers describe a random walk if the exit is not visible (exploration phase) or a sharp motion toward the exit if the exit is visible (evacuation phase).
-
–
If the exit is not visible, followers are subject to an isotropic topological alignment force with all the others, including leaders, i.e., they tend to have the same velocity of the group mates (herding effect). We will distinguish in the sequel between visible (recognized by the followers) and invisible (not recognized by the followers) leaders.
-
–
2.2 The microscopic leader-follower model
In this section we introduce the microscopic model for followers and leaders. We denote by the dimension of the space in which the motion takes place (typically ), by the number of followers and by the number of leaders. We also denote by the walking area and by the target point. To define the target’s visibility area, we consider the set , with , and we assume that the target is completely visible from any point belonging to and completely invisible from any point belonging to .
For every , let denote position and velocity of the agents belonging to the population of followers at time and, for every , let denote position and velocity of the agents among the population of leaders at time . Let us also define and .
Finally, let us denote by the ball of radius centered at and by the minimal ball centered at encompassing at least agents, and by the actual number of agents in . Note that .
Remark 1
The computation of requires the knowledge of the positions of all the agents, since all the distances , , and , must be evaluated in order to find the closest agents to .
The microscopic dynamics described by the two populations is given by the following set of ODEs: for and ,
| (1) |
We assume that
-
•
is a self-propulsion term, given by the relaxation toward a random direction or the relaxation toward a unit vector pointing to the target (the choice depends on the position), plus a term which translates the tendency to reach a given characteristic speed (modulus of the velocity), i.e.,
(2) where is the characteristic function of , , is a -dimensional random vector with normal distribution , and , , are positive constants.
-
•
The interactions follower-follower and follower-leader are defined as
(3) for given positive constants and .
In the first equation of (3) the term
models a (metrical) repulsive force, while the second term accounts for the (topological) alignment force, which vanishes inside . Note that, the interaction with the leaders, defined by the second equation in (3), accounts the previous forces with an additional attraction towards the leaders position. With the choice , we have and, therefore, the leaders are not recognized by the followers as special. This feature opens a wide range of new applications, including the control of crowds not prone to follow authority’s directives.
-
•
The interactions leader-follower and leader-leader reduce to a mere (metrical) repulsion, i.e., , where and are in general different from and , respectively.
-
•
is the control variable, to be chosen in a set of admissible control functions. Except for the short-range repulsion forces, the behaviour of the leaders is entirely characterized by the control term . More details on the control term will be given in Section 3.
Remark 2
As a further generalization of the above modeling, the population of leaders can be separated into two populations , and , with , depending on whether they are recognized by the followers (visible) or not (invisible). In the first case, the corresponding interaction function since followers will have the tendency to align with greater intensity towards leaders, whereas in the second case we simply have . In the sequel, for the sake of simplicity, we present our analysis in the case of system (1), where all leaders are either visible or invisible, leaving to a straightforward generalization the extension of simultaneous coexistence of visible and invisible leaders.
2.3 Boltzmann modelling
As already mentioned, our main interest in (1) lies in the case , that is the population of followers exceeds by far the one of leaders. When is very large, a microscopic description of both populations is no longer a viable option. We thus consider the evolution of the distribution of followers at time , denoted by , together with the microscopic equations for the leaders (whose number is still small). To this end, we denote with the total mass of followers, i.e.,
which we shall eventually require to be equal to . We introduce, for symmetry reasons, the distribution of leaders and their total mass
| (4) |
The evolution of can be then described by a Boltzmann-type dynamics, derived from the above microscopic formulation, which is obtained by analyzing the binary interactions between a follower and another follower and the same follower with a leader. The application of standard methods of binary interactions, see cercignani1994 ; PT:13 , shall yield a mesoscopic model for the distribution of followers, to be coupled with the previously presented ODE dynamics for leaders.
To derive the Boltzmann-type dynamics, we assume that, before interacting, each agent has at his/her disposal the values and that s/he needs in order to perform its movement: hence, in a binary interaction between two followers with state parameter and , the value of does not depend on and . In the case of of the form (3), this means that the ball and the value of have been already computed before interacting.
Moreover, since we are considering the distributions and of followers and leaders, respectively, the vectors and are derived from and by means of the first moments of and , and , respectively, which give the spatial variables of those distribution. Hence, we write in place of to stress the dependence of this term on and .
We thus consider two followers with state parameter and respectively, and we describe the evolution of their velocities after the interaction according to
| (5) |
where is the strength of interaction among followers, is a random variables whose entries are i.i.d. following a normal distribution with mean , variance , taking values in a set , and is defined as the deterministic part of the self-propulsion term (2),
| (6) |
We then consider the same follower as before with state parameters and a leader agent ; in this case the modified velocities satisfy
| (7) |
where is the strength of the interaction between followers and leaders. Note that (LABEL:eq:leadcoord) accounts only the change of the followers’ velocities, since leaders are not evolving via binary interactions.
The time evolution of is then given by a balance between bilinear gain and loss of space and velocity terms according to the two binary interactions (5) and (LABEL:eq:leadcoord), quantitatively described by the following Boltzmann-type equation
| (8) |
where and stand for the interaction frequencies among followers and between followers and leaders, respectively. The interaction integrals and are defined as
where the couples and are the pre-interaction states that generates and via (5), and is the Jacobian of the change of variables given by (5). Similarly, and are the pre-interaction states that generates and via (LABEL:eq:leadcoord), and is the Jacobian of the change of variables given by (LABEL:eq:leadcoord). Moreover, the expected value is computed with respect to .
In what follows, for the sake of compactness, we shall omit the time dependency of and , and hence of and too. In conclusion, we have the following combined ODE-PDE system for the dynamics of microscopic leaders and mesoscopic followers
| (11) |
Remark 3
If we would have opted for a description of agents as hard-sphere particles, the arising Boltzmann equation (8) would be of Enskog type, see toscanibellomoenskog . The relationship between the hard- and soft-sphere descriptions (i.e., where repulsive forces are considered, instead) has been deeply discussed, for instance, in andersenhard . In our model, the repulsive force is not singular at the origin for computational reasons, therefore the parameters and have to be chosen properly to avoid arbitrary high density concentrations.
2.4 Mean-field modeling
A different level of modeling, is obtained by considering directly the limit for large of the dynamic described by (1) where all individuals in principle are allowed to interact with all others. This kind of models are typically described by Fokker-Planck equations and can also be obtained directly from (8) in the quasi-invariant limit PT:13 . This technique, analogous to the so-called grazing collision limit in plasma physics, has been thoroughly studied in Vil02 and allows, as pointed out in PT:13 , to pass from the binary Boltzmann description introduced in the previous section to the mean-field limit.
In what follows, we shall assume that our agents densely populate a small region but weakly interact with each other. Formally, we assume that the interaction strengths and scale according to a parameter , the interaction frequencies and scale as , and we let . In order to avoid losing the diffusion term in the limit, we also scale the variance of the noise term as . More precisely, we set
| (12) |
Under the above scaling assumptions, the weak form of the equation (8), i.e.,
| (13) |
for a compactly supported test function , where
| (14) | ||||
| (15) |
reduces to the following Fokker-Planck equation (see PT:13 for more details)
| (16) |
where
with
Since has compact support, equation (16) can be recast in strong form by means of integration by parts. Coupling the resulting PDE with the microscopic ODEs for the leaders , we eventually obtain the system
| (17) |
2.5 Macroscopic modelling
In terms of model hierarchy one could imaging to compute the moments of (17) in order to further reduce the complexity. Let us stress that deriving a consistent macroscopic system from the kinetic equation is in general a difficult task, since equilibrium states are difficult to obtain, therefore no closure of the moments equations is possible. For self-organizing models similar to (17), in the noiseless case (i.e. ), a standard way to obtain a closed hydrodynamic system is to assume the velocity distribution to be mono-kinetic, i.e. , and the fluctuations to be negligible, thus computing the moments of (17) leads to the following macroscopic system for the density and the bulk velocity ,
| (18) |
where represent the leaders’ macroscopic density and bulk velocity, respectively, and the macroscopic interaction operator, see albi2013AML ; carrillo2010particle for further details. For , the derivation of a macroscopic system depends highly on the scaling regime between the noise and the interaction terms, see for example carrillo2009double ; carrillo2010particle ; karper2015hydrodynamic . Furthermore, the presence of diffusion operator in model (17) depends on the spatial domain, therefore the derivation of a reasonable macroscopic model is not trivial and it is left for further studies.
2.6 Interaction with obstacles
So far we have considered pedestrians influenced by the leaders action but free to move in any direction of the space. In practical applications, however, dynamics are often constrained by walls or other kind of obstacles. Including obstacles in mathematical models is not as trivial as one can imagine. We refer the reader to (cristiani2017AMM, , Sect. 2) for a review of obstacles’ handling techniques proposed in the literature. Here we recall just the three most common procedures, the first is the one we use in the numerical tests presented in this paper.
Cut off of the velocity field. An easy method to deal with obstacles is obtained by computing the velocity field first neglecting the presence of the obstacles, then nullifying the component of the velocity vector which points inside the obstacle. This method is used in, e.g., albi2016SIAP ; cristiani2011MMS ; cristiani2015SIAP . The method requires to pay attention that pedestrians do not stop walking completely because both components of the velocity vector vanish. This can happen around corners, stair-shaped obstacles and when obstacles are very close to each other (i.e. the distance is comparable with the spatial resolution of the numerical grid). A similar but more sophisticated approach can be found in (cristiani2017AMM, , Sect. 3).
Repulsive obstacles. Another easy method used to manage obstacles is obtained assuming that they generate a repulsive (social) force, exactly as pedestrians themselves do. In other words, obstacles are treated as frozen pedestrians. In this way one can use a repulsion function of the same kind to model both the interactions with group mates and with obstacles. This method is extensively used in microscopic models, see, e.g., colombi2016CAM ; frank2011PA ; helbing1995PRE ; loehner2010AMM ; okazaki1979TAIJa ; okazaki1979TAIJb ; okazaki1979TAIJc and also in macroscopic and multiscale models, see, e.g., colombo2012M3AS ; coscia2008M3AS ; etikyala2014M3AS ; piccoli2009CMT , with or without the pre-evaluation of the distance-to-obstacle function. The main drawback of this approach is that it is quite difficult to tune the strength of the repulsion force in such a way that the resulting behaviour is both admissible and realistic. Indeed, if the force is too small there is the risk that pedestrians enter the obstacles, while if it is too large pedestrians bypass the obstacles excessively far away. The paper colombo2012M3AS proposes a method to tune automatically the strength of the repulsion.
Rational turnaround. In more sophisticated models which take into account the rationality and predictive ability of pedestrians, obstacles can be managed including them into the decision-making process. For example, in the Hughes’s model hughes2002TRB pedestrians move, at each given time, along the fastest path toward the target, considering that crowded regions slow down the walking speed. In this framework, obstacles are easily included assuming that inside them the speed is null, so that the computation of the fastest path will circumvent them automatically.
3 Crowd controls through leaders
As discussed in the previous Section, in order to steer the crowd towards a desired direction or target position, we want to exploit the tendency of people to follow group mates in situations of emergency or doubt (social influence or herding effect). In particular by controlling few leaders and their trajectories we want to drive the whole system of followers. In this Section, we will formulate this problem in the context of optimal control theory and discuss its numerical solution. The main challenge is represented by the complexity induced by the non-linearities, and the high-dimensionality of models (1) and (11). Hence, we are interested in efficient methods to solve this optimization problem, synthesizing strategies scalable at various levels: from micro to macro.
3.1 Optimal control framework
The functional to be minimized can be chosen in several ways, the effectiveness mostly depends on the optimization method which is used afterwards. The most natural functional to be minimized for a crowd of egressing pedestrian, is the evacuation time, which can be defined as follows
| (19) |
subject to (1) or (11) and with , where is the set of admissible controls (including for instance box constraints to avoid excessive velocities). Such functional can be extremely nonregular, therefore the search of local minima is particularly difficult. Moreover the evacuation of the total mass in many situations can not completely be reached, in particular for the mesoscopic model where we account for a diffusion term.
In the sequel we propose two alternative optimal control problems, both designed to improve the evacuation time, and associated to different optimization methods for their solution.
Quadratic cost functional and Model Predictive Control
A first approximation of (19) can be designed introducing a quadratic cost as follows
| (20) |
for some positive constants and . The first term promotes the fact that followers have to reach the exit, the second forces leaders to keep contact with the crowd, and the last term penalizes excessive velocities. This minimization is performed along a fixed time frame
| (21) |
For this type of problem optimal solutions are typically out of reach, therefore we have to rely on sub-optimal strategies. A computationally efficient way to address the optimal control problem (21) is by Model Predictive Control (MPC) mayne2000A , the method works as follows.
Algorithm 1 (MPC)
-
1.
Set the time step with such that , and the predictive parameter , where .
- 2.
Note that for the MPC approach solves the full time frame problem , whereas for , it recovers an instantaneous controller. Such flexibility is complemented with a robust behavior, as the optimization is re-initialized every time step, allowing to address perturbations along the optimal trajectory.
Evacuated mass functional and Compass Search
Complete evacuation of the crowd is not always feasible, therefore we consider as milder request to maximize the evacuated mass at final time , minimizing the total mass inside the domain as follows
| (23) |
where in the microscopic case the integral over the density has to be interpreted in the empirical sense as sum of Dirac masses namely
In order to minimize such functional we move towards random methods as compass search (see audet2014MPC and references therein), alternative methods are genetic algorithms, or particle swarm optimization which will be discussed in more details in Section 4.
First of all, we consider only piecewise constant trajectories, introducing suitable switching times for the leaders’ controls. More precisely, we assume that leaders move at constant velocity for a given fixed time interval and when the switching time is reached, a new velocity vector is chosen. Therefore, the control variables are the velocities at the switching times for each leader. In order to optimize such strategy we define the following Compass Search (CS) algorithm.
Algorithm 2 (CS)
-
1.
Select a discrete set of sample times , the parameters , and .
-
2.
Select an initial strategy piecewise constant over the set e.g. constant direction and velocity speed towards the target (go-to-target)
compute the functional .
-
3.
Perform a perturbation of the the piecewise constant with small random variations over the time-set
() where is a random perturbation of the velocity at time . Finally compute .
- 4.
Remark 4
In the following some remarks concerning the above control settings.
-
•
Both MPC and CS approaches produce suboptimal controls, but they offer a good compromise in terms of computational efficiency.
-
•
Controlling directly the velocities rather than the accelerations makes the optimization problem much simpler because minimal control variations have an immediate impact on the dynamics.
-
•
In the mesoscopic scale, both functionals (19) and (20) can be considered, however the major difficulty to reach a complete evacuation of the continuous density is mainly due to the presence of the diffusion term and to the invisible interaction with respect to the leaders. Indeed the action of the Laplacian outside the visibility area causes the followers’ density to spread overall the domain. Hence without any further assumptions such non-linear diffusion, boundary conditions, or stronger interaction terms among followers and followers-leaders. Thus, in order to deal with the optimal control of the mean-field model, we will consider functional (23), namely the mass evacuated at the final time .
3.2 Numerical experiments
In this section, we present some numerical tests to validate our modeling framework at the microscopic and mesoscopic level. We explore three different scenarios for pedestrians: in Setting 1 (S#1) we discuss the difference between visible and invisible leaders; in Setting 2 (S#2) and 3 (S#3) we explore situation without and with obstacles respectively.
The dynamics at microscopic level (1) is discretized by means of the explicit Euler method with a time step . The evolution of the kinetic density in (17) is approximated by means of binary interaction algorithms, which approximates the mesoscopic model (11) simulating the Boltzmann dynamics (8) with a Monte-Carlo method for small values of the parameter , as presented in albi2013MMS . We choose , and a sample of particles to reconstruct the kinetic density for Setting 0 and 1, and for S#2. This type of approach is inspired by numerical methods for plasma physics and it allows to solve the interaction dynamics with a reduced computational cost compared with mesh-based methods, and an accuracy of . For further details on this class of binary interaction algorithms see albi2013MMS ; PT:13 .
Concerning optimization, in the microscopic case we adopt either the compass search with functional (19) or MPC with functional (21). In the mesoscopic case we adopt the compass search with functional (23).
In S#2 and S#3 we set the compass search switching times every time steps, and in S#3 every , having fixed the maximal random variation to for each component of the velocity. In S#1, the inner optimization block of the MPC procedure is performed via a direct formulation, by means of the fmincon routine in MatLab, which solves the optimization problem via an SQP method.
In Table (1) we report the various parameters used for the different settings.
| Setting | ||||||||||||||
|---|---|---|---|---|---|---|---|---|---|---|---|---|---|---|
| #1 | 3 | 150 | 10 | 2 | 1.5 | 3 | 3 | 0.01/0 | – | 1 | 0.5 | 0.4 | 1 | 1 |
| #2 | 0-3 | 150 | 10 | 2 | 1.5 | 3 | 3 | 0 | 1 | 1 | 0.5 | 0.4 | 1 | 1 |
| #3 | 0-2 | 150 | 10 | 2 | 1.5 | 3 | 3 | 0 | 1 | 1 | 0.5 | 0.4 | 1 | 1 |
S#1: Visible vs invisible leaders
We investigate numerically the difference among invisible and visible leaders, namely we distinguish situations where leaders are undercover with respect to cases where leaders act as an attractor of the crowd.
In this first setting the crowd of followers is distributed uniformly in the space domain with initial velocity randomly distributed with zero average, the leaders are positioned on the far right side of the crowd moving with fixed velocity for every , and no target is visible.


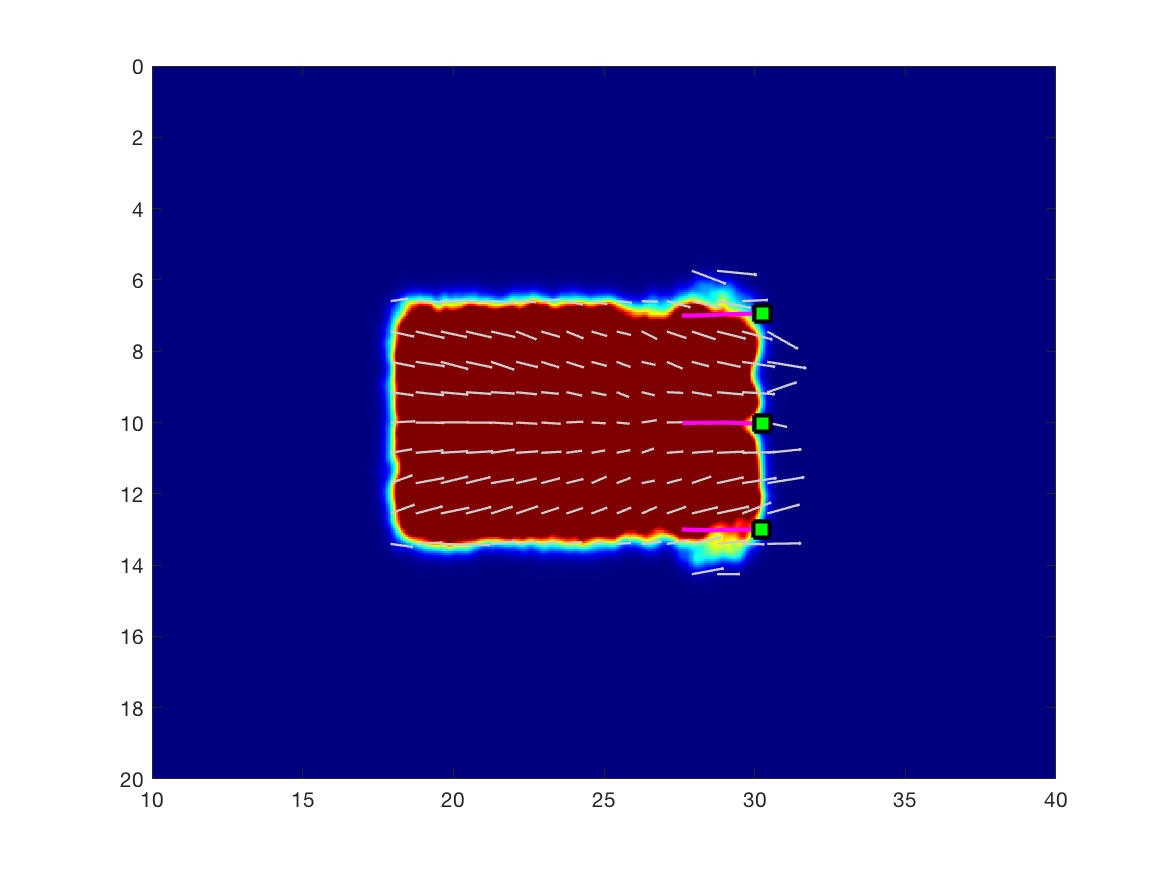
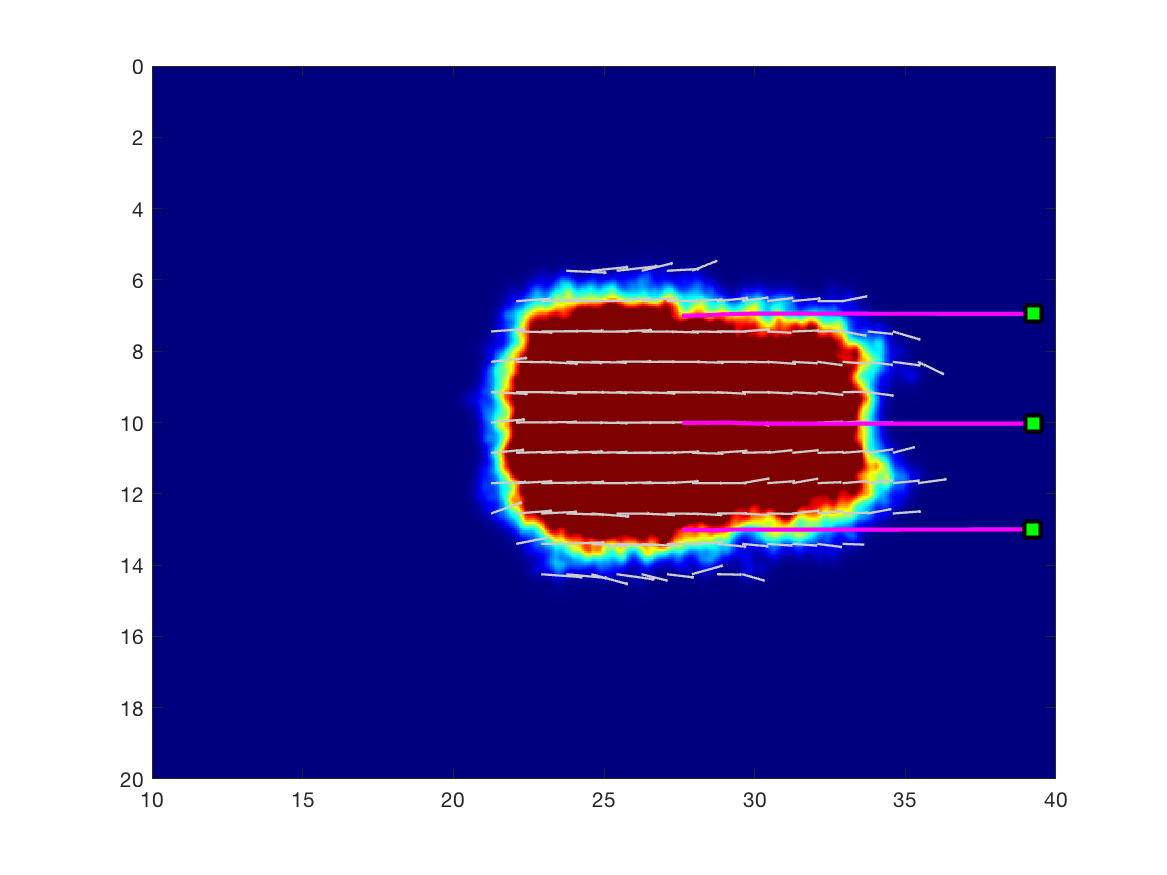
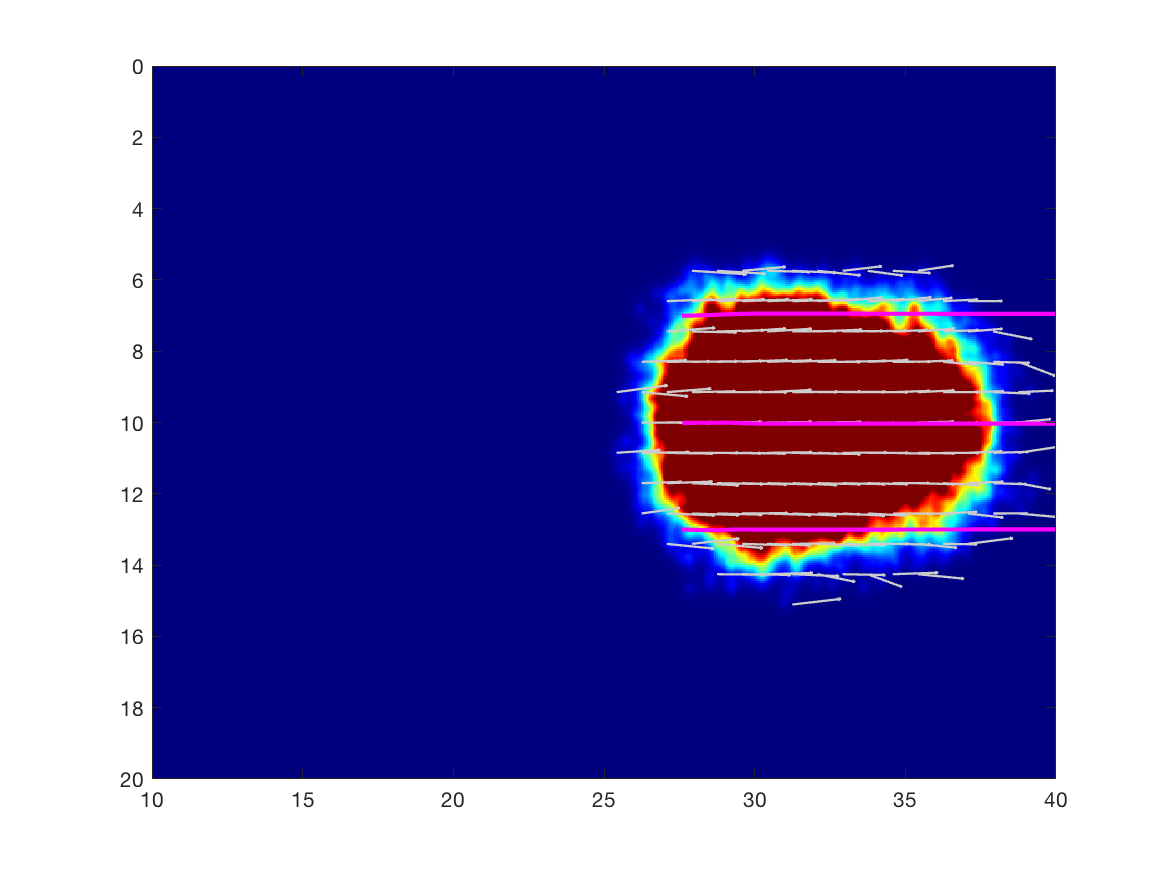
In Figure 1 we observe the evolution of microscopic and mesoscopic models density for visible leaders and speed . In both cases is evident that the visibility plays a central role in attracting the whole crowd in the direction of leaders movement.


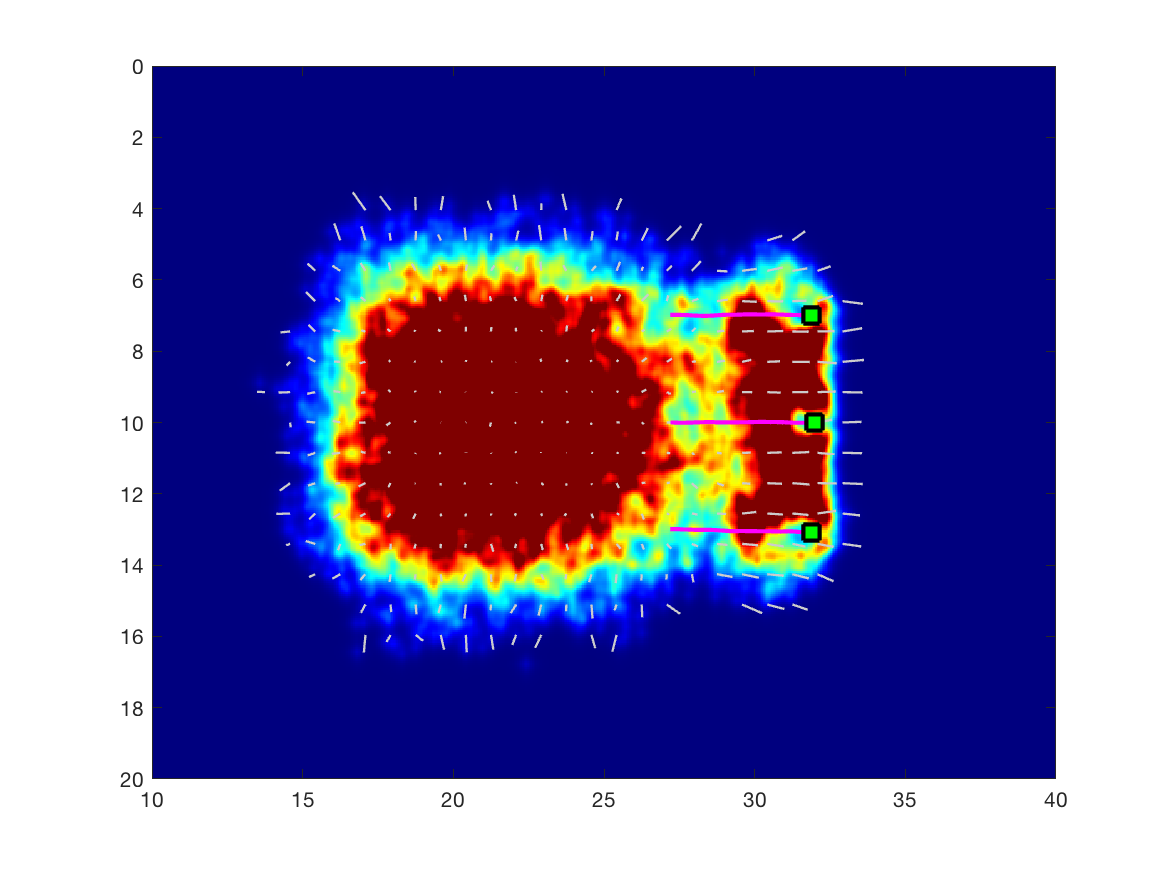

In Figure 2 we observe the same situation with invisible leaders reducing the speed to , in order to let the leaders interact for longer time with the followers. Indeed, in this case the followers are only partially influenced by the leaders, and only the mass close to them is driven towards the right direction, the remaining part spreads in the domain.
These experiments confirm that the action of invisible leaders is in general more subtle on the crowd influence, and determining effective strategies poses an additional challenge to the crowd control.
Moreover we can also infer that for the invisible case the initial positioning of leaders is of paramount importance to maximize their impact on the crowd dynamics.
S#2: Invisible leaders guiding a crowd
We consider now the case of invisible leaders. We compare microscopic and mesoscopic framework and the evolution of the followers according to three strategies of the leaders:
-
•
no action (leaders behave as normal followers);
-
•
go-to-target (leaders point straight at the target);
-
•
optimized strategy (an optimization algorithm is used to find the optimal strategy with respect to some criterion).
Differently from S#1 the crowd is now placed between the leaders and the exit. In this way leaders, moving to the exit, break more easily the initial uncertainty and triggers the crowd of followers toward the correct direction.
Microscopic model.
Figure 3(first row) shows the evolution of the agents computed by the microscopic model, without leaders. Followers having a direct view of the exit immediately point towards it, and some group mates close to them follow thanks to the alignment force. On the contrary, farthest people split in several but cohesive groups with random direction and never reach the exit.


Figure 3(second row) shows the evolution of the agents with three leaders. The leaders’ strategy is defined manually. More precisely, at any time the control is equal to the unit vector pointing towards the exit from the current position (go-to-target strategy).
The initial position of the leaders play a central role. Indeed having placed them on the left-side of the crowd, their motion generates a larger influence into the followers dynamics. This is in contrast with the behavior observed in Figure 1: where only a small portion of the pedestrians was triggered by the leaders positioned on the right-hand side of the crowds.
Note also that the final leaders’ trajectories are not straight lines because of the additional repulsion force. As it can be seen, the crowd behavior changes completely since, this time, the whole crowd reaches the exit. However followers form a heavy congestion around the exit. It is interesting to note that the shape of the congestion is circular: this is in line with the results of other social force models as well as physical observation, which report the formation of an “arch” near the exits. The arch is correctly substituted here by a full circle due to the absence of walls. Note that the congestion notably delays the evacuation. This suggests that the strategy of the leaders is not optimal and can be improved by an optimization method.
Fig. 3(third row) shows the evolution of the agents with three leaders and the optimal strategy obtained by the compass search algorithm. Surprisingly enough, the optimizator prescribes that leaders divert some pedestrians from the right direction, so as not to steer the whole crowd to the exit at the same time. In this way congestion is avoided and pedestrian flow through the exit is increased.
In this test we have also run the MPC optimization, including a box constraint . We choose , and . MPC results are consistent in the sense that for , the algorithm recovers a controlled behavior similar to the application of the instantaneous controller (or go-to-target strategy). Increasing the time frame up to improves both congestion and evacuation times, but results still remain non competitive if compared to the whole time frame optimization performed with a compass search.
In Fig. 4 we compare the occupancy of the exit’s visibility zone as a function of time for go-to-target strategy and optimal strategies (compass search, 2-step, and 6-step MPC). We also show the decrease of the value function as a function of attempts (compass search) and time (MPC). Evacuation times are compared in Table 2. It can be seen that only the long-term optimization strategies are efficient, being able to moderate congestion and clogging around the exit.


| no leaders | go-to-target | 2-MPC | 6-MPC | CS (IG) | |
|---|---|---|---|---|---|
| 335 | 297 | 342 | 278 | 248 (318) | |
| 629 | 619 | 491 | 459 (554) |
This suggests a quite unethical but effective evacuation procedure, namely misleading some people to a false target and then leading them back to the right one, when exit conditions are safer. Note that in real-life situations, most of the injuries are actually caused by overcompression and suffocation rather than urgency.
Mesoscopic model
We consider here the case of a continuous density of followers. Figure 5(first row) shows the evolution of the uncontrolled system of followers. Due to the diffusion term and the topological alignment, large part of the mass spreads around the domain and is not able to reach the target exit.
In Fig. 5(second row) we account the action of three leaders, driven by a go-to-target strategy defined as in the microscopic case. It is clear that also in this case the action of leaders is able to influence the system and promote the evacuation, but the presence of the diffusive term causes the dispersion of part of the continuous density. The result is that part of the mass is not able to evacuate, unlike the microscopic case.
In order to improve the go-to-target strategy we rely on the compass search, where, differently from the microscopic case, the optimization process accounts the objective functional (23), i.e., the total mass evacuated at final time. Figure 5(third row) sketches the optimal strategy found in this way: on one hand, the two external leaders go directly towards the exit, evacuating part of the density; on the other hand the central leader moves slowly backward, misleading part of the density and only later it moves forwards towards the exit. The efficiency of the leaders’ strategy is due in particular by the latter movement of the last leader, which is able to gather the followers’ density left behind by the others, and to reduce the occupancy of the exit’s visibility area by delaying the arrival of part of the mass.


In Figure 6 we summarize, for the three numerical experiments, the evacuated mass and the occupancy of the exit’s visibility area as functions of time. In the right plot the occupancy of the exit’s visibility area shows clearly the difference between the leaders’ action: for the go-to-target strategy, the amount of mass occupying concentrates and the evacuation is partially hindered by the clogging effect, as only 66.3% of the total mass is evacuated. The optimal strategy (obtained after 30 iterations) is able to better distribute the mass arrival in , and an higher efficiency is reached, evacuating up to 84.1% of the total mass.


S#3: Invisible leaders in presence of obstacles
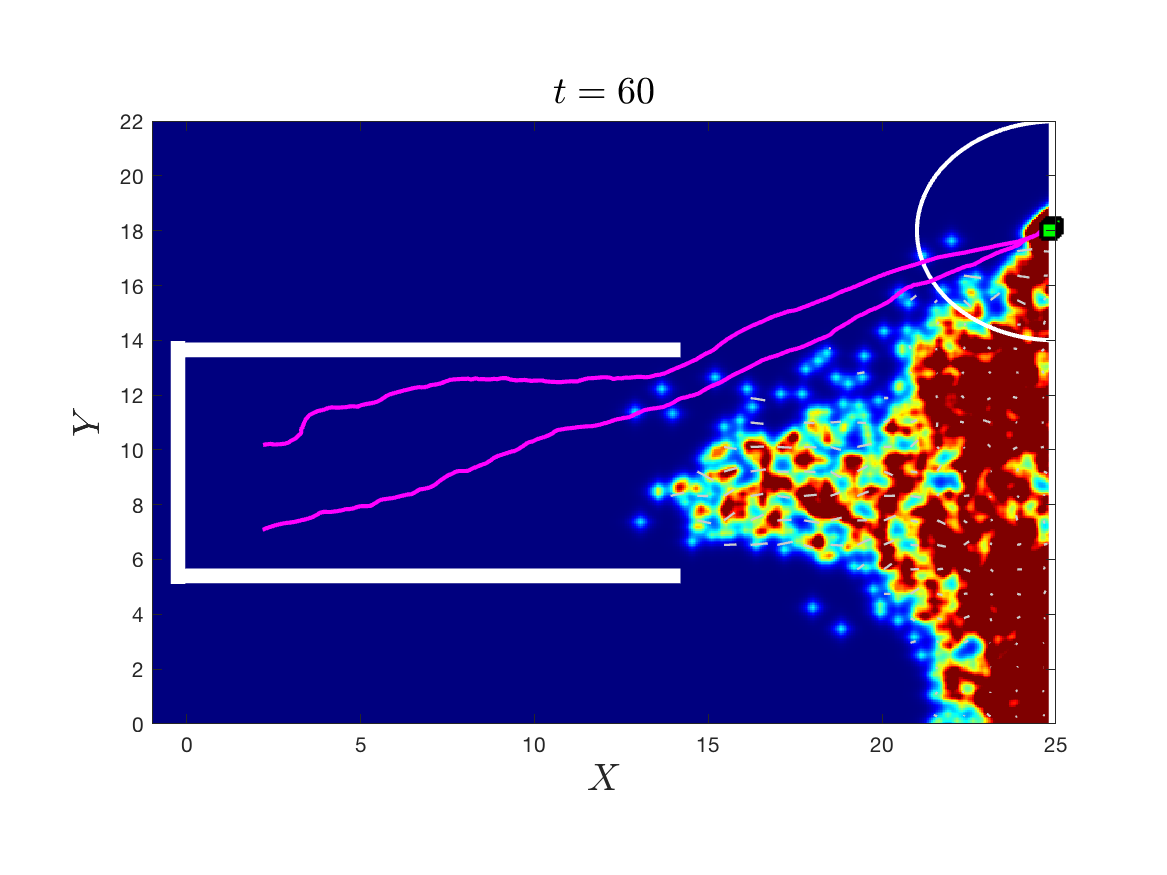
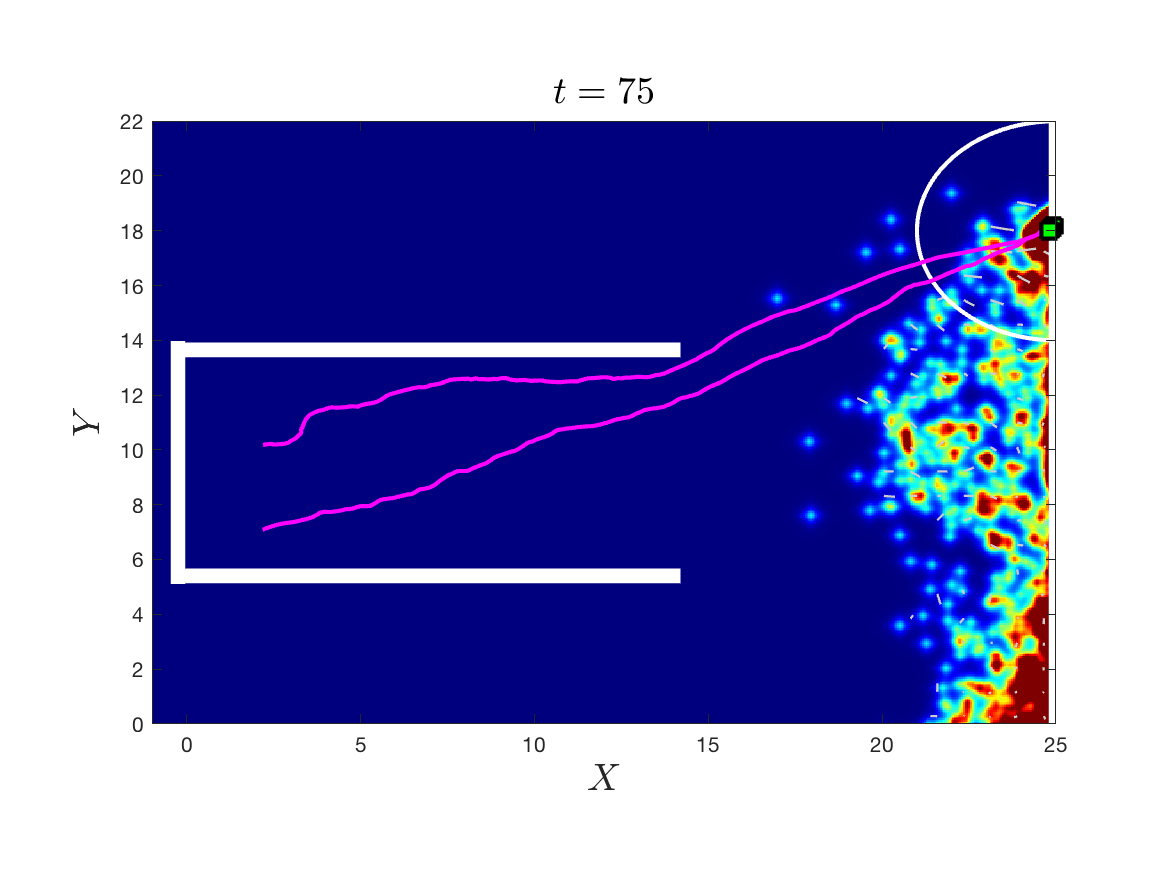
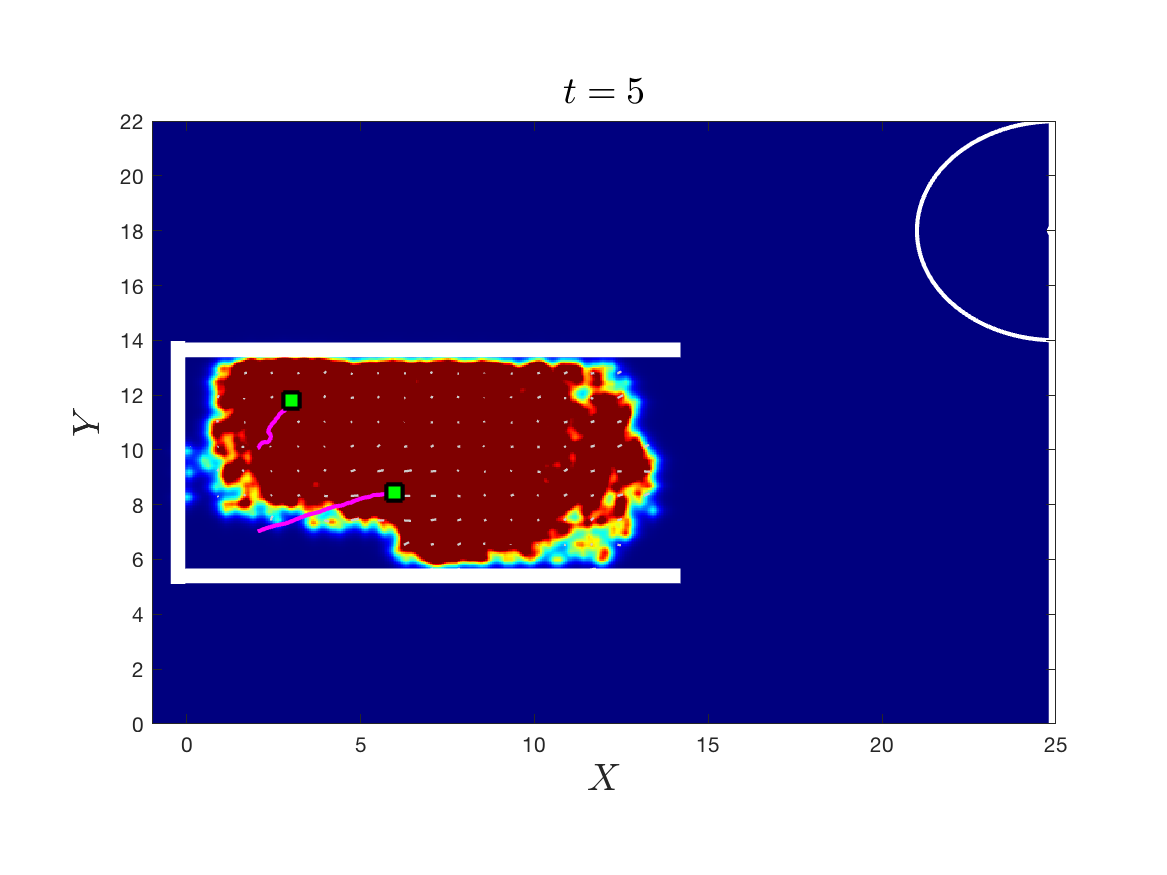
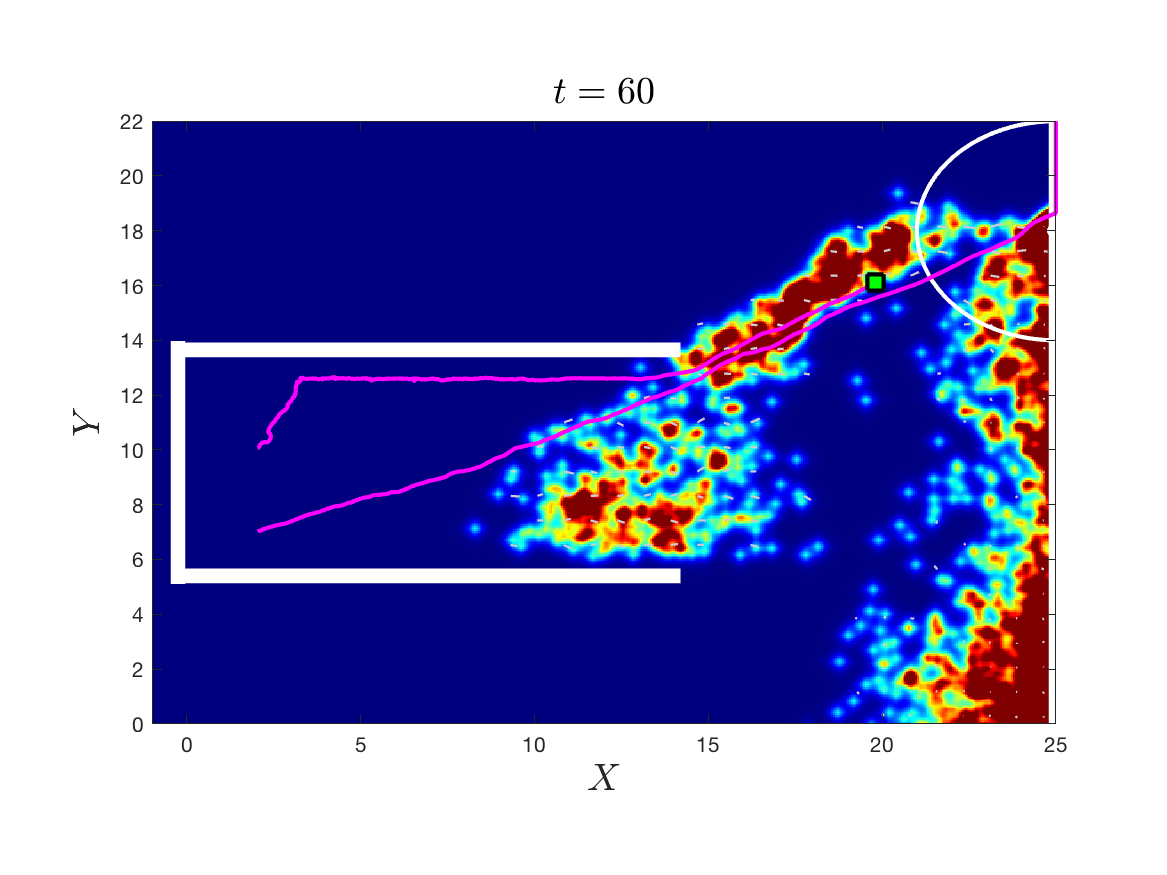
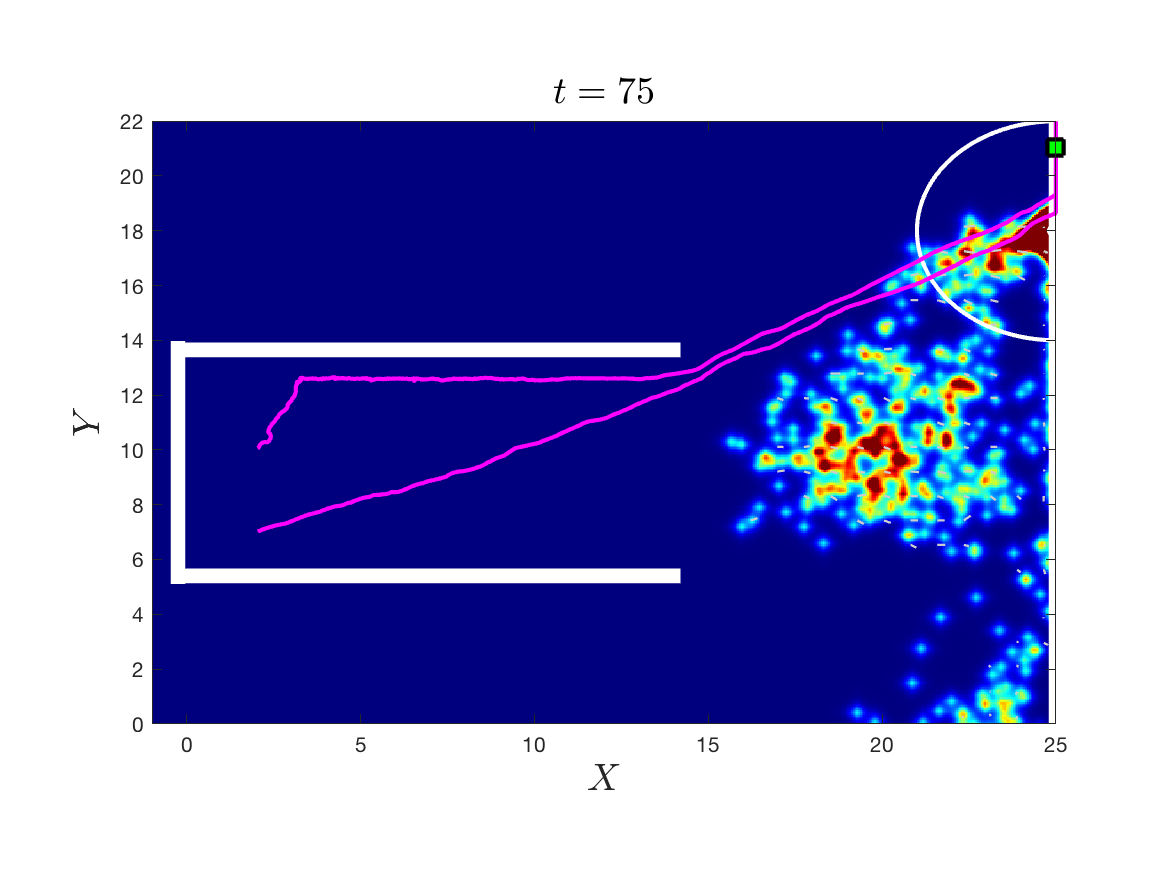
Finally we test the microscopic and mesoscopic model in presence of obstacles. The crowd is initially confined in a rectangular room with three walls. In order to evacuate, people must first leave the room and then search for the exit point. We assume that walls are not visible, i.e., people can perceive them only by physical contact. This corresponds to an evacuation in case of null visibility (but for the exit point which is still visible from within ). Walls are handled as in cristiani2011MMS .
Microscopic model
In Figure 7(first row) we observe the case where no leaders are present: the crowd splits in several groups and most of the people hit the wall. After some attempts the crowd finds the way out, and then it crashes into the right boundary of the domain. Finally, by chance people decide, en cascade, to go upward. The crowd leaves the domain in 1162 time steps.
If instead we hide in the crowd two leaders who point fast towards the exit (Fig. 7(second row)), the evacuation from the room is completed in very short time, but after that, the influence of the leaders vanishes. Unfortunately, this time people decide to go downward after hitting the right boundary, and nobody leaves the domain. Slowing down the two leaders helps keeping the leaders’ influence for longer time, although it is quite difficult to find a good choice.
Compass search optimization finds (after 30 iterations) a nice strategy for the two leaders which remarkably improves the evacuation time, see Fig. 7(third row). One leader behaves similarly to the previous case, while the other diverts the crowd pointing SE, then comes back to wait for the crowd, and finally points NE towards the exit. This strategy allows to bring everyone to the exit in 549 time steps, without bumping anyone against the boundary, and avoiding congestion near the exit.


Mesoscopic model
In Figure 8 we report the evolution of the mesoscopic density of followers. First row shows the evolution of the uncontrolled case, contrary to the microscopic in this case evacuation is not reached: the mass slowly diffuse outside the corridor and move in the opposite direction with respect the target exit, only a small percentage of the mass is able to evacuate.
Second rows depicts the case with two leaders and a go-to-target strategy, positioned at the end of the corridor. Their movements are able to influence large part of the crowd, at final time 67.2% of the mass is evacuated.
Employing the compass search method we show in the bottom row of Figure 8 an improvement of the go-to-target strategy (after 9 iterations). In this case evacuation of the 72.4% of the total mass is reached: one of the two leaders deviates from the original direction, slowing down part of the mass. Similarly to the optimal strategy retrieved in S#2, the optimization suggests to avoid congestion around the exit.
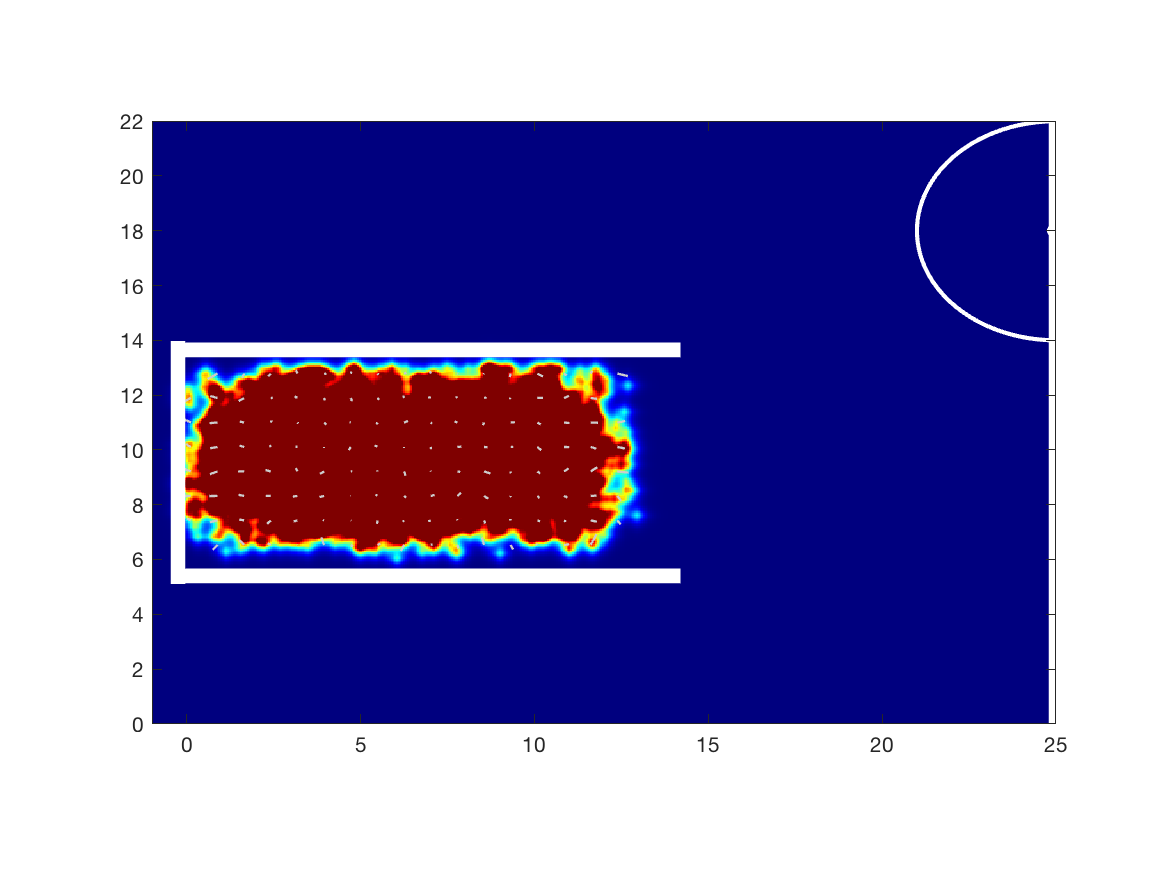
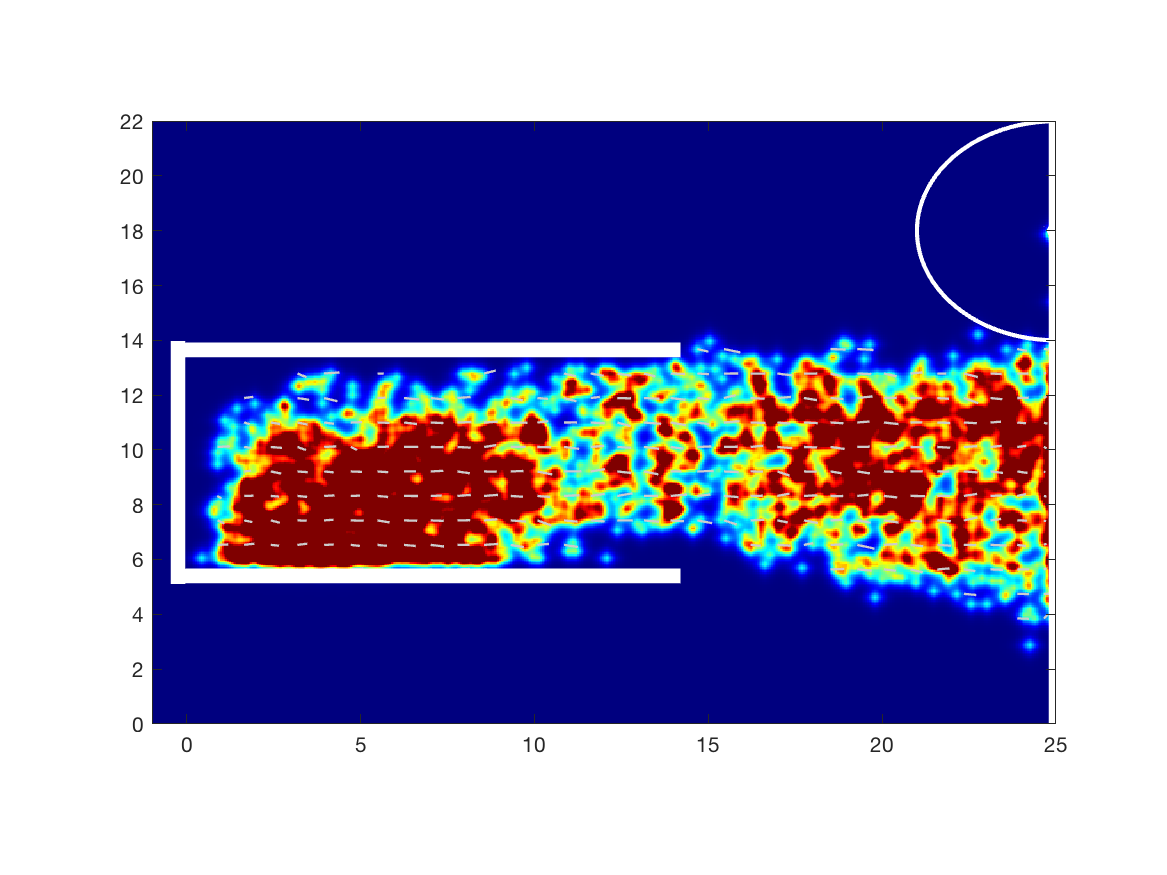
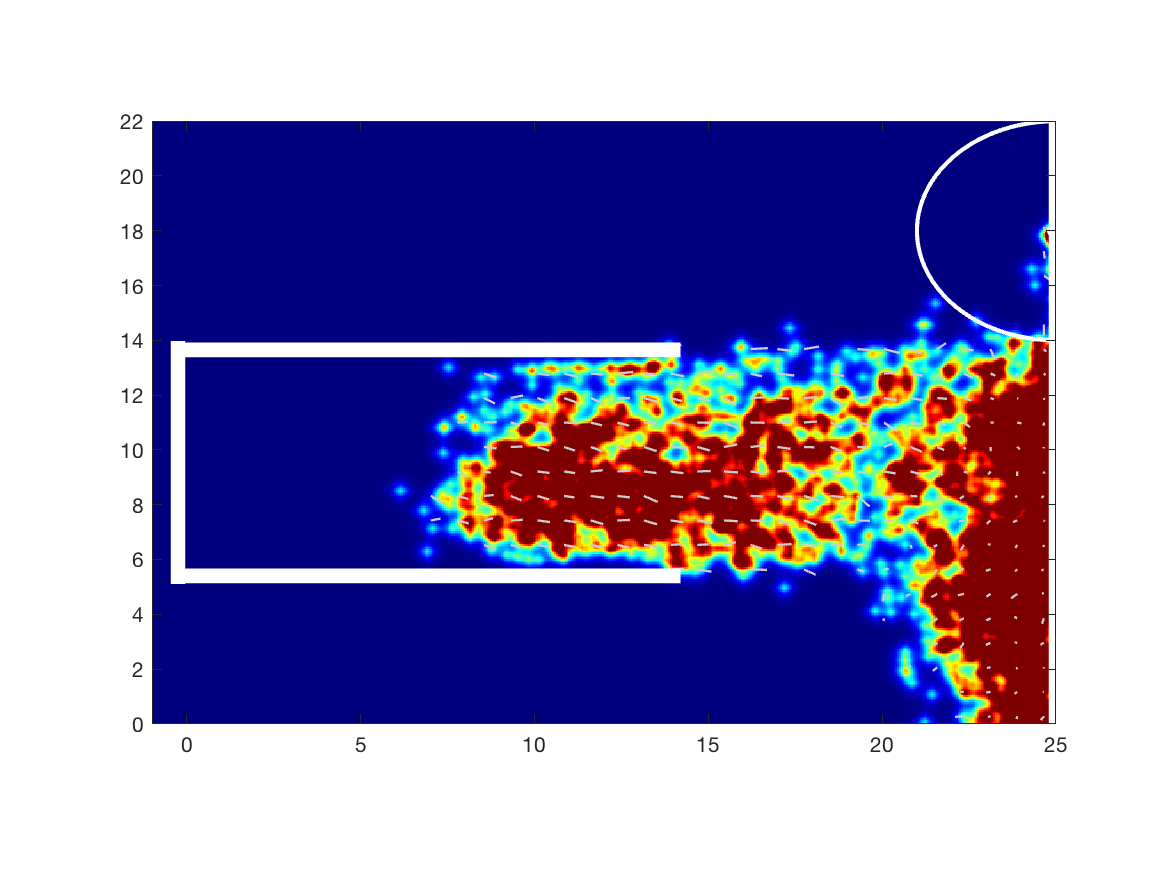
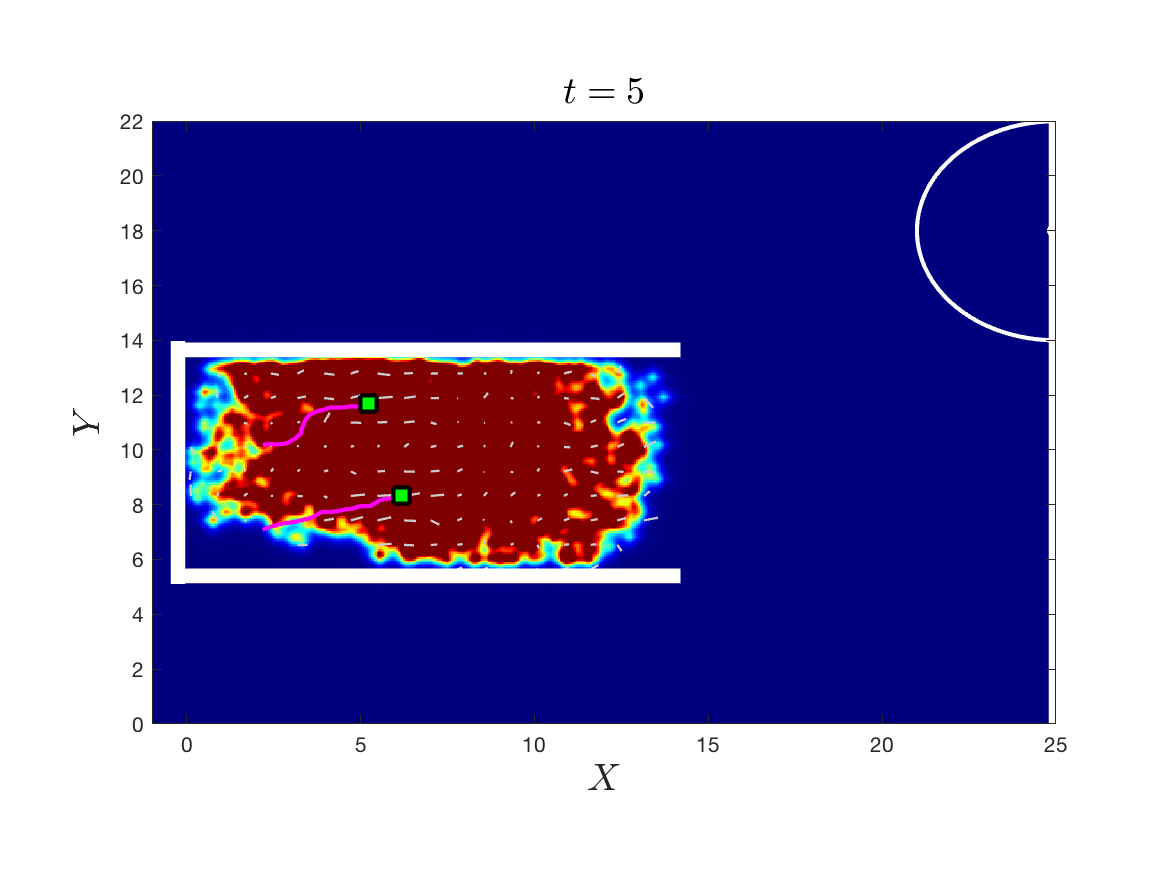
We compare in Figure 9 the outcomes of the three different situations. The left plot reports the percentage of evacuated mass as a function of time, On the right we depict the occupancy of the visibility area. We observe that also in this case the optimal strategy suggests to decrease the congestion around the exit in order to increase the total mass evacuated.


4 Crowd controls through smart obstacles
The exploration activity of an unknown environment by a group of pedestrians may become crucial if the time of egress represents a critical variable. This could not be only connected with a specific state of danger, like in case of fire or earthquake, because even staying too long into an environment can be undesirable. For this reason, several signals and other indications need to be accurately located in order to correctly address a crowd entering a room. Unfortunately, in case of low visibility, the classical signage cannot be perceived, and other devices can be adopted to this aim, like lighting and sound effects.
Also the shape of the room can be designed to facilitate the egress. Walls or obstacles can be shaped in order to operate a guidance of the crowd, and several studies gave evidence of the usefulness of this strategy cristiani2017AMM ; cristiani2019AMM . On the other hand, the number of obstacles cannot be too large, in order to preserve the original purpose of the room. As an extreme situation, if we lock every useless passage of a maze, we are minimizing the egress time, but we have no longer a maze.
In the following, we are illustrating the activity of optimization of the position of a number of fixed walls to minimize the egress time of a crowd from a simple square room with four entrance and four exit. The simulation of the crowd movement is performed by means of the micro-scale model previously described in Section 2.
4.1 Selection of the objective function
Due to the presence of a random component in the speed of the single pedestrian, the final egress time of the crowd estimated by the numerical model is a stochastic outcome. If we want to utilize this quantity as the objective function of an optimization problem, a statistical approach is essential. We can compute the expected value if we repeat the simulation a large number of times, but this data is, in our opinion, still not sufficiently representative. In fact, the variability of the egress time is also fundamental. For this reason, we are here considering as objective function the sum of expected value plus their variance,
With this definition, we can assure with a probability of 80.15% that the egress time is lower than (if the egress time follows a normal distribution).
Now we need to have an estimate of the number of times we need to repeat the simulation in order to have a stable value of the statistical indicators. To do that, some numerical tests have been produced. The simulator has been run for a number of times, and this block of simulations have been repeated for 256 times. For each block, we can compute the expected value and the variance: after that, we can also analyze statistically the 256 blocks, computing the effective value and variance of the elementary expected value. Results are reported in Figure 10.
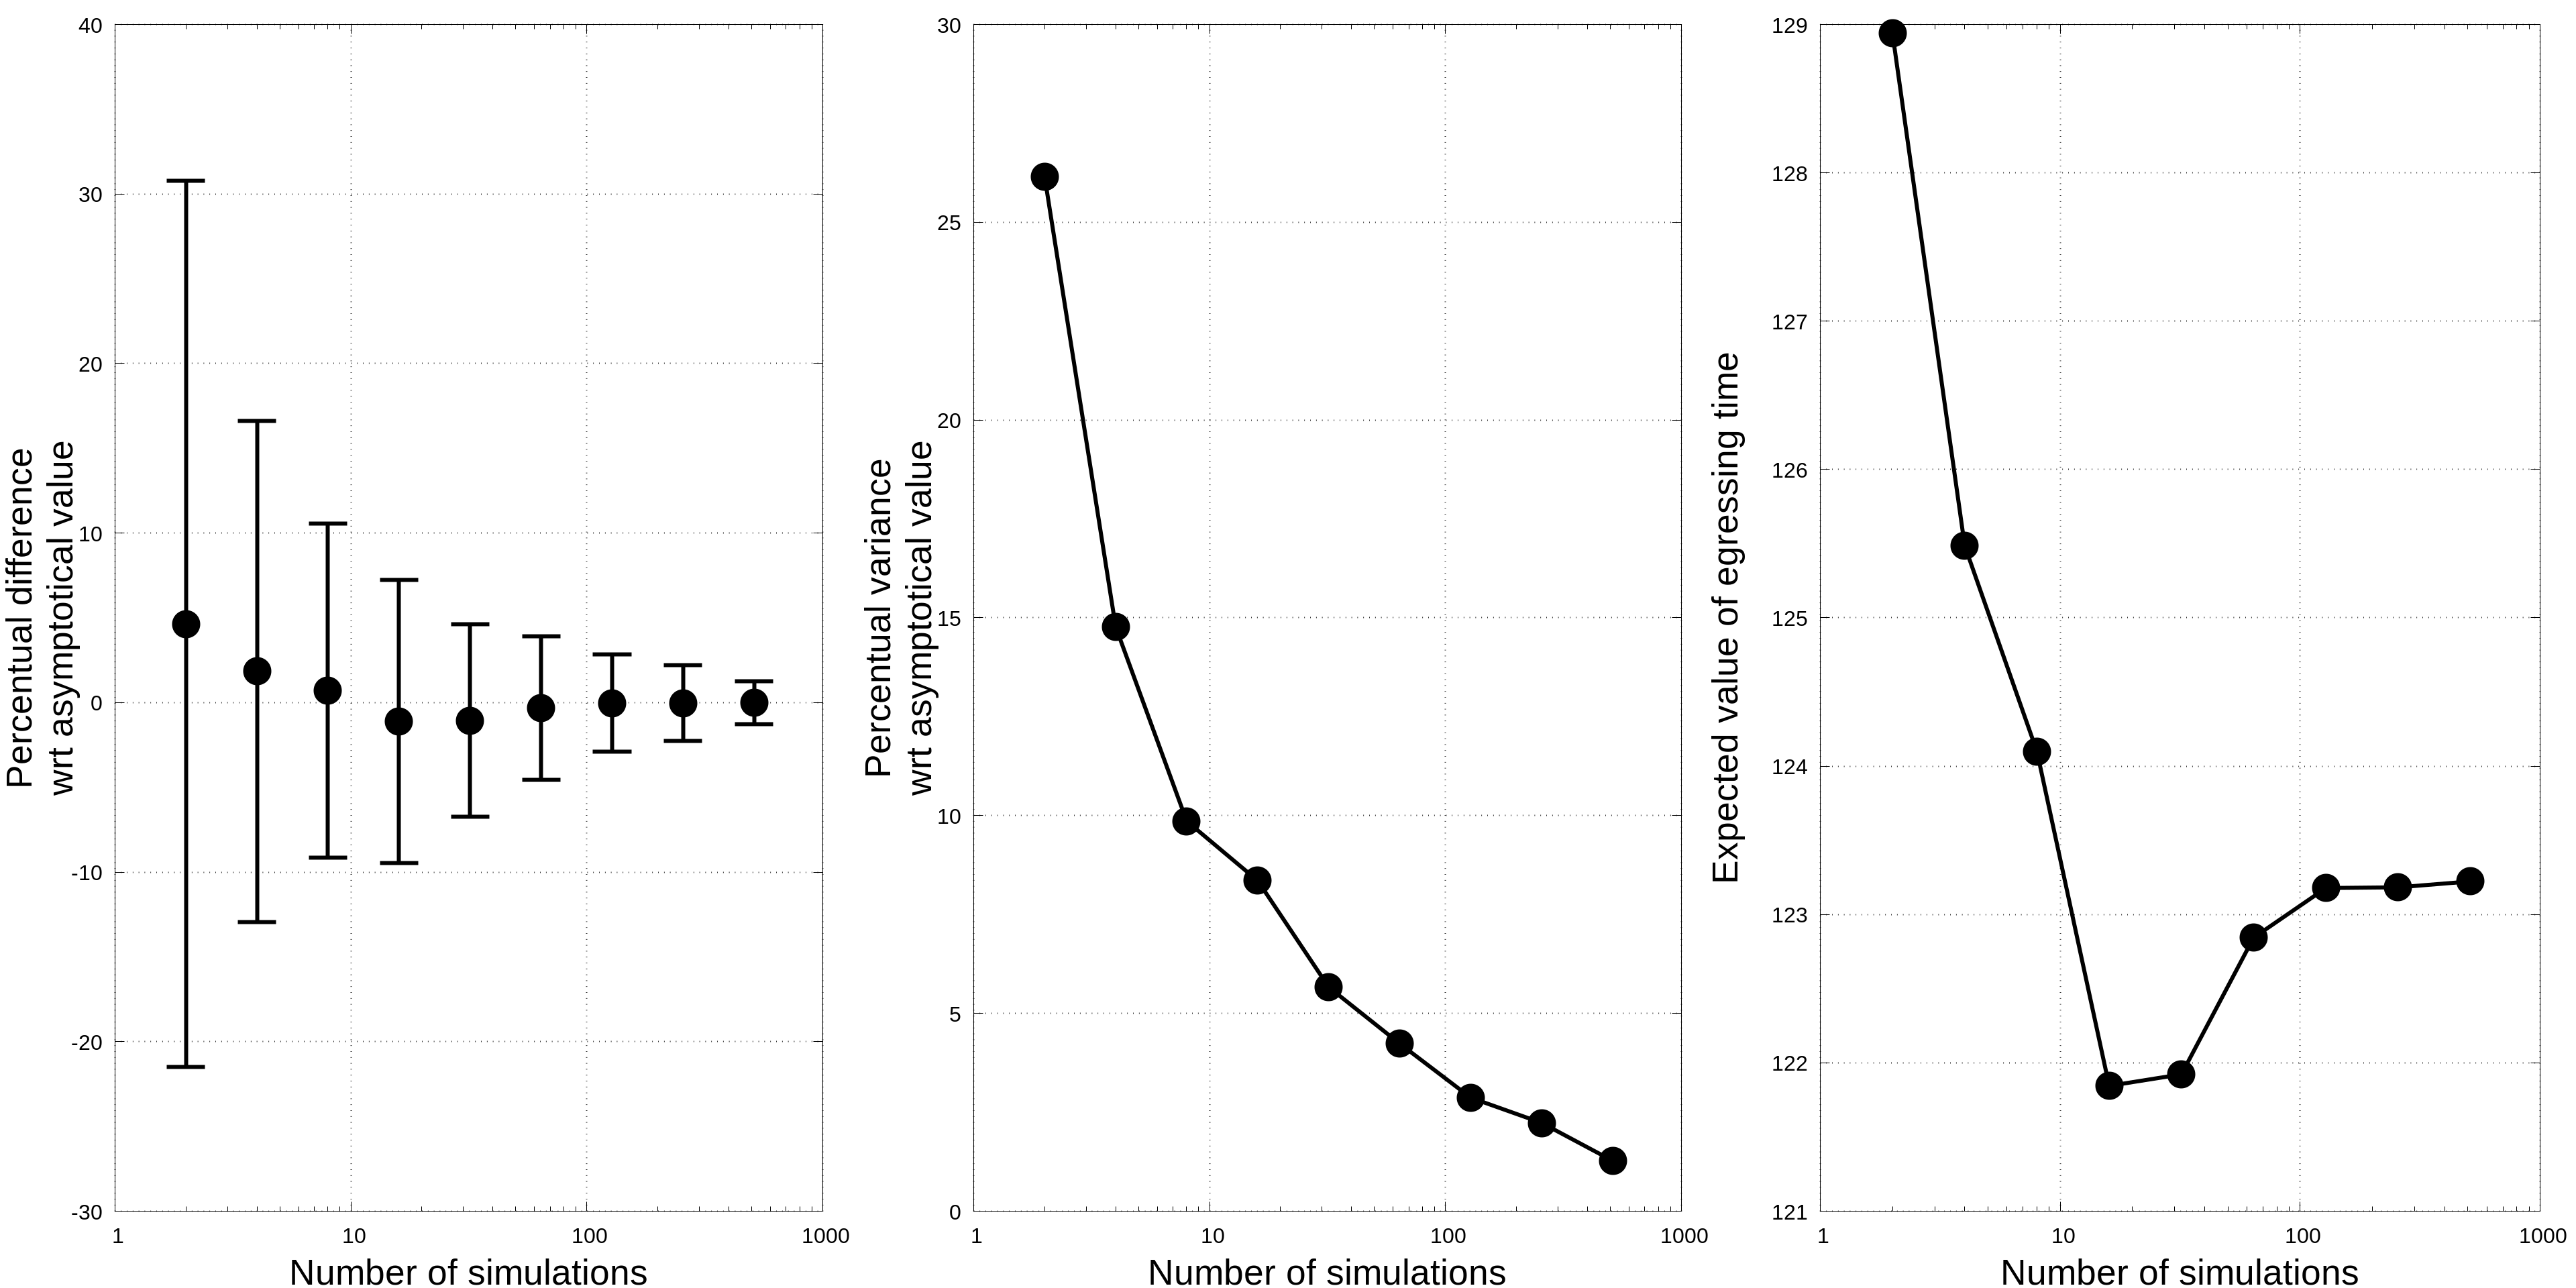
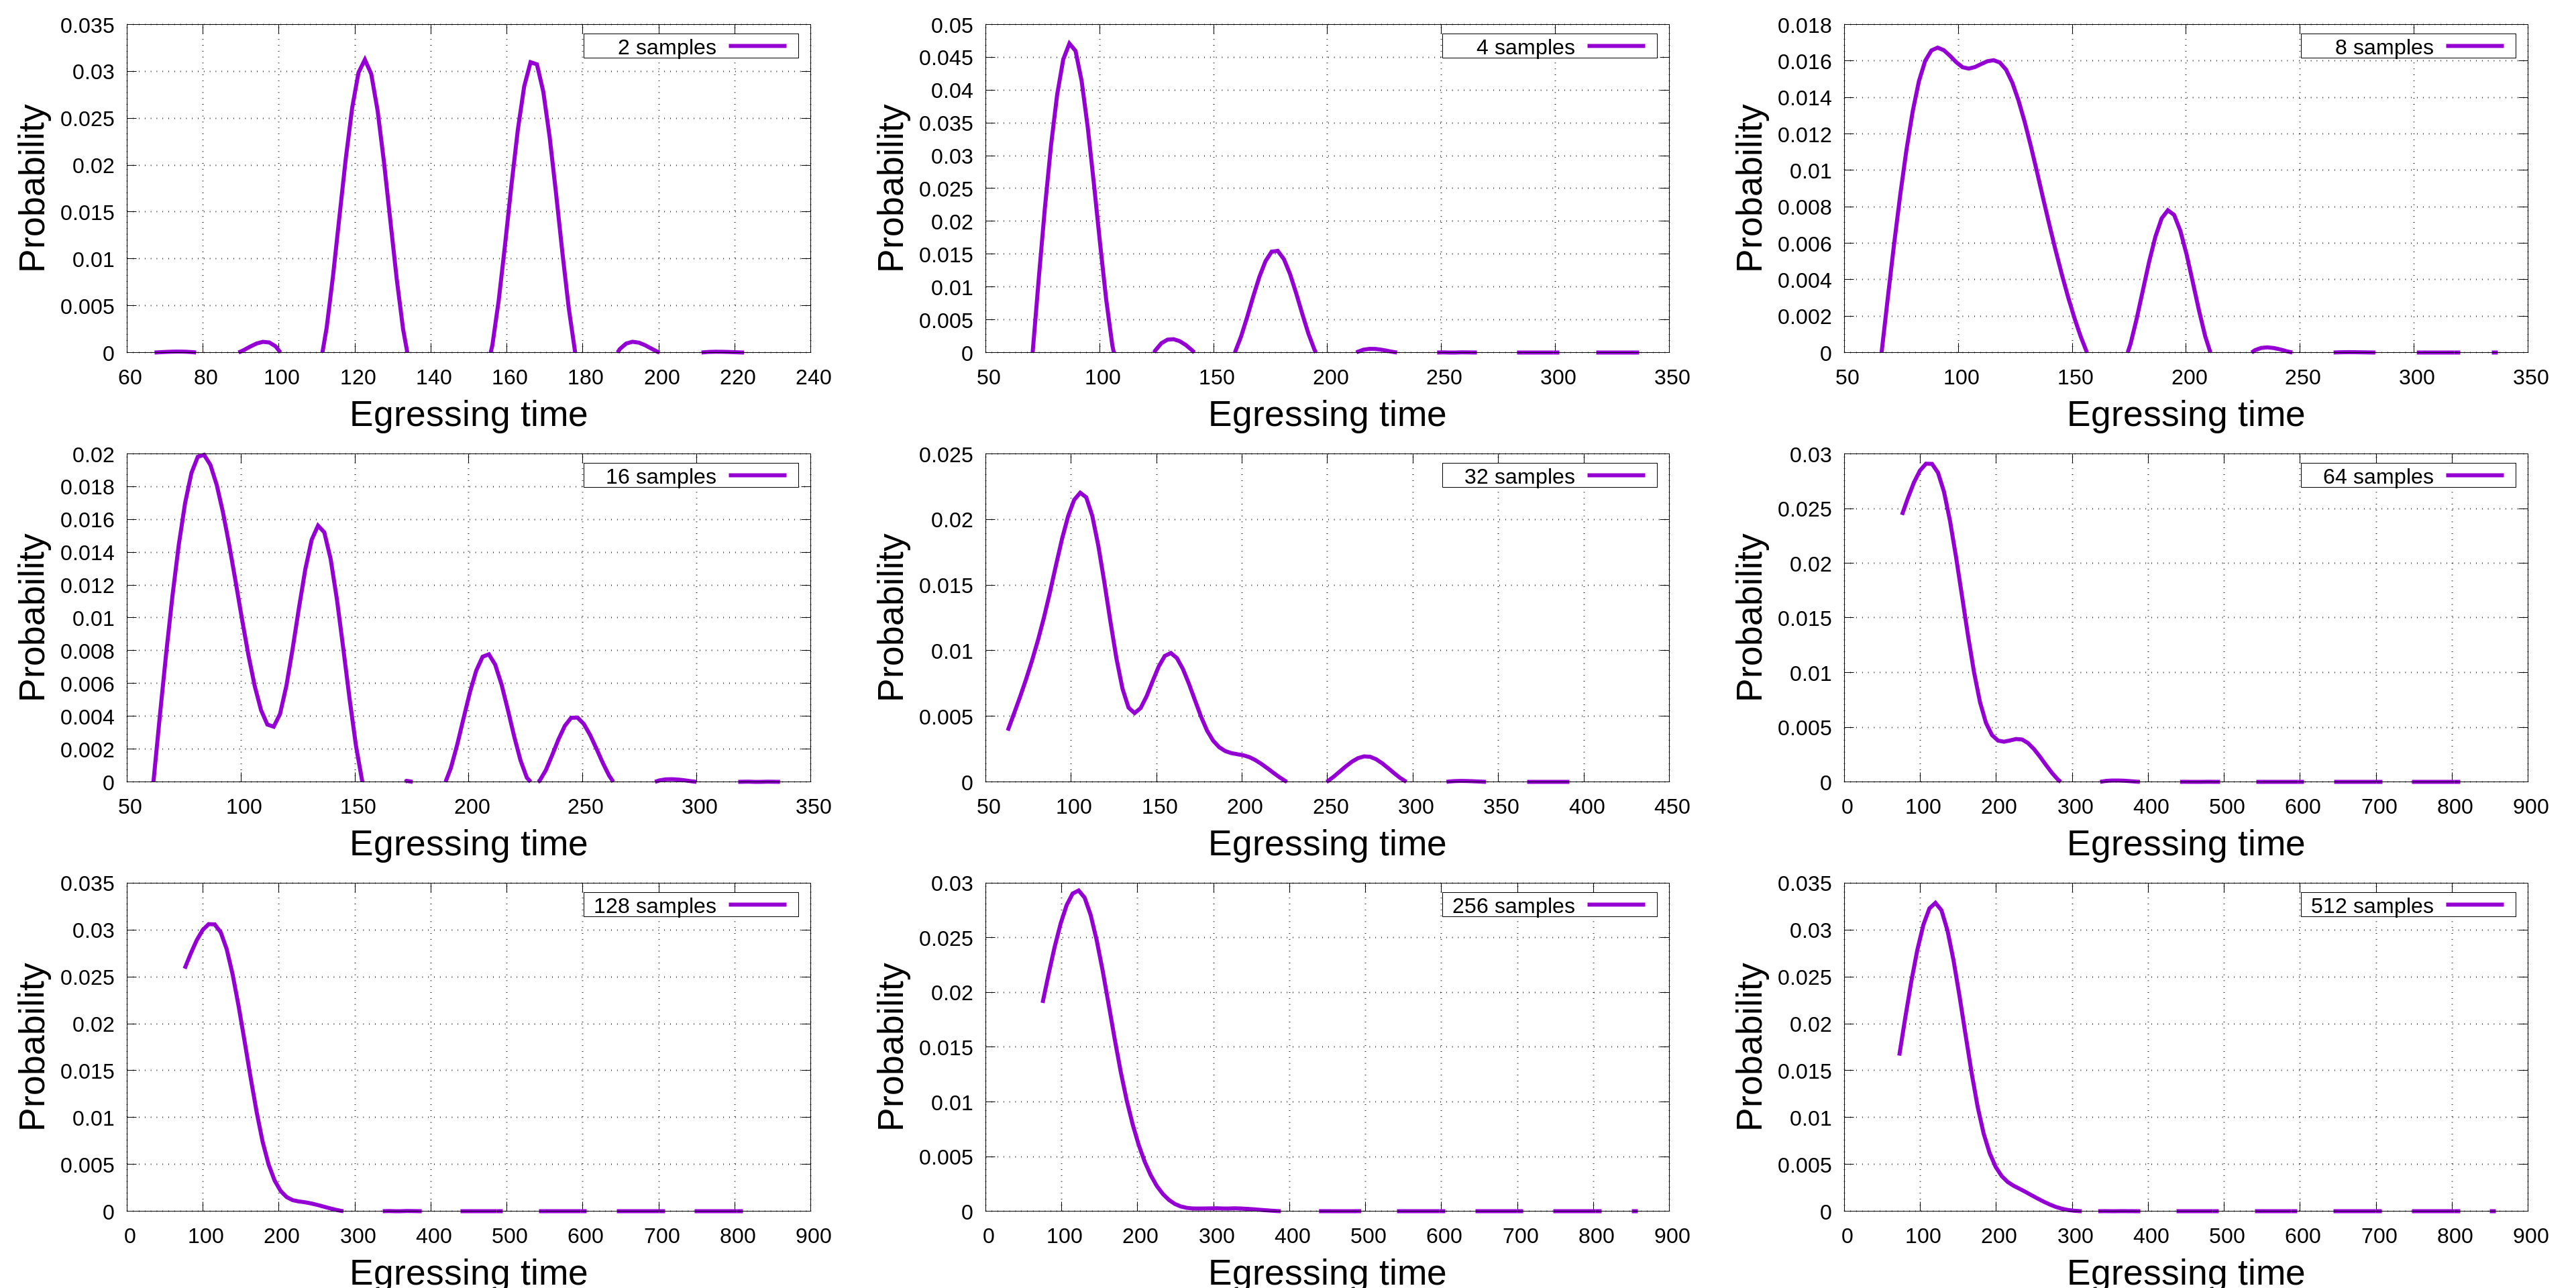
The experimental probability distribution (EPD) of the expected value for the different blocks of simulations is reported in Figure 11. From this picture, it is evident that a stable value of the expected value cannot be obtained if the number of simulations for each block is lower than 128. This information is also deducible observing the right sub-graph of Figure 10: the expected value becomes stable for the indicated number of simulations. As a consequence, in the following 256 simulations will be applied in order to evaluate the qualities of a room configuration.
4.2 Optimization algorithm
In this study, an heuristic optimization algorithm is adopted, namely the Imperialist Competitive Algorithm (ICA). In its original formulation Atashpaz2007 , the ICA is described as an evolutionary algorithm. A number of trial vectors of parameters, each defining a different configuration of the system (county), are distributed onto the design space and assigned to different groups: each group is called empire. The county presenting the most convenient value of the objective function inside a empire is called imperialist, and each county is placed under the control of a single imperialist. Since here we are referring to a minimization problem, the most convenient value is represented by the lower value of the objective function. More details about the algorithm can be found in Atashpaz2007 . In the original formulation, the initialization of the counties is performed randomly. The counties are then assigned to an imperialist on the base of their relative power, so that, at the beginning, the most powerful imperialist have the control of a larger empire. At each iteration, three main actions are performed:
-
•
Shifting the counties: each county is moved toward the imperialist according to the equation
(24) where is the generic vector of the coordinates of a point in the design variable space, is the position of the (fixed) imperialist controlling the moving county , is the current iteration, is identifying the county, is the so-called assimilation coefficient, controlling the atractive action of the imperialist on the county and is a random number in between 0 and 1. If the product is greater than the unit value, the county will overpass the imperialist, changing the side from which the county observes the imperialist. The displacement vector () is further deviated from the indicated direction by a random angle in between - and +, to be fixed.
-
•
Change of the imperialist: if a county finds a value of the objective function smaller than the value owned by the referenced imperialist, the positions of the county and the imperialist are swapped.
-
•
Imperialistic competition: the power of each empire is computed as the power of the imperialist plus a fraction of the sum of the powers of the single counties of the empire. The worst county of the worst empire is re-assigned to the best empire. In a minimization process, the average value of the power of the counties is summed up to the power of the imperialist: lower value means higher power.
-
•
Empire elimination: if, after the Imperialistic Competition, an Imperialist have no more counties under hits control, the empire is eliminated.
Looking at equation (24), we can observe the full equivalence with the one dimensional, first-order, autonomous, linear differential equation that governs the evolution of a state variable
| (25) |
In fact, equation (25) is absolutely equivalent to equation (24) once we rewrite it in the reference frame of the imperialist. Since the value of the state variables are assigned at the beginning, that is, the relative position of the county with respect to the imperialist, at the first step we have
| (26) |
Applying the equation (25), we have that at step
| (27) |
If , we can demonstrate that, if , the series converges to the zero value (the origin of the reference frame) Galor:2007 . Since the local reference frame of an Empire coincides with an imperialist, each county converges toward the corresponding imperialist. To be more explicit, we can simplify the equation (24) by rewriting it in the reference frame of the imperialist: the term disappears, and the equation now reads
We are clearly in the case of equation (25) where and . The motion is developing along the direction connecting the initial position of the county and the origin of the reference frame (that is, the imperialist). The county is converging on the corresponding imperialist: convergence is monotone or not depending on the value of . Since the coefficient needs to be positive and smaller than the unit value in order to have convergence Galor:2007 , we have convergence if
The different terminology adopted for the description of the algorithm is hiding a substantial similarity between ICA and the multi-swarm Particle Swarm Optimization (PSO) formulation Hendtlass . With respect to the original formulation of PSO, the ICA has not a personal memory, so that the new position of a county is not influenced by the positions previously visited by itself, while PSO is using this information. Conversely, both PSO and ICA show a limited interaction with the other elements of the empire: in fact, the Imperialist is the equivalent of the best element of PSO, that is, the best visit of the whole swarm/empire. The great difference with PSO is the aforementioned proof of convergence of ICA, while for PSO an incomplete proof of convergence can be obtained Clerc .
An improvement of the original ICA is proposed in peri2019CAIE , namely hICA, and this version of the algorithm is here applied. The improvements obtained by ICA can be addressed mainly to the following modifications:
-
1.
The initial distribution of the counties is not random, but it is produced using an Uniformly Distributed Sequence.
-
2.
The coefficients in equation (24) have been optimized.
-
3.
The empires are re-initialized if only a single empire is survived.
-
4.
A local search algorithm (Simplex method) is applied if we have no improvements of the current best solution after a certain number of iterations. This is surely one of the main improvements of the algorithm.
4.3 Test case
In order to empathize the ability of a fixed obstacle to efficiently redirect the flow of a group of pedestrians, such that the evacuation time is minimized, a very simple test case has been designed. Four entrance and four exit are symmetrically placed in a square room. The entrances are at the corners, the exit at the center of each side of the room. The role of the obstacle(s), in this case, is to break the symmetry of the flow, avoiding indecision (and the subsequent dead time) when different sub-groups are colliding, exploiting also all the exits.
The full number of pedestrians has been fixed to 100, in order to have a good balance between interactions and computational time. Simulation has been repeated 256 times for each configuration of the room in order to derive statistical variables, as from the indications collected previously (Figure 10).
The only constraint is related to the distance between the wall and the obstacle, in order to avoid blockage effects (and also the exclusion of an exit or an entrance).
Regarding the selection of the obstacle(s), two different cases have been considered: one or two linear walls. A single wall is defined using four variables: two for the barycentre of the wall, one for its full length and one for the orientation (in between 0 and 90 degrees). The width of the wall is fixed. As a consequence, we have 4 design variables for a single wall and 8 design variables for a couple of walls. The design variables are selected in order to reduce the possibility of violation of the constraint, so that the barycentre of the wall cannot stay on the border of the room. Minimum and maximum length of the walls are also fixed.
Stopping criterion for the optimization algorithm is represented only by the full number of evaluations of the objective function: in order to balance the opportunities of the two optimization problems, in accordance with peri2019CAIE , the maximum number has been fixed at 1000, where is the number of design variables. Consequently, the problem with more design variables takes longer to complete.
Due to the symmetry of entrance and exit, the solution of the problem is cyclical, since four configurations can be obtained by a rotation of 90 degrees around the center of the room.
4.4 Numerical results
In Figure 12, the convergence history of the two optimization problems is reported. The rate of convergence of the two problems is very similar as soon as, in the case of two walls, the optimizer is able to identify a new solution improving largely the egress time, further refined in the last part of the optimization problem solution. On the contrary, the identification of the optimal solution for the problem with a single wall appears to be pretty fast, and only marginal improvements are obtained after a couple of iterations: this is probably connected with the simplicity of the shape of the obstacle, unable to create a great variety of convenient situations.
| % | Most probable | % | % | % | ||||
|---|---|---|---|---|---|---|---|---|
| Empty | 133.22 | 114.43 | 39.99 | 173.21 | ||||
| 1 Obs. | 114.66 | -14.10% | 100.73 | -12.28% | 36.94 | -7.63% | 151.60 | -12.48% |
| 2 Obs. | 93.50 | -29.82% | 59.71 | -48.00 % | 37.22 | -6.93% | 130.72 | -24.53% |
The objective function value, the most probable egress time, the expected value and the variance of the optimal configurations are reported in Table 3. The variance is substantially unchanged at the end of the optimization process: this is a partly unexpected result. One might therefore imagine that the regularization of the pedestrian flow, obtained through the obstacles, would also reduce the variability of the dwell time into the room. The reason of the small reduction of the variance can be linked with the constraint on the distance between the wall and the sides of the room: there is still a quite large gap between the obstacles and the borders. This gap has been introduced considering the fact the main function the room is designed for must be preserved after the insertion of the walls, so that their impact on the environment should be limited. As a consequence, the pedestrian, although driven toward the exit, have still a quite large space to explore, and the random component of the individual speed plays a not negligible role. As a consequence, the variance of the egress time is substantially not changing.

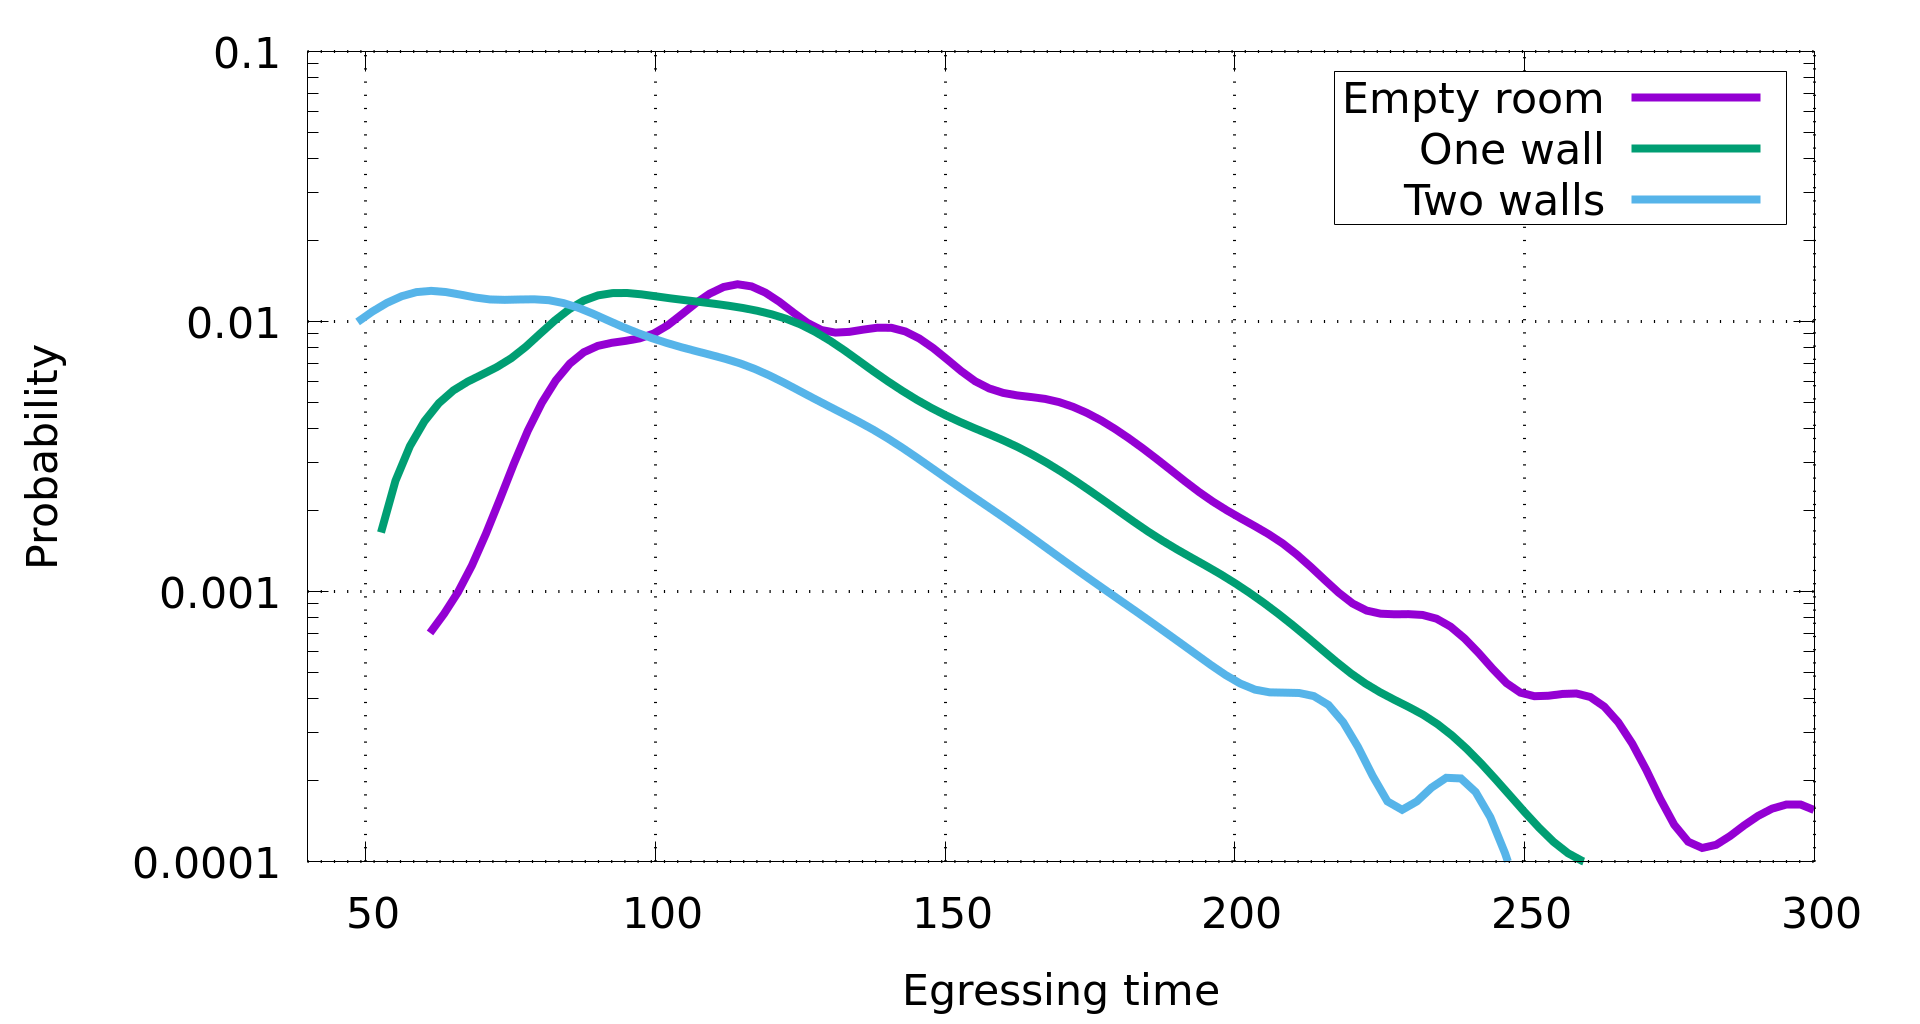
It is really interesting to compare the EPD of the egress times for the case of empty room with the ones of the optimized solutions. For these three configurations, 100,000 simulations have been produced in order to increase the stability and credibility of the statistic indicators. The most probable value of the egress time is shifted to the lower values passing from empty room to one obstacle to two obstacles, as it is also evident from Table 3. In this last case, the higher probability is very close to the minimum egress time, representing a very good feature of the optimal configuration.
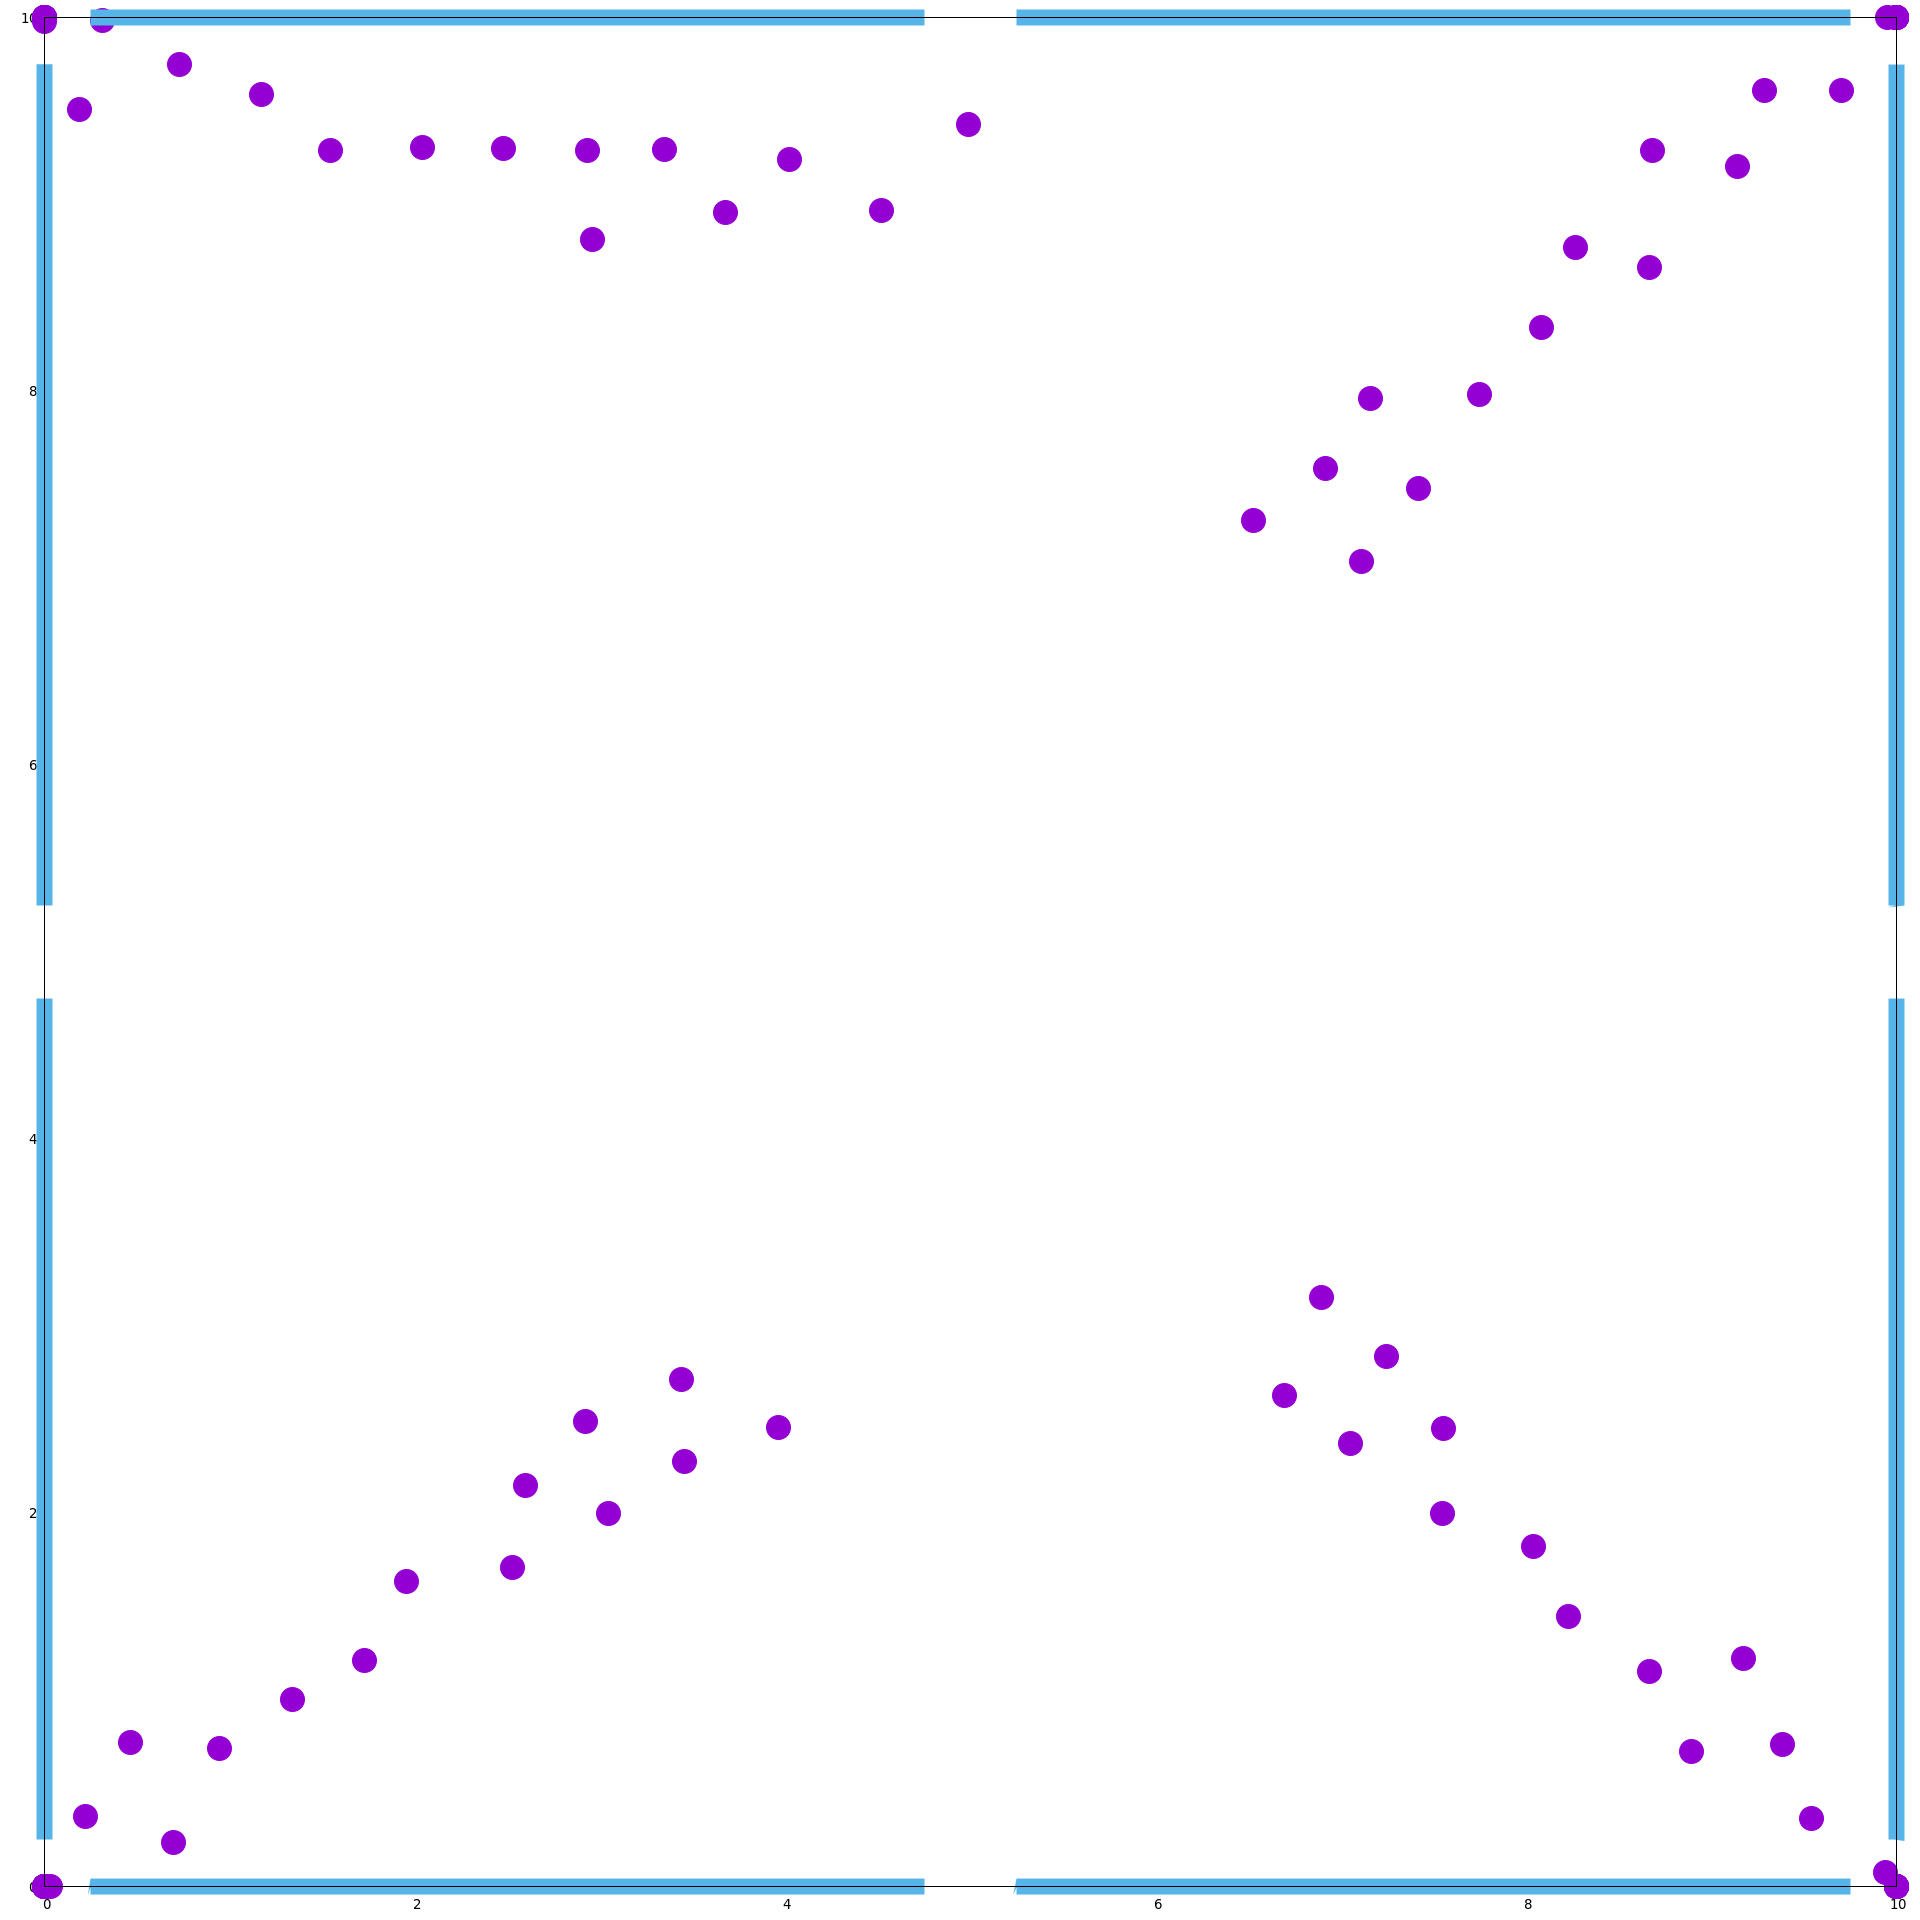
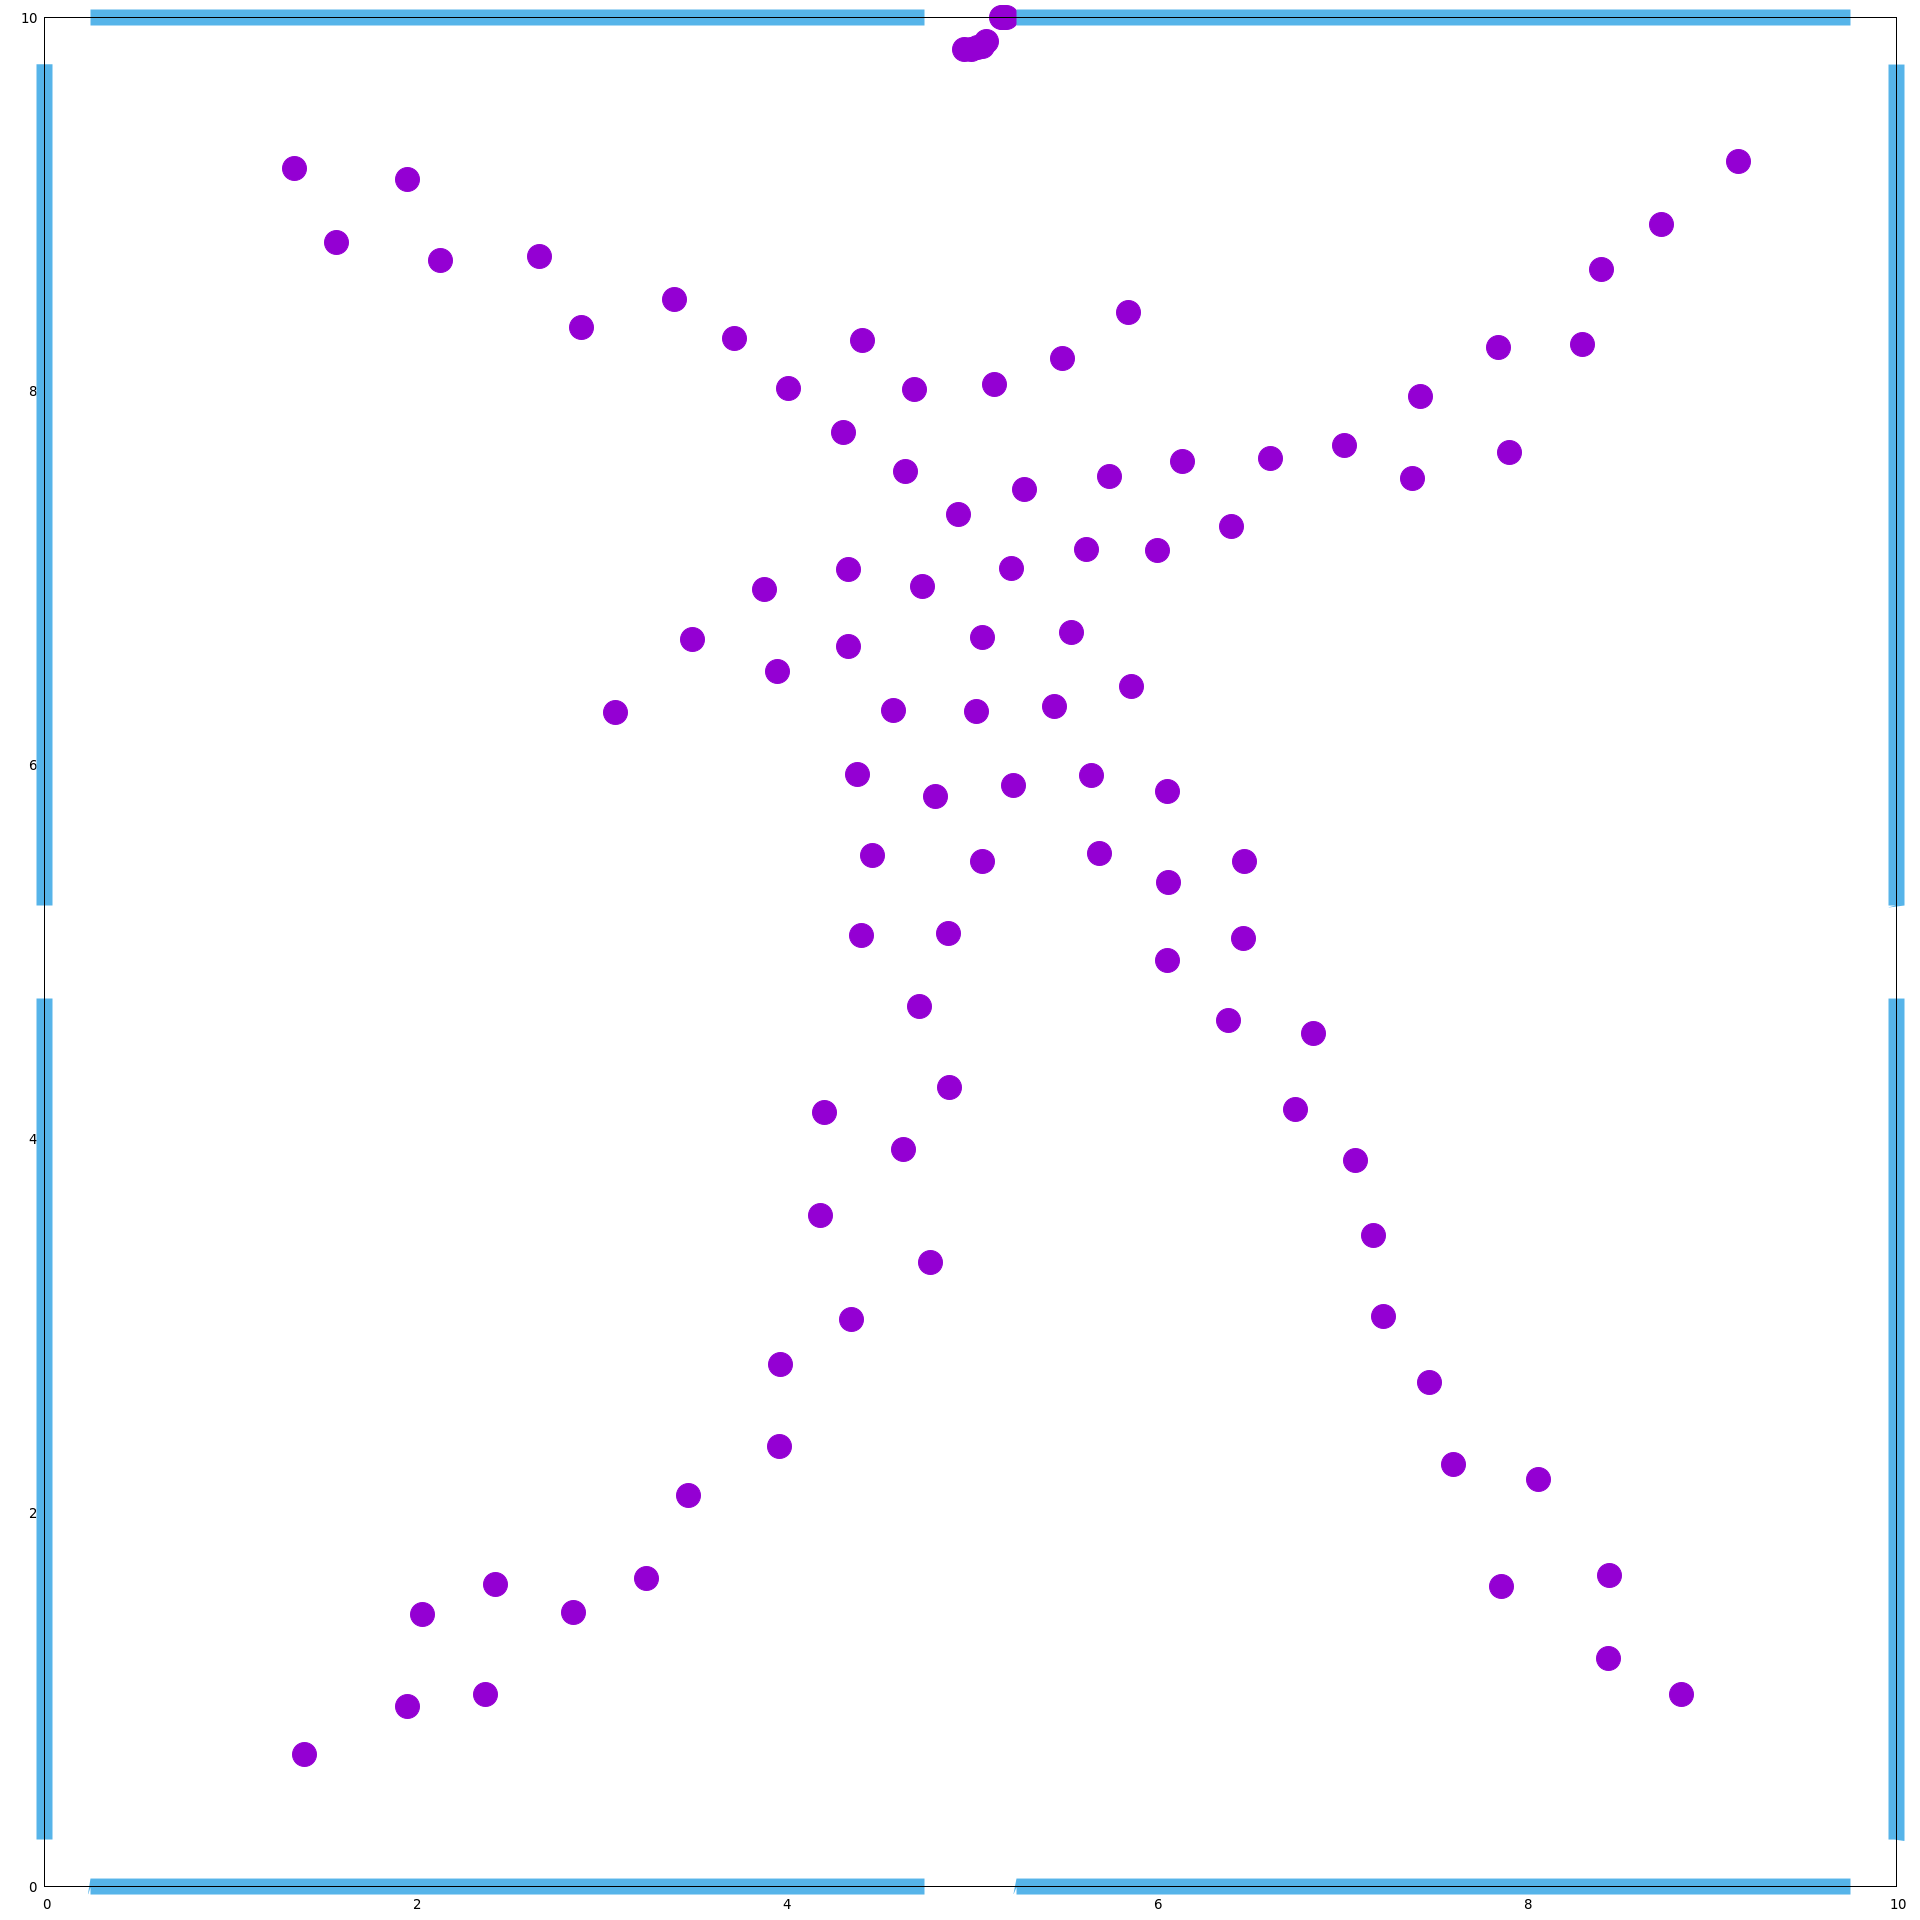
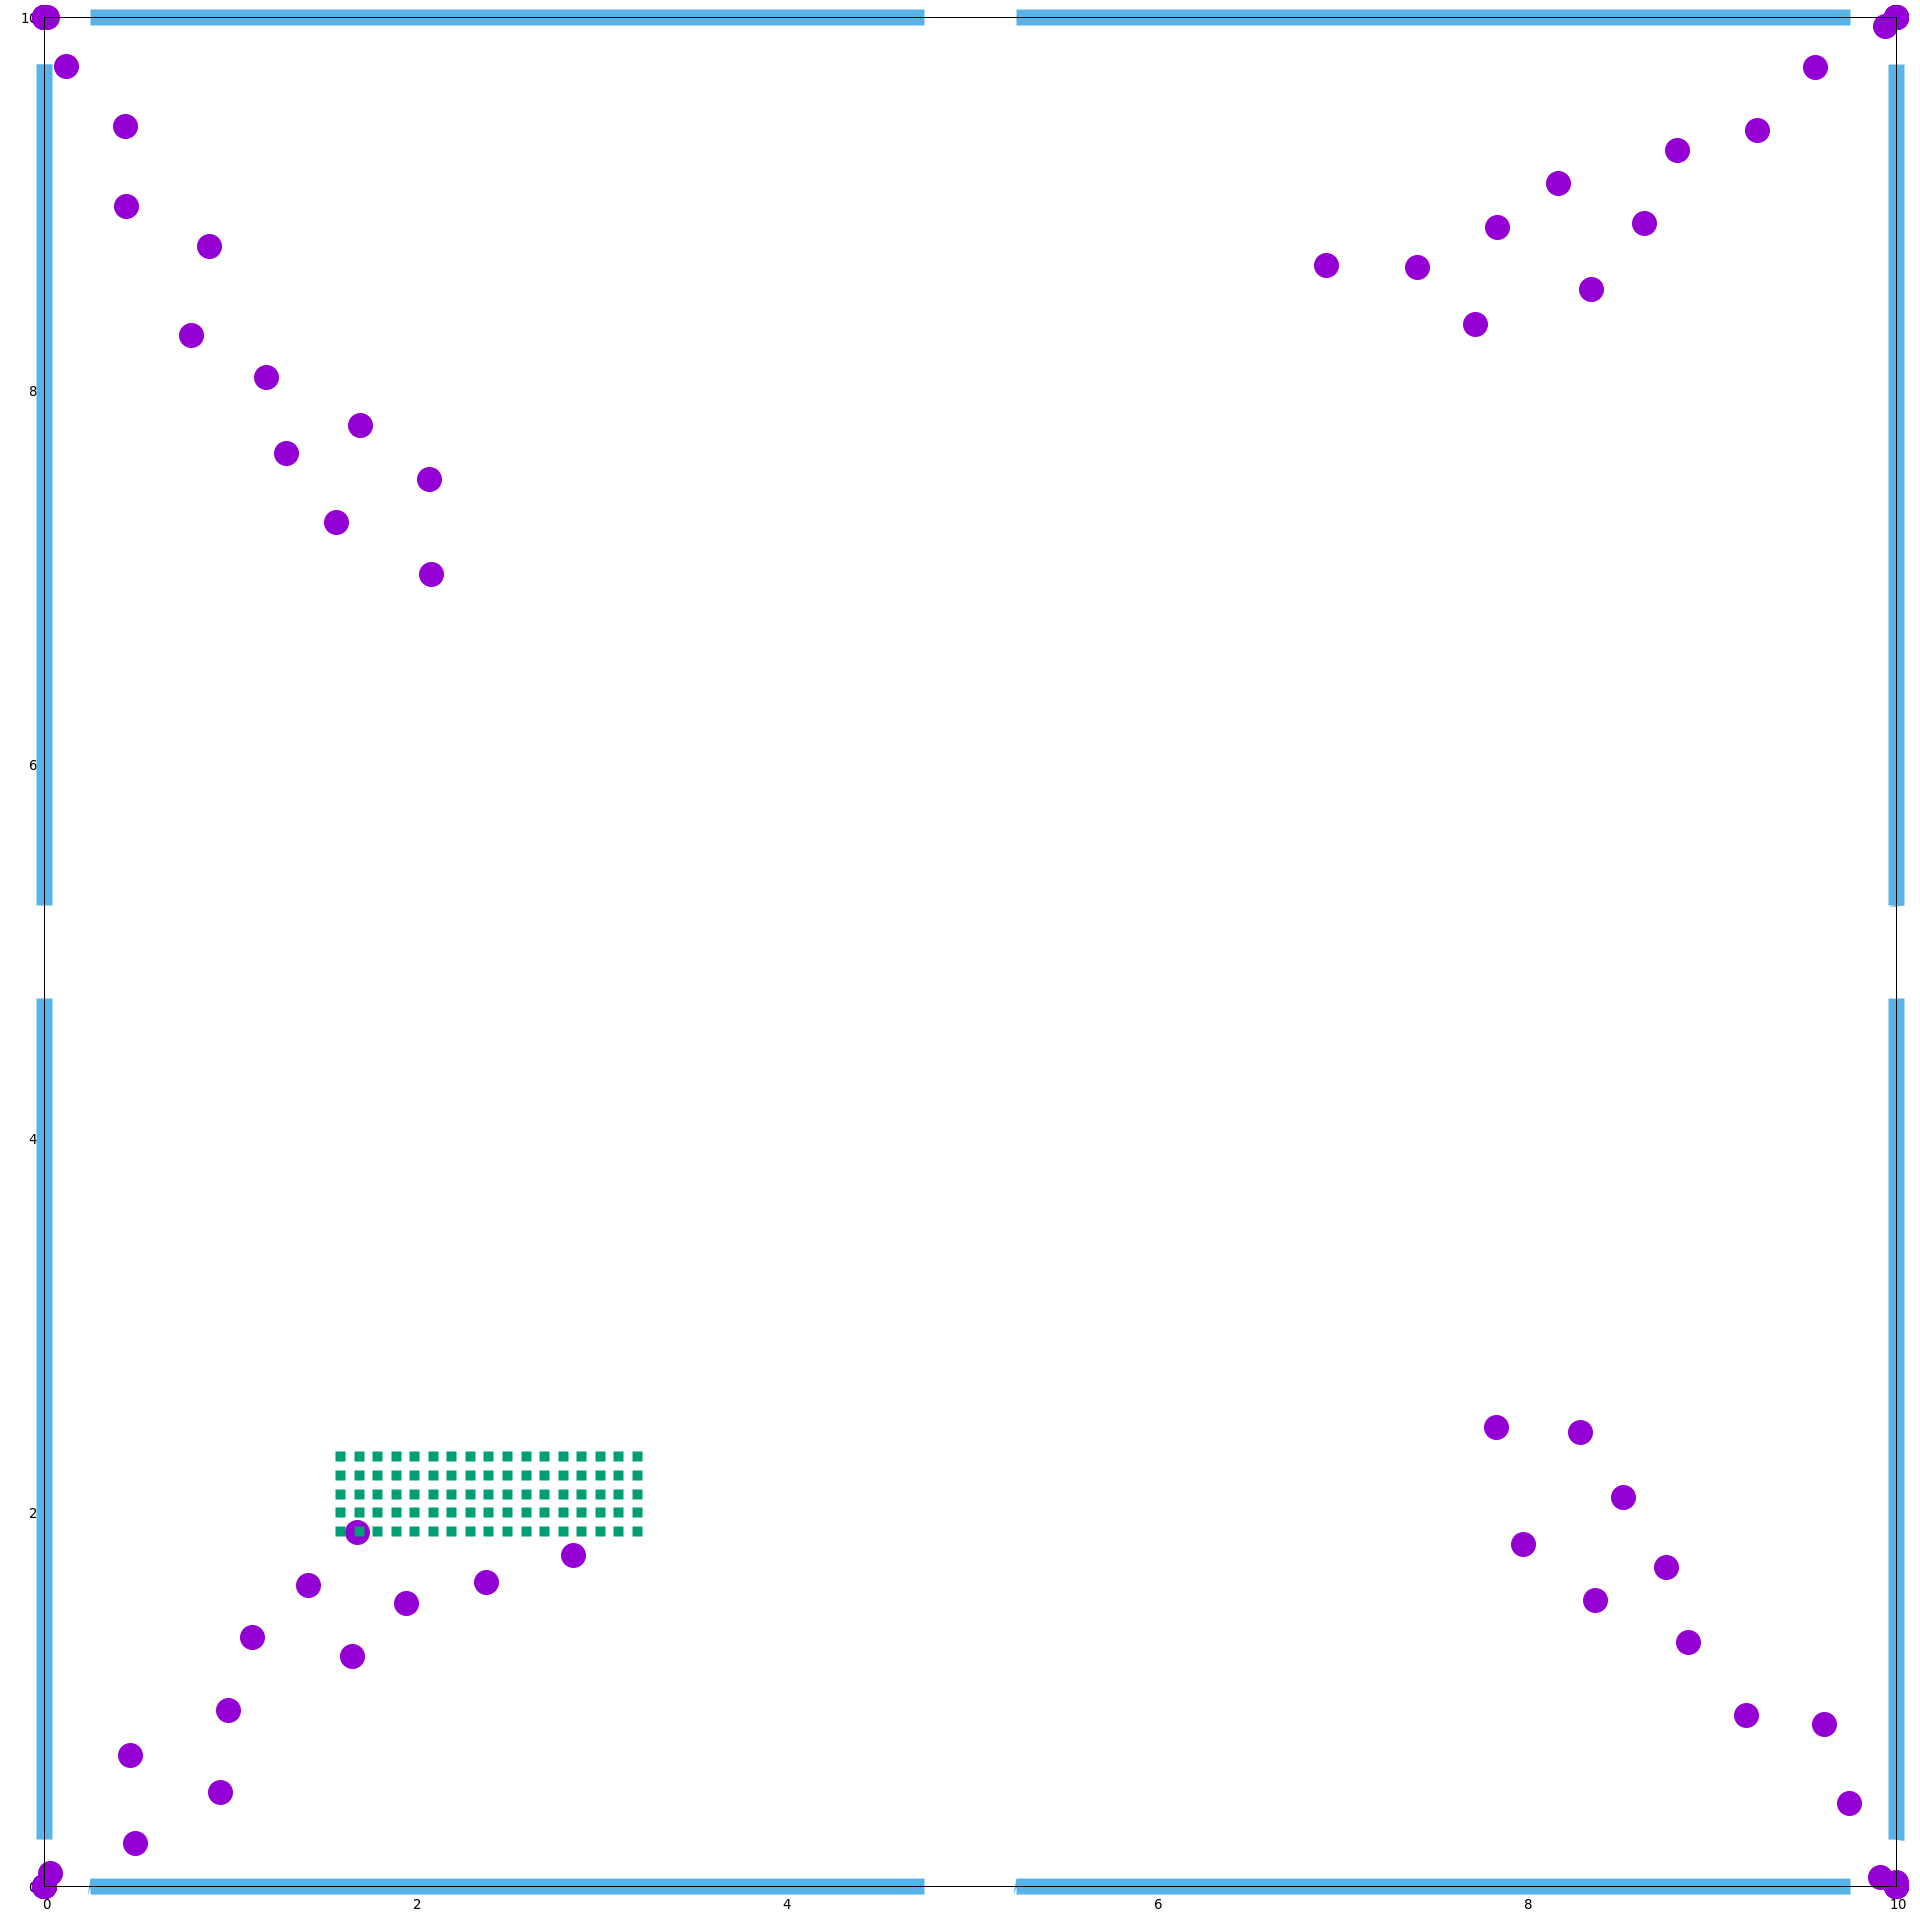
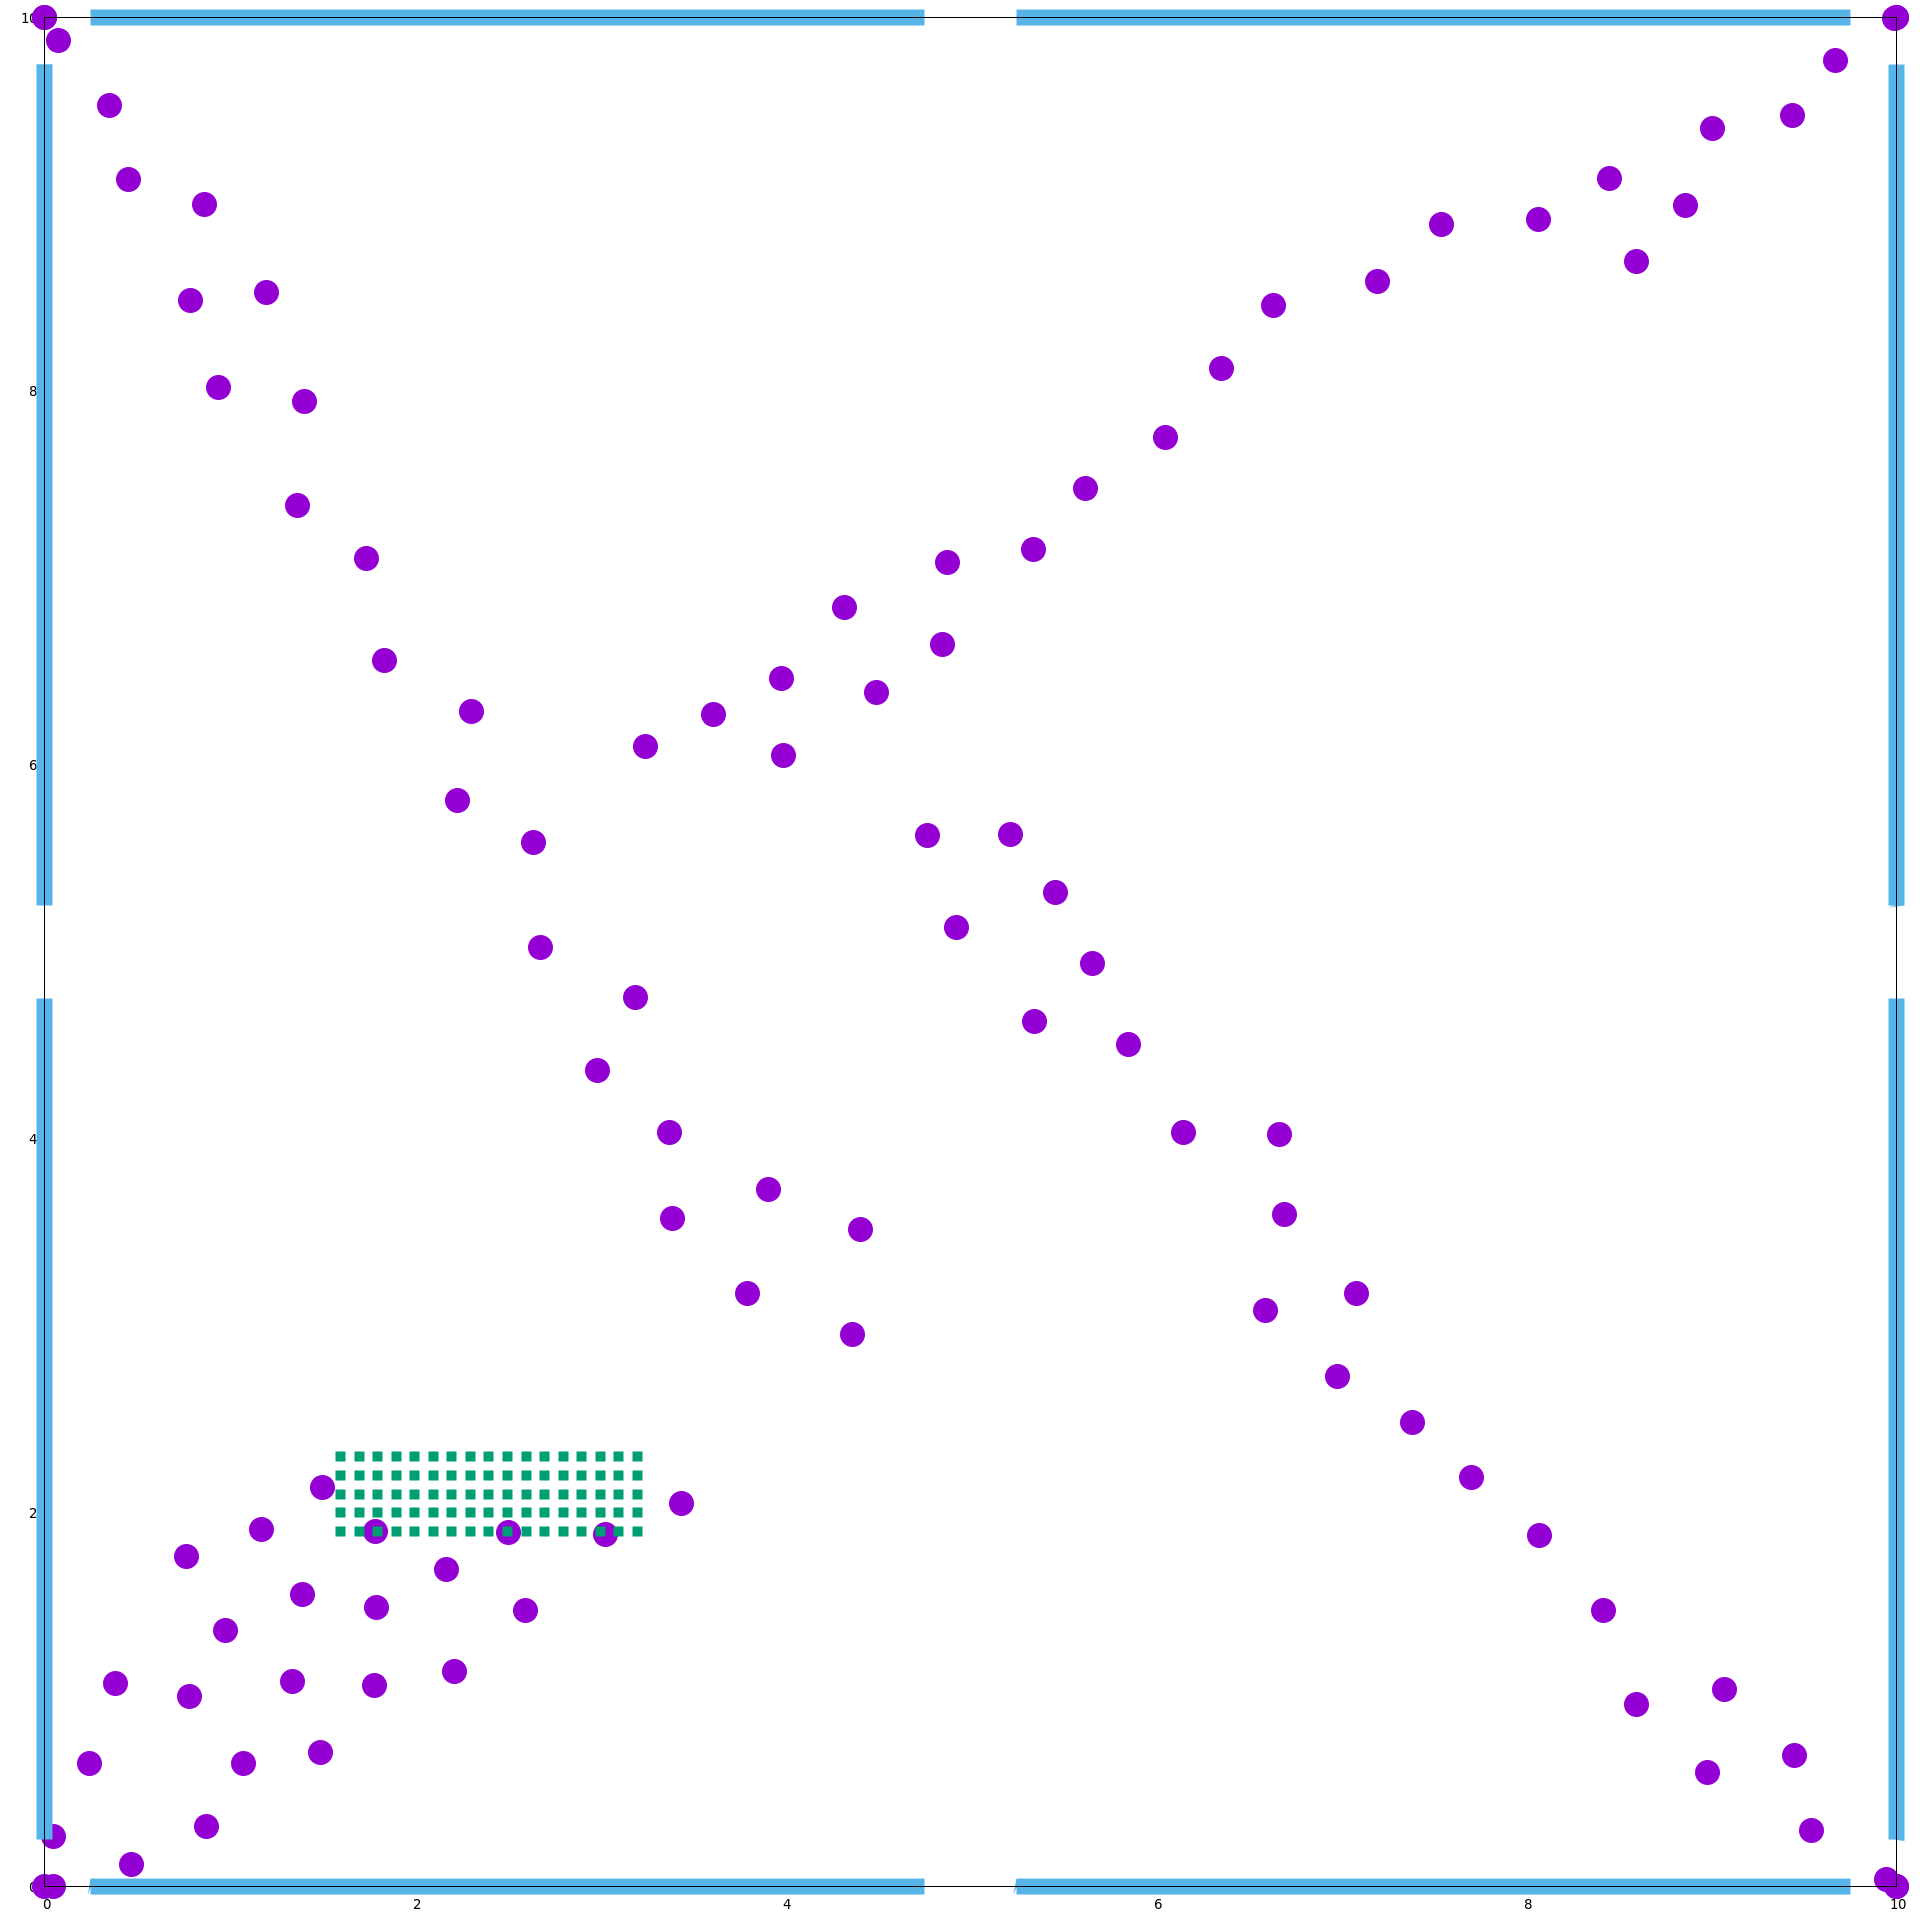
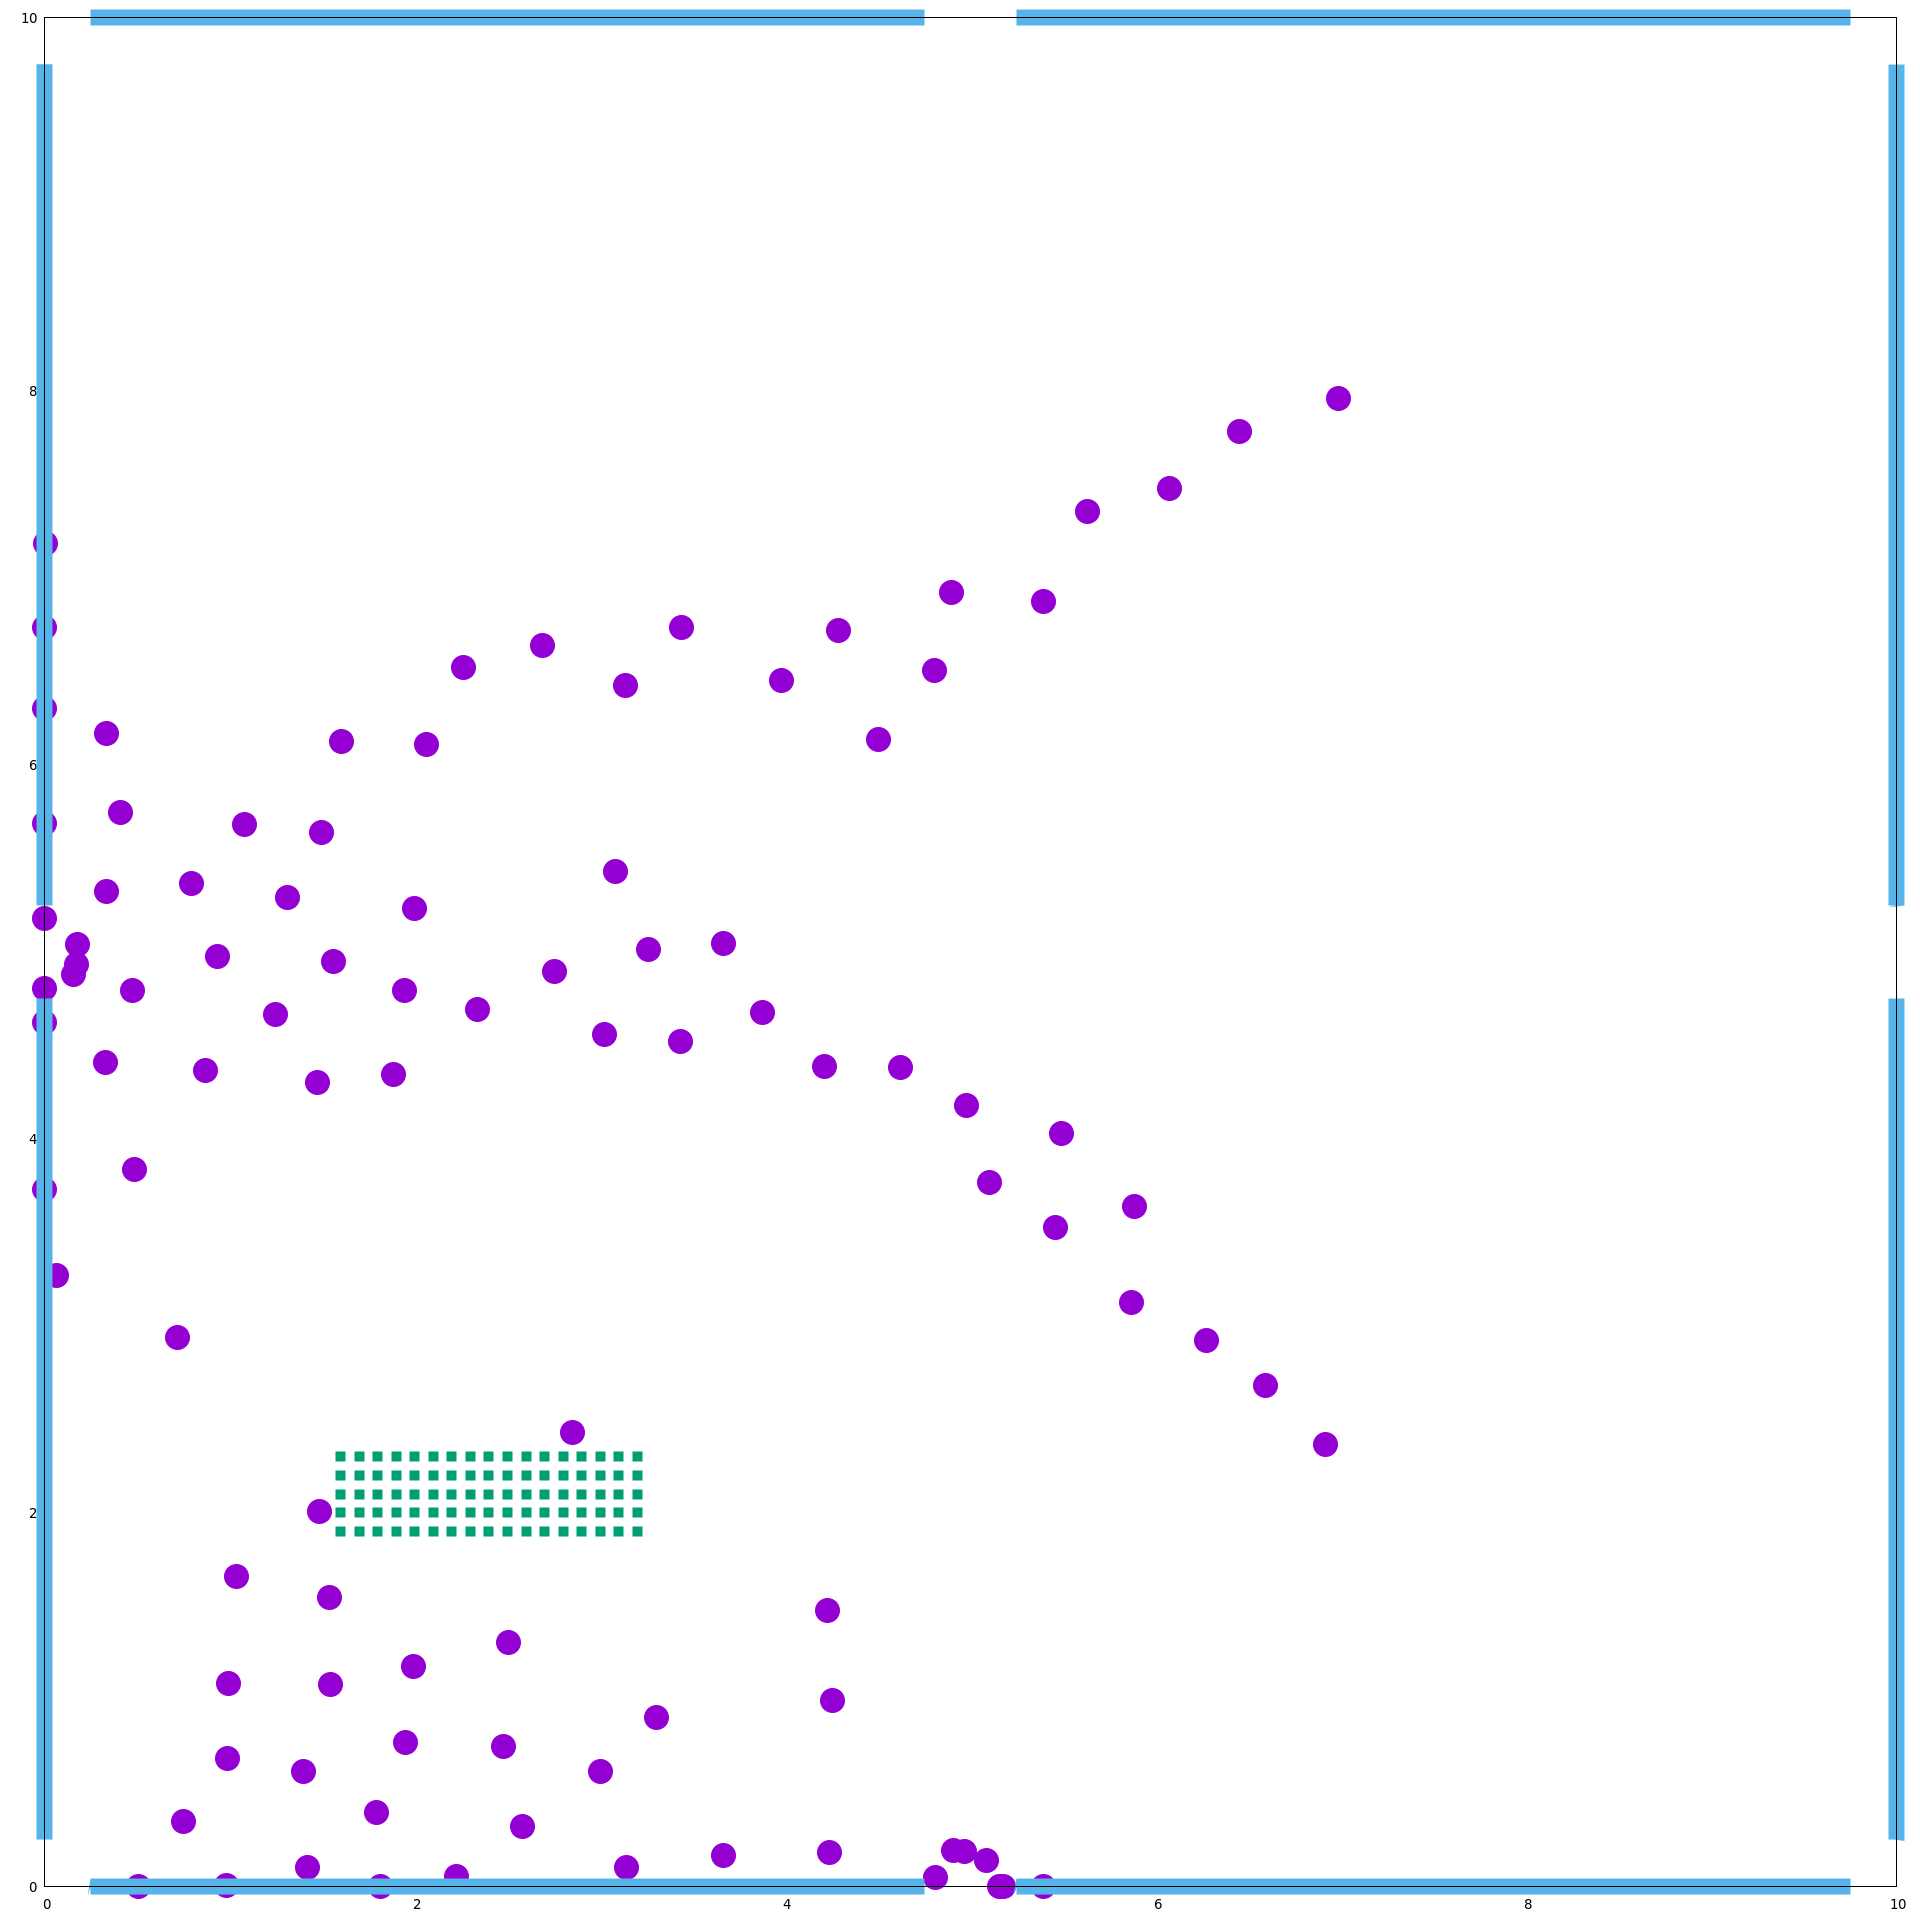
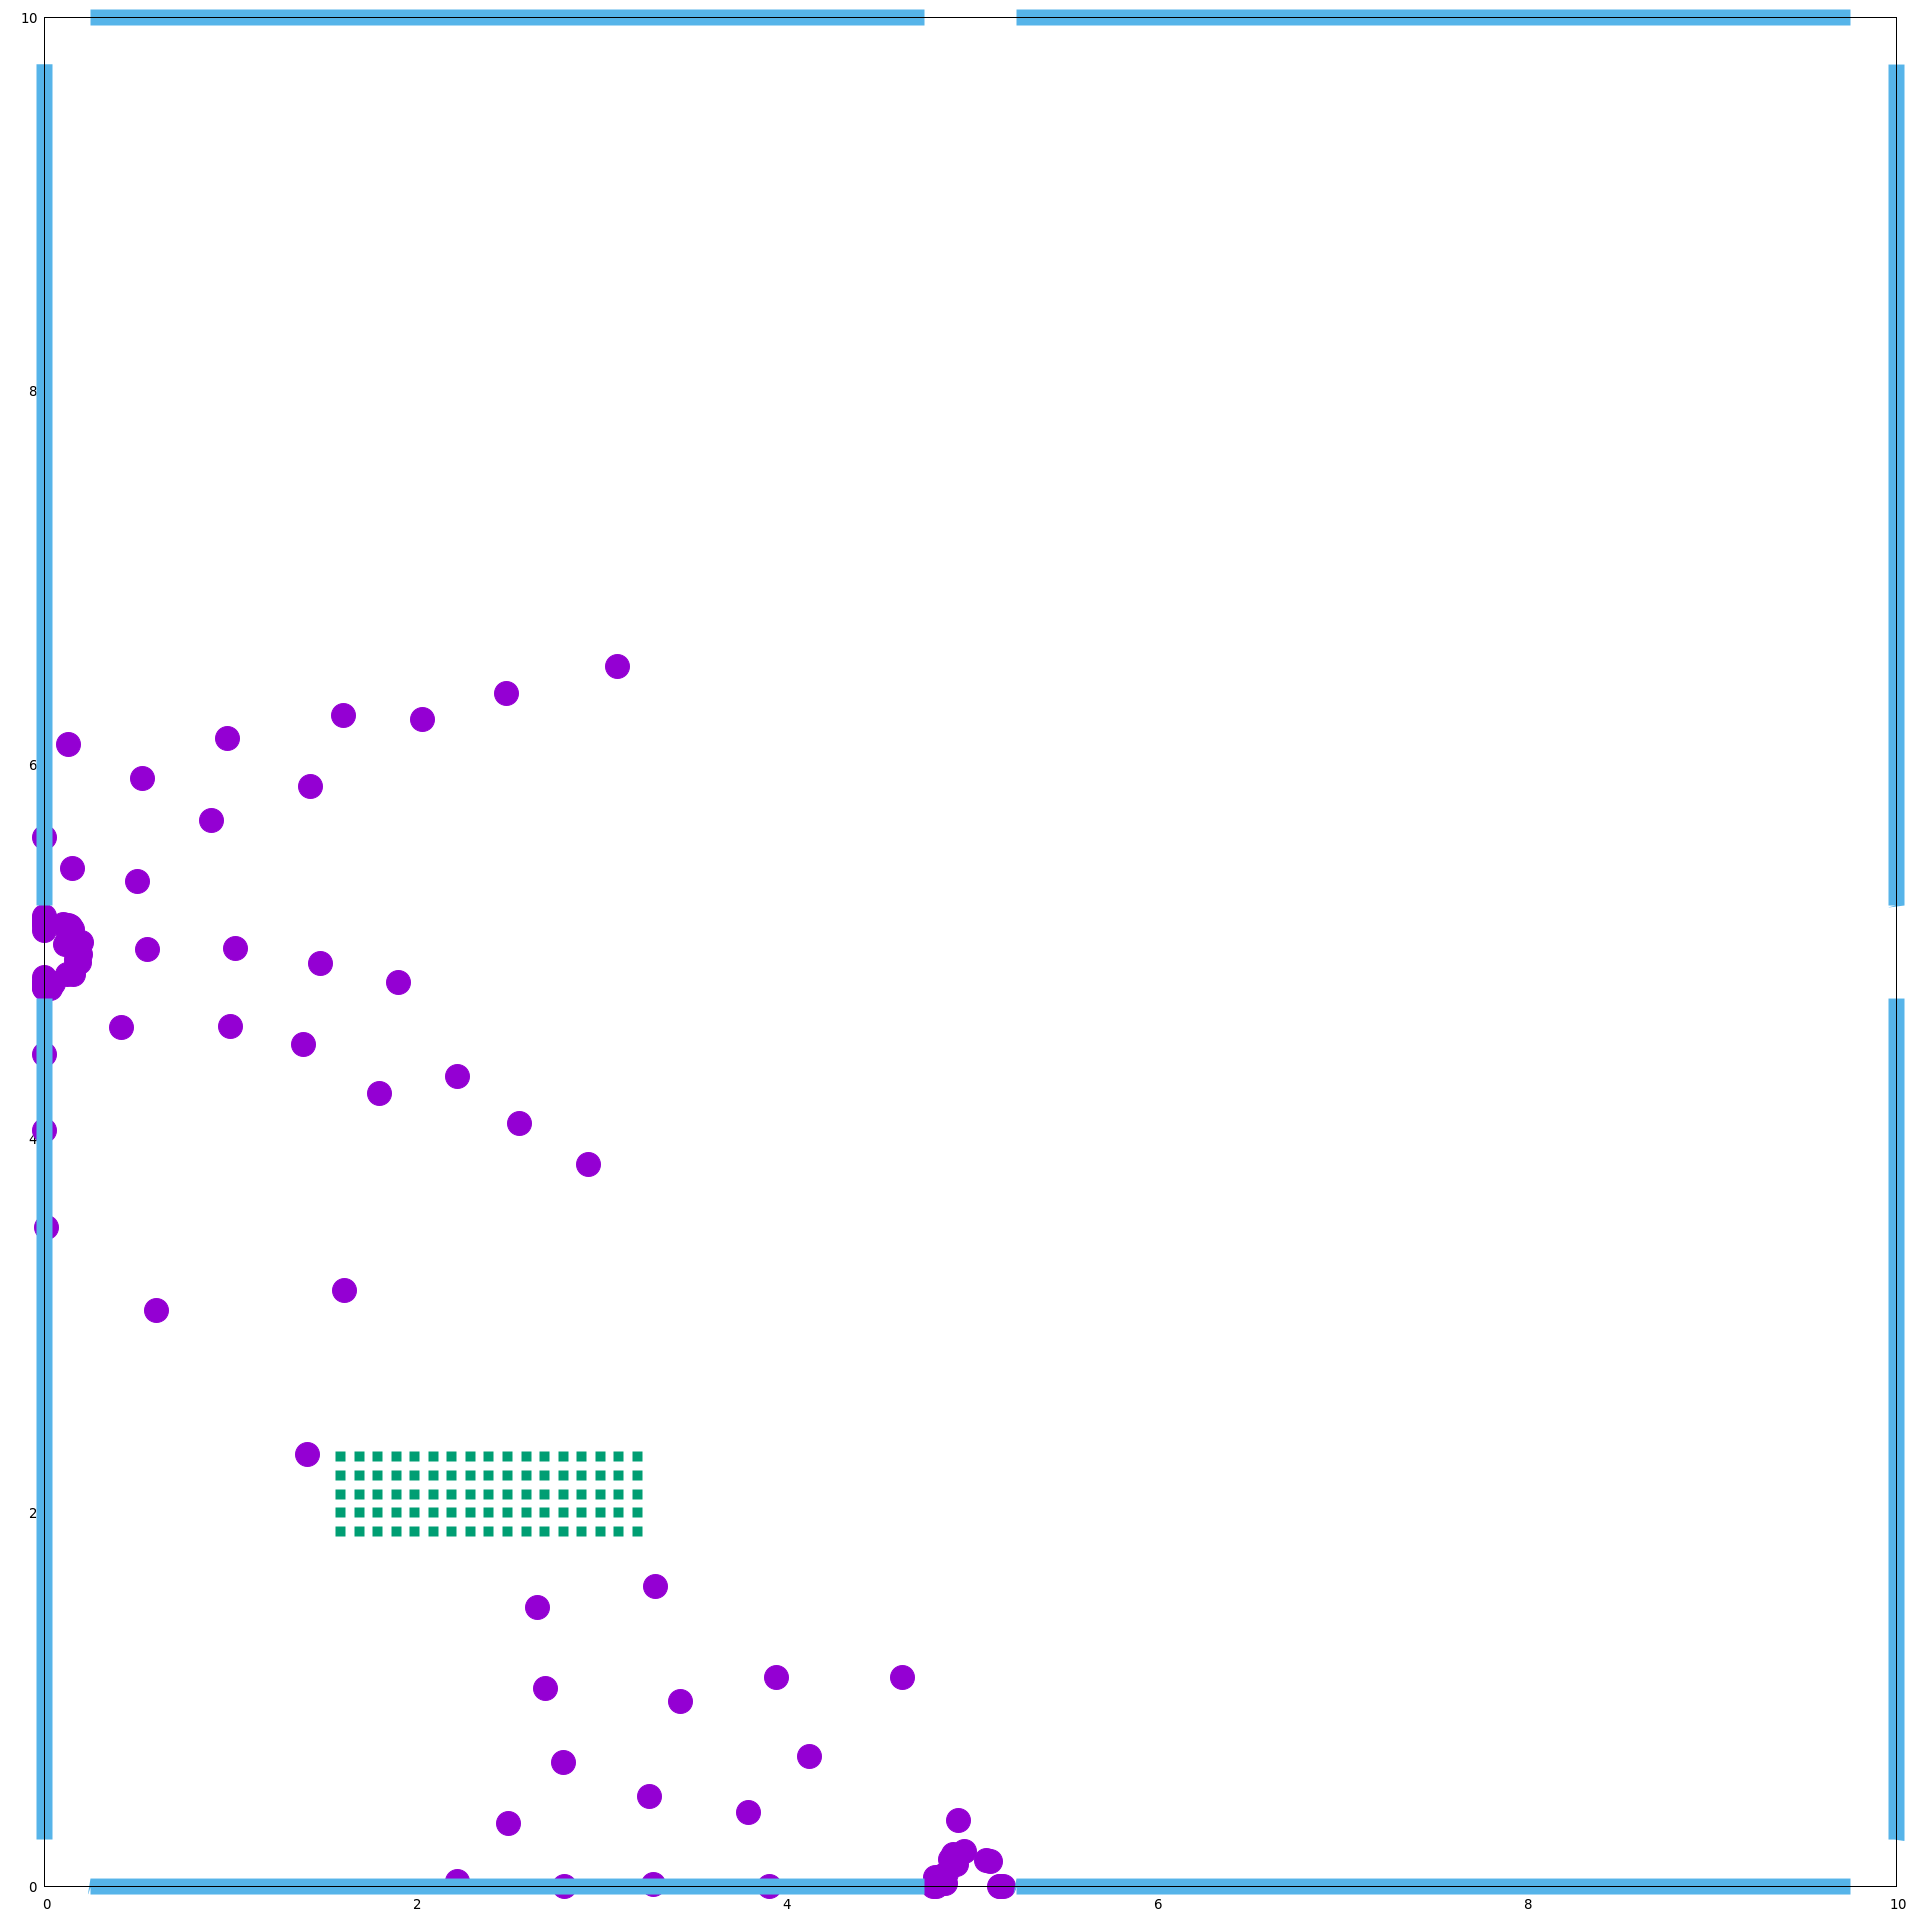
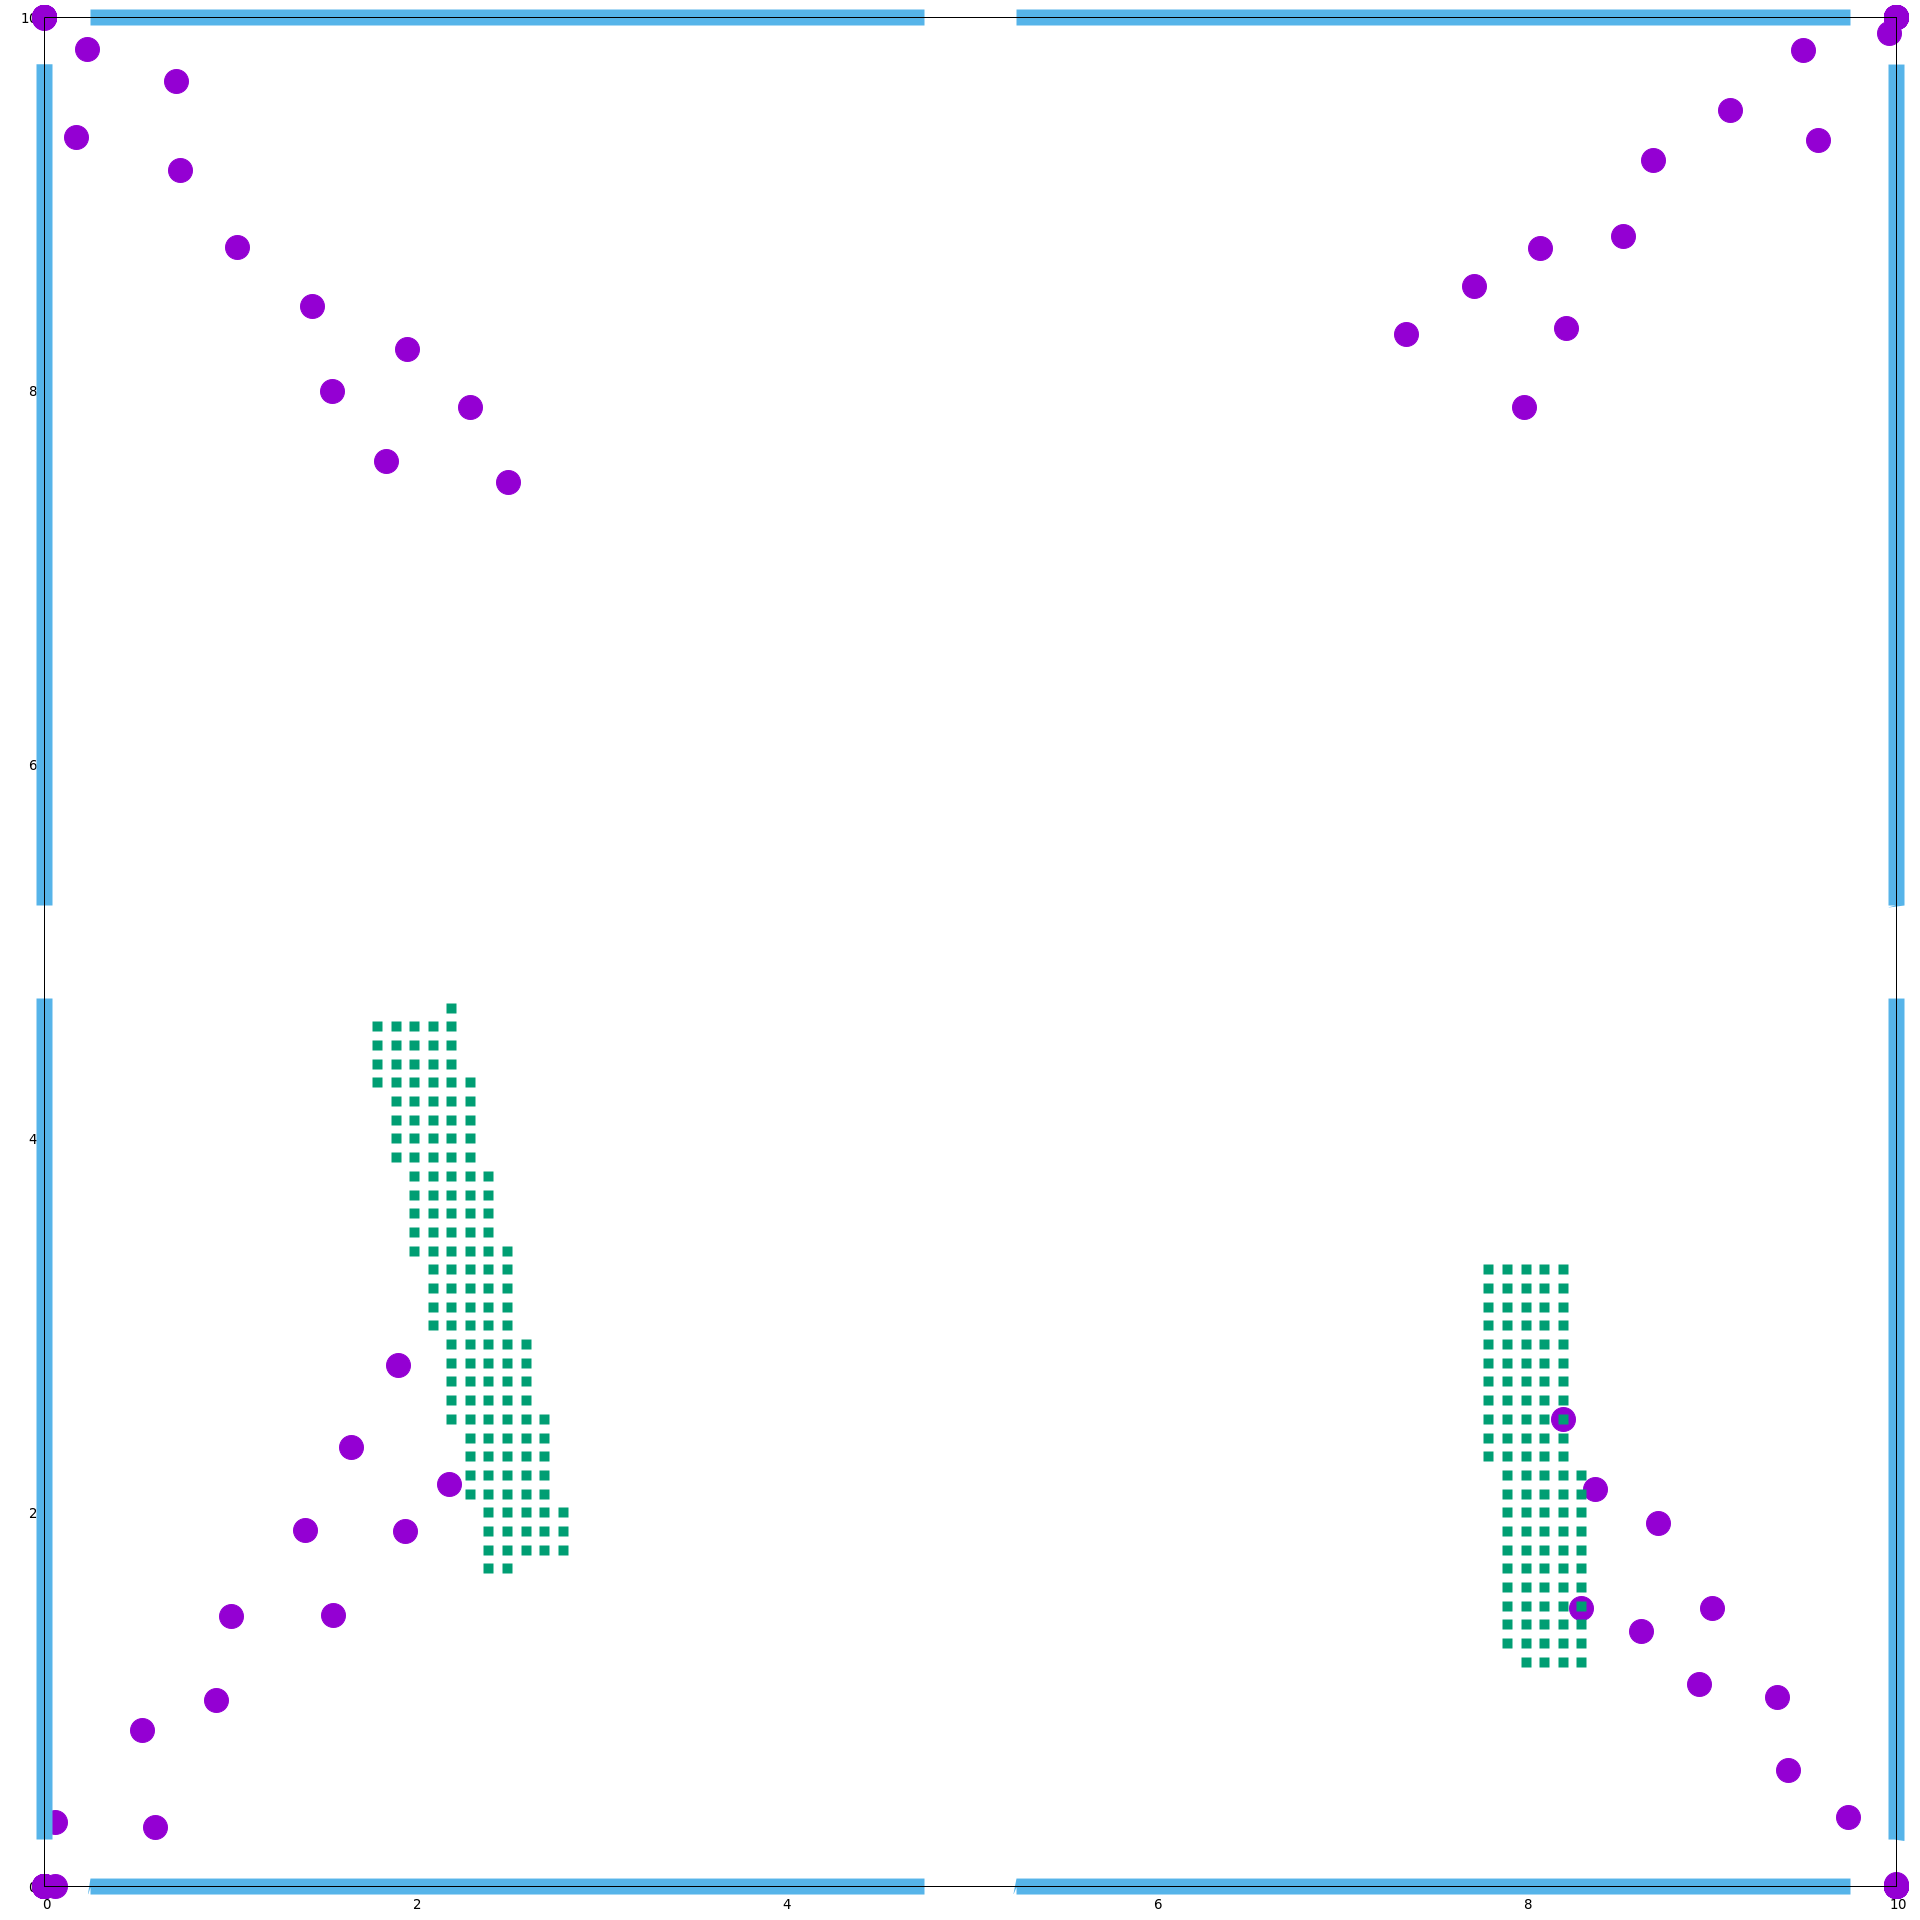
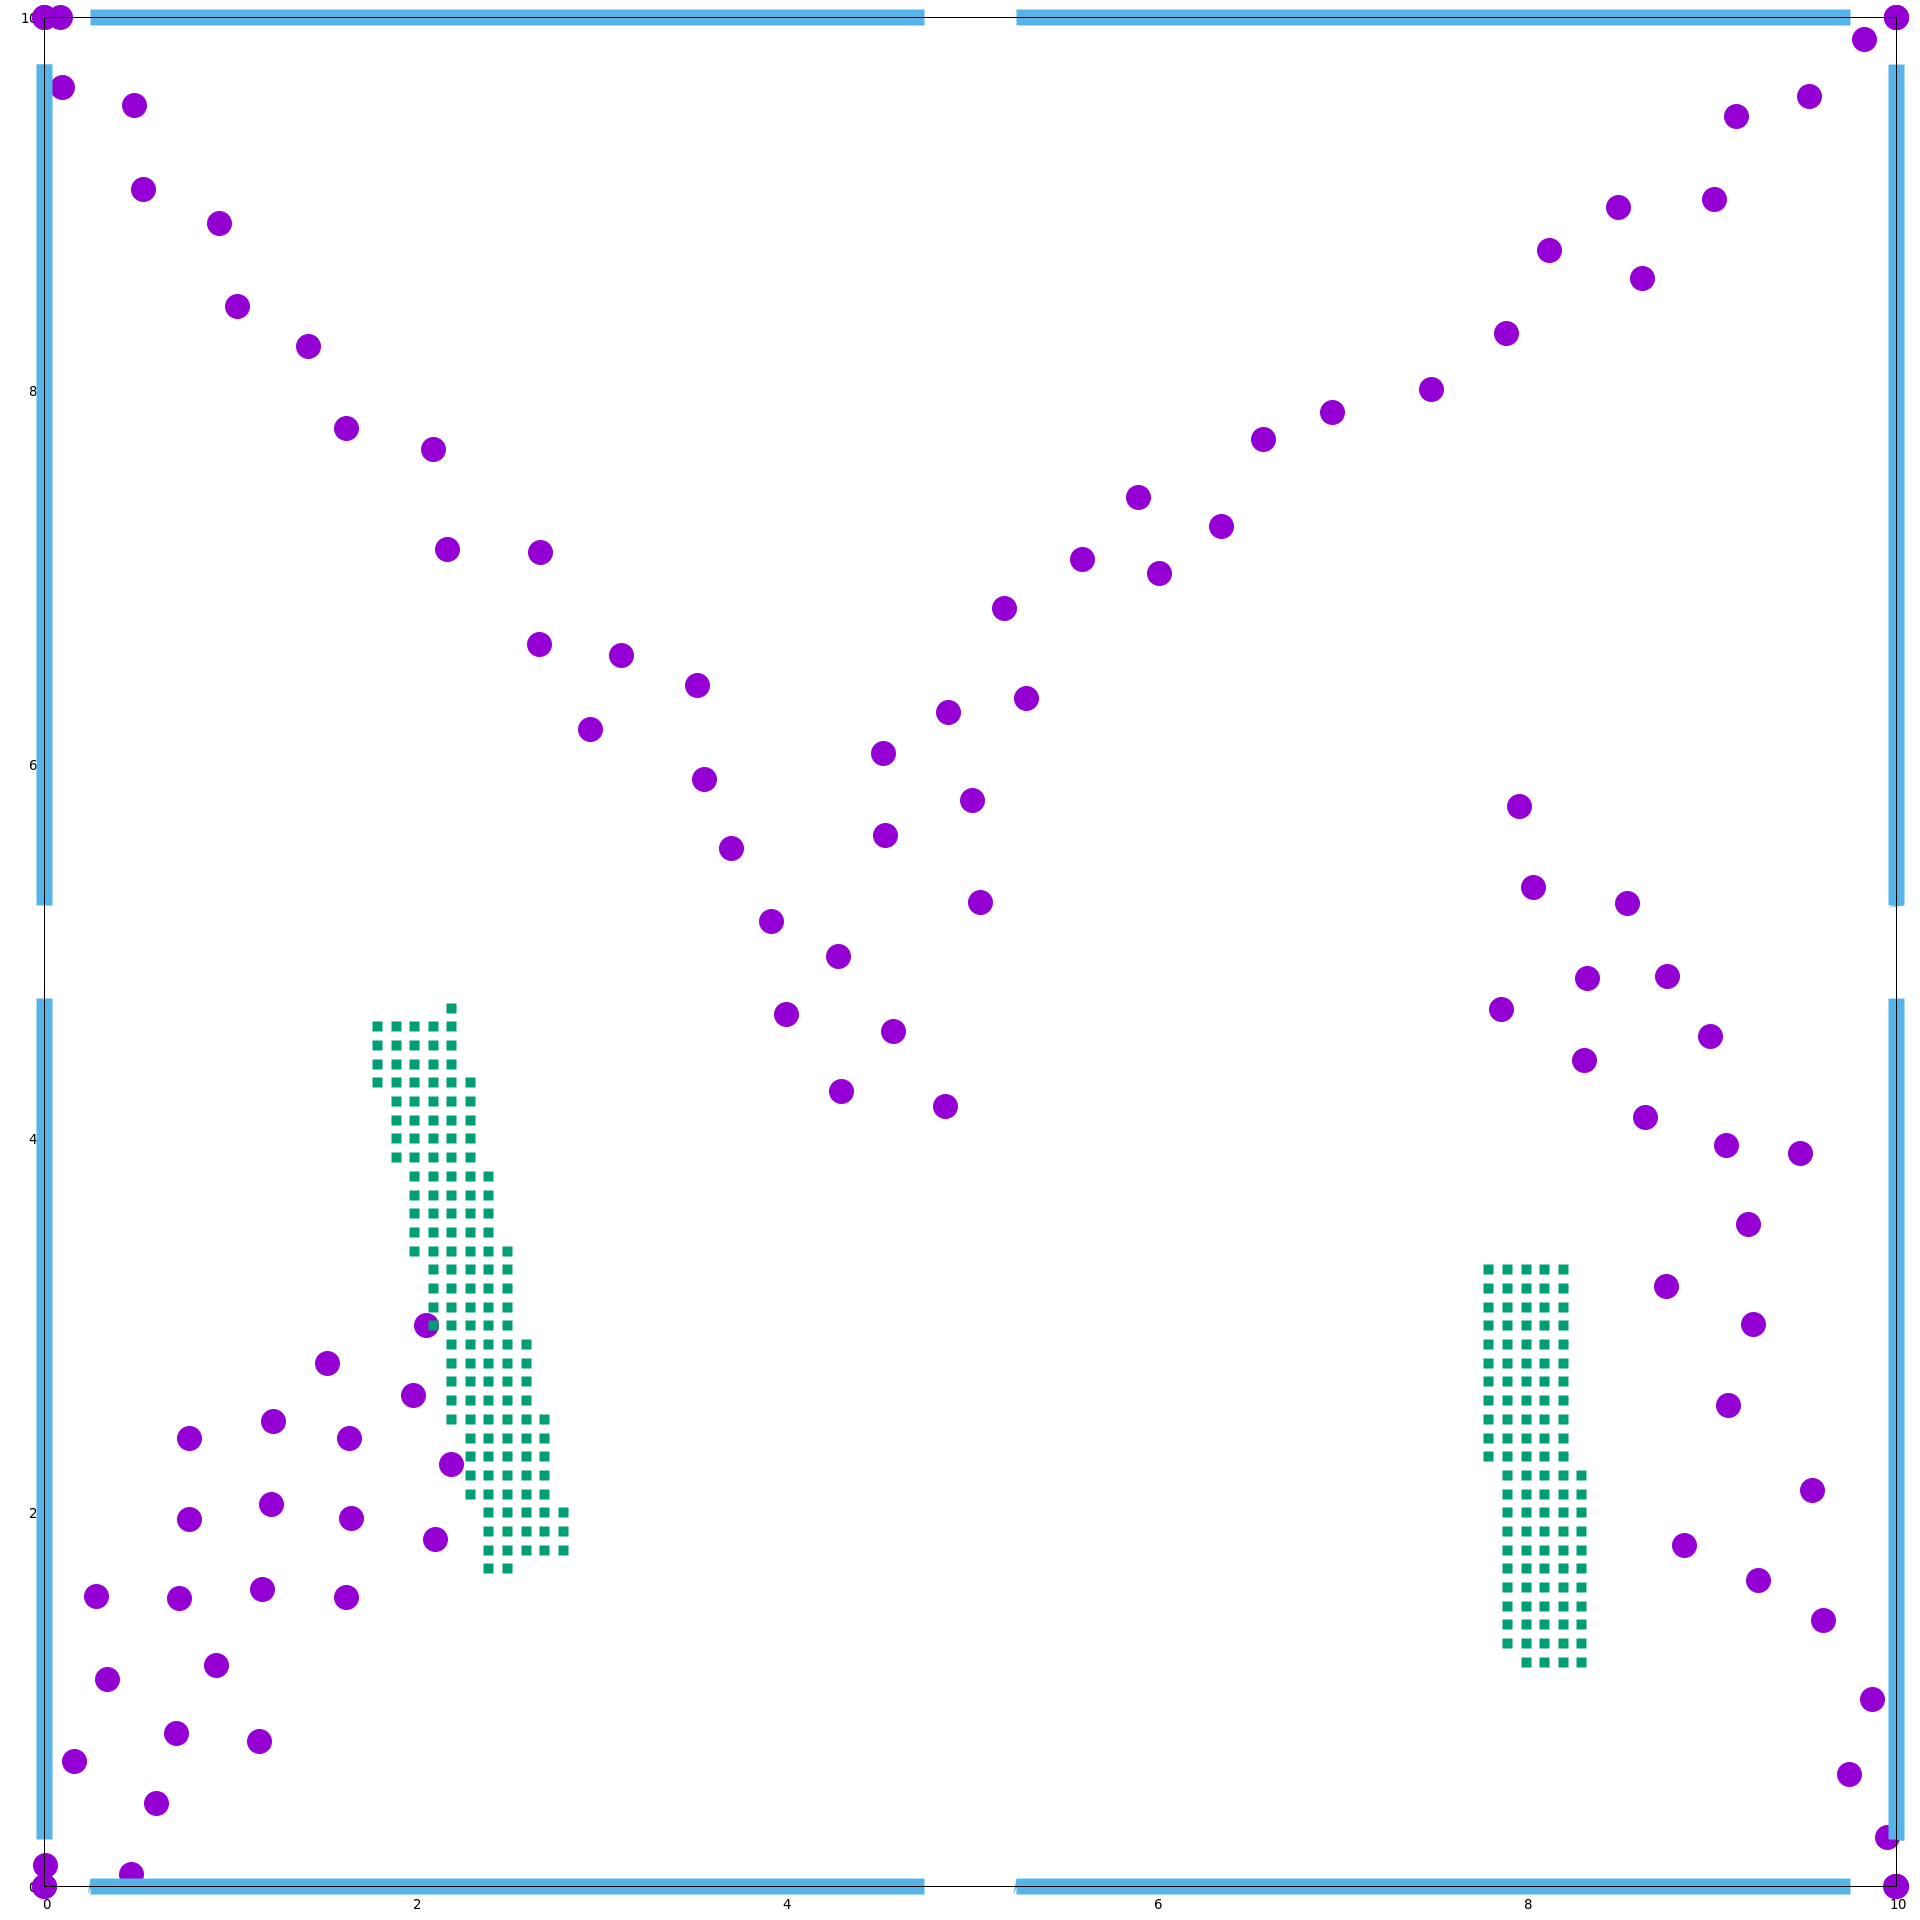
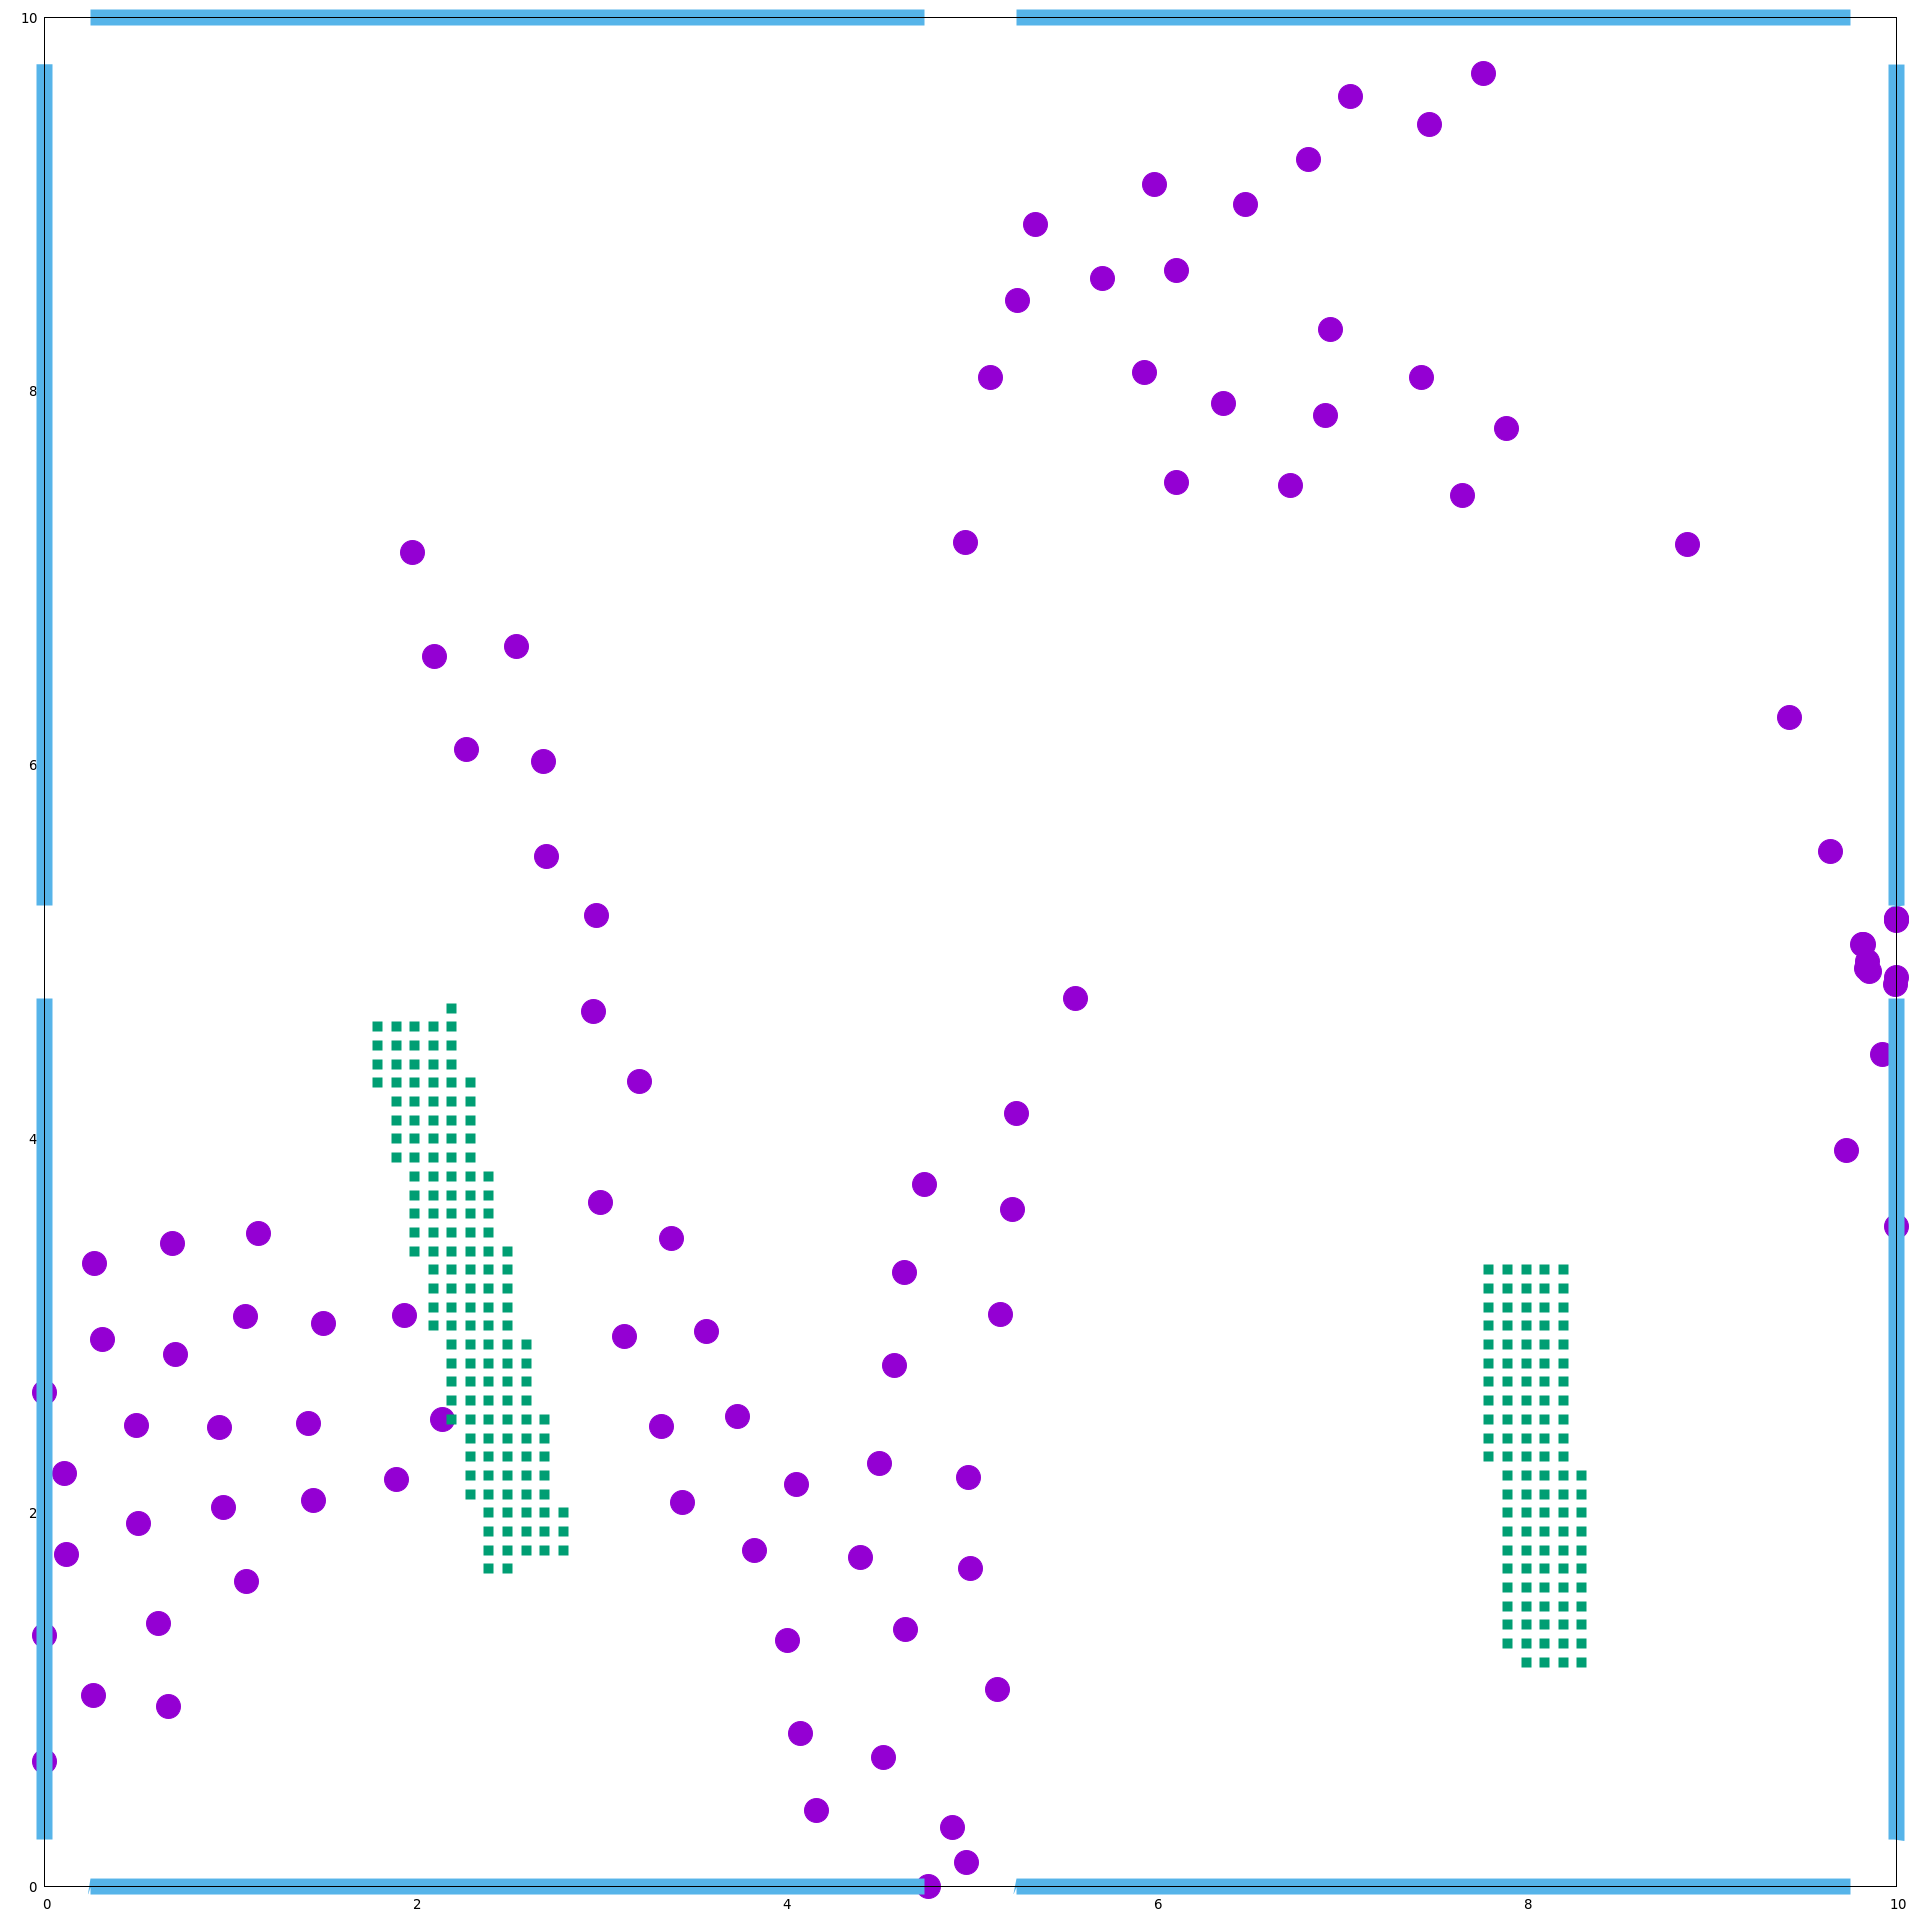
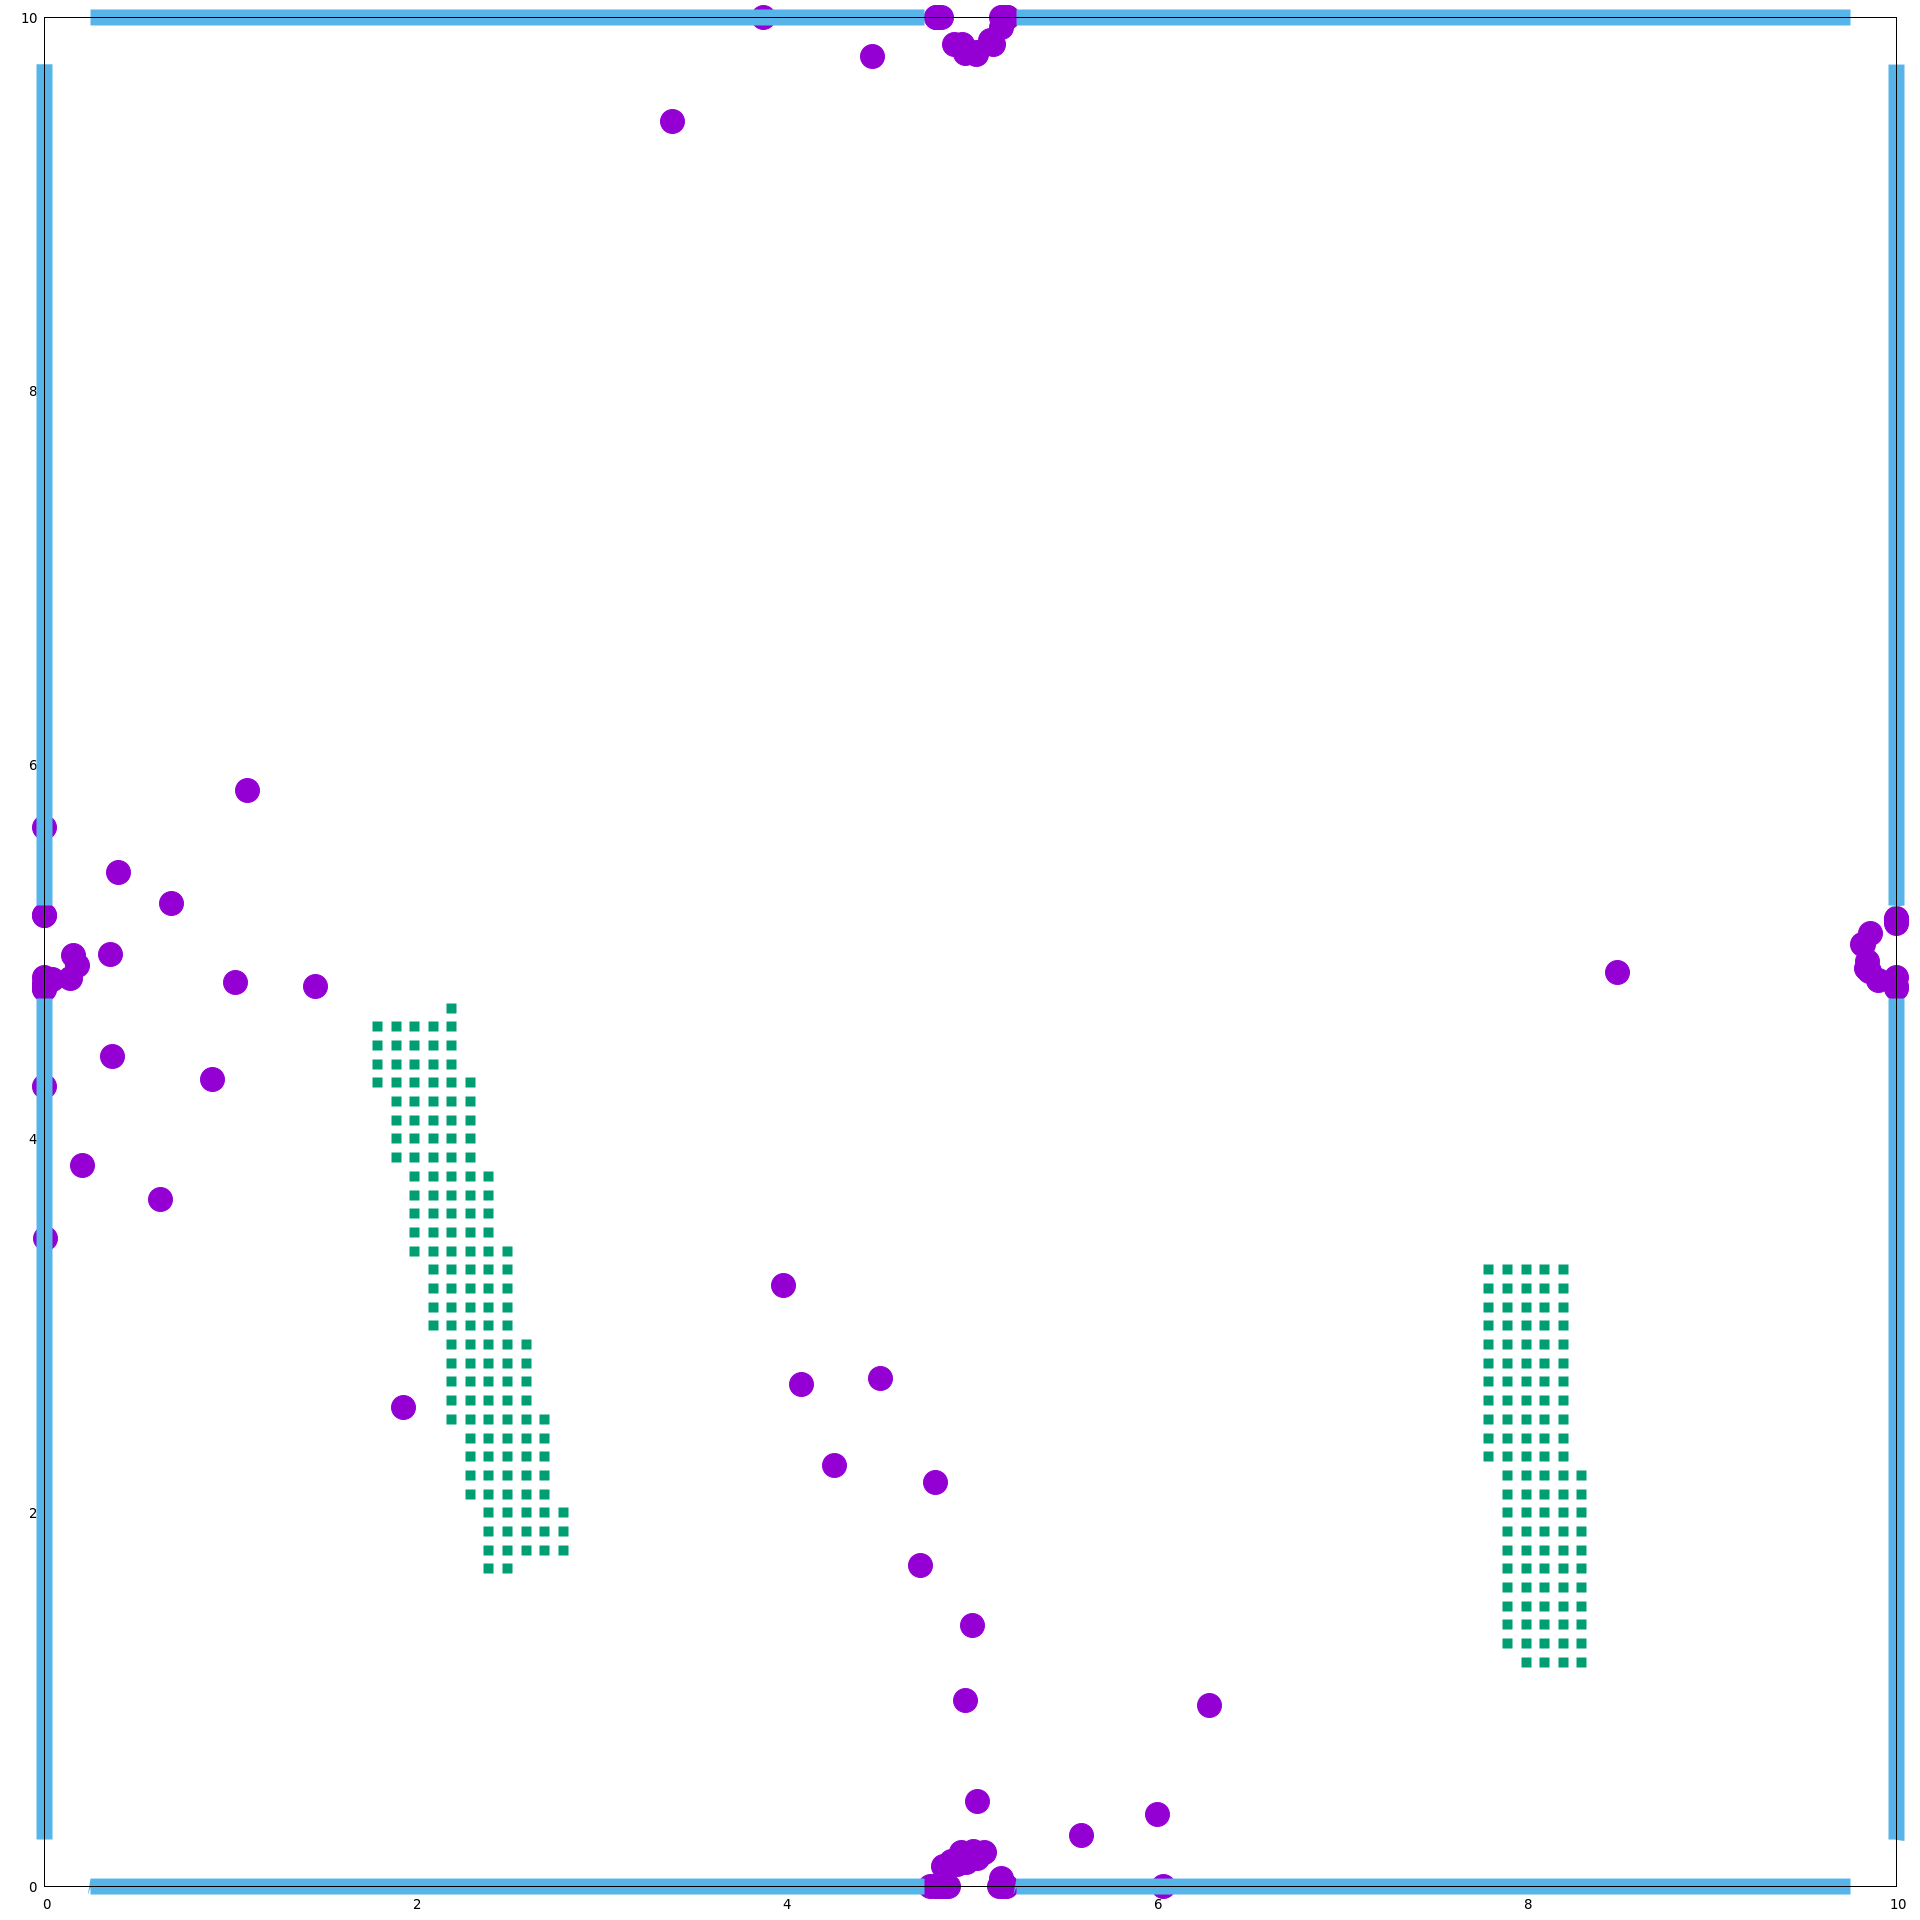
In Figure 14, the trajectories of the pedestrians are reported: from top to bottom the number of walls is increasing, while the time of the simulation is running from left to right. Best solution among 100,000 simulations is reported, and this is particularly advantageous for the case of the empty room, since the probability of the reported configuration is relatively small. The final outcome from this study is that a single wall is redirecting a single group of pedestrians. Naturally, if no wall is adopted, all the pedestrians are converging at the center of the room. This is connected with this specific configuration: in fact, when a pedestrian is entering the room, in order not to hit the boundaries s/he move toward the center of the room following the bisector of the corner. The following pedestrians have a further attraction, that is the trajectory of the preceding pedestrian(s), so that typically all the groups are moving (on average) along the bisector of the angle between the walls. The elimination of one or more groups from this path is facilitating the deviation of the converging part of the group to one of the exit. When a single obstacle is used, one group is segregated, and it moves toward the closest exit. If two obstacles are utilized, two groups are eliminated from the central area and the remaining two groups are moving together toward the opposite exit. In the particular case reported in Figure 14, the tail of the right upper group is shifted to the top by a subset of the group entering from the lower right corner: this way, all the exits are exploited, and the congestion at the exits is reduced, also lowering the overall egress time.
We can then conclude that the use of an optimizer for the determination of the best configuration is essential for at least two distinct reasons. Firstly, although the final configuration appears to be logical, it is not easy to be identified without an aid (the paradox of the egg of Columbus). Secondly, the fine tuning of the general layout of the walls is providing an advantage impossible to obtain by a simple manual positioning. Finally, these two aspects have been pointed out in the case of a relatively simple room geometry: a much more complex geometry would include more and more difficulties in the determination of the optimal configuration, and the use of an optimization algorithm becomes vital.
5 Conclusions and research directions
This survey has been devoted to present some recent results in the mathematical modeling and control of crowd dynamics. We discussed the various level of modeling, from the microscopic scale of agent based systems to the macroscopic scale of the crowd density and bulk velocity, through the mesoscopic scale based on a statistical description of the system. Several corresponding control problems, aimed at minimizing the escape time of the crowd from a given environment, have been illustrated and solved by numerical methods.
These results allow us to draw some conclusions. First of all, we can say that while the modeling (i.e. the mathematical description) of pedestrian flows has now reached a stage of maturity, the same cannot be said for the optimization of pedestrian flows. In this field there is still room for many experiments, both virtual and real.
In the case of control through leaders, their impact on the crowd is not yet completely understood. In particular, in crowd management it is of paramount importance to be able to secure crowd evacuation through minimal intervention in order to avoid adversarial behaviors against authorities, and de-escalate tensions. Indeed, we have shown that few agents may change completely the behavior of the whole system, breaking initial uncertainties. A further research direction concerns the optimal positioning and amount of leaders within the crowd at the time of the first movement.
In the case of optimization through obstacles, basically no experiment was conducted on real people (we do not consider here the experiments investigating the effect of small obstacles in front of exit doors). Although the simulations suggest the existence of multiple optimal configurations of the obstacles, and it is therefore not easy to choose which to put into practice, virtual experiments all lead in the same, clear direction: breaking of symmetry is beneficial to pedestrian flows. This means, e.g., that clogging can be avoided by redirecting people through asymmetric paths, which lead people at exits at different times. Moreover, the perception of the walking area can be completely upset by using smart obstacles, in such a way that naturally chosen exit paths are rebuilt for a more efficient exit usage.
References
- (1) Abdelghany, A., Abdelghany, K., Mahmassani, H., Alhalabi, W.: Modeling framework for optimal evacuation of large-scale crowded pedestrian facilities. European J. Oper. Res. 237(3), 1105–1118 (2014). DOI 10.1016/j.ejor.2014.02.054
- (2) Agnelli, J.P., Colasuonno, F., Knopoff, D.: A kinetic theory approach to the dynamic of crowd evacuation from bounded domains. Math. Models Methods Appl. Sci. 25(1), 109–129 (2015). DOI 10.1142/S0218202515500049
- (3) Albi, G., Bellomo, N., Fermo, L., Ha, S.Y., Kim, J., Pareschi, L., Poyato, D., Soler, J.: Vehicular traffic, crowds, and swarms: from kinetic theory and multiscale methods to applications and research perspectives. Math. Models Methods Appl. Sci. 29(10), 1901–2005 (2019). DOI 10.1142/S0218202519500374
- (4) Albi, G., Bongini, M., Cristiani, E., Kalise, D.: Invisible control of self-organizing agents leaving unknown environments. SIAM J. Appl. Math. 76(4), 1683–1710 (2016). DOI 10.1137/15M1017016
- (5) Albi, G., Herty, M., Pareschi, L.: Kinetic description of optimal control problems and applications to opinion consensus. Commun. Math. Sci. 13(6), 1407–1429 (2015). DOI 10.4310/CMS.2015.v13.n6.a3
- (6) Albi, G., Pareschi, L.: Binary interaction algorithms for the simulation of flocking and swarming dynamics. Multiscale Model. Simul. 11(1), 1–29 (2013). DOI 10.1137/120868748
- (7) Albi, G., Pareschi, L.: Modeling of self-organized systems interacting with a few individuals: from microscopic to macroscopic dynamics. Appl. Math. Lett. 26, 397–401 (2013)
- (8) Albi, G., Pareschi, L.: Selective model-predictive control for flocking systems. Commun. Appl. Ind. Math. 9(2), 4–21 (2018). DOI 10.2478/caim-2018-0009
- (9) Albi, G., Pareschi, L., Zanella, M.: Boltzmann-type control of opinion consensus through leaders. Phil. Trans. R. Soc. A 372, 20140138/1–18 (2014). DOI 10.1098/rsta.2014.0138
- (10) Albi, G., Pareschi, L., Zanella, M.: Boltzmann games in heterogeneous consensus dynamics. J. Stat. Phys. 175(1), 97–125 (2019). DOI 10.1007/s10955-019-02246-y
- (11) Andersen, H.C., Weeks, J.D., Chandler, D.: Relationship between the hard-sphere fluid and fluids with realistic repulsion force. Phys. Rev. A 4(4), 1597–1607 (1971)
- (12) Arechavaleta, G., Laumond, J.P., Hicheur, H., Berthoz, A.: An optimality principle governing human walking. IEEE Trans. Robot. 24(1), 5–14 (2008)
- (13) Atashpaz-Gargari, E., Lucas, C.: Imperialist competitive algorithm: An algorithm for optimization inspired by imperialistic competition. In: IEEE Congress on Evolutionary Computation, pp. 4661–4667. IEEE (2007). DOI 10.1109/CEC.2007.4425083
- (14) Audet, C., Dang, K.C., Orban, D.: Optimization of algorithms with OPAL. Math. Prog. Comp. 6(3), 233–254 (2014). DOI 10.1007/s12532-014-0067-x
- (15) Bailo, R., Bongini, M., Carrillo, J.A., Kalise, D.: Optimal consensus control of the cucker-smale model. IFAC-PapersOnLine 51(13), 1–6 (2018)
- (16) Bellomo, N., Dogbé, C.: On the modeling of traffic and crowds: A survey of models, speculations, and perspectives. SIAM Rev. 53, 409–463 (2011)
- (17) Bongini, M., Fornasier, M., Kalise, D.: (Un)conditional consensus emergence under perturbed and decentralized feedback controls. Discrete Contin. Dyn. Syst. 35(9), 4071–4094 (2015). DOI 10.3934/dcds.2015.35.4071
- (18) Borzì, A., Wongkaew, S.: Modeling and control through leadership of a refined flocking system. Math. Models Methods Appl. Sci. 25(2), 255–282 (2015). DOI 10.1142/S0218202515500098
- (19) Braess, D., Nagurney, A., Wakolbinger, T.: On a paradox of traffic planning. Transport. Sci. 39(4), 446–450 (2005)
- (20) Caponigro, M., Fornasier, M., Piccoli, B., Trélat, E.: Sparse stabilization and optimal control of the Cucker-Smale model. Math. Control Relat. Fields 3(4), 447–466 (2013). DOI 10.3934/mcrf.2013.3.447
- (21) Carrillo, J.A., D’Orsogna, M.R., Panferov, V.: Double milling in self-propelled swarms from kinetic theory. Kinet. Relat. Models 2(2), 363–378 (2009)
- (22) Carrillo, J.A., Fornasier, M., Toscani, G., Vecil, F.: Particle, kinetic, and hydrodynamic models of swarming. In: Mathematical modeling of collective behavior in socio-economic and life sciences, pp. 297–336. Springer (2010)
- (23) Carrillo, J.A., Martin, S., Wolfram, M.T.: An improved version of the Hughes model for pedestrian flow. Math. Models Methods Appl. Sci. 26(4), 671–697 (2016). DOI 10.1142/S0218202516500147
- (24) Cercignani, C., Illner, R., Pulvirenti, M.: The mathematical theory of dilute gases. Springer (1994)
- (25) Chitour, Y., Jean, F., Mason, P.: Optimal control models of goal-oriented human locomotion. SIAM J. Control Optim. 50(1), 147–170 (2012)
- (26) Cirillo, E.N.M., Muntean, A.: Dynamics of pedestrians in regions with no visibility - A lattice model without exclusion. Physica A 392, 3578–3588 (2013)
- (27) Clerc, M., Kennedy, J.: The particle swarm - explosion, stability, and convergence in a multidimensional complex space. IEEE Transactions on Evolutionary Computation 6(1), 58–73 (2002). DOI 10.1109/4235.985692
- (28) Colombi, A., Scianna, M., Alaia, A.: A discrete mathematical model for the dynamics of a crowd of gazing pedestrians with and without an evolving environmental awareness. Comput. Appl. Math. pp. 1–29 (2016). DOI 10.1007/s40314-016-0316-x
- (29) Colombo, R.M., Garavello, M., Lecureux-Mercier, M.: A class of nonlocal models of pedestrian traffic. Math. Models Methods Appl. Sci. 22, 1150023/1–34 (2012)
- (30) Coscia, V., Canavesio, C.: First-order macroscopic modelling of human crowd dynamics. Math. Models Methods Appl. Sci. 18(suppl01), 1217–1247 (2008)
- (31) Couzin, I.D., Krause, J., Franks, N.R., Levin, S.A.: Effective leadership and decision-making in animal groups on the move. Nature 433, 513–516 (2005)
- (32) Cristiani, E., Peri, D.: Handling obstacles in pedestrian simulations: Models and optimization. Appl. Math. Model. 45, 285–302 (2017)
- (33) Cristiani, E., Peri, D.: Robust design optimization for egressing pedestrians in unkwnown environments. Appl. Math. Model. 72, 553–568 (2019)
- (34) Cristiani, E., Piccoli, B., Tosin, A.: Multiscale modeling of granular flows with application to crowd dynamics. Multiscale Model. Simul. 9, 155–182 (2011)
- (35) Cristiani, E., Piccoli, B., Tosin, A.: Multiscale Modeling of Pedestrian Dynamics. Modeling, Simulation & Applications. Springer (2014)
- (36) Cristiani, E., Priuli, F.S.: A destination-preserving model for simulating Wardrop equilibria in traffic flow on networks. Netw. Heterog. Media 10, 857–876 (2015)
- (37) Cristiani, E., Priuli, F.S., Tosin, A.: Modeling rationality to control self-organization of crowds: An environmental approach. SIAM J. Appl. Math. 75(2), 605–629 (2015). DOI 10.1137/140962413
- (38) Cucker, F., Smale, S.: Emergent behavior in flocks. IEEE Trans. Autom. Contr. 52(5), 852–862 (2007)
- (39) Duan, H., Sun, C.: Swarm intelligence inspired shills and the evolution of cooperation. Sci. Rep. 4, 5210 (2014)
- (40) Düring, B., Markowich, P., Pietschmann, J.F., Wolfram, M.T.: Boltzmann and Fokker-Planck equations modelling opinion formation in the presence of strong leaders. Proc. R. Soc. A 465, 3687–3708 (2009)
- (41) Escobar, R., De La Rosa, A.: Architectural design for the survival optimization of panicking fleeing victims. In: W. Banzhaf, T. Christaller, P. Dittrich, J.T. Kim, J. Ziegler (eds.) ECAL 2003, LNAI 2801, pp. 97–106. Springer-Verlag Berlin Heidelberg (2003)
- (42) Etikyala, R., Göttlich, S., Klar, A., Tiwari, S.: Particle methods for pedestrian flow models: from microscopic to nonlocal continuum models. Math. Models Methods Appl. Sci. 24, 2503–2523 (2014). DOI 10.1142/S0218202514500274
- (43) Festa, A., Tosin, A., Wolfram, M.T.: Kinetic description of collision avoidance in pedestrian crowds by sidestepping. Kinet. Relat. Models 11(3), 491–520 (2018). DOI 10.3934/krm.2018022
- (44) Fornasier, M., Solombrino, F.: Mean-field optimal control. ESAIM Control Optim. Calc. Var. 20(4), 1123–1152 (2014). DOI 10.1051/cocv/2014009
- (45) Frank, G.A., Dorso, C.O.: Room evacuation in the presence of an obstacle. Physica A 390, 2135–2145 (2011). DOI 10.1016/j.physa.2011.01.015
- (46) Galor, O.: Discrete Dynamical Systems. Springer Verlag (2007)
- (47) Guo, R.Y., Huang, H.J., Wong, S.C.: Route choice in pedestrian evacuation under conditions of good and zero visibility: experimental and simulation results. Transportation Res. B 46(6), 669–686 (2012). DOI 10.1016/j.trb.2012.01.002
- (48) Haghani, M., Cristiani, E., Bode, N.W.F., Boltes, M., Corbetta, A.: Panic, irrationality, and herding: Three ambiguous terms in crowd dynamics research. J. Adv. Transport. 2019, Article ID 9267643 (2019). DOI 10.1155/2019/9267643
- (49) Han, J., Li, M., Guo, L.: Soft control on collective behavior of a group of autonomous agents by a shill agent. Jrl. Syst. Sci. & Complexity 19(1), 54–62 (2006). DOI 10.1007/s11424-006-0054-z
- (50) Han, J., Wang, L.: Nondestructive intervention to multi-agent systems through an intelligent agent. PLoS ONE 8(5), e61542 (2013). DOI 10.1371/journal.pone.0061542
- (51) Helbing, D.: Traffic and related self-driven many-particle systems. Rev. Mod. Phys. 73, 1067–1141 (2001)
- (52) Helbing, D., Buzna, L., Johansson, A., Werner, T.: Self-organized pedestrian crowd dynamics: Experiments, simulations, and design solutions. Transport. Sci. 39(1), 1–24 (2005)
- (53) Helbing, D., Farkas, I., Vicsek, T.: Simulating dynamical features of escape panic. Nature 407, 487–490 (2000)
- (54) Helbing, D., Molnár, P.: Social force model for pedestrian dynamics. Phys. Rev. E 51, 4282–4286 (1995)
- (55) Hendtlass, T.: Wosp: A multi-optima particle swarm algorithm. In: IEEE (ed.) Proceedings of the 2005 IEEE Congress on Evolutionary Computation, pp. 727–734. IEEE (2005)
- (56) Herty, M., Pareschi, L., Steffensen, S.: Mean-field control and Riccati equations. Netw. Heterog. Media 10(3), 699–715 (2015). DOI 10.3934/nhm.2015.10.699
- (57) Hughes, R.L.: A continuum theory for the flow of pedestrians. Transportation Res. Part B 36, 507–535 (2002)
- (58) Hughes, R.L.: The flow of human crowds. Annu. Rev. Fluid Mech. 35, 169–182 (2003)
- (59) Jiang, L., Li, J., Shen, C., Yang, S., Han, Z.: Obstacle optimization for panic flow - Reducing the tangential momentum increases the escape speed. PLoS ONE 9(12), e115463 (2014). DOI 10.1371/journal.pone.0115463
- (60) Johansson, A., Helbing, D.: Pedestrian flow optimization with a genetic algorithm based on boolean grids. In: N. Waldau, P. Gattermann, H. Knoflacher, M. Schreckenberg (eds.) Pedestrian and Evacuation Dynamics 2005, pp. 267–272. Springer-Verlag Berlin Heidelberg (2007)
- (61) Kachroo, P., Al-nasur, S.J., Wadoo, S.A., Shende, A.: Pedestrian dynamics. Feedback control of crowd evacuation. Understanding Complex Systems. Springer-Verlag, Berlin Heidelberg (2008)
- (62) Karper, T.K., Mellet, A., Trivisa, K.: Hydrodynamic limit of the kinetic Cucker–Smale flocking model. Math. Models Methods Appl. Sci. 25(01), 131–163 (2015). DOI 10.1142/S0218202515500050
- (63) Löhner, R.: On the modeling of pedestrian motion. Appl. Math. Model. 34, 366–382 (2010)
- (64) Matsuoka, T., Tomoeda, A., Iwamoto, M., Suzuno, K., Ueyama, D.: Effects of an obstacle position for pedestrian evacuation: SF model approach. In: M. Chraibi, M. Boltes, A. Schadschneider, A. Seyfried (eds.) Traffic and Granular Flow ’13, pp. 163–170. Springer International Publishing (2015)
- (65) Mayne, D.Q., Rawlings, J.B., Rao, C.V., Scokaert, P.O.M.: Constrained model predictive control: Stability and optimality. Automatica 36(6), 789 – 814 (2000). DOI 10.1016/S0005-1098(99)00214-9
- (66) Motsch, S., Tadmor, E.: A new model for self-organized dynamics and its flocking behavior. J. Stat. Phys. 144(5), 923–947 (2011). DOI 10.1007/s10955-011-0285-9
- (67) Naldi, G., Pareschi, L., Toscani, G. (eds.): Mathematical modeling of collective behavior in socio-economic and life sciences. Modeling and Simulation in Science, Engineering and Technology. Birkhäuser Boston, Inc., Boston, MA (2010). DOI 10.1007/978-0-8176-4946-3
- (68) Okazaki, S.: A study of pedestrian movement in architectural space, part 1: Pedestrian movement by the application of magnetic model. Trans. of A.I.J. 283, 111–119 (1979)
- (69) Okazaki, S.: A study of pedestrian movement in architectural space, part 2: Concentrated pedestrian movement. Trans. of A.I.J. 284, 101–110 (1979)
- (70) Okazaki, S.: A study of pedestrian movement in architectural space, part 3: Along the shortest path, taking fire, congestion and unrecognized space into account. Trans. of A.I.J. 285, 137–147 (1979)
- (71) Pareschi, L., Toscani, G.: Interacting multi-agent systems. Kinetic equations & Monte Carlo methods. Oxford University Press, USA (2013)
- (72) Parisi, D.R., Dorso, C.O.: Microscopic dynamics of pedestrian evacuation. Physica A 354, 606–618 (2005). DOI http://dx.doi.org/10.1016/j.physa.2005.02.040
- (73) Peri, D.: Hybridization of the imperialist competitive algorithm and local search with application to ship design optimization. Computers & Industrial Engineering 137, 1–30 (2019). DOI 10.1016/j.cie.2019.106069
- (74) Piccoli, B., Tosin, A.: Pedestrian flows in bounded domains with obstacles. Contin. Mech. Thermodyn. 21, 85–107 (2009)
- (75) Shukla, P.K.: Genetically optimized architectural designs for control of pedestrian crowds. In: K. Korb, M. Randall, T. Hendtlass (eds.) Artificial life: Borrowing from biology, LNCS, vol. 5865, pp. 22–31. Springer-Verlag Berlin Heidelberg (2009)
- (76) Toscani, G., Bellomo, N.: The Enskog-Boltzmann equation in the whole space : some global existence, uniqueness and stability results. Comput. Math. Applic. 13(9-11), 851–859 (1987)
- (77) Twarogowska, M., Goatin, P., Duvigneau, R.: Macroscopic modeling and simulations of room evacuation. Appl. Math. Model. 38(24), 5781–5795 (2014). DOI 10.1016/j.apm.2014.03.027
- (78) Villani, C.: Handbook of Mathematical Fluid Dynamics, vol. 1, chap. A review of mathematical topics in collisional kinetic theory. Elsevier (2002)
- (79) Wang, J., Zhang, L., Shi, Q., Yang, P., Hu, X.: Modeling and simulating for congestion pedestrian evacuation with panic. Physica A 428, 396–409 (2015). DOI 10.1016/j.physa.2015.01.057
- (80) Zhao, Y., Li, M., Lu, X., Tian, L., Yu, Z., Huang, K., Wang, Y., Li, T.: Optimal layout design of obstacles for panic evacuation using differential evolution. Physica A 465, 175–194 (2017). DOI 10.1016/j.physa.2016.08.021