Fluid segmentation in Neutrosophic domain
Abstract
Optical coherence tomography (OCT) as retina imaging technology is currently used by ophthalmologist as a non-invasive and non-contact method for diagnosis of age-related degeneration (AMD) and diabetic macular edema (DME) diseases. Fluid regions in OCT images reveal the main signs of AMD and DME. In this paper, an efficient and fast clustering in neutrosophic (NS) domain referred as neutrosophic C-means is adapted for fluid segmentation. For this task, a NCM cost function in NS domain is adapted for fluid segmentation and then optimized by gradient descend methods which leads to binary segmentation of OCT Bscans to fluid and tissue regions. The proposed method is evaluated in OCT datasets of subjects with DME abnormalities. Results showed that the proposed method outperforms existing fluid segmentation methods by 6% in dice coefficient and sensitivity criteria.
Index Terms:
Optical coherence tomography; Neutrosophic theory; Fluid segmentation; Retina diseasesI Introduction
Ophthalmologists use optical coherence tomography (OCT) as a non-contact method to diagnosis and follow up of retina disease. Fluid regions are detectable in OCT images and reveal abnormalities of retina disease including diabetic macula edema (DME) and age-related macular degeneration (AMD) [1]. Image processing and data mining applications have been widely used in many application [2, 3, 4, 5, 6, 7]. Fluid regions can be segmented automatically by image processing and data mining tools. Many fluid detection methods have been proposed in the literature such as kernel regression based segmentation of OCT images with DME [8], fluid-filled region delineation of boundaries in OCT [9], semi-automatic segmentation method for retinal OCT images tested in patients with diabetic macular edema [10], label propagation and higher-order constraint-based segmentation of fluid regions in OCT images of DME subjects [11], computerized assessment of intraretinal and subretinal fluid regions in OCT images of the retina [12], automated segmentation of pathological cavities in OCT scans [13], three-dimensional analysis of retinal layer and fluid-filled regions in OCT of the macula [14], probability constrained graph-search-graph-cut method for three-dimensional segmentation of fluid-associated abnormalities [15], fluid segmentation with shortest-path methods and neutrosophic (NS) theory [16, 17, 18, 19, 20, 21], fluid segmentation with deep convolutional networks (CNNs) [22, 23, 24, 25].
Smarandache proposed NS theory in 1995, a branch of philosophy which studies the origin, nature and scope of neutralities, as well as their interactions with different ideational spectra [26]. This theory has been applied on many applications including image segmentation [27, 28, 29, 30], image thresholding [31], image edge detection [32], content-based image retrieval [33, 34, 35, 36, 37], retinal image analysis [16, 17, 18, 19, 20], speech processing [38], data clustering [39, 40] and uncertainty handling [41, 42]. The main contribution of this work is to optimize a cost function in NS domain to binarize retina OCT scans to fluid and tissue regions. The cost function is derived from fuzzy c-means (FCM) and is optimized by gradient descend methods in subsequence iterations. The rest of this paper is organized as follows: Section II reviews FCM and NS theory. Section III presents the proposed method. Experimental results and conclusion are discussed in sections IV and V, respectively.
II Review of NS and FCM
Since the cost function in this work is an extension of FCM and is defined in NS domain, here, a review on FCM and NS is discussed shortly.
II-A FCM
The FCM is a clustering method that assigns a membership degree in interval [0-1] to each data point, Therefore, each data point is assigned to all clusters with different membership degrees and the sum of memberships to all clusters should be 1. FCM cost function is defined as follows:
| (1) |
where represents the membership degree of data point to the cluster with center . and are a norm metric and a constant variable for determining the fuzziness of the resulting partition, respectively. Minimizing FCM cost function leads to the following equations for the computation of membership degrees and cluster centers:
| (2) |
| (3) |
Firstly, membership degrees are initialized randomly and cluster centers are computed by Eq. (3). Then, membership degrees and cluster centers are computed repeatedly, until there is no significant changes of these parameters in subsequent iterations.
II-B Neutrosophic
NS theory is a newly brought up branches of philosophy. In this theory, set A, Anti-A (contemplates A in a correlation with its opposite), Neut-A (neutrality of A, neither A nor Anti-A) are defined [26]. In each application, NS sets should be defined for all data points as well as relations between sets. For example, in our problem of interest as image segmentation, each pixel in NS domain is modeled as meaning that it is percent true, percent indeterministic, and percent false. Therefore, three sets are defined for pixels in NS domain as follows [27]:
| (4) |
| (5) |
| (6) |
| (7) |
| (8) |
where, represents the intensity value of the pixel , is image matrix filtered by average filter with window size . Difference of two matrixes and is computed and stored in .
III Proposed Method
In this work, NCM cost function is used and adapted for OCT fluid segmentation. Since OCT scans contain noise and there is ambiguity between fluid pixels and many pixels in background and tissue, indeterminacy set in NS domain can be very useful and models such ambiguities easily. Here, each pixel in OCT scans are transferred to three sets , and by Eqs. (4), (6) and (8), respectively. Then, NS sets are presented for clustering cost function as follows:
| (9) |
| (10) |
| (11) |
| (12) |
Gradient descent method is used for cost function optimization which leads to the following relations for the computation of , and sets in NS domain and cluster centers.
| (13) |
| (14) |
| (15) |
| (16) |
| (17) |
Parameter is a common part in Eqs. (13)-(15). It is computed once and used three times which leads to speedup in each iteration of optimization. In the first step, clusters are considered for clustering. The reason is that there is layers in retina and each layer can be assigned to one cluster based on its texture and gray level. One extra cluster is considered for fluid regions as fluid cluster. After convergence, clusters are sorted ascendingly based on the gray level of cluster centers. The first cluster is considered as fluid cluster with label 1 and other clusters are considered as tissue clusters with label . Therefore, the proposed clustering scheme leads to a binary segmentation of OCT scans.
IV Experimental Results
IV-A Evaluation Metrics
To show the effectiveness of the proposed method, it has been evaluated with three metrics; dice coefficient, precision and sensitivity; computed from true positive (TP) fluid pixels detected as fluid, false positive (FP) tissue pixels detected as fluid, true negative (TN) tissue pixels detected as tissue and false negative (FN) fluid pixels detected as tissue.
| (18) |
| (19) |
| (20) |
These criteria are used to evaluate fluid segmentation results of automated methods in comparison with manually segmented fluid regions by ophthalmologist experts.
IV-B Dataset
The proposed fluid segmentation method is tested on a dataset from OPTIMA Cyst Segmentation Challenge which contains subjects with images per subject where the image resolution varies from to . The fluid regions of each OCT image are manually segmented by two ophthalmologist experts as ground truth images. This dataset is publicly available and can be found online111https://optima.meduniwien.ac.at/research/challenges/.
IV-C Resultes
Segmented fluid regions by the proposed method are compared with ground truth images. Fig. 1 depicts fluid regions segmented by expert and the proposed method for two scans, each scan in one row. The proposed fluid segmentation method is compared with 4 fluid segmentation methods proposed in [17] and [44, 45, 46]. The results of these methods are shown in Fig. 2. It is clear visually that the proposed method has lower number of false negaives which leads to higher accuracy.
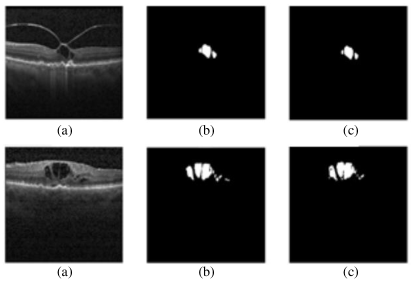
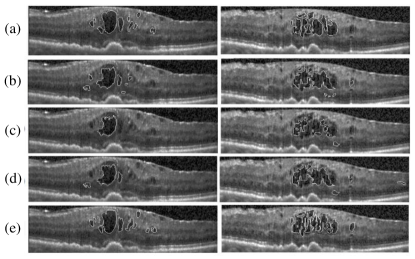
Table I reports the dice coefficient, sensitivity and precision of the proposed method and methods in [17] and [44, 45, 46]. Reported results in Table I are the comparison between all methods and fluid regions manually segmented by expert 1. Table II reports the same results but in comparison with expert 2. In comparison with the results of expert 1, the proposed method outperforms other methods with respect to dice coefficient and sensitivity of and , respectively. These measures of the proposed method in comparison with expert 2 are and which also outperforms other methods. For precision measure, methods in [17] with and [44] with have the best performance in comparison with expert 1 and 2, respectively.
| Expert 1 | Sub. |
|
|
|
|
|
||||||||||
|---|---|---|---|---|---|---|---|---|---|---|---|---|---|---|---|---|
| Dice Coeff | 1 | 73.49 | 80.43 | 71.40 | 82.96 | 83.17 | ||||||||||
| 2 | 73.90 | 55.10 | 45.49 | 78.11 | 74.61 | |||||||||||
| 3 | 78.46 | 75.35 | 69.54 | 82.23 | 84.85 | |||||||||||
| 4 | 78.12 | 71.78 | 71.15 | 80.75 | 86.32 | |||||||||||
| Ave. | 75.99 | 70.66 | 64.39 | 81.01 | 82.23 | |||||||||||
| Sensitivity | 1 | 70.81 | 82.19 | 72.49 | 84.43 | 86.95 | ||||||||||
| 2 | 96.79 | 99.04 | 70.45 | 98.94 | 98.42 | |||||||||||
| 3 | 75.72 | 85.13 | 47.38 | 85.18 | 86.58 | |||||||||||
| 4 | 78.78 | 80.59 | 77.79 | 84.49 | 90.51 | |||||||||||
| Ave. | 80.52 | 86.73 | 67.02 | 88.26 | 90.59 | |||||||||||
| Precision | 1 | 93.00 | 85.06 | 54.87 | 84.03 | 82.12 | ||||||||||
| 2 | 74.36 | 54.18 | 51.12 | 78.48 | 69.31 | |||||||||||
| 3 | 94.89 | 79.88 | 30.93 | 85.45 | 83.43 | |||||||||||
| 4 | 96.97 | 88.62 | 54.98 | 93.20 | 75.01 | |||||||||||
| Ave. | 89.80 | 76.93 | 47.97 | 85.29 | 77.46 |
| Expert 2 | Sub. |
|
|
|
|
|
||||||||||
|---|---|---|---|---|---|---|---|---|---|---|---|---|---|---|---|---|
| Dice Coeff | 1 | 72.96 | 79.10 | 68.17 | 82.90 | 83.03 | ||||||||||
| 2 | 71.68 | 55.11 | 45.81 | 79.09 | 78.12 | |||||||||||
| 3 | 82.33 | 79.34 | 65.01 | 80.36 | 82.22 | |||||||||||
| 4 | 77.91 | 71.56 | 72.55 | 80.87 | 83.12 | |||||||||||
| Ave. | 76.22 | 71.27 | 62.88 | 80.80 | 81.62 | |||||||||||
| Sensitivity | 1 | 69.95 | 78.56 | 66.75 | 80.94 | 83.35 | ||||||||||
| 2 | 92.25 | 94.54 | 64.71 | 94.45 | 93.86 | |||||||||||
| 3 | 81.49 | 90.95 | 54.84 | 90.75 | 92.15 | |||||||||||
| 4 | 78.54 | 80.22 | 77.56 | 83.70 | 91.06 | |||||||||||
| Ave. | 80.55 | 86.06 | 65.96 | 87.46 | 90.10 | |||||||||||
| Precision | 1 | 95.71 | 86.55 | 59.61 | 87.53 | 82.62 | ||||||||||
| 2 | 74.45 | 54.14 | 51.34 | 78.58 | 67.79 | |||||||||||
| 3 | 96.10 | 79.96 | 37.99 | 85.48 | 83.14 | |||||||||||
| 4 | 97.24 | 88.99 | 59.50 | 93.58 | 77.98 | |||||||||||
| Ave. | 90.87 | 77.41 | 52.11 | 86.29 | 77.88 |
V Conclusion
This paper presented a fluid segmentation method based on NCM cost function in NS domain. Minimizing the cost function resulted in binary segmentation of Oct images into tissue and fluid regions. Segmentation results on Optima dataset showed that the proposed method outperforms other segmentation methods in dice coefficient and sensitivity measures while for precision criteria, other methods had the best performance. Future efforts will be directed towards proposing a cost function in NS domain for better modeling of noise and uncertainty in OCT pixels. NS can model uncertainty of OCT pixels in deep convolutional networks and leads to more robust network against noise and imaging device. Therefore, using NS theory for fluid segmentation by CNN can be proposed as another future work.
References
- [1] Kafieh, R., Rabbani, H., Abramoff, M.D. and Sonka, M., ”Intraretinal layer segmentation of 3D optical coherence tomography using coarse grained diffusion map,” Medical image analysis, vol. 17, no. 8, pp. 907-928, 2013.
- [2] A. Rashno, B. Nazari, S. Sadri, M. Saraee, Effective pixel classification of mars images based on ant colony optimization feature selection and extreme learning machine, Neurocomputing 226 (2017) 66–79.
- [3] A. Rashno, H. SadeghianNejad, A. Heshmati, Highly efficient dimension reduction for text-independent speaker verification based on relieff algorithm and support vector machines”, International Journal of Signal Processing, Image Processing and Pattern Recognition 6 (1) (2013) 91–108.
- [4] A. Rashno, S. M. Ahadi, M. Kelarestaghi, Text-independent speaker verification with ant colony optimization feature selection and support vector machine, in: 2015 2nd International Conference on Pattern Recognition and Image Analysis (IPRIA), IEEE, 2015, pp. 1–5.
- [5] A. Rashno, M. Saraee, S. Sadri, Mars image segmentation with most relevant features among wavelet and color features, in: 2015 AI & Robotics (IRANOPEN), IEEE, 2015, pp. 1–7.
- [6] A. Rashno, F. S. Tabataba, S. Sadri, Image restoration with regularization convex optimization approach, Journal of Electrical Systems and Signals 2 (2) (2014) 32–36.
- [7] A. Rashno, F. S. Tabataba, S. Sadri, Regularization convex optimization method with l-curve estimation in image restoration, in: 2014 4th International Conference on Computer and Knowledge Engineering (ICCKE), IEEE, 2014, pp. 221–226.
- [8] Chiu, S.J., Allingham, M.J., Mettu, P.S., Cousins, S.W., Izatt, J.A. and Farsiu, S., ”Kernel regression based segmentation of optical coherence tomography images with diabetic macular edema,” Biomedical optics express, vol. 6, no. 4, pp. 1172-1194, 2015.
- [9] Fernandez DC, ”Delineating fluid-filled region boundaries in optical coherence tomography images of the retina,” IEEE transactions on medical imaging, vol. 24, no. 8, pp. 929–945, 2005.
- [10] Huang Y, Danis RP, Pak JW, Luo S, White J, Zhang X, et al., ”Development of a semi-automatic segmentation method for retinal oct images tested in patients with diabetic macular edema,” PloS one, vol. 8, no. 12, p. e82922, 2013.
- [11] Wang T, Ji Z, Sun Q, Chen Q, Yu S, Fan W, et al., ”Label propagation and higher-order constraint-based segmentation of fluid-associated regions in retinal sd-oct images,” Information Sciences, vol. 358, pp. 92–111, 2016.
- [12] Zheng Y, Sahni J, Campa C, Stangos AN, Raj A, Harding SP., ”Computerized assessment of intraretinal and subretinal fluid regions in spectral-domain optical coherence tomography images of the retina,” American journal of ophthalmology, vol. 155, no. 2, pp. 277–286, 2013.
- [13] Pilch M, Stieger K, Wenner Y, Preising MN, Friedburg C, zu Bexten EM, et al., ”Automated segmentation of pathological cavities in optical coherence tomography scanspathological cavities in oct scans,” Investigative ophthalmology & visual science, vol. 54, no. 6, pp. 4385–4393, 2013.
- [14] Quellec G, Lee K, Dolejsi M, Garvin MK, Abramoff MD, Sonka M., ”Three-dimensional analysis of retinal layer texture: identification of fluid-filled regions in sd-oct of the macula,” IEEE transactions on medical imaging, vol. 29, no. 6, pp. 1321–1330, 2010.
- [15] Chen X, Niemeijer M, Zhang L, Lee K, Abràmoff MD, Sonka M. ”Three-dimensional segmentation of fluid-associated abnormalities in retinal oct: probability constrained graphsearch-graph-cut,” IEEE transactions on medical imaging, vol. 31, no. 8, pp. 1521–1531, 2012.
- [16] Rashno A, Koozekanani DD, Drayna PM, Nazari B, Sadri S, Rabbani H, et al., ”Fully-automated segmentation of fluid/cyst regions in optical coherence tomography images with diabetic macular edema using neutrosophic sets and graph algorithms,” IEEE Transactions on Biomedical Engineering, 2017.
- [17] A. Rashno, B. Nazari, D. D. Koozekanani, P. M. Drayna, S. Sadri, H. Rabbani, K. K. Parhi, ”Fully-automated segmentation of fluid regions in exudative age-related macular degeneration subjects: Kernel graph cut in neutrosophic domain,” PloS one vol. 12, no. 10, pp. e0186949, 2017.
- [18] Kohler J, Rashno A, Parhi KK, Drayna PM, Radwan S, Koozekanani DD., ”Correlation between initial vision and vision improvement with automatically calculated retinal cyst volume in treated dme after resolution,” Investigative Ophthalmology & Visual Science, vol. 58, no. 8, pp. 953–953, 2017.
- [19] Parhi KK, Rashno A, Nazari B, Sadri S, Rabbani H, Drayna PM, et al., ”Automated fluid/cyst segmentation: A quantitative assessment of diabetic macular edema,” Investigative Ophthalmology & Visual Science, vol. 58, no. 8, pp. 4633–4633, 2017.
- [20] A. Rashno, K. K. Parhi, B. Nazari, S. Sadri, H. Rabbani, P. Drayna, D. D. Koozekanani, ”Automated intra-retinal, subretinal and sub-rpe cyst regions segmentation in age-related macular degeneration (amd) subjects,” Investigative Ophthalmology & Visual Science, vol. 58, no. 8, pp. 397–397, 2017.
- [21] Salafian, B., Kafieh, R., Rashno, A., Pourazizi, M. and Sadri, S., ”Automatic segmentation of choroid layer in edi oct images using graph theory in neutrosophic space,” arXiv preprint arXiv:1812.01989, 2018.
- [22] Bogunović, H., Venhuizen, F., Klimscha, S., Apostolopoulos, S., BabHadiashar, A., Bagci, U., Beg, M.F., Bekalo, L., Chen, Q., Ciller, C. and Gopinath, K., ”RETOUCH-The Retinal OCT Fluid Detection and Segmentation Benchmark and Challenge,” IEEE transactions on medical imaging, 2019.
- [23] Rashno, A., Koozekanani, D.D. and Parhi, K.K., ”Oct fluid segmentation using graph shortest path and convolutional neural network,” In 2018 40th Annual International Conference of the IEEE Engineering in Medicine and Biology Society (EMBC), pp. 3426- 3429, 2018.
- [24] Montuoro, A., Waldstein, S.M., Gerendas, B.S., Schmidt-Erfurth, U. and Bogunović, H., ”Joint retinal layer and fluid segmentation in OCT scans of eyes with severe macular edema using unsupervised representation and auto-context,” Biomedical optics express, vol. 8, no. 3, pp. 1874-1888, 2017.
- [25] Roy, A.G., Conjeti, S., Karri, S.P.K., Sheet, D., Katouzian, A., Wachinger, C. and Navab, N., ”ReLayNet: retinal layer and fluid segmentation of macular optical coherence tomography using fully convolutional networks,” Biomedical optics express, vol. 8, no. 8, pp. 3627- 3642, 2017.
- [26] Smarandache, F. ed., ”A unifying field in logics: Neutrosophic logic: neutrosophy, neutrosophic set, neutrosophic probability,” Infinite Study, 2003.
- [27] Guo, Y. and Cheng, H.D., ”New neutrosophic approach to image segmentation,” Pattern Recognition, vol. 42, no. 5, pp. 587-595, 2009.
- [28] Zhang, M., Zhang, L. and Cheng, H.D., ”A neutrosophic approach to image segmentation based on watershed method,” Signal Processing, vol. 90, no. 5, pp. 1510-1517, 2010.
- [29] Sengur, A. and Guo, Y., ”Color texture image segmentation based on neutrosophic set and wavelet transformation,” Computer Vision and Image Understanding, vol. 115, no. 8, pp. 1134-1144, 2011.
- [30] Heshmati, A., Gholami, M. and Rashno, A., ”Scheme for unsupervised colour–texture image segmentation using neutrosophic set and non-subsampled contourlet transform,” IET Image Processing, vol. 10, no. 6, pp. 464-473, 2016.
- [31] Guo, Y., Şengür, A. and Ye, J., ”A novel image thresholding algorithm based on neutrosophic similarity score,” Measurement, vol. 58, pp. 175-186, 2014.
- [32] Guo, Y. and Şengür, A., ”A novel image edge detection algorithm based on neutrosophic set,” Computers & Electrical Engineering, vol. 40, no. 8, pp. 3-25, 2014.
- [33] Rashno, A., Smarandache, F. and Sadri, S., ”Refined neutrosophic sets in content-based image retrieval application,” In 2017 10th Iranian Conference on Machine Vision and Image Processing (MVIP), pp. 197-202, 2017.
- [34] Rashno, A. and Sadri, S., ”Content-based image retrieval with color and texture features in neutrosophic domain,” In 2017 3rd International Conference on Pattern Recognition and Image Analysis (IPRIA), pp. 50-55, 2017.
- [35] Rashno, A., Sadri, S. and SadeghianNejad, H., ”An efficient content-based image retrieval with ant colony optimization feature selection schema based on wavelet and color features,” In 2015 The International Symposium on Artificial Intelligence and Signal Processing (AISP), pp. 59-64, 2015.
- [36] Rashno, A. and Rashno, E., ”Content-based image retrieval system with most relevant features among wavelet and color features,” arXiv preprint arXiv:1902.02059, 2019.
- [37] S. Fadaei, A. Rashno, E. Rashno, Content-based image retrieval speedup, arXiv preprint arXiv:1911.11379.
- [38] Rashno, E., Akbari, A. and Nasersharif, B., ”A Convoloutional Neural Network model based on Neutrosophy for Noisy Speech Recognition,” Infinite Study, 2019.
- [39] Rashnoa, E., Minaei-Bidgolia, B. and Guo, Y., ”An effective clustering method based on data indeterminacy in neutrosophic set domain,” Infinite Study, 2018.
- [40] Guo, Y. and Sengur, A., ”NCM: Neutrosophic c-means clustering algorithm,” Pattern Recognition, vol. 48, no. 8, pp. 2710-2724, 2015.
- [41] Rashno, E., Norouzi, S.S., Minaei-Bidgoli, B. and Guo, Y., ”Certainty of outlier and boundary points processing in data mining,” In 2019 27th Iranian Conference on Electrical Engineering (ICEE), pp. 1929-1934, 2019.
- [42] Rashno, E. and Minaei-Bidgoli, B., ”Boundary points handling for image edge detection based on Neutrosophic set,” In 2019 5th Conference on Knowledge Based Engineering and Innovation (KBEI), pp. 886-890, 2019.
- [43] Bezdek, J.C., Ehrlich, R. and Full, W., ”FCM: The fuzzy c-means clustering algorithm,” Computers & Geosciences, vol. 10, no. 2-3, pp. 191-203, 1984.
- [44] Boykov, Y. and Funka-Lea, G., ”Graph cuts and efficient ND image segmentation,” International journal of computer vision, vol. 70, no. 2, pp. 109-131, 2006.
- [45] Salah, M.B., Mitiche, A. and Ayed, I.B., ”Multiregion image segmentation by parametric kernel graph cuts,” IEEE Transactions on Image Processing, vol. 20, no. 2, pp. 545-557, 2010.
- [46] Esmaeili, M., Dehnavi, A.M., Rabbani, H. and Hajizadeh, F., ”Three-dimensional segmentation of retinal cysts from spectral-domain optical coherence tomography images by the use of three-dimensional curvelet based K-SVD,” Journal of medical signals and sensors, vol. 6, no. 3, p. 166, 2016.