11email: s6michau@uni-bonn.de, 11email: jens.lehmann@cs.uni-bonn.de 22institutetext: Farfetch, Porto, Portugal, 22email: diego.esteves@farfetch.com 33institutetext: Enterprise Information Systems, Fraunhofer IAIS, Dresden, Germany 33email: jens.lehmann@iais.fraunhofer.de
Open-domain Event Extraction and Embedding for Natural Gas Market Prediction
Abstract
We propose an approach to predict the natural gas price in several days using historical price data and events extracted from news headlines. Most previous methods treats price as an extrapolatable time series, those analyze the relation between prices and news either trim their price data correspondingly to a public news dataset, manually annotate headlines or use off-the-shelf tools. In comparison to off-the-shelf tools, our event extraction method detects not only the occurrence of phenomena but also the changes in attribution and characteristics from public sources. Instead of using sentence embedding as a feature, we use every word of the extracted events, encode and organize them before feeding to the learning models. Empirical results show favorable results, in terms of prediction performance, money saved and scalability.
Keywords:
Natural language processing Semantic Web Natural gas industry.1 Introduction
Accurate market forecasting is a major advantage in business. However, there have been controversies about its feasibility in the academic world. Examining the stock market, [14] proposes the Efficient Market Hypothesis (EMH) which states that all information is reflected through the price. Moreover, regardless of how precise a price prediction is, once one acts on it, the price would change, invalidating the original prediction. This theory is also supported by Burton Malkiel [22]. Later on, his position had changed in [16], claiming that there are certain patterns of the market that investors may benefit from, albeit quickly volatile. Moreover, [21] states that while the argument for or against EMH is far from over, it is beneficial to find a more useful theory and prediction method than its alternatives. In this view, devising market prediction methods can be seen as a race to outperform other methods.
Unlike in the stock market, there are few attempts on commodities market prediction [40]. However, important commodities such as oil, gas, and gold are getting more sensitive to macroeconomic news and surprise interest rate changes [29]. While most works [4, 35, 20, 34, 7, 38] predict the price of the next day, we aim to provide the price prediction on a longer window, which is more favorable to investors. Inspired by the sensitivity of the stock market to the mood of news, most methods use positiveness or negativeness of news as a pointer for prediction. We argue that the market is not only sentimental-driven but also event-driven. Furthermore, we aim to solve the scarcity of unannotated and annotated news data by using public data. Most researchers [20, 34, 5, 1, 28] have to either purchase or manually annotate their news datasets, which lead to difficulties in experimenting with long price series. To those ends, we rely on headlines from public news API and propose an approach to both filter irrelevant headlines and address the event extraction preliminary in [32]. Both price and text are fed to a 3D Convolution Neural Network [37] to learn the correlation between events and the market movement00footnotetext: The code repository of our work is at https://github.com/minhtriet/gas˙market.
2 Related work
In this section, we review existing benchmarks of market prediction tasks. One of the first discussion dated back in 1970 by [17]. The rise of computing power allowed more methods to emerge. In Table 1, we highlight their temporal evolution and henceforth categorize them by their input features and architecture.
| Method | Year | Features | Architecture |
| [20] | 1996 | Price | Feedforward network |
| [34] | 2002 | Price | Feed forward network |
| [38] | 2013 | Price | Recurrent Neural Network |
| [40] | 2013 | Bag of words | GARCH [12] |
| [10] | 2014 | BOW, TF-IDF | SVM, Neural Network |
| [26] | 2015 | Price, feature from text | Bidirectional RNN |
| [7] | 2017 | Price | Hidden Markov Model |
| [6] | 2017 | Price | Recurrent Neural Network and autoencoders |
| [36] | 2017 | Price | Bilinear layer and temporal attention mechanism |
| [19] | 2017 | Price and Word embedding | Bidirectional RNN |
| [33] | 2018 | Price | Recurrent Neural Network |
| [4] | 2018 | Price | Autoregressive model |
| [35] | 2018 | Price | Autoregressive model |
2.1 Price prediction
2.1.1 Price as the only feature
In the stock market, a common task is to predict and maximize the return by predicting the selling and buying time for a stock. Models being used come from the auto-regressive model [4, 35] to Feed-forward Neural Network [20, 34]. The difference between them is that [34] uses genetic algorithm, rather than gradient method, to train the weight of the network. Another method is Hidden Markov Models [7]. [33, 38] claims that RNN is superior to feed-forward network. [6] uses autoencoder in combination with RNN. [36] proposes the use of bilinear layer and temporal attention mechanism.
2.1.2 Effect of news to the market
From an economic perspective, [15] shows that (1) negative news affects the market more than positive news, and (2) the perception of positive or negative changes over time. Analogously, there has been a growing body of NLP works concerning sentimental analyzing [27, 39, 30, 9]. [8] used dictionary-based and phrase analysis to classify the sentiment of news. They observed that the stock market is more volatile on days with relevant news than days with irrelevant news or without news. Using data from Thomson Reuters, [40], filters by topic code and their manual bag-of-words then employs [12] to calculate the volatility of the market. They confirm the effect of the news on the crude oil market.
2.1.3 News-based prediction
The line of work above inspired the approach to use news headlines to predict the increment or decline of the market. All the methods in this section [26, 10, 11, 19] used the published datasets from Reuters and Bloomberg. [19] fuse news and prices to predict price increments or decrements. Their model is Bidirectional Recurrent Network with GRU gates with prebuilt word embedding. [10] used Reverb to split sentences into Subjects, Verb, Objects, and concatenate them in different ways and feed to an SVM and a Neural Network. [10, 11] propose an event embedding with a feed-forward neural network to predict the price of the stock market. [26] calculate price delta in two consecutive days. They defined seed words, which may serve as reliable indicators of market movements, then use word embedding to select the other 1000 words that are closest to them. They also handcrafted features including TF-IDF score, polarity score and categorical-tag (e.g, new-product, acquisition, price-rise, and price-drop).
2.2 Relation extraction
Information extraction (IE) addresses the task of detecting and classifying semantic relationships from the unstructured or semi-structured text. There are databases of encyclopedic relationships (Freebase, DBPedia, YAGO) that rarely change (e.g., born_on, published_by, founded_on, spouse_of). Schema.org gives exhibition, festival, food, sport events amongst different classes of actions. In spite of the growth of databases, it is not straightforward to map from raw text to such a structure. Due to the nature of ubiquity and ambiguity, annotation is prohibitively expensive. This need inspires many relation extraction methods. Among them, distant supervision [25] stands out for its ability to leverage of known relationships to classify a new relationship. However, its reliance on the occurrence of known objects contradicts with the ever-changing relationship between entities in news. We argue that there are possibilities of a new event that cannot be captured in a taxonomy. Therefore, we aim to address an open domain problem as such, not just a combination of different closed domains. Comparing to the closed domain event detection, open domain event recognition is a standing challenge.
We argue that there are possibilities of a new event that cannot be captured in a taxonomy. Therefore, we aim to address an open domain problem as such, not just a combination of different closed domains. Comparing to the closed domain event detection, open domain event recognition is a standing challenge.
One approach to solve this task is using off-the-shelf IE frameworks (OpenIE, Reverb) for relation extraction as seen in [11]. [28] uses part of speech to extract events and classify events into 23 types of events using a generative model based on LinkLDA [13]. In the end, they classify if a tweet shows an event or not, then further categorize that event into 23 classes (e.g. Political, Sport, Product) and further subclasses (e.g. unveils - unveiled - announces for class Product), rather than extracting every event on that tweet. It is tricky to measure the accuracy of an open domain relation extraction method due to a lack of datasets. [3, 28] attempt it by manually annotate on a selected few hundred tweets or Wikipedia sentences.
2.3 Word and sentences embedding
A common method to embed information from a sentence is using Sentence embedding, a natural continuation from Word embedding. spaCy and fasttext treat an embedding of a sentence as a normalized or unnormalized average of its words’ embedding. While it helps in some cases, two sentences with opposite meanings can have a small distance for just sharing a large number of similar words. A simple fix is concatenating the embedding of every word. This method would, however, easily inject noises into the model as informative bits get merged with noisy ones (Table 2). [10] created a set of features by first getting the result (Subject, Verb, Obj), casting the Verb to its class using Verbnet [31], then one-hot encode all subjects, objects, and verbs, then define a set of concatenation of objects and verbs as feature. [11] follows the same approach, but use word embedding instead.
| Date | Headline | Date | Headline |
| 2007-04-27 | Energy vs environment? | 2007-05-03 | Shell on a roll |
| 2007-05-16 | Big cap oil and mining | 2007-05-17 | Alternative energy |
| 2007-05-24 | Stress testing the hedge fund sector | 2007-05-27 | Darfur syndrome and Burma’s grief |
| 2007-08-17 | Soil mates | 2007-09-22 | Master of the Universe (Rtd) |
| 2007-09-23 | Eni in Kazakhstan | 2007-10-30 | Texas Gold |
| 2007-11-06 | A Map of the Oil World | 2010-07-19 | For Cajuns, What Now? |
| 2013-09-26 | An Indian Tribe’s Battle | 2015-04-23 | New Balance of Power |
| 2015-08-04T | Qatar’s Liquid Gold | 2015-12-08 | Clean Sailing |
| 2016-07-13 | Report on China’s Coal Power Projects | 2018-04-14 | Grand National 2018: horse-by-horse betting guide |
3 Event extraction and embedding
Human instinctively understand event, but it is elusive to put that understanding in a computer. [18] classifies three different methods for event extraction (1) Data-driven which applies statistics to extract patterns, (2) Knowledge driven which applies syntactic and schema and (3) Hybrid. According to their taxonomy, ours is a hybrid method, which leaned toward data-driven approach. As a motivation example, we use two news headlines, in which the events are underlined.
| Cuadrilla pauses mining operations after tremor in Lancashire site. | (1) | ||
| With natural gas plentiful and cheap, carbon capture projects stumble. | (2) |
Although two events above do not contain any verbs, they convey an occurrence of a phenomenon in (1) and a change of attribute in (2). Moreover, Reverb could not extract any relation in these headlines. As we consider a headline a condensed version of the whole article, every event is of significance. For the sake of generalization, we define an event as a clause or phrase that conveys the occurrence of a phenomenon, an act or a change of an attribute.
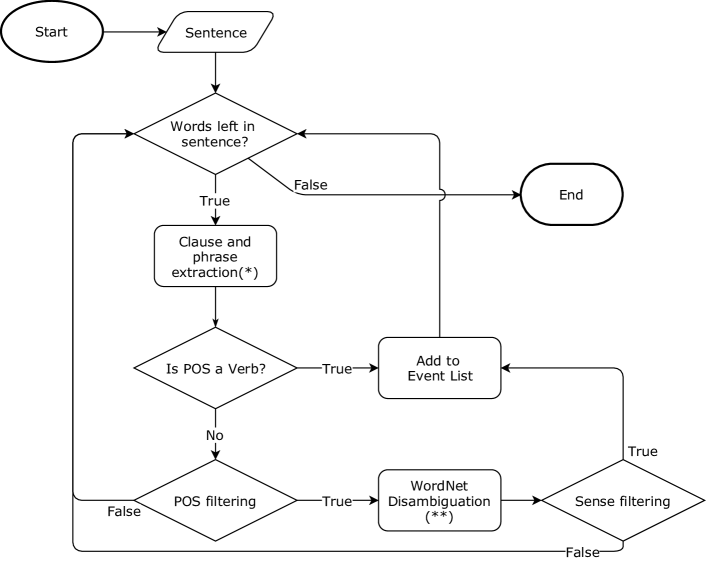
Inspired by [3, 2], we define a pipeline (Figure 1) to identify an event indicator using linguistic features, WordNet [24] and a word sense disambiguation tool [41], which classifies lexical meaning of words from a sentence according to WordNet taxonomy. We depict the amount comparison of different methods in Figure 2.

4 Experiments and Evaluation
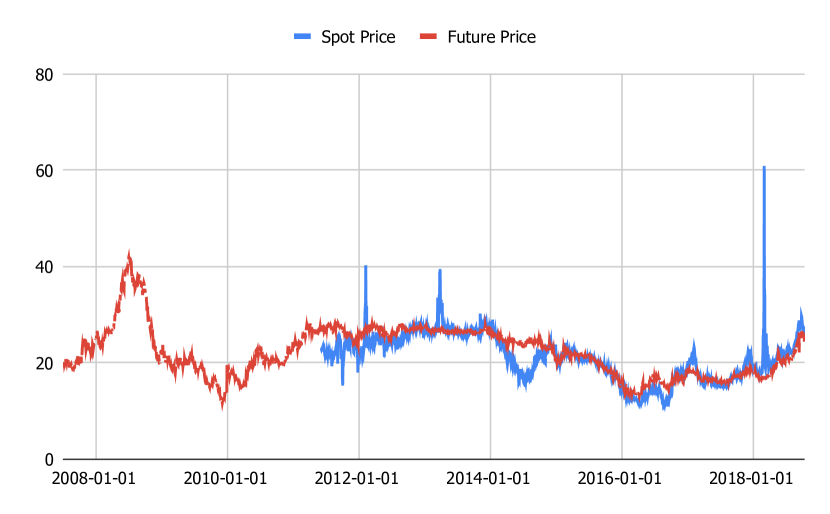
In this section, we aim to test the predictive power of different models as well as applying them to a mock trading scenario to measure the amount of money saved. Before getting to the details, it may be beneficial to understand the structure of the natural gas market. It consists of the weekday-only future market in which an order is delivered from three months to three years, and the daily spot market in which an order is delivered on the very next day.
4.1 Data Description
Our training data includes price series from Bayer AG suppliers (Figure 3(a)). The future prices and spot price series are from 2 July 2007 to 12 October 2018 and from 2 June 2011 to 18 October 2018, respectively. We use the oldest 60% of the future price as the training data. The rest 40% and Spot Market price series are test data. Corresponding news headlines are from The New York Times111https://developer.nytimes.com, Accessed: 2018-11-08 (NYT), The Guardian222https://open-platform.theguardian.com, Accessed: 2018-11-08 (TG) and The Financial Times333https://developer.ft.com/portal, Accessed: 2018-11-08 (FT) published in the correspond time with the aforementioned price data. All the news providers give the ability to filter news within a time range. TG and FT require a keyword (we chose ”gas”) and return filtered results while NYT requires downloading the whole dataset. To ensure textual data homogeneity, we use the same keyword to filter the NYT dataset and name it NYT filtered, the unfiltered dataset is NYT unfiltered. An overview of the news dataset is in Figure 3(b). Note that the filter works in the body of the news article, therefore some headlines may sound irrelevant at first glance (Table 2).
4.2 Baselines
4.2.1 Weak baselines
Let be two dates, , the price of gas on day , in which 0 means and 1 otherwise. We use chained CRF with the GloVe embedding of filtered news on day to find . For another baseline, we reimplement [10] with One hot encoding. The result shown in Table 3(a) agrees with the results described in the original paper. We experiment [10] for regression with horizon in Table 3(b). Evidently, the loss increases with the length of the prediction window size.
4.2.2 Strong baseline
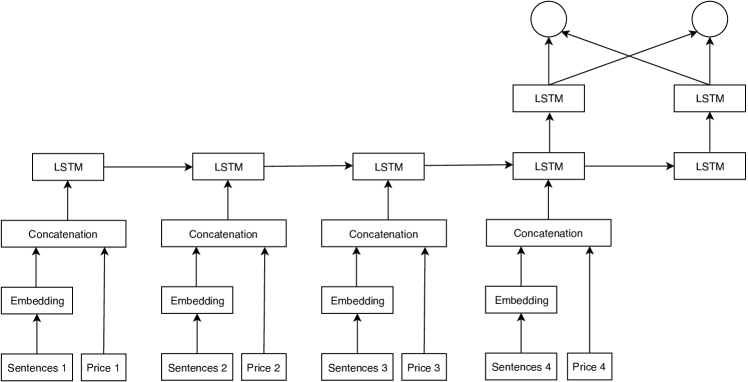
We feed the price and embedding of filtered news using English models of spaCy to a stacked LSTM structure as a strong baseline. Learning rate is , dropout rate is 0.5, the LSTM layers have [128, 32] neurons. We compare it with our approach in Table 4.
4.3 Event embedding with 3D Convolution (C3D)
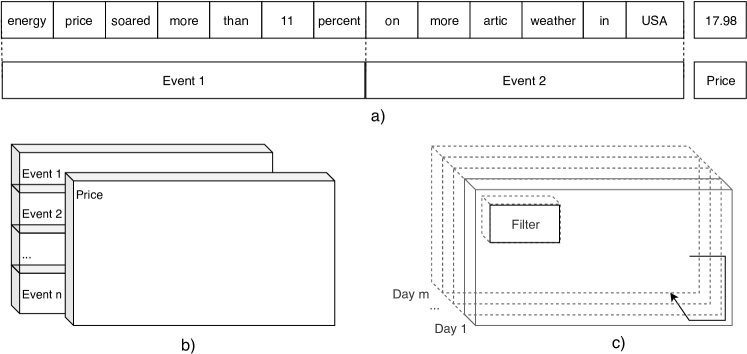
3D Convolution [37] is a method for video analyzing. In this paper, we apply it to a sequence of tensors, each of them being an embedding of the price and events of each day. The demonstration of this embedding is in Figure 5. We first process the textual data. After putting a headline through the event extraction pipeline, we receive a list of events strings. Given an event string, we first remove the stop words, then convert the rest to their stemming. Words that appear in more than 90% or less than three headlines are removed. In total, we have a vocabulary size of 2394 words + 1 OOV symbol for the training set. Each day is then formatted to contain 5 events; each event has 15 words. If a day has less than 5 events, an OOV vector is inserted into a random position to ensure homogeneous dimensions. If an event is shorter than 15 words, we OOV right pad it. Otherwise, its 15 first words are taken as input. To process price data, we first fit a standard scaler on the price of the training set, then use the same scaler to transform the price of the test set. Size of the kernel is . Learning rate is , we are using SGD with Nesterov Momentum, decay rate . We show the experiment results in Table 4.
| Dataset | Method | Small English model | Large English model |
| NYTf+FT+TG | LSTM | 5.162 | 4.89 |
| C3D | 2.862 | 2.858 | |
| NYTu+FT+TG | LSTM | 25.513 | 25.189 |
| C3D | 22.862 | 22.158 |
4.4 Apply to mock trading
4.4.1 Settings
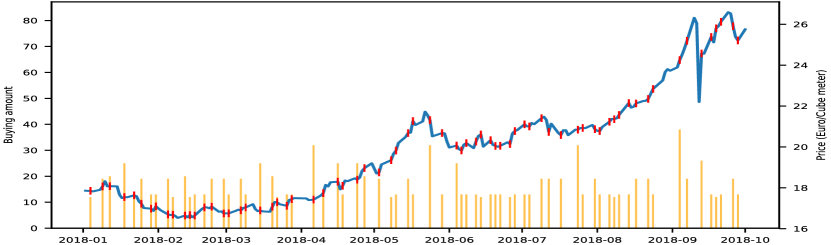
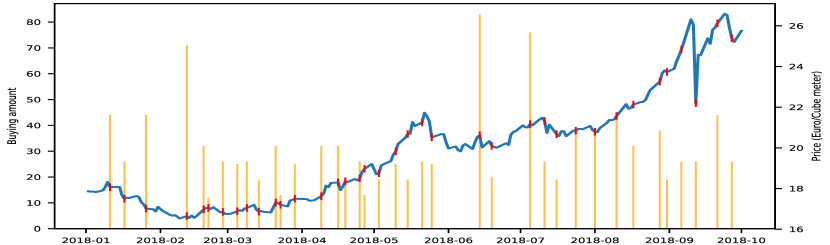
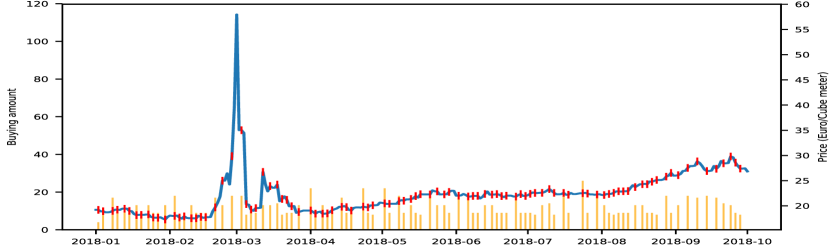
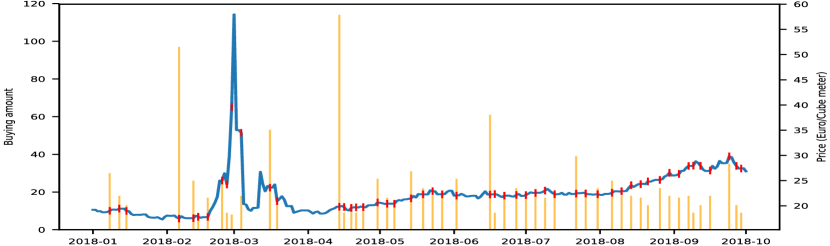
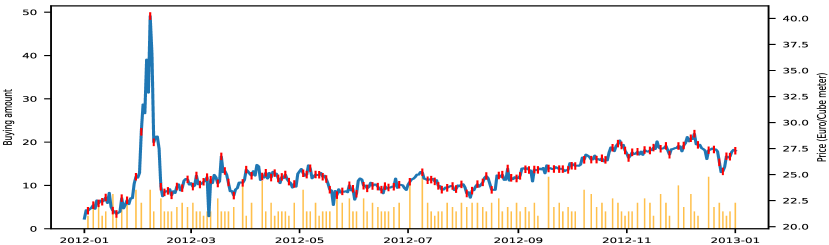
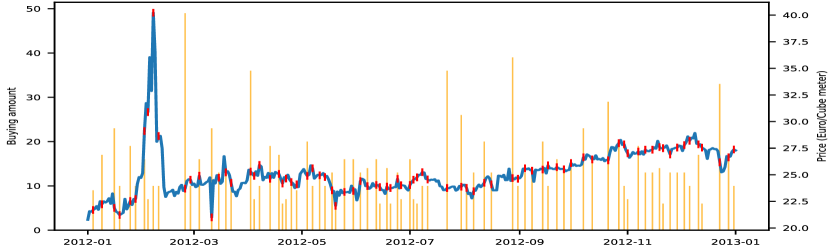
The goal is to buy 1200m3 of natural gas within days. A daily goal is m3, on day the algorithm should have bought m3. In other word, if the algorithm does not buy on day , it must buy the neglected amount in the next purchase. Given day and prediction from the model trained with NYTf + TG + FT, if , buy immediately. The experiments in different markets and time frames are in Figure 7 and Table 5. To see if the event extraction pipeline chooses the relevant words, we rank the words with the highest TF-IDF score in Table 6.
| Volume () | Cost (€) | Average cost (€) | ||
| Weighted | Unweighted | |||
| Baseline | 1,200 | 24,320.40 | 20.27 | 20.27 |
| Figure 6(a) | 1,200 | 23,895.28 | 19.91 | 19.84 |
| Figure 6(b) | 1,187 | 23,600.87 | 19.88 | 19.74 |
| Baseline | 1,200 | 26,707.00 | 22.26 | 22.26 |
| Figure 6(c) | 1,186 | 26,361.74 | 22.22 | 21.95 |
| Figure 6(d) | 1,191 | 26,659.71 | 22.38 | 22.18 |
| Baseline | 1200 | 31207.31 | 26.01 | 26.01 |
| Figure 7(a) | 1,198 | 31,262.27 | 26.09 | 25.34 |
| Figure 7(b) | 1,196 | 30,124.03 | 25.19 | 25.11 |
| № | (a) | (b) | (c) |
| 1 | Sudan | energy | oil |
| 2 | price | price | energy |
| 3 | deal | nature | price |
| 4 | drill | fall | FTSE |
| 5 | nature | shale | fall |
| 6 | energy | hit | shale |
| 7 | approve | say | power |
| 8 | state | over | coal |
| 9 | give | new | deal |
| 10 | reach | low | Shell |
| № | (a) | (b) | (c) |
| 1 | nature | energy | energy |
| 2 | week | oil | gas |
| 3 | change | China | oil |
| 4 | US | Trump | China |
| 5 | China | trade | Trump |
| 6 | trade | plan | trade |
| 7 | UK | rise | price |
| 8 | supply | LNG | LNG |
| 9 | regulation | plan | UK |
| 10 | sell | demand | raise |
4.4.2 Result analysis
Both methods decide to buy on 07 February 2012 (Figure 7(a) and Figure 7(b)) when the market reaches its peak at 40.27 €/m3. A query for “natural gas” from 06 February 2012 to 08 February 2012444https://www.google.com/search?q=%22natural+gas%22+%2B+news&tbs=cdr:1,cd˙min:2/6/2012,cd˙max:2/8/2012 returns a handful of results and does not show any news covering the shocking increment of this market. We conclude that this movement went under the radar. In the case of the sharp increment on 01 March 2018, there was news related to the matter, but not in both of our filtered and unfiltered news dataset.
On a brighter note, in Figure 6(b) and 7(b), C3D is always able to buy when the market is at the lowest peak (12 September 2018 in Future Market and 11 March 2012 in Spot Market). News headlines includes ”Energy price cap could be a muddle that satisfies no one”, ”In a victory for energy companies, the administration plans to roll back rules covering methane leaks” for the first peak and ”Republicans’ tired remedy for rising gas prices won’t fix anything”, ”California drivers are using a lot less gas than they did in 2005”. These decisions, however, do not save much money due to their small volumes. It is also evident in the small amount the third last purchase in Figure 6(b), even that was when the market reached a low peak. Therefore, the amount of money saved may not be a strong performance indicator. An approach frames it into a reinforcement learning (RL) problem. Comparing different attempts, [23] claims that RL delivers a substantive improvement on profitability and forecast accuracy. They do not conclude the performance of deep learning versus reinforcement learning in a financial context and suggest more work about comparing between RL and deep neural network.
5 Conclusion
We propose a new method to predict the natural gas price. Instead of averaging the embedding vectors, we extract and organize events from news and reshape them into 3D tensors. A limitation of our method is the reliance on the window approach for prediction. It is tricky to determine the length of the window that includes all events that have effects on the price of a specific day. An alternative is being worked on in [32], in which they propose using a chain of linked events instead of the window-based method. Furthermore, our method cannot take in the events that happen on a non-trading day due to the high coupling of prices and events. The news headlines curation needs minimum collecting efforts. Transfer learning only requires retraining on the last layers. Overall, our approach allows easier adaption to different domains prediction with minimal changes. We compare the money saved using our method and the average market price and prove its efficiency as well as the importance of a better purchase strategy.
5.0.1 Acknowledgement
We are immensely grateful to Dr. Bernard Sonnenschein for his comments on an earlier version of the manuscript.
References
- [1] Aiello, L.M., Petkos, G., Martin, C., Corney, D., Papadopoulos, S., Skraba, R., Goker, A., Kompatsiaris, I., Jaimes, A.: Sensing trending topics in twitter. Trans. Multi. 15(6), 1268–1282 (Oct 2013). https://doi.org/10.1109/TMM.2013.2265080, https://doi.org/10.1109/TMM.2013.2265080
- [2] Angeli, G., Premkumar, M.J.J., Manning, C.D.: In: ACL (1)
- [3] Araki, J., Mitamura, T.: Open-domain event detection using distant supervision. In: Proceedings of the 27th International Conference on Computational Linguistics. pp. 878–891. Association for Computational Linguistics (2018), http://aclweb.org/anthology/C18-1075
- [4] Ariyo, A.A., Adewumi, A.O., Ayo, C.K.: Stock price prediction using the arima model. In: 2014 UKSim-AMSS 16th International Conference on Computer Modelling and Simulation. pp. 106–112 (March 2014). https://doi.org/10.1109/UKSim.2014.67
- [5] Atzeni, M., Dridi, A., Reforgiato Recupero, D.: Fine-grained sentiment analysis on financial microblogs and news headlines. In: Dragoni, M., Solanki, M., Blomqvist, E. (eds.) Semantic Web Challenges. pp. 124–128. Springer International Publishing, Cham (2017)
- [6] Bao, W., Yue, J., Rao, Y.: A deep learning framework for financial time series using stacked autoencoders and long-short term memory. In: PloS one (2017)
- [7] Betancourt, B., Rodríguez, A., Boyd, N.: Modelling and prediction of financial trading networks: An application to the NYMEX natural gas futures market. ArXiv e-prints (Oct 2017)
- [8] Boudoukh, J., Feldman, R., Kogan, S., Richardson, M.: Which news moves stock prices? a textual analysis. Working Paper 18725, National Bureau of Economic Research (January 2013). https://doi.org/10.3386/w18725, http://www.nber.org/papers/w18725
- [9] Denil, M., Demiraj, A., Kalchbrenner, N., Blunsom, P., de Freitas, N.: Modelling, visualising and summarising documents with a single convolutional neural network. CoRR abs/1406.3830 (2014), http://arxiv.org/abs/1406.3830
- [10] Ding, X., Zhang, Y., Liu, T., Duan, J.: Using structured events to predict stock price movement: An empirical investigation. In: Proceedings of the 2014 Conference on Empirical Methods in Natural Language Processing (EMNLP). pp. 1415–1425. Association for Computational Linguistics (2014). https://doi.org/10.3115/v1/D14-1148, http://aclweb.org/anthology/D14-1148
- [11] Ding, X., Zhang, Y., Liu, T., Duan, J.: Deep learning for event-driven stock prediction. In: Proceedings of the 24th International Conference on Artificial Intelligence. pp. 2327–2333. IJCAI’15, AAAI Press (2015), http://dl.acm.org/citation.cfm?id=2832415.2832572
- [12] Engle, R.F.: Autoregressive conditional heteroscedasticity with estimates of the variance of united kingdom inflation. Econometrica 50(4), 987–1007 (1982), http://www.jstor.org/stable/1912773
- [13] Erosheva, E., Fienberg, S., Lafferty, J.: Mixed-membership models of scientific publications. Proceedings of the National Academy of Sciences 101(suppl. 1), 5220–5227 (2004). https://doi.org/10.1073/pnas.0307760101, http://www.pnas.org/content/101/suppl˙1/5220.abstract
- [14] Fama, E.F.: Efficient capital markets: A review of theory and empirical work. The Journal of Finance 25(2), 383–417 (1970), http://www.jstor.org/stable/2325486
- [15] Feuerriegel, S., Neumann, D.: News or noise? how news drives commodity prices. In: ICIS (2013)
- [16] G. Malkiel, B.: The efficient market hypothesis and its critics. Journal of Economic Perspectives 17, 59–82 (02 2003). https://doi.org/10.1257/089533003321164958
- [17] Granger, C.W.J.C.W.J., Morgenstern, Oskar, .j.a.: Predictability of stock market prices. Lexington, Mass. : Heath Lexington Books (1970), bibliography: p. 285-296
- [18] Hogenboom, F., Frasincar, F., Kaymak, U., Jong, F.D.: An overview of event extraction from text. In: Workshop on Detection, Representation, and Exploitation of Events in the Semantic Web (DeRiVE 2011) at Tenth International Semantic Web Conference (ISWC 2011). Volume 779 of CEUR Workshop Proceedings., CEURWS.org (2011) 48–57
- [19] Huynh, H., Dang, L.M., Duong, D.: A new model for stock price movements prediction using deep neural network (12 2017). https://doi.org/10.1145/3155133.3155202
- [20] Kaastra, I., Boyd, M.: Designing a neural network for forecasting financial and economic time series (1996)
- [21] Lekovic, M.: Evidence for and against the validity of efficient market hypothesis. Economic Themes 56, 369–387 (11 2018)
- [22] Malkiel, B.G.: A Random Walk Down Wall Street. Norton, New York (1973)
- [23] Meng, T.L., Khushi, M.: Reinforcement learning in financial markets. Data 4(3), 110 (Jul 2019). https://doi.org/10.3390/data4030110, https://doi.org/10.3390/data4030110
- [24] Miller, G.A.: Wordnet: A lexical database for english. COMMUNICATIONS OF THE ACM 38, 39–41 (1995)
- [25] Mintz, M., Bills, S., Snow, R., Jurafsky, D.: Distant supervision for relation extraction without labeled data. In: Proceedings of the Joint Conference of the 47th Annual Meeting of the ACL and the 4th International Joint Conference on Natural Language Processing of the AFNLP: Volume 2 - Volume 2. pp. 1003–1011. ACL ’09, Association for Computational Linguistics, Stroudsburg, PA, USA (2009), http://dl.acm.org/citation.cfm?id=1690219.1690287
- [26] Peng, Y., Jiang, H.: Leverage financial news to predict stock price movements using word embeddings and deep neural networks. CoRR abs/1506.07220 (2015), http://arxiv.org/abs/1506.07220
- [27] Poria, S., Cambria, E., Hazarika, D., Vij, P.: A deeper look into sarcastic tweets using deep convolutional neural networks. CoRR abs/1610.08815 (2016), http://arxiv.org/abs/1610.08815
- [28] Ritter, A., Mausam, Etzioni, O., Clark, S.: Open domain event extraction from twitter. In: Proceedings of the 18th ACM SIGKDD International Conference on Knowledge Discovery and Data Mining. pp. 1104–1112. KDD ’12, ACM, New York, NY, USA (2012). https://doi.org/10.1145/2339530.2339704, http://doi.acm.org/10.1145/2339530.2339704
- [29] Roache, S.K., Rossi, M.: The effects of economic news on commodity prices. The Quarterly Review of Economics and Finance 50(3), 377–385 (2010), https://EconPapers.repec.org/RePEc:eee:quaeco:v:50:y:2010:i:3:p:377-385
- [30] Ruder, S., Ghaffari, P., Breslin, J.G.: INSIGHT-1 at semeval-2016 task 5: Deep learning for multilingual aspect-based sentiment analysis. CoRR abs/1609.02748 (2016), http://arxiv.org/abs/1609.02748
- [31] Schuler, K.K.: Verbnet: A Broad-coverage, Comprehensive Verb Lexicon. Ph.D. thesis, Philadelphia, PA, USA (2005), aAI3179808
- [32] Shekarpour, S., Shalin, V.L., Thirunarayan, K., Sheth, A.P.: CEVO: comprehensive event ontology enhancing cognitive annotation. CoRR abs/1701.05625 (2017), http://arxiv.org/abs/1701.05625
- [33] Siami-Namini, S., Namin, A.S.: Forecasting economics and financial time series: ARIMA vs. LSTM. CoRR abs/1803.06386 (2018), http://arxiv.org/abs/1803.06386
- [34] Skabar, A., Cloete, I.: Neural networks, financial trading and the efficient markets hypothesis. Aust. Comput. Sci. Commun. 24(1), 241–249 (Jan 2002), http://dl.acm.org/citation.cfm?id=563857.563829
- [35] Taylor, S.J., Letham, B.: Forecasting at scale. The American Statistician 72(1), 37–45 (2018). https://doi.org/10.1080/00031305.2017.1380080, https://doi.org/10.1080/00031305.2017.1380080
- [36] Tran, D.T., Iosifidis, A., Kanniainen, J., Gabbouj, M.: Temporal attention augmented bilinear network for financial time-series data analysis. CoRR abs/1712.00975 (2017), http://arxiv.org/abs/1712.00975
- [37] Tran, D., Bourdev, L.D., Fergus, R., Torresani, L., Paluri, M.: C3D: generic features for video analysis. CoRR abs/1412.0767 (2014), http://arxiv.org/abs/1412.0767
- [38] Valipour, M., Banihabib, M.E., Behbahani, S.M.R.: Comparison of the arma, arima, and the autoregressive artificial neural network models in forecasting the monthly inflow of dez dam reservoir. Journal of Hydrology 476(Complete), 433–441 (2013). https://doi.org/10.1016/j.jhydrol.2012.11.017
- [39] Wang, P., Xu, J., Xu, B., Liu, C., Zhang, H., Wang, F., Hao, H.: Semantic clustering and convolutional neural network for short text categorization. pp. 352–357 (01 2015). https://doi.org/10.3115/v1/P15-2058
- [40] Wex, F., Widder, N., Liebmann, M., Neumann, D.: Early warning of impending oil crises using the predictive power of online news stories. In: 2013 46th Hawaii International Conference on System Sciences. pp. 1512–1521 (Jan 2013). https://doi.org/10.1109/HICSS.2013.186
- [41] Zhong, Z., Ng, H.T.: It makes sense: A wide-coverage word sense disambiguation system for free text. In: Proceedings of the ACL 2010 System Demonstrations. pp. 78–83. ACLDemos ’10, Association for Computational Linguistics, Stroudsburg, PA, USA (2010), http://dl.acm.org/citation.cfm?id=1858933.1858947