Electronic and magnetic properties of structural defects in SrTiO3(Co)
Abstract
The synthesis conditions of SrTiO3(Co) samples in which cobalt predominantly enters the or sites of the perovskite O3 structure are found. EXAFS studies show that the Co impurity at the site is off-center and is displaced from the site by 1.0 Å. XANES studies reveal two predominant oxidation states of Co: Co2+ at the site and Co3+ at the site. First-principles calculations of a number of possible cobalt-containing structural defects reveal defects whose properties are compatible with the experimentally observed Co oxidation state, its local structure, magnetic, electrical, and optical properties.
DOI: 10.1016/j.jallcom.2019.153243
pacs:
I Introduction
The discovery of the room-temperature ferromagnetism in cobalt-doped anatase TiO2 Matsumoto et al. (2001) after a long period of investigations of dilute magnetic semiconductors Furdyna (1988); Ohno (1998) has initiated a large number of experimental and theoretical studies of wide-gap oxides doped with magnetic impurities. Later, the room-temperature ferromagnetism was observed in cobalt-doped ZnO Song et al. (2006); Ueda et al. (2001), SnO2 Kim et al. (2008); Ogale et al. (2003), In2O3 Philip et al. (2006); Yoo et al. (2005), TiO2 Griffin et al. (2005); Chambers et al. (2002), and finally SrTiO3 Zhang et al. (2006); Kim et al. (2011). The first experiments were carried out on dilute systems in which the presence of free carriers was often necessary for the appearance of ferromagnetism. In Refs. Bi et al. (2010); Posadas et al. (2013), the room-temperature ferromagnetism was observed in dielectric SrTiO3 samples with high Co concentration (14–40%). These materials are promising for their applications in spintronics, magnetooptics, and photocatalysis.
The functional properties of magnetic materials can be substantially improved if another type of ordering, for example, the ferroelectric one, can be realized in these materials. One of the approaches to creating materials with such a “double ordering” may be doping them with magnetic off-center impurities. The search for new magnetic off-center impurities, which simultaneously possess dipole and magnetic moments, is an actual problem because the interaction of these moments can result in the onset of interesting magnetoelectric properties Shvartsman et al. (2008). Materials exhibiting these properties belong to multiferroics—multifunctional materials which open up new opportunities for modern electronics.
In order to get a high Curie temperature in a dilute ferromagnet, magnetic atoms should have high magnetic moments. However, the magnetic moments of magnetic impurities can significantly depend on the structural position and the local environment of the impurities. Moreover, the impurities of transition elements can exist in several oxidation states, which depend on their structural position, local environment, and on the presence of other donors and acceptors in the sample.
In practice, the structural position, oxidation and magnetic states can be changed by varying the synthesis conditions. Our previous studies have shown that in the case of the Mn impurity in SrTiO3, the distribution of the impurity between and sites of the perovskite O3 structure and the impurity oxidation state can be controlled by varying the annealing temperature and the stoichiometry of the samples Lebedev et al. (2009); Sluchinskaya et al. (2010). For the Ni impurity in SrTiO3, the magnetic moment was shown to depend on the structure of a complex formed by the impurity. A nonzero magnetic moment appears only in the case of the Ni2+– complex with a distant oxygen vacancy () Sluchinskaya et al. (2013, 2014).
Cobalt-doped strontium titanate has been studied for a long time. The similarity of crystal structures of SrTiO3 (perovskite) and SrCoO3-x (oxygen-deficient perovskite) suggests the existence of a continuous series of solid solutions between them. According to Ref. Murashkina et al. (2012), the solubility of cobalt at the site of SrTiO3 is at least 40%, and Ref. Malo and Maignan (2004) reported the preparation of single-phase ceramic samples containing up to 90% Co by the solid-phase synthesis method. At , X-ray studies Malo and Maignan (2004) found additional diffraction peaks, which were attributed to the ordering of the oxygen vacancies. In all published papers, it was assumed that the Co atom replaces the Ti one. In the literature there is no data on the incorporation of cobalt into the site.
To determine the oxidation state of cobalt in SrTiO3, optical absorption, EPR, X-ray photoelectron spectroscopy (XPS) as well as the study of the near-edge structure in X-ray absorption spectra (XANES) were used. The optical absorption spectra of doped single crystals revealed absorption lines characteristic of the Co3+ ion in the octahedral environment Blazey and Muller (1983); Doichilovich et al. (2004). A signal from Co4+ ions in the low-spin state () was observed in EPR studies Blazey and Muller (1983) of single crystals doped with 0.2% Co. The magnitude of this signal significantly increased after the sample illumination (we guess, in the initial state the Co impurity is diamagnetic and its oxidation state is +3). In Ref. Posadas et al. (2013), thin films with Co concentration from 10 to 50% were grown by molecular beam epitaxy (MBE) at 550∘C. They were studied by XPS, and a conclusion about the +2 oxidation state of cobalt was made. The same conclusion was drawn from XPS studies of SrTiO3(Co) nanofibers with Co concentration of up to 20% prepared by electrospinning Zhang et al. (2012) and from XPS studies of thin films containing 30% Co obtained by pulsed laser deposition (PLD) Bi et al. (2010). The authors of the latter paper supposed that the difference between oxidation states of Ti and Co is compensated by the oxygen vacancies and the Co oxidation state in films is lower than in bulk samples because the films were grown at low partial pressure of oxygen.
It should be noted, however, that the spread of the XPS peaks in different Co compounds exceeds the magnitude of their systematic chemical shift when changing the oxidation state NIS . This is why in Refs. Bi et al. (2010); Posadas et al. (2013) the conclusion about the Co oxidation state of +2 in SrTiO3 was made from the appearance of a strong high-energy satellite peak. However, a similar satellite peak with somewhat lower intensity appears in samples with trivalent cobalt Chainani et al. (1992). Therefore, the reliability of this method of determining the oxidation state raises questions. On the other hand, an indirect argument in favor of the appearance of Co2+ in films obtained by PLD was an increase of the out-of-plane lattice parameter in doped films Bi et al. (2010), which was in contrast with its decrease in bulk samples Malo and Maignan (2004); Pascanut et al. (2006). As for the XANES spectra recorded on SrTiO3(Co) films Bi et al. (2010), no conclusion about the Co oxidation state was drawn.
The most interesting effect revealed in SrTiO3(Co) is the appearance of ferromagnetism at room temperature. Studies of magnetic properties have shown that the ferromagnetism is absent in weakly doped dielectric samples Malo and Maignan (2004). The reason for this can be either the absence of magnetic moments or their weak interaction. An increase in the Co concentration to 14–40% in insulating PLD and MBE films resulted in the appearance of ferromagnetism Bi et al. (2010); Posadas et al. (2013). In dilute systems, the distance between the impurities is too large to form a percolation cluster of strongly interacting magnetic ions. For the appearance of ferromagnetism in these samples, one can co-dope the samples with donors, thus creating in them free carriers and conditions for a long-range RKKY interaction. The study of the influence of La and Nb impurities on the appearance of ferromagnetism showed the following. In La-doped conductive SrTiO3 PLD films with Co concentration of 1.5–2%, the room-temperature ferromagnetism was observed in as-grown films Zhao et al. (2003); Herranz et al. (2006) or in films annealed in a reducing atmosphere Fix et al. (2009). In contrast, in Nb-doped samples, which became conductive upon doping, no ferromagnetism was observed down to 5 K in films with 2% Co grown by PLD at a low oxygen partial pressure Zhang et al. (2006).
The structure and magnetic properties of SrTi1-xCoxO3 epitaxial films grown by PLD were studied in Ref. Bi et al. (2010). In films with and 0.23, the ferromagnetism was observed at room temperature. Since these samples were insulating and no exchange via conduction electrons occurred, the authors supposed that these are the oxygen vacancies which are responsible for the onset of the ferromagnetism. In the following paper Kim et al. (2011), however, the authors proposed a magnetoelastic spin ordering model to explain the temperature dependence of magnetization in the film with up to 1000 K. The important role of the oxygen vacancies was demonstrated in Ref. Fix et al. (2009), in which the ferromagnetism in epitaxial films appeared only after annealing them in a reducing atmosphere and disappeared after annealing in an oxidizing atmosphere. It should be noted, however, that samples annealed in a reducing atmosphere demonstrate an EPR signal from paramagnetic Ti3+ ions Blazey et al. (1981), whose presence can influence the magnetic properties of reduced samples. In addition, the contamination of the samples with magnetic impurities can also affect their properties: a very weak ferromagnetic signal, whose value was not systematically changed upon reduction, was observed in SrTiO3 samples free of cobalt at room temperature Decorse-Pascanut et al. (2009).
A weak ferromagnetism at 300 K was also observed in nanofibers prepared at C Zhang et al. (2012). The magnitude of the effect strongly depended on the concentration of Co. Moreover, a significant enhancement of ferromagnetism was observed after annealing the nanofibers in the hydrogen atmosphere. We note that in this paper the weak ferromagnetism was observed even in SrTiO3 samples free of cobalt.
In Ref. Lee et al. (2003), hysteresis loops were observed at room temperature in samples implanted with Co ions. X-ray studies of these samples did not reveal precipitates of the second phase. In contrast, in Ref. Galinetto et al. (2008), an inhomogeneous depth distribution of the impurity was observed in Co-implanted samples. It was explained by the formation of precipitates that can be responsible for the appearance of ferromagnetism at 300 K.
Single-phase samples of SrTi1-xCoxO3 () obtained by the solid-phase synthesis method at 1250–1400∘C were studied in Ref. Pascanut et al. (2006). In contrast to the samples described above, in these samples with 0.35–0.50 a transition from the paramagnetic to the antiferromagnetic state was detected at 15–26 K, and no ferromagnetism was observed at room temperature. X-ray measurements of the samples reduced in the 10% H2–Ar atmosphere revealed the appearance of metallic Co. The absence of the ferromagnetism at and the predominantly antiferromagnetic ordering of the Co magnetic moments, which resulted from the superexchange interaction mediated by the oxygen atoms, was also observed in ceramic samples prepared at 1100∘C in Ref. Malo and Maignan (2004).
In addition to the experimental studies of the room-temperature ferromagnetism, the theoretical studies that discuss possible mechanisms of this phenomenon were performed using the HSE06 hybrid functional Florez et al. (2012) and LDA+ approach Posadas et al. (2013); Mitra et al. (2014). In Ref. Florez et al. (2012), intermediate spin state () was found for an isolated Co ion. The ground state for a complex of two next-nearest-neighbor Co ions and one oxygen vacancy is trivalent Co ions, one of which (adjacent to the vacancy) is in the high-spin state () and the other is in the low-spin state ().
An important role of the oxygen vacancies forming the Co–nearest vacancy complexes whose magnetic moment is Posadas et al. (2013) or even 3 Mitra et al. (2014) (for the same structure) was demonstrated in LDA+ studies. The choice of divalent cobalt was based on the conclusion about the Co oxidation state made from the XPS data. Clustering of Co atoms was found to be energetically unfavorable, in contrast to the Co– association. An isolated Co– complex has a magnetic moment of 1, whereas in the infinite chains of Co– complexes it is 3. Samples containing both complexes are insulating. According to Ref. Posadas et al. (2013), the magnetic interaction between two nearest-neighbor Co ions () is ferromagnetic ( meV/cell) and becomes very weak for second and third neighbors. This disagrees with the results of Ref. Florez et al. (2012) in which the nearest Co atoms are ordered antiferromagnetically and the largest ferromagnetic interaction was obtained for the next-nearest-neighboring Co ions. The ferromagnetic interaction of two Co– complexes forming a linear chain is significantly weaker (8–15 meV/cell) Mitra et al. (2014).
It should be noted that the properties of the SrTiO3(Co) samples essentially depend on the method of their preparation. The samples synthesized at high temperatures (close to thermodynamic equilibrium) are characterized by the presence of trivalent cobalt and the absence of room-temperature ferromagnetism. In contrast, in the samples prepared under conditions which can be considered as non-equilibrium (hydrothermal synthesis, PLD, nanofibers), the cobalt ions become divalent and the room-temperature ferromagnetism appears. This makes the problem of determining the real structure of the Co impurity complexes very actual.
In this work, the structural position and the oxidation state of the Co impurity in SrTiO3 prepared by the solid-phase synthesis method under various conditions are studied by XAFS (X-ray absorption fine structure) spectroscopy. It is shown that, depending on the preparation conditions, cobalt can enter either the sites of the perovskite structure in the trivalent state or the sites in the divalent state, forming an off-center impurity in the high-spin state (). An analysis of the results of first-principles calculations of the structure of different Co-containing defects reveals the defects whose properties are compatible with the experimentally observed Co oxidation state, its local structure, magnetic, electrical, and optical properties.
II Experimental and calculation details
Cobalt-doped SrTiO3 samples with impurity concentration of 2–3% and different deviations from stoichiometry were prepared by the solid-phase synthesis method. The starting components were SrCO3, nanocrystalline TiO2 obtained by hydrolysis of tetrapropyl orthotitanate and dried at 500∘C, and Co(NO3)6H2O. The components were weighed in the required proportions, ground in acetone, and annealed in air in alumina crucibles at 1100∘C for 4 hours. The obtained powders were ground again and re-annealed under the same conditions for 4 hours. Some samples were additionally annealed in air at 1500∘C or 1600∘C for 2 hours. To incorporate cobalt into the or sites of the perovskite structure, the composition of the samples was deliberately deviated from the stoichiometry towards the excess of titanium or strontium. All obtained samples had a dark brown color.
X-ray absorption spectra in the extended fine structure (EXAFS) and near-edge structure (XANES) regions were recorded in fluorescence mode at the -edge of Co (7.709 keV) at 300 K at the KMC-2 station of the BESSY synchrotron radiation source. The radiation was monochromatized by a (111)-oriented two-crystal Si1-xGex monochromator. The intensity of the incident radiation was measured using an ionization chamber. The intensity of the fluorescent radiation was measured by a RÖNTEC silicon drift detector operating in an energy-dispersive mode. The powders were placed on the surface of adhesive tape which was then folded to provide an optimal thickness of the sample.
The EXAFS spectra were processed using the widely used IFEFFIT software package IFE . The EXAFS function (where is the photoelectron wave vector and is the absorption edge energy) was extracted from the experimental spectra using the ATHENA program and fitted using the ARTEMIS program to the theoretical curve calculated for a given structural model:
| (1) | ||||
where the sum runs over a few nearest shells of the Co central atom and , , and are the radius, coordination number, and Debye–Waller factor for the th shell, respectively. The parameter describes the reduction of the oscillation amplitude resulting from multi-electron and inelastic scattering effects. The backscattering amplitude and phase shift for all single- and multiple-scattering paths, the phase shift of the central atom , and the mean free path of a photoelectron were calculated using the FEFF6 program.
For each sample, 3–4 spectra were recorded, they were then independently processed, and the obtained () curves were averaged. The data processing details are given in Ref. Lebedev et al. (1997).
First-principles calculations of geometry, magnetic and electronic structure of impurity centers were performed using the ABINIT software package in the LDA+ approximation. PAW pseudopotentials Garrity et al. (2014) were used to describe atoms with a partially filled shell. The parameters describing the Coulomb and exchange interaction for Co were eV and eV. Our recent study of Ni-doped SrTiO3 Lebedev and Sluchinskaya (2016) has shown that we need supercells having more than 40 atoms to get relatively narrow impurity bands. That is why to model the properties of isolated Co centers, we used 80-atom face-centered cubic supercells in which one of the Ti4+ ions at the site or Sr2+ ions at the site was replaced by the Co ion. To model the properties of a number of complexes containing two Co atoms, the supercells containing 223 unit cells (60 atoms) were used. We did not apply the LDA+ approach to Ti states because to reproduce the experimental band gap of SrTiO3, an unphysically high value of 18.5 eV was needed.
III Experimental results
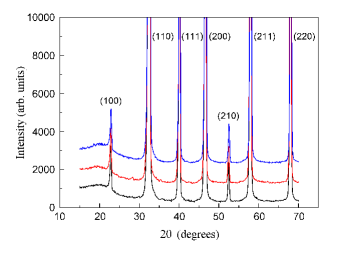
X-ray diffraction studies of SrTiO3(Co) samples showed that all samples are single-phase and have the cubic perovskite structure at 300 K (Fig. 1). The lattice parameters of the samples were Å for the Co3B1500 sample,111The names of the samples include the impurity name, its concentration in percents, the site into which the impurity is incorporated, and the annealing temperature. Å for the Co2A1500 sample, and Å for the Co2A1600 sample. A decrease in the lattice parameter in doped samples as compared to that of undoped SrTiO3 ( Å) agrees with earlier published data Malo and Maignan (2004); Pascanut et al. (2006) and indicates the formation of a solid solution.
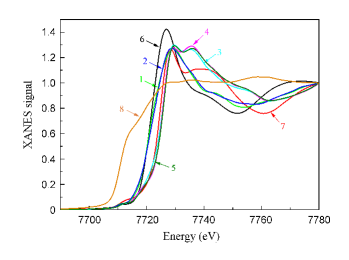
To determine the oxidation state of the Co impurity in the samples, the position of the absorption edge in the XANES spectra of doped samples was compared with those in the Co(NO3)6H2O (divalent cobalt) and LaCoO3 (trivalent cobalt) reference compounds (Fig. 2).
A comparison of the XANES spectra of all samples annealed at 1100∘C and also of the sample which had a deviation from stoichiometry toward an excess of strontium and was annealed at 1500∘C shows that their absorption edges are close to each other and practically coincide with the absorption edge in the LaCoO3 reference compound. This means that cobalt in these samples is predominantly in the +3 oxidation state.
The absorption edges of the Sr-deficient SrTiO3(Co) samples annealed at 1500∘C and 1600∘C are close to each other and coincide with the absorption edge in the Co(NO3)6H2O reference compound. This indicates that in these samples cobalt is predominantly in the +2 oxidation state.
It should be noted that the chemical shift in the XANES spectra is much larger than that in the XPS spectra NIS . This allows to draw more reliable conclusions about the Co oxidation state from XANES spectra.
In order to determine the structural position of the Co impurity, the EXAFS spectra were analyzed. When analyzing data and choosing structural models, the lattice parameter obtained from X-ray measurements was taken into account. In the perovskite structure, the impurity atoms can replace atoms both at the and sites Lebedev et al. (2009). That is why we considered models with substitution at both sites.
Comparison of the EXAFS spectra of two groups of samples in which Co atoms have different oxidation states revealed their qualitative difference.
For all samples in which cobalt is trivalent, a reasonable agreement between the experimental spectra and theoretically calculated curves was obtained in the model in which the Co3+ ion replaces the Ti4+ one with the formation of a distant oxygen vacancy. In this model, the Co–O distance in the first shell is 1.909(12) Å, the Co–Sr distance is 3.342(16) Å, and the Co–Ti distance is 3.892(12) Å.
An analysis of the EXAFS spectra of the Co2A1500 and Co2A1600 samples using the model in which cobalt enters the site showed that the experimental and calculated spectra are very different. According to the XANES data, Co atoms in these samples are mainly in the +2 oxidation state and so they can replace the site in SrTiO3. However, there is a big difference in the ionic radii of Co2+ and Sr2+ ions. An analysis of the EXAFS spectra using models in which the Co2+ ion replaces the Sr2+ ion showed that a reasonable agreement between the experimental and calculated curves is obtained in the model in which the Co2+ ion is displaced from the site along the [100] axis by approximately 1.0 Å (the nearest Co–O distance is 1.993(42) Å).
Unfortunately, the agreement between the experimental and calculated EXAFS curves for all samples was not very good. The agreement criteria were low values of factor, good correspondence of obtained coordination numbers to those of the model, and agreement between Fourier transforms in space. In order to understand the reasons for the observed discrepancies, it is necessary to consider microscopic models of Co impurity centers with atoms at the and sites.
IV Results of the first-principles calculations
When formulating theoretical models of the impurity centers, the data on the Co oxidation state and the interatomic distances obtained from the EXAFS data were taken into account. We note that the earlier first-principles calculations Posadas et al. (2013); Mitra et al. (2014); Florez et al. (2012) were performed primarily for the Co2+ ion at the site, whereas our results indicate other oxidation states and other lattice sites.
| Model | Spin | Shells | |||||
|---|---|---|---|---|---|---|---|
| 1 | 2 | 3 | 4 | 5 | 6 | ||
| 1. Off-center Co ion, | 3/2 | 2.014 (4O) | 2.948 (4Ti) | 3.056 (1Sr) | 3.168 (4O) | 3.630 (4O) | 3.814 (4O) |
| displacement [100] (Fig. 3(a)) | |||||||
| 2. Off-center Co ion, | 3/2 | 2.051 (1O) | 2.069 (4O) | 2.706 (2Ti) | 3.265 (2O) | 3.318 (2Sr) | 3.474 (4Ti) |
| displacement [110] | |||||||
| 3. Off-center Co ion, | 3/2 | 1.996 (3O) | 2.707 (1Ti) | 2.946 (6O) | 3.216 (3Ti) | 3.523 (3Sr) | 3.564 (3O) |
| displacement [111] | |||||||
| 4. Isolated Co ion | 0 | 1.905 (6O) | 3.352 (8Sr) | 3.801 (6Ti) | 4.355 (24O) | 5.509 (12Ti) | |
| (compensated by F) (Fig. 3(b)) | |||||||
| 5. Isolated Co ion | 0 | 1.920 (6O) | 3.345 (8Sr) | 3.847 (6Ti) | 4.366 (24O) | 5.527 (12Ti) | |
| (electric compensation) | |||||||
| 6. Co– complex | 1 | 1.909 (5O) | 3.398 (7Sr,1Rb) | 3.897 (6Ti) | 4.351 (24O) | 5.511 (12Ti) | |
| (compensated by Rb) (Fig. 3(c)) | |||||||
| 7. Co––Co complex | 1 | 1.895 (5O) | 3.365 (8Sr) | 3.897 (5Ti,1Co) | 4.320 (24O) | 5.489 (12Ti) | |
| (Fig. 3(d)) | |||||||
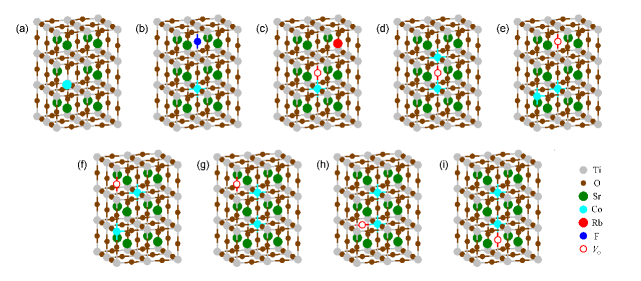
First, we calculated the geometry of the impurity center for the Co2+ ion at the site in SrTiO3. This is a simplest impurity center since the substitution of Sr2+ with Co2+ does not require any charge compensation. Calculations that took into account the full relaxation of atoms showed that the on-center position of the Co2+ ion at the site is energetically unstable and the impurity displaces into an off-center position (Fig. 3(a)). The equilibrium displacements of cobalt from the site were 0.98, 0.94, and 0.75 Å for [100], [110], and [111] directions, respectively. The comparison of the energies of the corresponding structures showed that the structure with the [110] displacement has the lowest energy, whereas the energies of structures with the [100] and [111] displacements were by 142 and 892 meV higher. The magnetic moment for all three configurations was . The calculated distances to atoms in the local environment of cobalt for these configurations are given in Table 1. It is seen that the Co–O distance is notably larger than the Co–O distance and that the Co–O distances for [100] and [111] displacements are closest to the experimental value of 1.993(42) Å.
We start our calculations of impurity centers with Co at the site with an isolated Co ion. The calculations predict a 1 magnetic moment for this center in agreement with earlier LDA+ studies Posadas et al. (2013); Mitra et al. (2014), but in disagreement with the result of HSE06 calculations Florez et al. (2012) in which the Co ion had a 3 magnetic moment. The Co–O distance in our case is 1.897 Å.
For an isolated Co–nearest complex, our calculations predict the magnetic moment of 1, in agreement with Ref. Posadas et al. (2013) and in disagreement with Ref. Mitra et al. (2014).
The impurity centers with trivalent cobalt at the site suggest the existence of defects that compensate for the difference in ionic charges. Calculations for a model, in which an additional electron was supplied to an isolated Co ion by a distant donor F atom at the oxygen site (Fig. 3(b), Table 1), showed that the lowest-energy structure is the low-spin state (, whereas the high-spin state () is characterized by a much higher energy. It is interesting that another approach in which one extra electron was added to the system containing an isolated Co ion yielded a rather close result (see Table 1).
The finding that the isolated Co ion has no magnetic moment contradicts the experimental data. An effective magnetic moment of Co atoms of 1.96–2.85 was obtained from the temperature dependence of magnetic susceptibility in bulk samples with Co concentration close to that in our samples Malo and Maignan (2004); Pascanut et al. (2006); Decorse-Pascanut et al. (2009). Therefore, we should consider Co impurity complexes with oxygen vacancies.
We considered an isolated Co–nearest complex in which the required Co oxidation state is provided by a distant acceptor impurity (Rb at the Sr site, Fig. 3(c)). It turned out that this defect is paramagnetic and has a magnetic moment of 2 (). The intermediate-spin state of this complex qualitatively agrees with the result obtained in Ref. Florez et al. (2012). The effective magnetic moment for a center with in the case of totally quenched orbital momentum is and is close to the moment observed in the experiment.
| Configuration | Figure | Spins of | Energy |
|---|---|---|---|
| Co(1) and Co(2) ions | (meV/Co) | ||
| No nearest Co atoms, distant | Fig. 3(e) | 0; 0 | 0 |
| The same (another configuration) | Fig. 3(f) | 0; 0 | 39 |
| Nearest Co atoms, distant | Fig. 3(g) | 0; 0 | 237 |
| Nearest Co atoms, nearest (angular) | Fig. 3(h) | 0; 1 | 236 |
| Nearest Co atoms, nearest (linear) | Fig. 3(i) | 0; 1 | 313 |
| Nearest Co atoms, at the midpoint (FM) | Fig. 3(d) | 1; 1 | 568 |
| Nearest Co atoms, at the midpoint (AFM) | Fig. 3(d) | 1; 1 | 585 |
The calculations of energies of different complexes containing two Co ions and one oxygen vacancy (Fig. 3(d–i), Table 2) brought us to the following conclusions. (1) To have a non-zero magnetic moment, the Co ion should have a nearest vacancy (isolated Co ions and oxygen vacancies have zero magnetic moment); (2) the total energy of a system with two nearest Co atoms is higher than that for a system with two distant Co atoms (there is no tendency to clustering, in agreement with Ref. Posadas et al. (2013)); (3) the total energy of the Co–Co–nearest complex depends on its configuration: the energy of the angular configuration is by 76 meV lower than the energy of the linear one. We note that the energy of the angular configuration with the nearest oxygen vacancy is by 1 meV lower than the energy of a pair of neighboring Co ions with a distant vacancy. This result disagrees with the results reported in Ref. Posadas et al. (2013); Mitra et al. (2014) for the Co– complexes; (4) the ferromagnetic coupling energy of two Co ions with in the complex, in which the vacancy is located at the midpoint between two nearest Co atoms, is meV.
All distances obtained in the models in which the Co3+ ion enters the site (Table 1) are in a reasonable agreement with the distance (1.909 Å) obtained in the experiment. Taking into account that the experiment indicates the existence of magnetic moments on Co3+ ions, we should modify the model that was used in the EXAFS data analysis in Sec. III and consider a model in which cobalt forms a complex with the nearest oxygen vacancy.
V Refinement of structural models and discussion
Insufficiently good agreement between the experimental and calculated EXAFS spectra stimulated us to consider more complex models. First, we considered the model in which the Co ion forms a complex with the nearest oxygen vacancy. In this model, the distances obtained for the Co3B1100 sample were not much different from those for the model of Co ion with a distant vacancy considered in Sec. III, but the factor in this model became much closer to that in the reference compounds.
Using the results of first-principles calculations of the local environment for the off-center Co ion (Sec. IV), we reanalyzed the EXAFS spectrum of the Co2A1600 sample. It appeared that the configurations with atomic displacements along the [100] and [111] axes give the lowest values of factor. The calculated Fourier transform of the EXAFS spectrum for the model with [110] displacement exhibited a strong peak resulting from the Ti atoms in the third shell, which is absent in the experimental EXAFS spectrum. This means that this model can be excluded from further analysis. Taking into account the significant energy difference between the configurations with [100] and [111] displacements, we believe that Co atoms displace along the [100] axis, and will use this model in the future analysis.
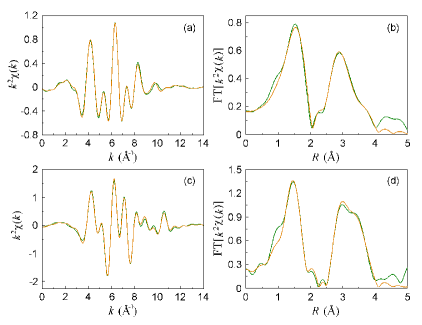
The determination of the structural parameters for a two-component model in which the EXAFS spectrum for each sample is composed of two above-considered contributions, which act simultaneously, was performed using an iterative technique described in detail in the Appendix. The experimental EXAFS spectra and their best fits for the Co2A1600 and Co3B1100 samples are shown in Fig. 4. The obtained parameters for these samples are given in Table S1 of the Appendix. For the Co ion, the Co–O distance in the first shell (1.906(11) Å) and the distances to the second and third shells are in good agreement with the results of first-principles calculations (Table 1). For the Co ion displaced from the site in the [100] direction, the Co–O distance in the first shell (2.040(6) Å) and the distances to other shells are also in qualitative agreement with the calculated data. The data analysis showed that in the Co2A1600 sample 76% of the incorporated cobalt is at the site, whereas in the Co3B1100 sample only 18% of impurity atoms enter the site.
The same iterative procedure was applied to the Co2A1500 sample. The structural parameters for this sample were close to those obtained for the Co2A1600 sample, but the fraction of Co atoms that enter the site was 75%.
We note that the behavior of cobalt in SrTiO3 is very different from that of its neighbor in the Periodic Table — nickel Sluchinskaya et al. (2014); Sluchinskaya and Lebedev (2017). First, only for cobalt its appreciable amount can be incorporated into the site. Second, the magnetic properties of the impurities at the site are exactly the opposite: for Ni, a non-zero magnetic moment appears only in the presence of a distant oxygen vacancy, whereas for Co it appears only in the case of the nearest vacancy.
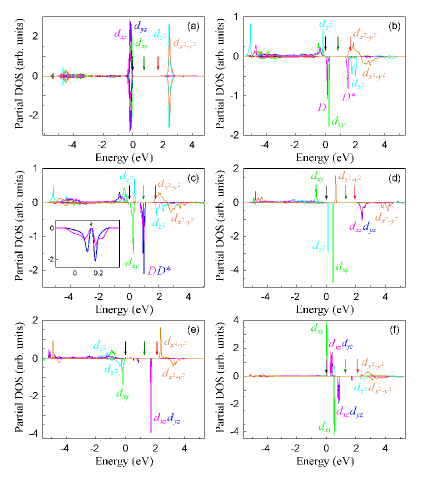
The electronic structure of all considered Co impurity centers in SrTiO3 is shown in Fig. 5. The isolated diamagnetic Co ion (Fig. 3(b)) exhibits a classical – splitting induced by the octahedral crystal field (Fig. 5(a)); its symmetry is slightly lowered because of the presence of a distant F atom. The electronic levels formed by orbitals are merged with the valence band (this decreases the band gap by 0.16 eV) and the orbitals form resonant energy levels deep in the conduction band (the conduction band is formed from orbitals of Ti). The Fermi level lies in the forbidden gap.
The electronic structure of the paramagnetic Co–nearest complex (Fig. 3(c)) exhibits an interesting feature. In addition to the energy level in the forbidden gap, which lies close to the valence band and is formed from the orbital of Co, there appears a pair of energy levels and formed from and orbitals (Fig. 5(b)). One of these levels is occupied and the other one is unoccupied by electron. Both levels are located in the forbidden gap, and the Fermi level is located between them. Our explanation is that the neighboring vacancy distorts the crystal field so strong that these orbitals transform to two very distinct wave functions, which have a tetragonal symmetry and so, when calculating the projections onto the and spherical harmonics, give the same coefficients (magenta and blue lines on the figure coincide). There is one more broad impurity band formed from orbital, which is partially superimposed on the conduction band and forms a tail in the forbidden gap. The spin-minority band is superimposed on the conduction band.
The electronic structure of the paramagnetic Co––Co complex (Fig. 3(d)) reminds that of the above Co– complex. In the forbidden gap it also has a pair of energy levels formed from and orbitals (Fig. 5(c)), one of which () is occupied and the other one () is unoccupied by electron, but in this case the energy gap between them is small (60 meV, see insert in Fig. 5(c)).
The paramagnetic Co ion (Fig. 3(a)) creates three energy levels in the lower half of the forbidden band of SrTiO3 (Fig. 5(d)). The lowest of them, formed from the spin-down orbital, merges with the valence band, whereas two other levels, formed from spin-down and spin-up orbitals, are filled with electrons. Three resonant levels are located deep in the conduction band. The Fermi level lies in the forbidden gap.
An interesting effect is observed when studying the configuration containing the Co ion and the Co– complex simultaneously. It turned out that the equilibrium charge states of these centers are changed because of the transfer of one electron from the Co ion to the Co– complex. This transfer is accompanied by a large reconstruction of the electronic structure of both centers. After the electron from the spin-up orbital of the Co ion is removed, two occupied orbitals shift downward (compare Figs. 5(d) and 5(e)) thus decreasing the band-structure energy by 1 eV. On the contrary, the Co– complex, when accepting one electron, captures this electron on the unoccupied orbital. This triggers a large reconstruction of orbitals including the removing of the – splitting, downward shift of this pair of orbitals, and upward shift of all other occupied orbitals (compare Figs. 5(b) and 5(f)). The magnetic moments of the Co ion and the Co– complex become and , respectively.
One can expect that under the interband optical excitation, the Co ion and the Co– complex can be transformed back to the Co and Co– centers as a result of capturing of the light-excited electrons and holes on the oppositely charged centers. As the magnetic moments of these centers increase to and , we can anticipate an interesting effect: optically-induced changes of magnetic properties of Co-doped SrTiO3. As far as we know, this effect was not studied so far. The possibility of this effect is confirmed by photochromism (optically-induced reversible changes in optical absorption spectra) observed earlier in Co-doped SrTiO3 Faughnan (1971).
Based on our previous studies of Ni-doped SrTiO3 and BaTiO3 Sluchinskaya et al. (2014); Sluchinskaya and Lebedev (2017), we deliberately used low concentration of Co in our calculations to avoid the appearance of broad impurity bands. First-principles calculations of Ref. Phuong et al. (2013) showed that Co forms an impurity band in the lower half of the forbidden band, and at its width becomes so large that the band structure characteristic of metals is formed. Experimental data confirm this prediction: SrTiO3(Co) samples with completely absorb light in the visible and infrared regions Phuong et al. (2013).
In Ref. Hui and Petric (2002), the acceptor character of the cobalt impurity with an activation energy of eV was established from the studies of conductivity of Y-codoped SrTiO3(Co) samples under variable partial oxygen pressure. According to our calculations, the Fermi level in all studied Co impurity centers lies close to the center of the forbidden band gap (Fig. 5). The above calculations for the model where two centers are simultaneously present in the sample showed that the Co can donate one electron, whereas the Co– complex can accept it. Therefore, the properties of the Co– complex which is present in all samples according to our EXAFS data are consistent with the observed electrical properties.
In considering optical transitions involving local energy levels in the forbidden gap, we should concentrate on the – transitions between the valence band (which is formed primarily from the O states) and unoccupied states. The intracenter – transitions and transitions between occupied levels in the forbidden gap and the conduction band (which is formed primarily from the Ti states) are always weaker because the initial and final states have the same parity. Our electronic structure calculations (Fig. 5) show that for the Co– complexes the – transitions to the states can result in strong absorption, whereas for the Co and isolated Co ions such transitions are not possible. On the contrary, both the Co ion and the Co– complex exhibit unoccupied and levels, which can produce strong optical absorption. The appearance of these levels in the forbidden gap can explain the dark brown color of Co-doped SrTiO3 samples and suggest a possible application of this material in solar-light-driven photocatalytic converters. The SrTiO3(Co) samples has already demonstrated high catalytic activity in the oxidation of propane, methane, and carbon monoxide Hui and Petric (2002).
In summary, the Co– and Co– complexes are probably the main defects whose properties are consistent with magnetic, optical, electrical, and structural data obtained from the experiment. Other defects considered in this work can also affect these properties.
We would like to draw attention to the fact that the preparation conditions of the SrTiO3(Co) samples in which the room-temperature ferromagnetism was observed are far from equilibrium. We can suppose that a significant amount of the off-center Co ions which have a large magnetic moment (3) can appear in these samples in non-equilibrium conditions. An increase in the lattice parameter experimentally observed in these samples Bi et al. (2010) support this idea: the Co center is the only structural defect we have modeled which increased the unit cell volume upon doping. We think the question about the local structure and oxidation state of structural defects in these samples needs further experimental investigation.
VI Conclusions
XAFS technique combined with first-principles calculations has been demonstrated to be a very fruitful approach for studying the structure of impurity-induced defects in crystals. In this work, the local structure and the oxidation state of the Co impurity in ceramic SrTiO3 have been studied by XAFS spectroscopy. The change in the synthesis conditions was shown to significantly influence the cobalt concentrations at the and sites of the perovskite structure. At an annealing temperature of 1600∘C, up to 76% of Co atoms enter the site. The Co ions at the site are divalent, whereas the ions entering the site are trivalent. It was revealed that the Co ions are off-center and are displaced from the site by 1.0 Å.
First-principles calculations of the properties of different structural defects in Co-doped SrTiO3 were used to determine the defects whose oxidation state, local environment, magnetic, electrical, and optical properties agree with experiment. In particular, it was shown that the off-center Co ions have a magnetic moment of . As concerns to Co at the site, only the impurity–nearest vacancy complexes have a non-zero magnetic moment. Electronic structure calculations of different Co-containing defects show that the Co– complexes as well as Co ion and the Co– complex can produce strong optical absorption which can explain the brown color of Co-doped samples.
A new effect, the optically-induced change of magnetic properties, was predicted for samples containing Co and Co– defects simultaneously.
And the last, the reorientation of dipole moments associated with off-center Co ions by an external electric field can strongly affect the interaction of their magnetic moments with other magnetic Co complexes, thus inducing magnetoelectric effect in the samples.
Acknowledgements.
This work was supported by the Russian Foundation for Basic Research (Grant No. 17-02-01068). The authors are grateful to the BESSY staff for hospitality and financial support during their stay at the laboratory.*
Appendix A
The determination of the structural parameters for a two-component model in which the EXAFS spectrum for each sample is composed of two independent contributions, which will be called the and states according to the lattice sites of strontium titanate into which the cobalt atoms enter, was performed by an iterative technique. As the starting point, it was assumed that the spectrum for the state is the spectrum of the Co3B1100 sample. For this spectrum, a set of structural parameters (distances and Debye-Waller factors for three shells) was obtained by fitting. After that, the spectrum of the Co2A1600 sample (and then of the Co2A1500 one) was represented as a sum of the and states with unknown proportion. Having fixed the parameters for the state determined on the previous step and taking the interatomic distances calculated for the off-center Co ion in Sec. IV of the main paper as the second starting point, the structural parameters for the state and the relative contributions of and states to the spectrum were calculated. As the next step, the spectrum for the Co3B1100 sample was re-processed, assuming that it may contain an unknown fraction of the state. This fitting was performed with fixed parameters determined on the previous step for the state. This gave us the refined parameters for the state and the relative amounts of the and states in the spectrum. The multiple repetition of the described procedure made it possible to obtain the refined structural parameters for the and states and their relative contributions to the analyzed spectra.
The set of parameters obtained for Co2A1600 and Co3B1100 samples are given in Table S1.
Table S2 gives the positions of two Co atoms and the oxygen vacancy used in modeling of the electronic structure and the corresponding figures in the main paper.
| Sample | Site | factor | Shell | (Å) | (Å2) | |
|---|---|---|---|---|---|---|
| Sr0.98Co0.02O3 | 0.00297 | 0.705 | Co–O | 2.040(6) | 0.0049(18) | |
| annealed at 1600∘C | Co–Ti | 3.094(15) | 0.0146(27) | |||
| Co–Sr | 3.816(20) | 0.0114(40) | ||||
| 0.282 | Co–O | 1.906(11) | 0.0037(18) | |||
| Co–Sr | 3.354(19) | 0.0087(12) | ||||
| Co–Ti | 3.907(17) | 0.0064(13) | ||||
| SrTi0.97Co0.03O3 | 0.00255 | 0.153 | Co–O | 2.040(6) | 0.0049(18) | |
| annealed at 1100∘C | Co–Ti | 3.094(15) | 0.0146(27) | |||
| Co–Sr | 3.816(20) | 0.0114(40) | ||||
| 0.731 | Co–O | 1.906(11) | 0.0037(18) | |||
| Co–Sr | 3.354(19) | 0.0087(12) | ||||
| Co–Ti | 3.907(17) | 0.0064(13) |
| Configuration | Positions of two Co atoms and vacancy | Figure in the | ||
|---|---|---|---|---|
| Co(1) | Co(2) | main paper | ||
| No nearest Co atoms, distant | (0,0,0) | (0.5,0.5,0) | (0.5,0.5,0.5) | Fig. 3(e) |
| The same (another configuration) | (0,0,0) | (0.5,0.5,0.333) | (0,0,0.5) | Fig. 3(f) |
| Nearest Co atoms, distant | (0,0,0) | (0,0,0.333) | (0.5,0.5,0.5) | Fig. 3(g) |
| Nearest Co atoms, nearest (angular) | (0,0,0) | (0,0,0.333) | (0, 0.25,0) | Fig. 3(h) |
| Nearest Co atoms, nearest (linear) | (0,0,0) | (0,0,0.333) | (0,0,0.833) | Fig. 3(i) |
| Nearest Co atoms, at the midpoint (FM) | (0,0,0) | (0,0,0.333) | (0,0,0.167) | Fig. 3(d) |
| Nearest Co atoms, at the midpoint (AFM) | (0,0,0) | (0,0,0.333) | (0,0,0.167) | Fig. 3(d) |
References
- Matsumoto et al. (2001) Y. Matsumoto, M. Murakami, T. Shono, T. Hasegawa, T. Fukumura, M. Kawasaki, P. Ahmet, T. Chikyow, S.-y. Koshihara, and H. Koinuma, Science 291, 854 (2001).
- Furdyna (1988) J. K. Furdyna, J. Appl. Phys. 64, R29 (1988).
- Ohno (1998) H. Ohno, Science 281, 951 (1998).
- Song et al. (2006) C. Song, K. W. Geng, F. Zeng, X. B. Wang, Y. X. Shen, F. Pan, Y. N. Xie, T. Liu, H. T. Zhou, and Z. Fan, Phys. Rev. B 73, 024405 (2006).
- Ueda et al. (2001) K. Ueda, H. Tabata, and T. Kawai, Appl. Phys. Lett. 79, 988 (2001).
- Kim et al. (2008) H.-S. Kim, L. Bi, G. F. Dionne, C. A. Ross, and H.-J. Paik, Phys. Rev. B 77, 214436 (2008).
- Ogale et al. (2003) S. B. Ogale, R. J. Choudhary, J. P. Buban, S. E. Lofland, S. R. Shinde, S. N. Kale, V. N. Kulkarni, J. Higgins, C. Lanci, J. R. Simpson, N. D. Browning, S. Das Sarma, H. D. Drew, R. L. Greene, and T. Venkatesan, Phys. Rev. Lett. 91, 077205 (2003).
- Philip et al. (2006) J. Philip, A. Punnoose, B. I. Kim, K. M. Reddy, S. Layne, J. O. Holmes, B. Satpati, P. R. LeClair, T. S. Santos, and J. S. Moodera, Nat. Mater. 5, 298 (2006).
- Yoo et al. (2005) Y. K. Yoo, Q. Xue, H.-C. Lee, S. Cheng, X.-D. Xiang, G. F. Dionne, S. Xu, J. He, Y. S. Chu, S. D. Preite, S. E. Lofland, and I. Takeuchi, Appl. Phys. Lett. 86, 042506 (2005).
- Griffin et al. (2005) K. A. Griffin, A. B. Pakhomov, C. M. Wang, S. M. Heald, and K. M. Krishnan, Phys. Rev. Lett. 94, 157204 (2005).
- Chambers et al. (2002) S. A. Chambers, C. M. Wang, S. Thevuthasan, T. Droubay, D. E. McCready, A. S. Lea, V. Shutthanandan, and C. F. Windisch Jr, Thin Solid Films 418, 197 (2002).
- Zhang et al. (2006) S. X. Zhang, S. B. Ogale, D. C. Kundaliya, L. F. Fu, N. D. Browning, S. Dhar, W. Ramadan, J. S. Higgins, R. L. Greene, and T. Venkatesan, Appl. Phys. Lett. 89, 012501 (2006).
- Kim et al. (2011) D. H. Kim, L. Bi, P. Jiang, G. F. Dionne, and C. A. Ross, Phys. Rev. B 84, 014416 (2011).
- Bi et al. (2010) L. Bi, H.-S. Kim, G. F. Dionne, and C. A. Ross, New J. Phys. 12, 043044 (2010).
- Posadas et al. (2013) A. B. Posadas, C. Mitra, C. Lin, A. Dhamdhere, D. J. Smith, M. Tsoi, and A. A. Demkov, Phys. Rev. B 87, 144422 (2013).
- Shvartsman et al. (2008) V. V. Shvartsman, S. Bedanta, P. Borisov, W. Kleemann, A. Tkach, and P. M. Vilarinho, Phys. Rev. Lett. 101, 165704 (2008).
- Lebedev et al. (2009) A. I. Lebedev, I. A. Sluchinskaya, A. Erko, and V. F. Kozlovskii, JETP Lett. 89, 457 (2009).
- Sluchinskaya et al. (2010) I. A. Sluchinskaya, A. I. Lebedev, and A. Erko, Bull. Russ. Acad. Sci.: Phys. 74, 1235 (2010).
- Sluchinskaya et al. (2013) I. A. Sluchinskaya, A. I. Lebedev, and A. Erko, J. Adv. Dielectrics 3, 1350031 (2013).
- Sluchinskaya et al. (2014) I. A. Sluchinskaya, A. I. Lebedev, and A. Erko, Phys. Solid State 56, 449 (2014).
- Murashkina et al. (2012) A. Murashkina, V. Maragou, D. Medvedev, V. Sergeeva, A. Demin, and P. Tsiakaras, J. Power Sources 210, 339 (2012).
- Malo and Maignan (2004) S. Malo and A. Maignan, Inorg. Chem. 43, 8169 (2004).
- Blazey and Muller (1983) K. W. Blazey and K. A. Muller, J. Phys. C: Solid State Physics 16, 5491 (1983).
- Doichilovich et al. (2004) Y. Doichilovich, N. Kulagin, D. Popovich, and S. Spasovich, Cryst. Reports 49, 469 (2004).
- Zhang et al. (2012) W. Zhang, H.-P. Li, and W. Pan, J. Mater. Sci. 47, 8216 (2012).
- (26) “NIST x-ray photoelectron spectroscopy database,” http://srdata.nist.gov/.
- Chainani et al. (1992) A. Chainani, M. Mathew, and D. D. Sarma, Phys. Rev. B 46, 9976 (1992).
- Pascanut et al. (2006) C. Pascanut, N. Dragoe, and P. Berthet, J. Magn. Magn. Mater. 305, 6 (2006).
- Zhao et al. (2003) Y. G. Zhao, S. R. Shinde, S. B. Ogale, J. Higgins, R. J. Choudhary, V. N. Kulkarni, R. L. Greene, T. Venkatesan, S. E. Lofland, C. Lanci, J. P. Buban, N. D. Browning, S. Das Sarma, and A. J. Millis, Appl. Phys. Lett. 83, 2199 (2003).
- Herranz et al. (2006) G. Herranz, R. Ranchal, M. Bibes, H. Jaffrès, E. Jacquet, J.-L. Maurice, K. Bouzehouane, F. Wyczisk, E. Tafra, M. Basletic, A. Hamzic, C. Colliex, J.-P. Contour, A. Barthélémy, and A. Fert, Phys. Rev. Lett. 96, 027207 (2006).
- Fix et al. (2009) T. Fix, M. Liberati, H. Aubriet, S.-L. Sahonta, R. Bali, C. Becker, D. Ruch, J. L. MacManus-Driscoll, E. Arenholz, and M. G. Blamire, New J. Phys. 11, 073042 (2009).
- Blazey et al. (1981) K. W. Blazey, R. Koch, and K. A. Müller, Mater. Res. Bull. 16, 1149 (1981).
- Decorse-Pascanut et al. (2009) C. Decorse-Pascanut, J. Berthon, L. Pinsard-Gaudart, N. Dragoe, and P. Berthet, J. Magn. Magn. Mater. 321, 3526 (2009).
- Lee et al. (2003) J. S. Lee, Z. G. Khim, Y. D. Park, D. P. Norton, N. A. Theodoropoulou, A. F. Hebard, J. D. Budai, L. A. Boatner, S. J. Pearton, and R. G. Wilson, Solid-State Electron. 47, 2225 (2003).
- Galinetto et al. (2008) P. Galinetto, A. Casiraghi, M. C. Mozzati, C. B. Azzoni, D. Norton, L. A. Boatner, and V. Trepakov, Ferroelectrics 368, 120 (2008).
- Florez et al. (2012) J. M. Florez, S. P. Ong, M. C. Onbaşli, G. F. Dionne, P. Vargas, G. Ceder, and C. A. Ross, Appl. Phys. Lett. 100, 252904 (2012).
- Mitra et al. (2014) C. Mitra, C. Lin, A. B. Posadas, and A. A. Demkov, Phys. Rev. B 90, 125130 (2014).
- (38) “Ifeffit project home page,” http://cars9.uchicago.edu/ifeffit/.
- Lebedev et al. (1997) A. I. Lebedev, I. A. Sluchinskaya, V. N. Demin, and I. H. Munro, Phys. Rev. B 55, 14770 (1997).
- Garrity et al. (2014) K. F. Garrity, J. W. Bennett, K. M. Rabe, and D. Vanderbilt, Comput. Mater. Sci. 81, 446 (2014).
- Lebedev and Sluchinskaya (2016) A. I. Lebedev and I. A. Sluchinskaya, Ferroelectrics 501, 1 (2016).
- Note (1) The names of the samples include the impurity name, its concentration in percents, the site into which the impurity is incorporated, and the annealing temperature.
- Sluchinskaya and Lebedev (2017) I. A. Sluchinskaya and A. I. Lebedev, Phys. Solid State 59, 1512 (2017).
- Faughnan (1971) B. W. Faughnan, Phys. Rev. B 4, 3623 (1971).
- Phuong et al. (2013) D. T. T. Phuong, N. V. Minh, and C. T. Dung, Commun. Phys. 23, 263 (2013).
- Hui and Petric (2002) S. Hui and A. Petric, Mater. Res. Bull. 37, 1215 (2002).