ORIGIN FOR THE PROMPT SPECTRAL EVOLUTION CHARACTERISTICS AND HIGH ENERGY EMISSION DURING THE X-RAY FLARE IN GRB 180720B
Abstract
The gamma-ray burst GRB 180720B is very peculiar. On one hand, some interesting features have been found by performing the detailed time-resolved spectral analysis in the prompt phase. First, the ‘flux-tracking’ pattern is exhibited both for the low energy spectral index and the peak energy in the Band function. Second, some parameter relations show strong monotonous positive correlations, include , , , and for all time-resolved spectra. Lastly, it should be noted that the values of do not exceed the synchrotron limits (from to ). On the other hand, the photons with the energy of 100 MeV were detected by LAT both in the prompt phase and afterglow. Notably, the 5 GeV photon was observed at 142 s after the GBM trigger. The spectrum of this burst in the LAT range can be described as in the afterglow phase. And there are six GeV photons during the X-ray flare when the lower energy emission is fading to a weaker level. We try to give reasonable interpretations of the mechanism for prompt emission and the high energy emission (100 MeV to GeV) in the afterglow. The interpretations suggesting that synchrotron origin can account for the prompt emission and synchrotron self-Compton radiation can account for both the spectrum and temporal behavior of the 100 MeV to GeV afterglow emission that have been accepted by us.
1 Introduction
Gamma-ray bursts (GRBs) are the brightest explosions in the universe. It’s generally believed that they are from the black holes or magnetars since the death of massive stars or the mergers of compact binaries (BH-NS or NS-NS) (Colgate, 1974; Paczynski, 1986; Eichler et al., 1989; Narayan et al., 1992; Woosley, 1993; MacFadyen & Woosley, 1999; Woosley & Bloom, 2006; Kumar & Zhang, 2015). The observed gamma-ray burst spectra can be fitted well by a function named Band (Band et al., 1993) both for the time-integrated spectra and the time-resolved spectra. It is pointed out that the spectral parameters, such as low-energy index and peak energy , are evolves with time instead of remaining constant. In the early years, Golenetskii et al. (1983), Norris et al. (1986), Kargatis et al. (1994), Bhat et al. (1994), Ford et al. (1995), Crider et al. (1997), Kaneko et al. (2006) Peng et al. (2009) in pre- era and Lu et al. (2012), Yu et al. (2016), Acuner & Ryde (2018), Li (2018), Yu et al. (2018) in era have shown the evolution characteristics of and . And the evolution patterns have been summarised as three types in pre- era: (i) they are decreasing monotonically, named ‘hard-to-soft’ trend (Norris et al., 1986; Bhat et al., 1994; Band, 1997); (ii) they are increasing/decreasing when the flux is increasing/decreasing, named ‘flux-tracking’ trend (Golenetskii et al., 1983; Ryde & Svensson, 1999); (iii) ‘soft-to-hard’ trend or chaotic evolutions (Laros et al., 1985; Kargatis et al., 1994). Recently, it is proved that the first two patterns are dominated both in Lu et al. (2012) and Yu et al. (2018). However, it is not very for the physical origin of these two patterns. On the other hand, the correlation analysis for in a single burst is lacking , except for GRB 131231A in Li et al. (2019) which is a single-pulse burst.
Additionally, since the statistics given by Compton Gamma Ray Observatory told ones that, maybe, it’s originated from cosmology for GRBs (Meegan et al., 1992). And there are more astrophysical scientists or astronomical workers take it as a career in their life to explore the universe probed by GRBs. So, more and more Gamma-Ray Monitors are born in these years. Especially, the launch of Swift Gamma-Ray Burst Mission with three instruments (Gehrels et al., 2004) gave birth to a new era of GRBs. The broad-band afterglow light curves were recorded by the X-ray telescope (XRT) and the UV/optical telescope onboard . It makes one a chance to summarize the X-ray afterglow light curve such as Zhang et al. (2006). And the launch of Fermi Gamma-ray Space Telescope in 2008 (Atwood et al., 2009) make it possible to detect GRBs in broad energy range both in prompt emission and afterglow emission. In fact, there are some GeV photons were detected in some GRBs in prompt emission or afterglow emission such as GRB 130427A with GeV photons both in prompt emission and afterglow (Ackermann et al., 2014), GRB 940217, a burst that the highest energy photon was detected with energy of 18 GeV in afterglow (Hurley et al., 1994). Some focused on highest energy photons in prompt emission like Takagi & Kobayashi (2005). And others focused on those highest energy photons in afterglow with interpretation of synchrotron radiation (Kumar & Barniol Duran, 2009; Gao et al., 2009; Ghisellini et al., 2010; He et al., 2011; Ackermann et al., 2013b; Liang et al., 2014) very early, but, another named inverse-Compton (IC) emission as the leading mechanisms for GeV photons was accepted such as Liu et al. (2014) and Ackermann et al. (2014) since the hypothesis of IC in GeV emission was given by Zou et al. (2009). To our surprise, in afterglow with GeV emission, there are two types of inverse-Compton emission with GeV emission during X-ray flares, synchrotron self-Compton (SSC) radiation from the interaction between photons and electrons that (Mészáros & Rees, 1994), and another one is external inverse Compton (EIC) emission due to the interaction between photons and hot electrons in external shock (Fan et al., 2008).
GRB 180720B, the gamma-ray burst observed by (co-detected by and ) and (co-detected by and ) recently, is a long, extremely bright and peculiar gamma-ray burst. Especially, it’s very interesting that the and exhibit the ‘flux-tracking’ and the highest photons with energy of GeV were found during X-ray flare in early afterglow, which is different from GRB 100728A in mechanism (see Abdo et al. (2011)).
In this work, , we give the and evolution patterns. The parameters correlations also will be presented in our analysis. We also the and during X-ray flare in afterglow of this burst by using data include GBM and LAT energy band. At the same time, the public /XRT data was also used to the components of afterglow emission because there would be interesting result in the radiation mechanism for gamma-ray afterglow (100 MeV to GeV) if we take it account for the mechanism in afterglow. And then we discuss its physical interpretation (synchrotron origin or photosphere model) both for the and evolution pattern with the consideration that the low-energy index does not exceed the synchrotron limits given by Sari et al. (1998) and we give the reasonable interpretation of mechanism for very high energy gamma-ray afterglow.
2 GRB 180720B
The Fermi Gamma-Ray Burst Monitor (GBM) triggered on GRB 180720B (trigger 553789304/180720598) at 14:21:39.65 UT () on 20 July 2018 and its duration () is 49 s with the observation from 50 to 300 keV (Roberts & Meegan, 2018). Then, Fermi-LAT detected high energy emission from the burst at 14:21:44.55 according to Bissaldi & Racusin (2018). In addition to the , /BAT triggered the burst at 14:21:44 UT on 20 July 2018 (trigger=848890) (Siegel et al., 2018) with a duration () of 108 s (http://gcn.gsfc.nasa.gov/notices_s/848890/BA/). Similarly, /XRT detected the signal from it (86.5 s after the BAT trigger), and there is a bright flare in X-ray band with a duration of more than one hundred seconds (Siegel et al., 2018). And one deduced that the redshift of the burst is z=0.654 since several absorption features are detected at z=0.654 in Vreeswijk et al. (2018).
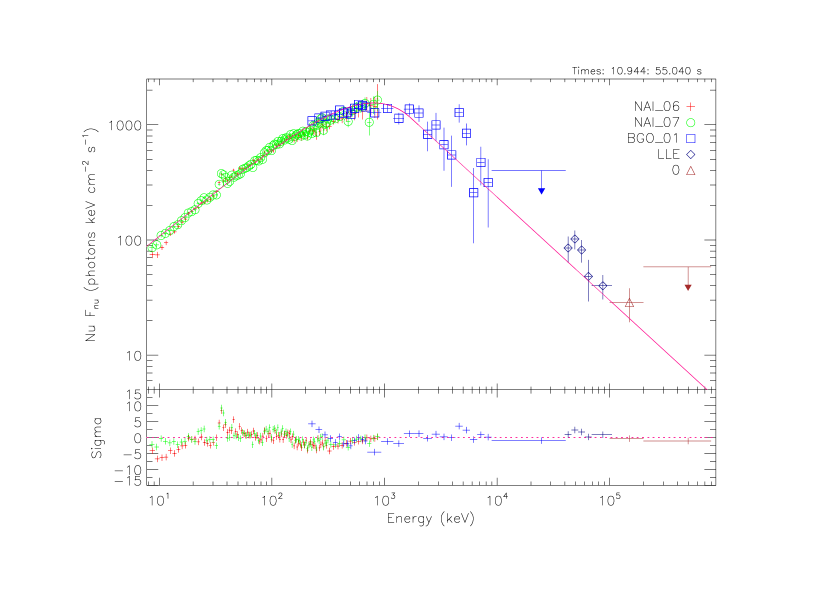
In the data, there are some interesting signatures. For the GBM data, the fluence is in the 10 keV to 1000 keV energy range over the interval (Roberts & Meegan, 2018). The time-averaged spectrum (from trigger to 55 s after trigger) is best fit by the Band function (Band et al., 1993) with keV, , (Roberts & Meegan, 2018) in GBM energy range. It’s very bright in LAT energy range and the is detected at 137 seconds after the GBM trigger with energy of 5 GeV according to Bissaldi & Racusin (2018), but, in fact, we found that this photon was observed by LAT at 142 s after GBM trigger through making likelihood analysis (see Section 3.2.1). Such a photon with highest energy in afterglow is very monstrous like GRB 130427A (Ackermann et al., 2014).
In the data, the observation of BAT shows a multi-peaked structure from trigger to about 150 s after trigger (Siegel et al., 2018). The fluence is in the 15 keV to 150 keV energy range (Barthelmy et al., 2018) according to BAT data. Then, we can find that there is a very bright flare as said above with a duration of more than one hundred seconds (Siegel et al., 2018) in X-ray band. If we are careful enough, the phenomenon would be found easily that there are some GeV photons while the X-ray flare was detected (see Section 3.2.1).
3 Data analysis of GRB 180720B and the results
3.1 Analysis in Prompt Phase
3.1.1 Temporal Characteristics and Time-resolved Spectral Analysis
The data of GRB 180720B that we utilized are available at the Fermi Science Support Center (FSSC).111https://fermi.gsfc.nasa.gov/ssc/data/access/ We extract GBM from the TTE (Time-Tagged Events) data by using a Python source package named gtBurst.222https://github.com/giacomov/gtburst To complete this analysis, we also take RMFIT as the tool of making spectral analysis. We perform the analysis by using the data of two NaI detectors (, ) and one BGO detector () on /GBM. The energy range for each spectrum from 10 keV to 40 MeV. And the background photon counts were estimated by fitting the before and after the burst with a one-order background polynomial model. We selected the interval from 0 s to 55 s after GBM trigger as the source. The signal-to-noise ratio (S/N) with value of 30 was used in all of these slices. And they all can be fitted well by Band (Band et al., 1993). The goodness-of-fit in our analysis by reduced . The results for all of these slices are presented in Table 2.
| Time Interval(s) | Energy FluxaaIn the unit of ; values without uncertainty are upper limits. | Photon FluxbbIn the unit of ; values without uncertainty are upper limits. | Photon Index | TS value |
|---|---|---|---|---|
| 11–60 | (5.991.53)10-8 | (2.20.56)10-4 | -3.410.48 | 180 |
| 60–90 | (1.350.43)10-7 | (2.320.67)10-4 | -2.100.29 | 172 |
| 90–105 | (1.800.68)10-7 | (3.431.20)10-4 | -2.200.37 | 120 |
| 105–145 | (1.170.40)10-7 | (1.260.41)10-4 | -1.670.28 | 141 |
| 145–250 | (4.191.13)10-8 | (7.291.76)10-5 | -2.110.24 | 185 |
| 250–550 | (6.792.58)10-9 | (1.170.39)10-5 | -2.090.34 | 68 |
| 550–1000 | 6.9510-9 | 1.0910-5 | – | 11 |
| 4500–6900 | 1.5610-9 | 2.4410-6 | – | 10 |
| aaTime intervals. | flux | Red. | ||||
|---|---|---|---|---|---|---|
| s | keV | |||||
| 3.5525.467 | -0.950.02 | -2.310.09 | 104885.5 | 8.50.11 | 373.70/355 | 1.05 |
| 5.4677.524 | -0.970.02 | -2.200.08 | 708.556.9 | 7.10.12 | 398.45/355 | 1.12 |
| 7.5248.591 | -0.900.02 | -2.120.06 | 965.772.0 | 150.19 | 342.18/355 | 0.96 |
| 8.59110.223 | -1.010.02 | -2.200.07 | 616.840.4 | 110.15 | 415.64/355 | 1.17 |
| 10.22311.667 | -0.950.01 | -2.360.07 | 953.453.2 | 160.16 | 393.96/355 | 1.11 |
| 11.66713.306 | -1.000.02 | -2.170.06 | 569.337.5 | 100.15 | 385.08/355 | 1.08 |
| 13.30614.713 | -0.940.02 | -2.190.06 | 432.725.4 | 110.15 | 469.61/355 | 1.32 |
| 14.71315.029 | -0.940.03 | -2.580.22 | 719.668.5 | 170.38 | 320.21/355 | 0.90 |
| 15.02915.415 | -0.890.05 | -2.030.08 | 310.235.1 | 110.24 | 371.88/355 | 1.05 |
| 15.41516.024 | -0.900.02 | -2.280.07 | 782.750.0 | 230.31 | 445.08/355 | 1.25 |
| 16.02416.597 | -0.840.02 | -2.120.04 | 838.341.2 | 410.42 | 438.27/355 | 1.23 |
| 16.59717.257 | -0.960.02 | -2.080.05 | 526.835.2 | 210.29 | 387.41/355 | 1.09 |
| 17.25717.649 | -0.860.02 | -2.530.10 | 685.235.8 | 350.47 | 402.40/355 | 1.13 |
| 17.64918.171 | -1.040.03 | -2.170.08 | 420.735.2 | 160.27 | 360.66/355 | 1.02 |
| 18.17118.979 | -1.050.03 | -2.310.10 | 294.220.5 | 110.17 | 388.69/355 | 1.09 |
| 18.97919.358 | -1.120.03 | -2.610.25 | 525.647.4 | 160.35 | 338.27/355 | 0.95 |
| 19.35821.215 | -1.250.05 | -1.980.05 | 179.623.5 | 4.30.073 | 388.28/355 | 1.09 |
| 21.21527.937 | -1.350.02 | -2.120.08 | 232.321.2 | 2.80.037 | 471.65/355 | 1.33 |
| 27.93729.473 | -1.190.02 | -2.420.19 | 459.140.9 | 6.50.13 | 343.86/355 | 0.97 |
| 29.47329.874 | -1.000.04 | -2.280.15 | 324.134.5 | 9.80.24 | 354.26/355 | 0.99 |
| 29.87430.055 | -0.830.03 | -3.110.36 | 883.264.8 | 340.63 | 357.71/355 | 1.01 |
| 30.05531.524 | -1.220.02 | -2.890.52 | 545.747.9 | 6.90.13 | 326.67/355 | 0.92 |
| 31.52448.247 | -1.330.06 | -1.910.06 | 161.031.3 | 0.850.019 | 393.70/355 | 1.11 |
| 48.24755.040 | -1.160.02 | -2.290.15 | 364.330.8 | 2.50.042 | 382.68/355 | 1.08 |
3.1.2 The Peculiar Characteristics of the Spectral Evolution in GRB 180720B: ‘flux-tracking’ patterns for and
As we all know, it may suffer from the influence of the complex central engine for multipulse gamma-ray burst so that many of the properties are harder to than the single-pulse. But it’s different in our case, for GRB 180720B, which is a multipulse structure . The temporal evolution of and display significant ‘tracking’ along with photon counts, especially, the ‘flux-tracking’ are also shown in Figure 3 although it’s the multipulse burst instead of the single-pulse like GRB 131231A in Li et al. (2019), which is also the ‘flux-tracking’ pattern for its and in all time-resolved spectra.
Recently, the discovery that there are only 8 out of 38 bursts display ‘flux-tracking’ trend for was reported in Yu et al. (2018). On the other hand, they also pointed out that the evolution has no strong general trend. In general, the multipulse bursts would be more complex if the single-pulse are irregular for the evolution of and . However, the fact that both and exhibit the ‘flux-tracking’ patterns suggests that the spectral evolution for GRB 180720B is very peculiar, which is a multipulse structure in prompt phase. For the single-pulse, the individual parameter relations will show strong monotonous positive correlations in both the rising and decaying wings since both the and exhibit the ‘flux-tracking’ patterns like GRB 131231A in Li et al. (2019). So, we guess that the signature will emerge that the individual parameter relations may show strong monotonous positive correlations across the whole pulse in multipulse GRB 180720B with the ‘flux-tracking’ of and . In the following, the detailed parameter correlation analysis will be present.
3.1.3 Parameter Correlation Analysis
The parameter correlation analysis is important to reveal the radiation mechanism of GRB in prompt. These correlations such as , and correlations shown in Figure 4 and Figure 5. Besides, another key correlation of was also carried in Figure 5. The time-resolved in GRB 180720B shows a strong positive correlation through the whole pulse. The best linear fit is log/(keV)=(4.480.46)+(0.350.09) log/(erg/cm2/s), with number of data points , the Pearson’s linear correlation coefficient . The best linear fit is =(0.720.24)+(0.350.05) log/(erg/cm2/s) (, ) for the time-resolved correlation. This relation for GRB 180720B is very similar to the relation, they show a strong monotonic positive relation. However, it seems that GRB 180720B is a special case in multipulse GRBs, since the fact that the power-law indices for the and relations are same is quite surprising. , there are two important relations as shown in Figure 5. One is the strong monotonic positive relation between and , with the best linear fit of log/(keV)=(3.770.22)+(1.020.22) (, ). It’s obvious that the value of does not exceed the synchrotron limits ( to ). The known redshift with value of can make us calculate the isotropic luminosity for each spectrum. So, another one is relation as shown in right panel of Figure 5. The gray filled circles represent the sample in Yonetoku et al. (2010) were carried for comparison. Our best linear fit is for GRB 180720B. The Yonetoku’s sample gives .
3.2 Analysis During High Energy Emission Phase
As said in Section 3.1.1, the data of GRB 180720B that we utilized are available at the Fermi Science Support Center (FSSC). We also extract the LAT light curve and spectrum by using a Python source package named gtBurst. The /XRT light curve and spectra are taken from the Analyzer.333http://www.swift.ac.uk/burst_analyser/00848890/ To complete this analysis, we also take RMFIT and Xspec as the tools of making spectral analysis.
3.2.1 Temporal Analysis
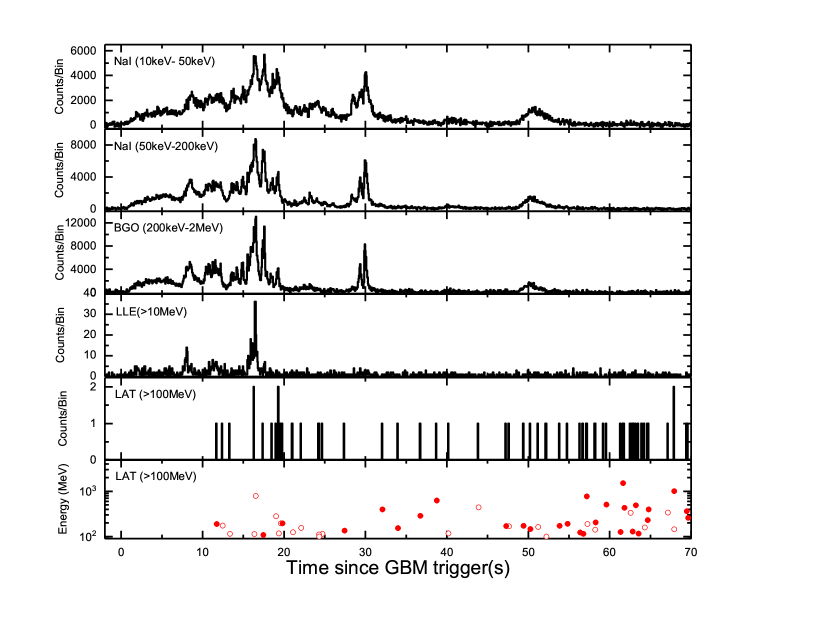
The results of our analysis that temporal profile of the emission from GRB 180720B varies with energy from 10 keV to are shown in Figure 6. It represents the whole from prompt to afterglow phase on the top. While, the photons with energy of 100 MeV in the -LAT data are presented the bottom of Figure 6. The fact that highest energy photons with energy of GeV observed during X-ray flare has emerged.
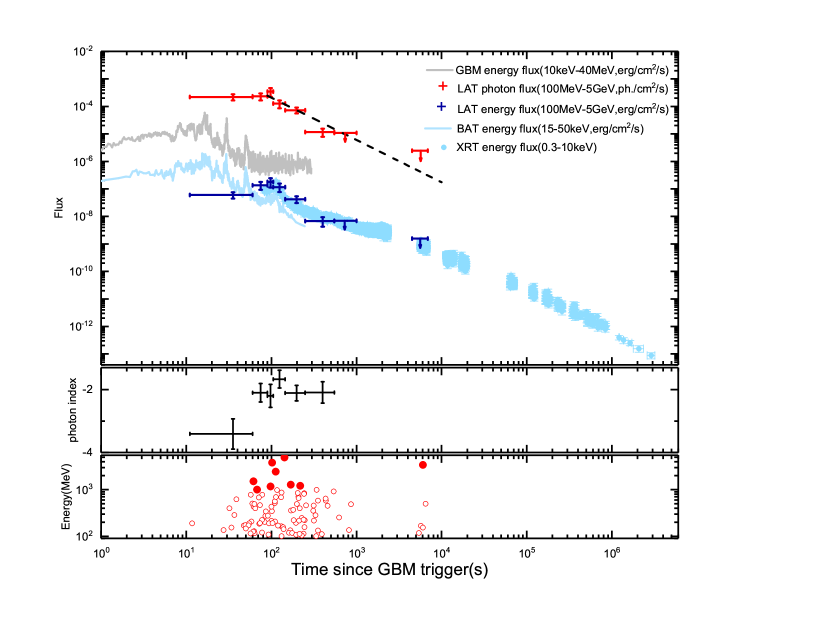
The GeV photons were detected at about 60 s after trigger. It’s not disappeared until the highest energy photon (5 GeV, s) arise for this phenomenon. It remained that many MeV photons were observed in afterglow. And the LAT photon flux light curve can be well fitted by a power-law read as:
| (1) |
(where is the decay indice) in Logarithmic Timescale with the best fit temporal index is , which is similar to other -LAT bursts (Ackermann et al., 2013a). One can find that the prompt gamma-ray emission detected by /BAT is consistent with /GBM observation from Figure 6. There is a very bright flare in X-ray band while they were fading to a weaker level for GBM and BAT light curves. Without considering the fluctuation of the flare, it can be fitted well by a smoothly broken , which is read as:
| (2) |
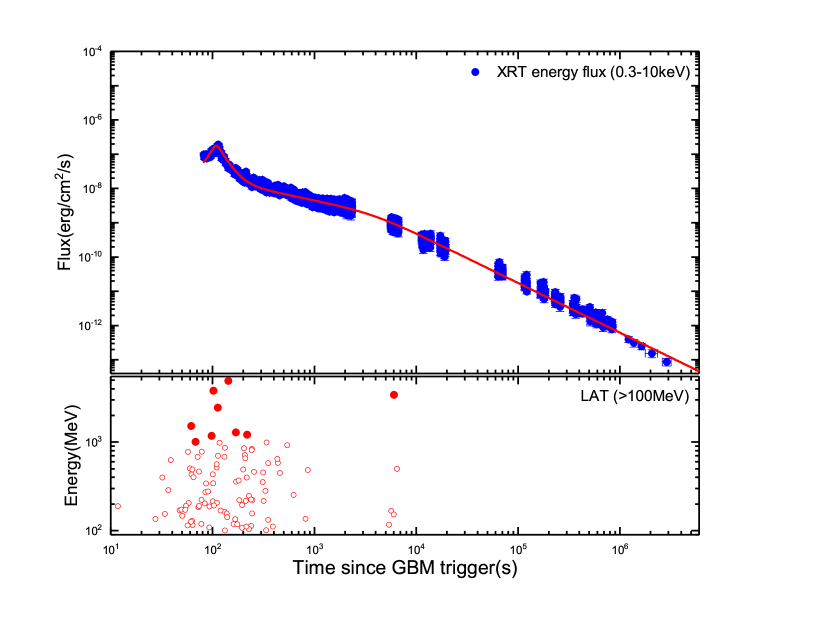
where measures the sharpness of the peak. Then we get , , , and . The rapid increase and decrease of the flux imply that it would be the activity of central engine in this burst. It means that it comes from the internal for this flare. Moreover, the X-ray afterglow light curve was fitted well by a double smoothly broken (see Figure 7).
On the other hand, to our surprise, the GeV observations of this burst are weaker than other LAT-bursts such as GRB 940217 (Hurley et al., 1994), GRB 130427A (Zhu et al., 2013), GRB 131231A (Sonbas et al., 2013) and GRB 160625B (Dirirsa et al., 2016), but, there are six photons with energy of GeV, a 1.2 GeV photon at , a 3.8 GeV photon at , a 2.45 GeV photon at , a 5 GeV photon at , a 1.3 GeV photon at , a 1.2 GeV photon at , after trigger observed by LAT during the first X-ray flare while the lower energy emission fading. This implies the fact that the GeV flare at the same time the X-ray flare . Moreover, it also means that the GeV emission associated with X-ray flare.
3.2.2 Spectral Analysis
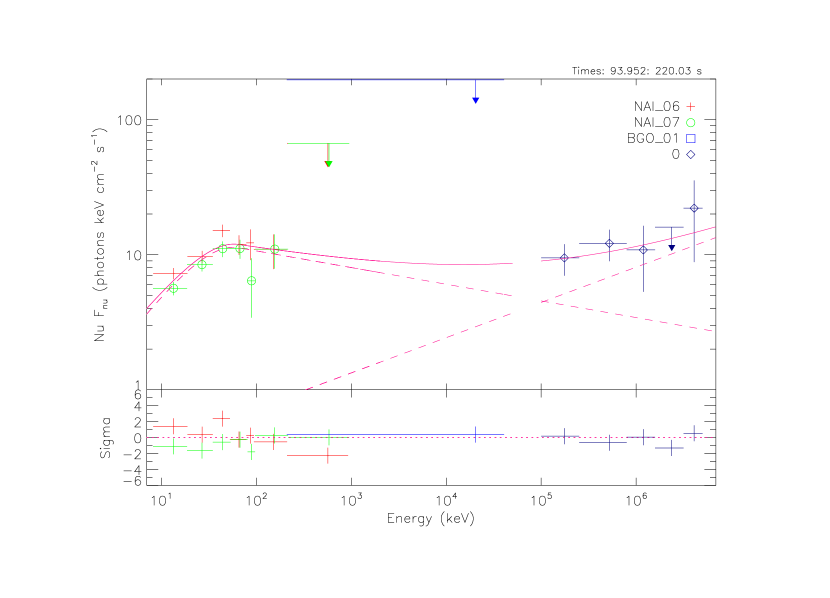
The results of our analysis of spectral energy distributions in afterglow phase from lower energy to GeV range are shown in Figure 8 according to the photon statistics permission. The spectrum (from about 94 s to 220 s after trigger) by using the data select combined with and LAT is well fitted by Band function (Band et al., 1993) with the superposition of which is extended to high energy (). At the same time, the neutral hydrogen density of the Milky Way in the burst direction is . With the neutral hydrogen of the GRB host galaxy is taken into account, we found that a single power-law function is adequate to fit the X-ray time-averaged spectrum with the photon index (). To our excitement, the Band function with the superposition of can be extrapolated to the X-ray range from energy range. In a words, the joint XRT, GBM and LAT spectrum can be fitted well by a Band function with the superposition of which is in high energy emission. And we obtain the photon index (shown in Figure 6) by making likelihood analysis using all 100 MeV to GeV photons, which is consistent with the indices of other LAT (Ackermann et al., 2013a). In other words, the spectral index is available for because of (EXT is the interval between the end of GBM detected and LAT-detected emission), where is read as: (Ackermann et al., 2013a).
We present the photons with energy of 100 MeV in the -LAT data in the bottom panel of Figure 6 and Figure 7. As shown in Figure 6, there are some photons with energy of 100 MeV while the low energy emission is fading to a weaker level. There are six GeV photons during the first X-ray flare. out a challenge to the theoretical model at any moment. It’s attaching us to search for the mechanism of those monstrous photons in this burst, more details will be discussed later.
3.2.3 Comparison of the very high energy emission of GRB 180720B with GRB 100728A, GRB 131231A and GRB 130427A
There are many LAT-bursts since the launch of from 2008. The photons with energy of 100 MeV usually are detected in prompt or afterglow phase for gamma-ray bursts. And it’s reported that the GeV photons were detected (include tens of GeV) sometimes such as GRB 100728A (Abdo et al., 2011), GRB 130427A (Zhu et al., 2013) and GRB 131231A (Sonbas et al., 2013). They are also very particular.
The redshift of the burst is similar to GRB 131231A with the redshift of , which is a factor of two larger than GRB 130427A. While the redshift of GRB 100728A is a factor of two larger than the GRBs 180720B and 131231A. Photons with energy of tens of GeV were found in GRBs 131231A, 130427A and GRB 100728A while in GRB 180720B just the GeV photons within 10 GeV were collected. We note that the isotropic energy of GRB 180720B is similar to GRB 131231A in prompt phase. This value is a factor of 10 smaller than GRB 130427A and GRB 100728A. But, there are something in common with GRB 100728A for this burst. Some GeV photons are observed by LAT during X-ray flare both in GRB 180720B and GRB 100728A(Wang & Dai, 2013). All four have similar photon index with (In general, it is for LAT-bursts.).
With these similarities, we infer that they are produced with similar physical mechanism to the GeV photons (or those photons with energy of 100 MeV to GeV) in GRBs 180720B, 131231A, 130427A and 100728A as it has been proved that the high energy component is produced by synchrotron self-Compton emission in refreshed shock originated from the of central engine in GRB 131231A (Liu et al., 2014), GRB 130427A (Ackermann et al., 2014) and GRB 100728A (Wang & Dai, 2013). We expect that there are new discoveries, and more details will be discussed later.
4 Discussion
4.1 Origin of the Prompt Spectral Evolution Characteristics for GRB 180720B
For the features of GRB 180720B in prompt, they can be summarized as: (i) the prompt emission is a multipulse structure; (ii) the ‘flux tracking’ emerged both for and ; (iii) four parameter relations, , , and , exhibit during the interval; (iv) the value of lower energy photon index does not exceed the synchrotron limits In the following, we will discuss the origin of the prompt emission in GRB 180720B through the ‘flux-tracking’ for the and of spectral evolution within the frameworks of the synchrotron and photosphere model.
The relation of can be derived from Zhang & Mészáros (2002) in the synchrotron model, where is the ‘wind’ luminosity of ejecta, is the typical electron Lorentz factor of emission region, is the emission radius, and is the redshift of the burst. Then, it is possible that the tracking emerged since the relation of . On the other hand, Uhm et al. (2018) out that the ‘flux-tracking’ could be reproduced successfully within the synchrotron radiation model. In this model, for the evolution with ‘flux-tracking’ pattern, the is increasing/decreasing while the flux is increasing/decreasing. As said in Li et al. (2019) for GRB 131231A, it could be attributed to the fact that the electron distribution is getting harder if it is the synchrotron origin for the hardening before the first highest peak. Both the decaying magnetic field in the emission region (Deng & Zhang, 2014) and the synchrotron self-Compton (SSC) cooling of electrons (Geng et al., 2018) can make the electron spectrum hardening. The increase of Lorentz factor of emitting electrons when the is larger and the decay of magnetic field will make the electron spectrum to be hard. And the ratio of the radiation energy to the magnetic energy is rising since the flux is increasing, then, the SSC cooling of electrons is more so that the to be harder.
Similarly, the relation of for the and the relation of for the can be derived for photosphere model, where is the initial acceleration radius, is the bulk Lorentz factor, is the radius of photosphere, and is the saturation radius. The anti-correlation is found between and . Deng & Zhang (2014) pointed out that the observed ‘hard-to-soft’ and ‘flux-tracking’ are both not easy to be reproduced in this model when they satisfy the relation of between the radius of photosphere and saturation radius unless dependence between and is exist. However, the two observed evolution patterns of ‘hard-to-soft’ and ‘flux-tracking’ can be reproduced when the since the relation of is certain (Meng et al. 2019, which is told in preperation in Li et al. (2019)). On the other hand, in this model, the ‘hard-to-soft’ pattern is predicted for the evolution, which is different from complexity of the evolution.
For GRB 180720B, both the and track the flux tightly . In consideration of these prompt spectral evolutions, the interpretation that synchrotron origin can account for the coexist of the ‘flux-tracking’ for the and , but the photosphere origin is invalid. And another important evidence that can support the interpretation of synchrotron origin is that the values of during the interval do not exceed the synchrotron limits by performing the detailed time-resolved spectral analysis.
4.2 Origin of the High Energy Emission during the X-ray Flare for GRB 180720B
Here, we expect that the high energy emission can be used to constrain the afterglow model. A spectrum as (see Section 3.2.1, 3.2.2) from 100 MeV to GeV in LAT-bursts can be roughly accounted not only by synchrotron radiation but also can be interpreted by synchrotron self-Compton radiation. It can be accounted by synchrotron radiation if the injected electrons of and it is above both the cooling frequency () and typical frequency () for the band selected by us (Zhang & Mészáros, 2004). Another case is synchrotron self-Compton radiation with index of and the band is above both the and without evolution of Y named Compton parameter (Wei & Fan, 2007; Fan & Piran, 2008). One pointed out that it is likely to be the fast-cooling part for LAT-detected 100 MeV emission (Sari et al., 1998; Granot & Sari, 2002). Whereas, it’s also available to use the interpretation by fast-cooling for both the first and second case. , synchrotron radiation or synchrotron self-Compton radiation?
Firstly, for the GeV emission, the two conditions are required to allow the GeV emission to be observed. One is that the source has to be optically thin for pair production as said in Abdo et al. (2011), the lower limit on the Lorentz factor is
| (3) |
(Equation (1) in Abdo et al. (2011)) when the value of 2 was thought as photon index value from Lithwick & Sari (2001). Then the will change while the named the shortest time scale is variable. If the X-ray flare is related to the activity of central engine, one derives by s for this burst. Based on the above assumption, is required to allow the 5 GeV photon to be observed at 142 s after the burst. And another condition is derived by requiring that the is large enough to make the blast wave accelerate electrons produce photons of energy through synchrotron radiation:
| (4) |
(Equation (3) in Abdo et al. (2011)) without the consideration of Y (named Compton parameter) evolution. We can derive the constrain of Lorentz factor in emitting region, i.e., from the . Whereas, the low critical initial Lorentz factor derived from the Equation (1) in Zhang et al. (2003) . It makes the Lorenz factor at any moment in afterglow is lower than this value the relationship of . Based on the two conditions, we can point out that, simply but robustly, In fact, the GeV emission has been thought to arise from external inverse Compton (EIC) or synchrotron self-Compton (SSC) (Fan et al., 2008). And it’s worth noting that, one pointed out that, it seems that they are produced by EIC instead of SSC for the GeV photons during the X-ray flare detected by /LAT (Fan & Piran, 2006; Fan et al., 2008; Wang et al., 2006; He et al., 2012), while the GeV photons were observed during the first X-ray flare in this burst as said above. Here, , in which the detected GeV photons are produced by SSC in the refreshed shock from the reactivation of central engine. As mentioned in Fan et al. (2008), there are some differences between EIC and SSC for the GeV emission during the X-ray flare. They originate from the reactivation of central engine both for EIC and SSC, but, the latter is produced by the interaction from photons and electrons both in shocks. And another one comes from the interaction between photons (those photons move to external shocks later) and hot electrons in the external shocks. In a word, the former is originated by later internal shock but it’s produced by the refreshed shocks due to the encounter between later shell and external shocks. Just because this, photons would arrive at later time compared with the lower photons in the former, but, they arrive at the same time in the latter. In a word, it’s expected that there are observations of GeV flash with X-ray flare both in and latter, but we can identify them through comparing the time of arrival between GeV flash photons and X-ray flare photons. No doubt, in our burst, it’s obvious that the maximal probability is synchrotron self-Compton for GRB 180720B.
Secondly, for the LAT emission, the with value of is necessary to produce flux at s for synchrotron radiation. It seems unrealistic. There is no doubt that it should to give a reasonable interpretation using the thought that the LAT emission derived from radiation. While the interpretation that the LAT emission from synchrotron self-Compton radiation can be called up for this burst. In synchrotron self-Compton radiation model, as summarized by Fan & Piran (2008), it is possible to produce such a flux. From the Equations (52) and (53) in Fan & Piran (2008), through the value of flux with the equation:
| (5) |
The flux is allowed during the interval using the two characteristic frequencies and the above equation in SSC. As described above, it is very reasonable to interpret the spectrum using synchrotron self-Compton radiation. The model , without evolution of Y (Compton parameter) (Wei & Fan, 2007; Fan & Piran, 2008) is consistent with both the spectrum data and the temporal in the environment of medium when electrons are in the fast cooling phase.
Thirdly, it is inadequate to fit the joint spectrum (XRT, GBM and LAT) as described in Section 3.2.2 by using a single function. The superposed function has to be used to to the high energy emission of LAT instead of single Band function. And it’s found that it is important both for GeV energy range and sub-GeV energy range in LAT. In general, . So, the synchrotron self-Compton radiation must be called for.
5 Conclusion
GRB 180720B is a long, very bright and peculiar burst with the multipulse structure . It can be the multipulse bursts.
And at last, we must accept the interpretation that the high energy emission during X-ray flare is originated from synchrotron self-Compton radiation in light of all the .
References
- Abdo et al. (2011) Abdo, A. A., Ackermann, M. & Ajello, M., et al. 2011, ApJ, 734, L27
- Ackermann et al. (2013a) Ackermann, M., Ajello, M., Asano, K., et al. 2013a, ApJS, 209, 11
- Ackermann et al. (2013b) Ackermann, M., Ajello, M. & Asano, K. 2013b, ApJ, 763, 71, L27
- Ackermann et al. (2014) Ackermann, M., Ajello, M. & Asano, K., et al. 2014, \Science, 343, 42
- Acuner & Ryde (2018) Acuner, Z. & Ryde, F. 2018, MNRAS, 475, 1708
- Ajello et al. (2019) Ajello, M., Arimoto, M. & Axelsson, et al. 2019, ApJ, 878, 52
- Atwood et al. (2009) Atwood, W. B., Abdo, A. A. & Ackermann, M., et al. 2009, ApJ, 697, 1071
- Band et al. (1993) Band, D., Matteson, J., Ford, L., Schaefer., et al. 1993, ApJ, 413, 281
- Band (1997) Band, D. L. 1997, ApJ, 486, 928
- Barthelmy et al. (2018) Barthelmy, S. D., Cummings, J. R. & Krimm, H. A., et al. 2018, GCN Circ., 22998
- Bhat et al. (1994) Bhat, P. N., Fishman, G. J., Meegan, C. A., et al. 1994, ApJ, 426, 604
- Bissaldi & Racusin (2018) Bissaldi, E. and Racusin, J. L. 2018, GCN Circ., 22980
- Bloom et al. (2001) Bloom, J. S., Frail, D. A. & Sari, R. 2001, AJ, 121, 2879
- Colgate (1974) Colgate, S. A. 1974, ApJ, 187, 333
- Crider et al. (1997) Crider, A., Liang, E. P., Smith, I. A., et al. 1997, ApJ, 479, L39
- Deng & Zhang (2014) Deng, W. & Zhang, B. 2014, ApJ, 785, 112
- Dirirsa et al. (2016) Dirirsa, F., Vianello, G., Racusin, J. & Axelsson, M. 2016, GCN Circ., 19586
- Eichler et al. (1989) Eichler, D., Livio, M., Piran, T. and Schramm, D. N. 1989, Nature, 340, 126
- Fan et al. (2008) Fan, Y.-Z., Piran, T., Narayan, R. & Wei, D.-M. 2008, MNRAS, 384, 1483
- Fan & Piran (2006) Fan, Y. and Piran, T. 2006, MNRAS, 370, L24
- Fan & Piran (2008) Fan, Y.-Z. & Piran, T. 2008, \FrPhC, 3, 306
- Ford et al. (1995) Ford, L. A., Band, D. L., Matteson, J. L., et al. 1995, ApJ, 439, 307
- Gao et al. (2009) Gao, W.-H., Mao, J., Xu, D. & Fan, Y.-Z. 2009, ApJ, 706, L33
- Gehrels et al. (2004) Gehrels, N., Chincarini, G. & Giommi, P. et al. 2004, ApJ, 611, 1005
- Geng et al. (2018) Geng, J.-J., Huang, Y.-F. & Wu, X.-F. et al. 2018, ApJS, 234, 3
- Ghisellini et al. (2010) Ghisellini, G., Ghirlanda, G., Nava, L. & Celotti, A. 2010, MNRAS, 403, 926
- Golenetskii et al. (1983) Golenetskii, S. V., Mazets, E. P., Aptekar, R. L., et al. 1983, Nature, 306, 451
- Granot & Sari (2002) Granot, J. & Sari, R. 2002, ApJ, 568, 820
- He et al. (2011) He, H.-N., Wu, X.-F., Toma, K., et al. 2011, ApJ, 733, 22
- He et al. (2012) He, H.-N., Zhang, B.-B. & Wang, X.-Y., et al. 2012, ApJ, 753, 178
- Hurley et al. (1994) Hurley, K., Dingus, B. L. & Mukherjee, R., et al. 1994, Nature, 372, 652
- Kaneko et al. (2006) Kaneko, Y., Preece, R. D., Briggs, M. S., et al. 2006, ApJS, 166, 298
- Kargatis et al. (1994) Kargatis, V. E., Liang, E. P., Hurley, K. C., et al. 1994, ApJ, 422, 260
- Kumar & Barniol Duran (2009) Kumar, P. & Barniol Duran, R. 2009, MNRAS, 400, L75
- Kumar & Zhang (2015) Kumar, P. & Zhang, B. 2015, \PhR, 561, 1
- Laros et al. (1985) Laros, J. G., Evans, W. D., Fenimore, E. E., et al. 1985, ApJ, 290, 728
- Li (2018) Li, L. 2018, arXiv.org, arXiv:1810.03129
- Li et al. (2019) Li, L., Geng, J.-J. & Meng, Y.-Z., et al. 2019, arXiv.org, arXiv:1901.04925
- Liang et al. (2014) Liang, Y.-F., Zhou, B., He, H.-N., et al. 2014, ApJ, 781, 74
- Liu et al. (2014) Liu, B., Chen, W., Liang, Y.-F., et al. 2014, ApJ, 787, L6
- Lithwick & Sari (2001) Lithwick, Y. & Sari, R. 2001, ApJ, 555, 540
- Lu et al. (2012) Lu, R.-J., Wei, J.-J., Liang, E.-W., et al. 2012, ApJ, 756, 112
- MacFadyen & Woosley (1999) MacFadyen, A. I. & Woosley, S. E. 1999, ApJ, 524, 262
- Meegan et al. (1992) Meegan, C. A., Fishman, G. J. & Wilson, R. B., et al. 1992, Nature, 355, 143
- Mészáros & Rees (1994) Mészáros, P. & Rees, M. J. 1994, MNRAS, 269, L41
- Narayan et al. (1992) Narayan, R., Paczynski, B., Piran, T. 1992, ApJ, 395, L83
- Norris et al. (1986) Norris, J. P., Share, G. H., Messina, D. C., et al. 1986, ApJ, 301, 213
- Paczynski (1986) Paczynski, B. 1986, ApJ, 308, L43
- Peng et al. (2009) Peng, Z. Y., Ma, L., Zhao, X. H., et al. 2009, ApJ, 698, 417
- Roberts & Meegan (2018) Roberts, O. J. & Meegan, C. 2018, GCN Circ., 22981
- Ryde & Svensson (1999) Ryde, F. & Svensson, R. 1999, ApJ, 512, 693
- Sari et al. (1998) Sari, R., Piran, T. & Narayan, R. 1998, ApJ, 497, L17
- Siegel et al. (2018) Siegel, M. H., Burrows, D. N. & Deich, A., et al. 2018, GCN Circ., 22973
- Sonbas et al. (2013) Sonbas, E., Racusin, J. L., Kocevski, D. & McEnery, J. 2013, GCN Circ., 15640
- Takagi & Kobayashi (2005) Takagi, R. & Kobayashi, S. 2005, ApJ, 622, L25
- Uhm et al. (2018) Uhm, Z. L., Zhang, B. & Racusin, J. 2018, ApJ, 869, 100
- Vreeswijk et al. (2018) Vreeswijk, P. M., Kann, D. A. & Heintz, K. E., et al. 2018, GCN Circ., 22996
- Wang & Dai (2013) Wang, K. & Dai, Z. G. 2013, ApJ, 772, 152
- Wang et al. (2006) Wang, X.-Y., Li, Z. and Mészáros, P. 2006, ApJ, 641, L89
- Wei & Fan (2007) Wei, D.-M. & Fan, Y.-Z. 2007, Chinese J. Astron. Astrophys., 7, 509
- Woosley (1993) Woosley, S. E. 1993, ApJ, 405, 273
- Woosley & Bloom (2006) Woosley, S. E. & Bloom, J. S. 2006, ARA&A, 44, 507
- Yonetoku et al. (2010) Yonetoku, D., Murakami, T., Tsutsui, R., et al. 2010, PASJ, 62, 1495
- Yu et al. (2018) Yu, H.-F., Dereli-Bégué, H., & Ryde, F. 2018, arXiv.org, arXiv:1810.07313
- Yu et al. (2016) Yu, H.-F., Preece, R. D., Greiner, J., et al. 2016, A&A, 588, A135
- Zhang & Mészáros (2002) Zhang, B. & Mészáros, P. 2002, ApJ, 581, 1236
- Zhang et al. (2003) Zhang, B. , Kobayashi, S. & Mészáros, P., 2003, ApJ, 595, 950
- Zhang et al. (2006) Zhang, B., Fan, Y. Z. & Dyks, J., et al. 2006, ApJ, 642, 354
- Zhang & Mészáros (2004) Zhang, B. & Mészáros, P. 2004, \ijmpa, 19, 2385
- Zhu et al. (2013) Zhu, S., Racusin, J. & Kocevski, D. et al. 2013, GCN Circ., 14471
- Zou et al. (2009) Zou, Y.-C., Fan, Y.-Z. & Piran, T. 2009, MNRAS, 396, 1163