Teaching Responsible Data Science: Charting New Pedagogical Territory
Abstract.
Although numerous ethics courses are available, with many focusing specifically on technology and computer ethics, pedagogical approaches employed in these courses rely exclusively on texts rather than on software development or data analysis. Technical students often consider these courses unimportant and a distraction from the “real” material. To develop instructional materials and methodologies that are thoughtful and engaging, we must strive for balance: between texts and coding, between critique and solution, and between cutting-edge research and practical applicability. Finding such balance is particularly difficult in the nascent field of responsible data science (RDS), where we are only starting to understand how to interface between the intrinsically different methodologies of engineering and social sciences.
In this paper we recount a recent experience in developing and teaching an RDS course to graduate and advanced undergraduate students in data science. We then dive into an area that is critically important to RDS — transparency and interpretability of machine-assisted decision-making, and tie this area to the needs of emerging RDS curricula. Recounting our own experience, and leveraging literature on pedagogical methods in data science and beyond, we propose the notion of an “object-to-interpret-with”. We link this notion to “nutritional labels” — a family of interpretability tools that are gaining popularity in RDS research and practice.
With this work we aim to contribute to the nascent area of RDS education, and to inspire others in the community to come together to develop a deeper theoretical understanding of the pedagogical needs of RDS, and contribute concrete educational materials and methodologies that others can use. All course materials are publicly available at https://dataresponsibly.github.io/courses.
1. Introduction
As an emerging discipline, responsible data science (RDS) has yet to be codified as a course of study at most university campuses. Despite increasing demand, there is a lack of curricular materials that are available for adoption into university graduate programs, undergraduate majors, general education tracks, and interdisciplinary minors. The challenge is compounded by a shortage of faculty with the expertise to develop and teach RDS courses.
Although numerous ethics courses are available, with many focusing specifically on technology and computer ethics, pedagogical approaches employed in these courses rely exclusively on texts rather than on software development or data analysis. For this reason, technical students often consider these courses unimportant and a distraction from the “real” material. To develop materials and instructional methodologies that are thoughtful and engaging, and that help students gain knowledge and skills useful in their future careers, we must strive for balance: between texts and coding, between critique and solution, and between cutting-edge research and practical applicability. While finding such balance is both necessary and difficult in any educational effort, it is particularly difficult in the nascent field of RDS, where we are only just starting to understand how to interface between the intrinsically different methodologies of engineering and social sciences.
In this paper we recount a recent experience in developing and teaching an RDS course to graduate and advanced undergraduate data science students at New York University. In our description, we give specifics about both the content and the instructional style, with the hope that the course will be useful to others who are developing and teaching on this topic. To further illustrate the challenges of teaching RDS, and to propose a path forward, we dive into an area that is critically important to RDS — transparency and interpretability. Specifically, we look at interpretability of the underlying computational elements of machine-assisted decision-making, and tie those to the needs of emerging RDS curricula. Recounting our own experience, and leveraging literature on pedagogical methods in data science and beyond, we propose the notion of an “object-to-interpret-with”, which takes its inspiration from an important concept that emerged through constructivist practices — objects-to-think-with. We link this notion to “nutritional labels” — a family of interpretbility tools that are gaining popularity in RDS research and practice, and illustrate their use in project-based learning experiences.
Our paper makes the following contributions:
-
•
We are among the first to look at the pedagogical implications of responsible data science, creating explicit parallels between cutting edge data science research, and cutting edge educational research.
-
•
We developed and are teaching a unique course on responsible data science, geared primarily toward technical students. We give a detailed description of our course here.
-
•
Focusing on transparency and interpretability, we propose best practices and concrete implementable techniques for teaching this important topic, for others to use. Our proposal is based on our own teaching experience, and on insights from constructivist and inquiry-based educational practices.
With this work we aim to contribute to the nascent area of RDS education. We hope to inspire others in the community to come together to form a deeper theoretical understanding of the pedagogical needs of responsible data science, and to develop and share the much-needed concrete educational materials and methodologies, striking the right balance between research and practice.
2. Our Experience in Teaching RDS
We seek to connect emerging responsible data science (RDS) pedagogical practices with established pedagogical practices. Current theories in the learning sciences emphasize successful learning as active, collaborative, socially-constructed and situated. Activities should incorporate these tenets. There is now a representative group of technical data science programs at the graduate level, and growing offerings at the undergraduate level (Aasheim et al., 2015; Anderson et al., 2014; De Veaux et al., 2017). Institutions such as Duke, Harvard, Oxford, Stanford, University of Michigan, University of Texas, and others have recently introduced ethical data science courses, all of which approach the topic from humanistic or social science-based — cultural, legal, and/or philosophical — approaches. What is less represented and what the course that we introduce explores is ethical issues from the point of view of the technical.
We now recount a recent experience in designing and teaching an RDS course to graduate and advanced undergraduate students in data science at New York University. This technical course tackles the issues of ethics, legal compliance, data quality, algorithmic fairness and diversity, transparency of data and algorithms, privacy, and data protection. The course leverages established learning theories and best pedagogical practices, detailed in Sections 4 and 5.
2.1. Course Design
The RDS course is a semester-long course, structured as a sequence of lectures, with supplementary readings, labs, and accompanying assignments. All course materials, including the syllabus, weekly reading assignments, complete lecture slides, and lab assignments, are publicly available on the course website at https://dataresponsibly.github.io/courses. Homework assignments, with solutions and grading rubrics, and a detailed description of the course project, will be made available to instructors upon request.
The RDS course has Introduction to Data Science, or Introduction to Computer Science, or a similar course as its only a prerequisite. Machine Learning is not a prerequisite for the course. This is a deliberate choice that reflects our goals to (1) educate data science students on ethics and responsibility early in their program of study, and (2) to enroll a diverse group of students. Students are expected to have basic familiarity with the python programming language, which is used in labs and assignments.
One of the challenges we faced when designing this course was the lack of a text book that offers comprehensive coverage of responsible data science, balancing case studies, fundamental concepts and methodologies from the social sciences, and statistical and algorithmic techniques. As a result, the course does not have a required textbook. Each topic is accompanied by required reading. In some cases, expert-level technical research papers are listed as assigned reading. However, important concepts from the assigned paper are covered in class, and students are instructed on where to focus their attention while reading the papers, and which parts to skim or skip.
The course comprises six thematic modules. Each module is presented using a combination of case studies, often from the recent press, fundamental algorithmic and statistical insights, and hands-on exercises using open-source datasets and software libraries.
Module 1: Introduction and background (1 week)
Course outline, aspects of responsibility in data science through recent examples. We now describe this topic in some depth, to give the flavor of the instruction. (Other modules are described here in somewhat less depth.) Fairness and diversity are motivated by “the classics”: the 2012 Wall Street Journal piece on Staples online price discrimination (Valentino-DeVries et al., 2012), the 2015 AdFisher study of gender and job ads (Datta et al., 2015), and ProPublica’s 2016 “Machine Bias” (Angwin et al., 2016). Following a brief description of these case studies, we formalize fairness in classification, and start fixing the necessary terminology: statistical vs. structural bias, outcomes and populations, statistical parity. We then give a preview of the fairness impossibility results, to immediately dispel any belief that technology alone can mitigate fairness and diversity issues. Transparency and accountability are introduced using the 2012 racially identifying names in online ad delivery study by Latanya Sweeney (Sweeney, 2013). This study is used to start diving into the complexity and the opacity of the online ad delivery ecosystem, discussing which stakeholders may be responsible for racial bias, and which should be held accountable. Data protection is motivated by the 1979 Barrow, Alaska alcohol study, highlighting that privacy is important, but is not the only concern. We conclude the introduction with an overview of the data science lifecycle.
Lab 1 reproduces a portion of the analysis from ProPublica’s “Machine Bias” investigation (Angwin et al., 2016).
Module 2: The data science lifecycle (2 weeks)
Overview of the data science lifecycle. Data profiling and validation. Data cleaning. Building an algorithmic foundation for data profiling (Abedjan et al., 2015) and data cleaning (Chu and Ilyas, 2016) tasks using the relational model, frequent itemset and association rule mining. Making a link between data quality and representativeness, and fairness of the machine learning methods trained on that data, using the analysis from “To Predict and Serve” (Lum and Isaac, 2016).
Labs 2 and 3 give students some hands-on experience with data profiling capabilities of standard python libraries, and introduce them to a state-of-the-art data imputation library called Datawig (Biessmann et al., 2018).
Module 3: Algorithmic fairness and diversity (3 weeks)
A taxonomy of fairness definitions; individual and group fairness (Dwork et al., 2012; Friedler et al., 2016; Mitchell et al., 2018). The importance of a socio-technical perspective: stakeholders and trade-offs. Impossibility results (Chouldechova, 2017; Kleinberg et al., 2017); causal definitions (Salimi et al., 2019); fairness beyond classification and risk assessment (Yang and Stoyanovich, 2017). Diversity in data science pipelines. The Rooney rule, diversity in hiring and admissions (Stoyanovich et al., 2018). The technical meat of this module draws from recent algorithmic methods for fairness and diversity in classification, selection, and ranking, and ties back these technical approaches to philosophical and legal doctirnes, and regulatory requirements.
Labs 4, 5 and 6 continue the exploration of ProPublica’s “Machine Bias” investigation, and introduce students to IBM’s open source AIF360 toolkit.
Module 4: Transparency and interpretability (2 weeks)
Reasons for transparency and interpretability: human-in-the-loop, responsibility, trust. Auditing black-box models; explainable machine learning. Methods to generate local explanations. (Ribeiro et al., 2016) Causal influence of features with Quantitative Input Influence (Datta et al., 2016). Discrimination in online ad delivery. The AdFisher study revisited: stakeholders, responsibility, and legal ramifications (Datta et al., 2018). Ongoing efforts to regulate online ad delivery, due to potential for discrimination in housing and employment.
Module 5: Privacy and data protection (2 weeks)
Overview of responsible data sharing. Anonymization techniques and the limits of anonymization. Harms beyond re-identification. Differential privacy. Technical material includes randomized response, the fundamental theorem of data reconstruction (Dinur and Nissim, 2003), and an introduction to differential privacy (Dwork, 2011), with a discussion of the formal definition, the trade-off between privacy and utility, query sensitivity, query composition, and privacy-preserving synthetic data generation. A discussion of the Netflix de-identification attack, and of the ongoing debate about the use of differential privacy in the US Decennial Census (Mervis, 2019).
Lab 7 introduce students to secure hashing. Lab 8 gives students hands-on experience with privacy-preserving synthetic data generation, using an open-source toolkit (Ping et al., 2017).
Module 6: Legal frameworks, codes of ethics, professional responsibility (2 weeks)
Ethical principles and frameworks (using (Salganik, 2019) Chapter 6 as reading). The Belmont Report and the Menlo Report. The ACM Code of Ethics and Professional Conduct. Legal frameworks: overview of thhe General Data Protection Regulation, and of the emerging algorithmic transparency regulation in the US.
Homework assignments
The course includes four homework assignments, completed individually by the students. A homework corresponds to approximately 2 weeks of effort. All labs and most homework assignments are formulated as Jupyter notebooks, and labs serve as a starting point for completing the homeworks. While none of the homeworks are stand-alone writing assignments, writing is embedded in the homeworks. During the homeworks, students write computer programs and provide short essays on the interpretation of the data, and the implications around some decision or problem that the data informs. The course also includes one problem-based homework that focuses primarily on (breaking) anonymization and on differential privacy.
Developing homework assignments, particularly problem-based ones, constituted a significant effort during course design. For example, we were surprised to find that virtually no problem sets are available for differential privacy — a topic that is perhaps the best established among those we covered, and one that is starting to see broad practical adoption. While there are some teaching materials on differential privacy for advanced graduate students in computer science, we were unable to find any existing materials that would be suitable for beginning data science students, and for data science practitioners.
Course project
The project is completed in teams of two students, and corresponds to approximately 4 weeks of effort. The project is customized per course offering, and we describe it in more detail in the following section.
2.2. Teaching and Iterating
The RDS course was offered to data science graduate students (and advanced undegraduates) for the first time in Spring 2019, and will be offered at least once annually going forward. Additionally, we are developing an undergraduate RDS course — a program requirement of the newly-estabished data science major at the Center for Data Science at NYU, with plans to offer it at least once annually as well, starting in Spring 2021. In addition to stand-alone courses, we are incorporating RDS modules into existing computer science and data science curricula, with materials based largely on those we developed for the RDS course described here, and those we will develop in the future.
Student diversity and differentiated instruction
One of the most rewarding, but also the most challenging, aspects of teaching RDS was the diversity of the students. Students come into data science from different academic backgrounds, including computer science, mathematics, statistics, the natural sciences, social science, and law. This full diversity of backgrounds was represented in our first student cohort, with students bringing their interdiscipinary perspectives to discussions. On the other hand, this also meant that students were of different levels of technical preparation — some had more of a familiarity with algorithmic techniques, and came in with more substantial programming and data analysis experience then others did.
One focus of the next iteration will be to explore purposeful differentiated instruction, a pedagogical approach that tailors instruction (e.g., content, process, environment) to address variance in students’ prior knowledge, disciplinary knowledge, learning styles, accessibility needs, and other background characteristics (Chamberlin and Powers, 2010; George, 2005; Tomlinson, 2017).
Differentiated instruction is an inclusive approach that does not equate to diluting a course for the less experienced nor does it equate to gearing course content towards the most advanced. Rather, it involves providing flexible learning environments so that all students progress towards learning goals in a way that recognizes the diversity of the group. For example, a course with technical experts and technical novices can entail a group project where novices must take on a coding role, with advanced students serving as project leader and providing guidance to those with less experience. Students with specific disciplinary backgrounds can peer review contributions made by students with little experience. Essential to differentiated instruction is ongoing (formative) assessment so that the course dynamically meets the needs of students.
Course project
During the first offering of the course, students were directed to develop an interpretability tool for an automated decision system (ADS) of their choice, based on the concept of a nutritional label. We suggested that students develop a nutritional label for one of the systems developed in response to a Kaggle competition of their choice, but students were encouraged to look beyond Kaggle. Project deliverables included a written report, an implementation of the nutritional label in python, and a project presentation. To encourage students to critically evaluate the system they are describing, we specified the following structure for the written report:
-
(1)
Background: general information about your chosen ADS. (a) What is the purpose of this ADS? (b) What are its stated goals? (c) If the ADS has multiple goals, explain any trade-offs that these goals may introduce.
-
(2)
Input and output. (a) Describe the data used by this ADS. How was this data collected or selected? (b) For each input feature, describe its datatype, give information on missing values and on the value distribution. Show pairwise correlations between features if appropriate. (c) What is the output of the system, and how do we interpret it?
-
(3)
Implementation and validation: present your understanding of the code that implements the ADS. This code was implemented by others (as part of the Kaggle competition), not by you as part of this assignment. Your goal here is to demonstrate that you understand the implementation at a high level. (a) Describe data cleaning and any other pre-processing. (b) Give high-level information about the implementation of the system. (c) How was the ADS validated? How do we know that it meets its stated goal(s)?
-
(4)
Outcomes. (a) Analyze the effectiveness (accuracy) of the ADS by comparing its performance across different sub-populations. (b) Select one or several fairness or diversity measures, justify your choice of these measures for the ADS in question, and quantify the fairness or diversity of this ADS. (c) Develop additional methods for analyzing ADS performance: think about stability, robustness, performance on difficult or otherwise important examples, or any other property that you believe is important for this ADS.
-
(5)
Summary. (a) Do you believe that the data was appropriate for this ADS? (b) Do you believe the implementation is robust, accurate and fair / diverse / stable ? (c) Would you be comfortable deploying this ADS in the public sector, or in the industry? Why so or why not? (d) What improvements do you recommend to the data collection or analysis methodology?
All student teams delivered insightful analysis as part of their project submissions, demonstrating good command of material on algorithmic fairness, diversity, transparency, and interpretability.
Student feedback
The course was well-received by the students, who commented favorably both on the content, and on the pace. Students felt that the course was relevant to their data science goals and career objectives, and that programming assignments were consistent with the content of the lectures. Free-text comments included primarily praise, along with critical feedback. Most notably, several students requested to expand the coverage of transparency and explainable models.
One of the students summarized his experience as follows:
In both my academic education and professional experience, I always sensed the need to make a deep dive on the topics we discussed in class. I’ve never really felt “at ease” when working with data to making decisions that impact other people’s lives, […]. I tried many times in my early career to explain that deciding whether to use the mean or the median (or other quantiles) for setting an insurance rate is an ethical decision. Unfortunately, many believe that data and algorithms are the fairer way to assess things and drive decision because of their alleged objectivity. In reality, I think that many hide behind data, statistics, and science as a “safe” way to avoid the hard work to take an ethical stance.
Your class gave me structure, knowledge, and tools on how to go about these topics more credibility when discussing these issues with others and put decisions into actions. I am now thinking about ways to expand from what I learned in class, and eventually to put together a set of demos to better narrate these topics to non-technical audiences. I will keep you posted on how this goes!
Several students suggested to expand on algorithmic transparency because “… it’s a really interesting topic that is useful for both fairness and actually building better models.” The next iteration will include targeted assessments that gauge students’ prior knowledge, suitability for group work, and improved mapping to other courses that feed into the course or would be taken afterwards. In the remainder of this paper, we focus on transparency and interpretability, giving some socio-technical background (in Section 3), and then treating these topics through the lens of data science education (in Sections 4 and 5).
3. Transparency and Interpretability
An essential ingredient of successful machine-assisted decision-making, particularly in high-stakes decisions, is interpretability — allowing humans to understand, trust and, if necessary, contest, the computational process and its outcomes. These decision-making processes are typically complex: carried out in multiple steps, employing models with many hidden assumptions, and relying on datasets that are often repurposed — used outside of the original context for which they were intended.111See Section 1.4 of Salganik’s “Bit by Bit” (Salganik, 2019) for a discussion of data repurposing in the Digital Age, which he aptly describes as “mixing readymades with custommades.” In response, humans need to be able to determine the “fitness for use” of a given model or dataset, and to assess the methodology that was used to produce it.
In the remainder of this section, we review the state of the art in transparency and interpretability, providing a foundation for these concepts from the point of view of the discipline of responsible data science (RDS). This foundation is necessary to inform Section 5, where we propose a methodology for teaching these topics. This foundation also highlights the need for a balance between the technical consumption of machine learning models, built on accuracy and other performance metrics, and the contextual understanding of models, built on an interdisciplinary understanding of how the model behaves.
In our discussion, we make a distinction between model transparency and data transparency that somewhat mirrors the data science lifecycle. Much of current research on transparency and interpretability in machine learning has focused on the last mile of data analysis — on model training and deployment. The discourse on model transparency, discussed in Section 3.1, pertains primarily to these lifecycle stages. Several lines of recent work argue that critical opportunities for improving data quality and representativeness, controlling for bias, and allowing humans to oversee and influence the process are missed if we do not consider earlier lifecyle stages (Kirkpatrick, 2017; Lehr and Ohm, 2017; Stoyanovich et al., 2017). In particular, Lehr and Ohm (Lehr and Ohm, 2017) underscore the need to interrogate data selection, collection, cleaning, and other kinds of preprocessing — stages to which they refer as “Playing with data.” The discourse on data transparency, described in Section 3.2, pertains to these lifecycle stages. We reconcile the notions of model and data transparency in Section 3.3, where we discuss a unifying approach based on the concept of a nutritional label.
3.1. Model Transparency and Interpretability
Transparency and interpretability are central to the critical study of the underlying computational elements of machine learning platforms, and can allow for a host of addressable questions (Diakopoulos, 2016; Goodfellow et al., 2015). Keeping dataset creation and preprocessing decisions in mind, how is data transformed once accessible to the platform? Which features of the input most affect the algorithm’s outputs? Who has access to the underlying model? Can stakeholders understand what a model means? Scholars from humanistic, social science, and scientific backgrounds voice the importance of introducing ethical and human-centered approaches when thinking about transparency and interpretability (Gilpin et al., 2018; Goodman and Flaxman, 2017; Lage et al., 2018; Leonelli, 2016; Markham et al., 2018).
Importantly, several scholars note a long history of conflating interpretability and explainability, and the distinction is important since “measurable data [associated with interpretability and prediction] are not accurate representations of their underlying constructs [associated with explainability]” (Shmueli, 2010, p. 293). Interpretability refers to the ability in which a cause and effect can be observed within a system, or how much one is able to predict what is going to happen, particularly in the context of specific inputs or parameters (Carmichael and Marron, 2018; Doshi-Velez and Kim, 2017; Guidotti et al., 2018; Lou et al., 2012). One can clearly intuit what the model is doing by seeing a clear and consistent relationship between the set of features and model specifications, and the resulting metric. In contrast, explainability is the extent to which the internal mechanics of an algorithmic system can be communicated to people. Of course we have a host of audiences implied which complicates explainability - a model may be explainable, but to whom?
For a system to be interpretable, one must comprehend what the model did in that context, and is primarily an empirical exercise in gauging the appropriateness of the predictive model and the resulting prediction. One can comprehend a predictive metric and intuit the overall mechanics of the system without understanding why the system has produced the metric. For a system to be explainable, a person has to explain what is happening and this done at the construct level. For Gilpin and colleagues, “interpretability alone is insufficient. In order for humans to trust black-box methods, we need explainability – models that are able to summarize the reasons for neural network behavior, gain the trust of users, or produce insights about the causes of their decisions. While interpretability is a substantial first step, these mechanisms need to also be complete, with the capacity to defend their actions, provide relevant responses to questions, and be audited … Explainable models are interpretable by default, but the reverse is not always true (Gilpin et al., 2018, p. 1).
To achieve causal and other scientific explainability, an understanding of the holistic set of interpretations, formalisms, and predictions is required (Shmueli, 2010, Sweeney, 2017). Lipton (2017) introduces granular and holistic variations in his notion of interpretability, which touch on the subtle differences between explainability and interpretability, even if:
-
(1)
Simulatability occurs when one can understand the model as a whole. A simple decision tree is understandable since it “can be readily presented to the user with visual or textual artifacts” (Ribeiro et al., 2016). This model is in contrast with, for example, a complex neural network model, where there are many implicit rules and dependencies, making it difficult to achieve a holistic interpretation of the model.
-
(2)
Decomposability happens when “each input, parameter, and calculation [of a model] admits an intuitive explanation” (Lipton, 2016, p. 5). Specifying the audience and purpose of interpretability is essential, as is articulating the desired balance between model performance and model interpretability (Breiman, 2001; Gleicher, 2016).
Achieving both lines of interpretability can be important to address trust, legality, and other desirable aspects (Luban et al., 1992). In addition to Lipton (Lipton, 2016), other scholars have highlighted the lack of a universal definition and purpose of interpretability in the context of machine learning (Carmichael and Marron, 2018; Doshi-Velez and Kim, 2017; Lou et al., 2012). We take interpretability to generally mean a person’s or group’s ability to understand a model — for example, to describe what the inputs are, how the algorithms operate, how outputs are framed, and even how to articulate the model’s reuse over time and contexts. Specifying the audience and purpose of interpretability is essential, as is articulating the desired balance between model performance and model interpretability (Breiman, 2001; Gleicher, 2016). For Guidotti et al. (Guidotti et al., 2018), an interpretable model is one that demonstrates accuracy and fidelity, as well as allows for human interpretability.
Selbst and Barocas (Selbst and Barocas, 2018) add to the interpretability/explainability debate, incorporating legal, technical, and philosophical discussions. If linearity, monotoneity, continuity, and dimensionality are the four qualities that drive model complexity, then the concepts of inscrutability and non-intuitiveness are the two primary interpretability focal points upon which we should concentrate. For the authors, inscrutability equates to Lipton’s definition of simulatability; unintuitiveness refers to a lack of instinctual understanding of the underlying statistical relationships at play, even if those relationships have been explicitly revealed.
We take interpretability to generally mean a person’s or group’s ability to understand a model – for example, to describe what the inputs and algorithms are, how the algorithms operate, how outputs are framed, and even how to articulate the model’s reuse over time and contexts. Specifying the audience and purpose of interpretability is essential, as is articulating the desired balance between model performance and model interpretability (Breiman 2001; Gleicher 2016).
Another consideration in achieving interpretability is the intended audience. The most substantive publications around transparency and interpretability are geared towards technical audiences and offer varying levels of accessibility for non-technical groups (Ananny and Crawford, 2016; Datta et al., 2016; Dwork, 2011; Kim et al., 2015; Lage et al., 2018; Ribeiro et al., 2016). Publications geared towards the wider public generally fall under data journalism (Broussard, 2018; Mervis, 2019; O’Neil, 2016). Gillborn, Warmington and Demack (Gillborn et al., 2017), in the context of critical data studies, highlight the hidden assumptions that characterize algorithms, platforms, and intended audiences. Establishing interpretable model insights for a technical audience is fairly straightforward, but there is a host of challenges to consider when aiming for interpretability for lay audiences, including audience expectations, relevance of the algorithm or platform, and audience preparedness. Based on articles that call for machine learning interpretability, authors assume that the public will:
-
•
expect relevant and useful data to be made available;
-
•
have the time, resources, and expertise to access the data and then analyze it; and
-
•
will alter behavior if the data reveals poor equality results.
These assumptions, while noble, are often presumptuous, and can lead to specific design decisions that may in turn not lead to widespread understanding of complex concepts. For simplicity, and based our teaching experience, we focus on a population whose technical sophistication and interest in real-world problem solving lies in the middle — students of data science. Targeting this audience connects to established ways in which people learn about a complex topic — what they are able to find interpretable — while pinpointing generalizable aspects that hold potential for the wider public.
3.2. Data Transparency and Interpretability
In a recent essay, Stoyanovich and Howe argue that data transparency is an essential component of algorithmic transparency (Stoyanovich and Howe, 2018a). We recount these arguments here.
In applications involving predictive analytics, data is used to customize generic algorithms for specific situations — algorithms are trained using data. The same algorithm may exhibit radically different behavior — make different predictions; make a different number of mistakes, and even different kinds of mistakes — when trained on two different datasets. In other words, without access to the training data, it is impossible to know how an algorithm would actually behave.
Algorithms and corresponding training data are used, for example, in predictive policing applications to target areas or people that are deemed to be high-risk. But as has been shown extensively, when the data used to train these algorithms reflects the systemic historical bias towards poor and predominately African American neighborhoods, the predictions will simply reinforce the status quo rather than provide any new insight into crime patterns. The transparency of the algorithm is insufficient to understand and counteract these particular errors. Rather, the conditions under which the data was collected, the data processing methodology, and the resulting composition of the training dataset must be retained and made available to make the decision-making process transparent.
Even those decision-making applications that do not explicitly attempt to predict future behavior based on past behavior are still heavily influenced by the properties of the underlying data. For example, the VI-SPDAT (Homelessness, [n. d.]) risk assessment tool, used to prioritize homeless individuals for receiving services, does not involve machine learning, but still assigns a risk score based on survey responses — a score that cannot be interpreted without understanding the conditions under which the data was collected. As another example, matchmaking methods such as those used by the Department of Education to assign children to spots in public schools are designed and validated using datasets; if these datasets are not made available, the matchmaking method itself cannot be considered transparent.
Data transparency is important both when an automated decision system is interrogated for systematic bias and discrimination, and when it is asked to explain an algorithmic decision that affects an individual. An immediate, and often impractical, interpretation of data transparency is making the training and validation datasets publicly available. However, while data should be made open whenever possible, much of it is sensitive and cannot be shared directly. That is, data transparency is in tension with the privacy of individuals who are included in the dataset. In light of this, an alternative interpretation of data transparency is as follows:
-
•
In addition to releasing training and validation datasets whenever possible, summaries of relevant statistical properties of the sensitive datasets can be made available, to aid in interpreting the decisions made using the data, while applying state-of-the-art methods to preserve individuals’ privacy.
-
•
When appropriate, privacy-preserving synthetic datasets can be released in lieu of real datasets to expose certain features of the data, if real datasets are sensitive and cannot be released to the public.
An example of a data transparency approach is the Datasheets for Datasets project (Gebru et al., 2018) that advocates for a standardized process for documenting datasets. Specifically, the authors propose that every dataset be accompanied with a datasheet that documents its motivation, composition, collection process, and recommended uses. The goal is to facilitate better communication between dataset creators and dataset consumers, and to encourage transparency and accountability in data use. Notably, the database and cyberinfrastructure communities have been studying systems and standards for metadata, provenance, and transparency for decades (op, [n. d.]; Moreau et al., 2008). These concepts are now seeing renewed interest in the context of transparency and interpretability.
3.3. Nutritional Labels for Data and Models
A novel approach to interpretability is the nutritional label. The most famous nutritional label, the Nutrition Facts panel, began appearing on all packaged foods after the passage of the Nutrition Labeling and Education Act of 1990 (Administration, 1994). This panel and its antecedents evolved over time. Initial versions had the purpose of protecting the public from deceptive and dangerous information about food products, while the current version is geared towards empowering the public to make informed decisions over their nutritional habits.
Appropriating the nutritional label paradigm for machine learning is a logical one, both for communication purposes and for learning purposes. For engaging the general public, it appropriates a familiar visual artifact to communicate highly technical and opaque information. For facilitating the learning of data science concepts, it requires students to actively and iteratively come to understand hidden algorithms, distill the most important information about a model, and adapt that knowledge for non-technical audiences. Nutritional labels synthesize information about machine learning models into a visually compact format; as a result, they obscure the more complex aspects of a model in the service of visual economy. The nutritional label is not the singular, correct way to communicate the model to diverse audiences since it does not make a model definitively interpretable. The format does, however, combine textual explanations and graphic information, representing a best practice of dual learning theory appropriate for learners (Council, 2000). Research supports this pedagogical advantage, demonstrating that nutritional labels, particularly those that have interactive functionality, can increase one’s understanding of a complex topic and lead to better decision making (Byrd-Bredbenner et al., 2009; Gunaratne and Nov, 2017; Kelley et al., 2010). The nutritional model as a paradigm creates an entry point at which one can engage and start to question the interpretability of a model. In analyzing or creating a label while working at the technical level of the model, one is faced with the ways in which creating a singular, understandable presentation that works in all cases and for all audiences is in fact impossible. There is a utility in creating an artifact that signals certain problematic aspects of the model, particularly for learners with more technical sophistication.
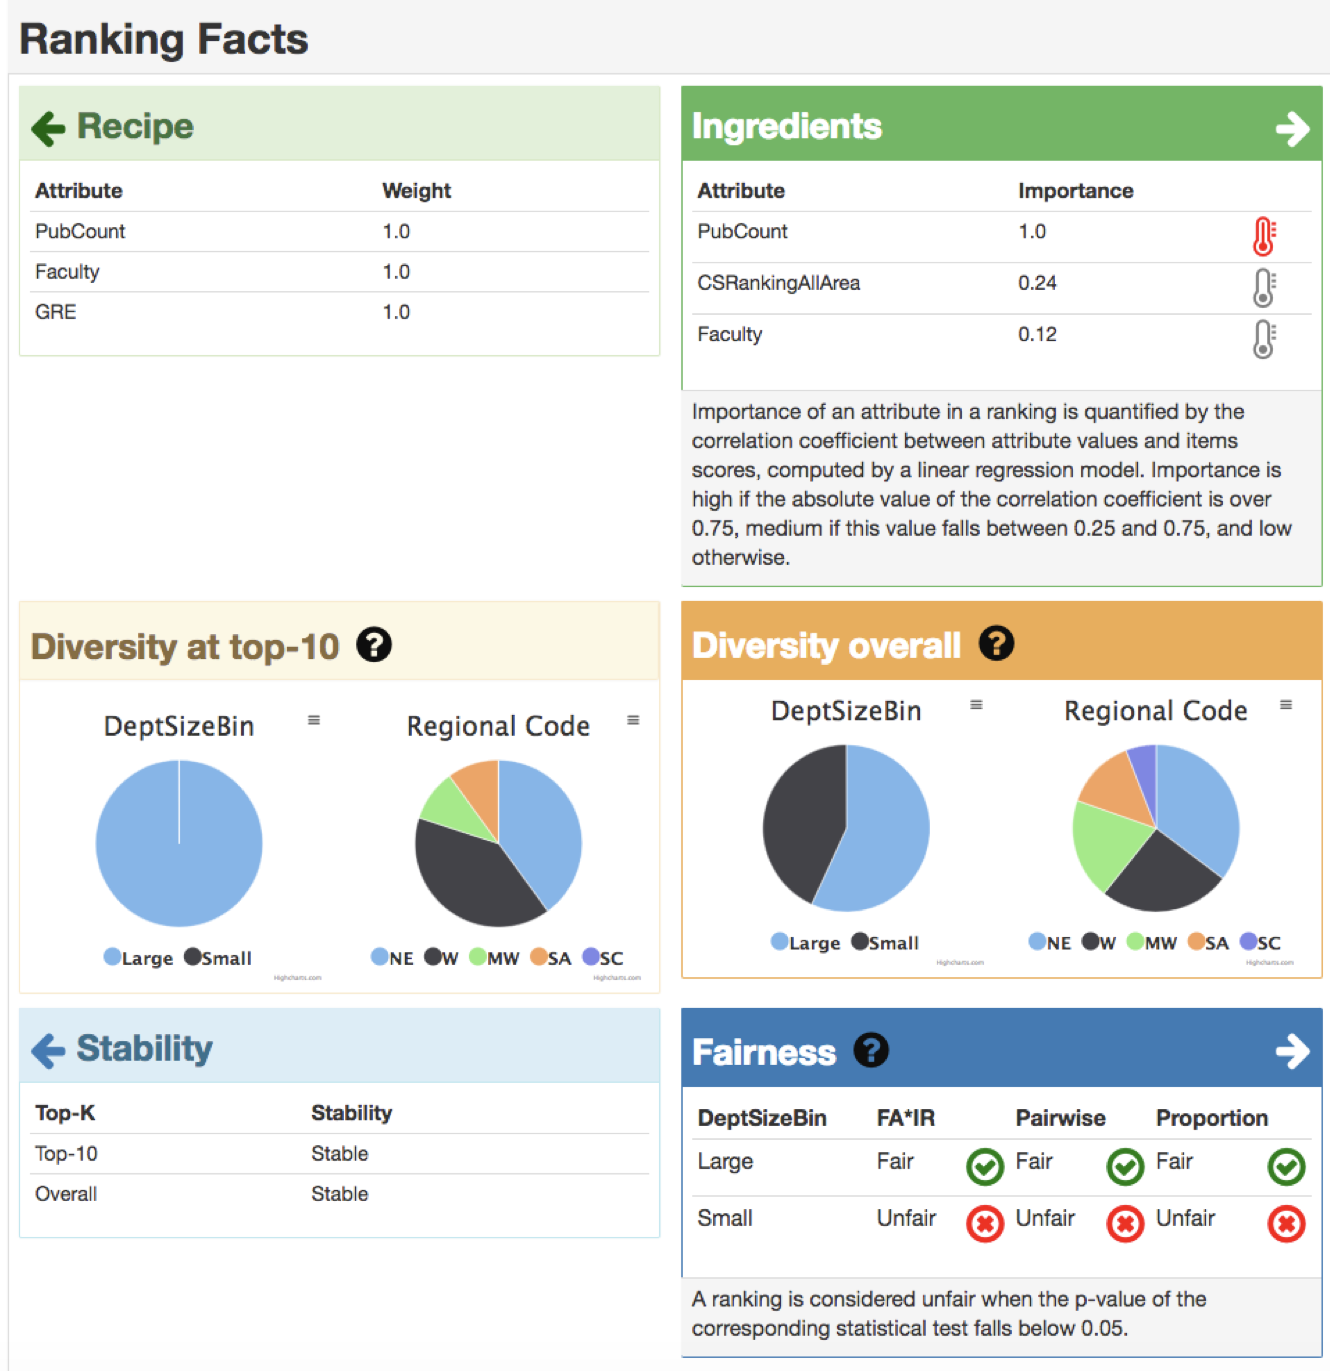
Two sets of scholars have explored the use of the nutritional label in data science. Ranking Facts is an application that reveals in a user-friendly way stability, statistical parity, and diversity measures associated with ranking algorithms (Yang et al., 2018; Stoyanovich and Goodman, 2016; Stoyanovich and Howe, 2018b). The assumption is that items placed in top ranks are of a higher quality than items placed lower down the ranked list (e.g., item in rank 1 is of higher quality than item in rank 150). This simple schema implies a high level of interpretability, though Ranking Facts reveals that rankings may be highly sensitive to inputs and can hide disparate impacts on subsets of data. Revealing this information as a visual gives a deeper understanding of the underlying algorithm, and puts any particular set of rankings into greater context. As seen in Figure 1, Ranking Facts assists a lay audience in achieving simulatability (Ribeiro et al., 2016), model intuitiveness, and a level of transparency around the topics of fairness, diversity, and stability. The Fairness pane supports an intuitive understanding of whether or not the model exhibits statistical parity without requiring knowledge of the term’s mathematical properties. Likewise, the Diversity pane signals how well the model represents categories.
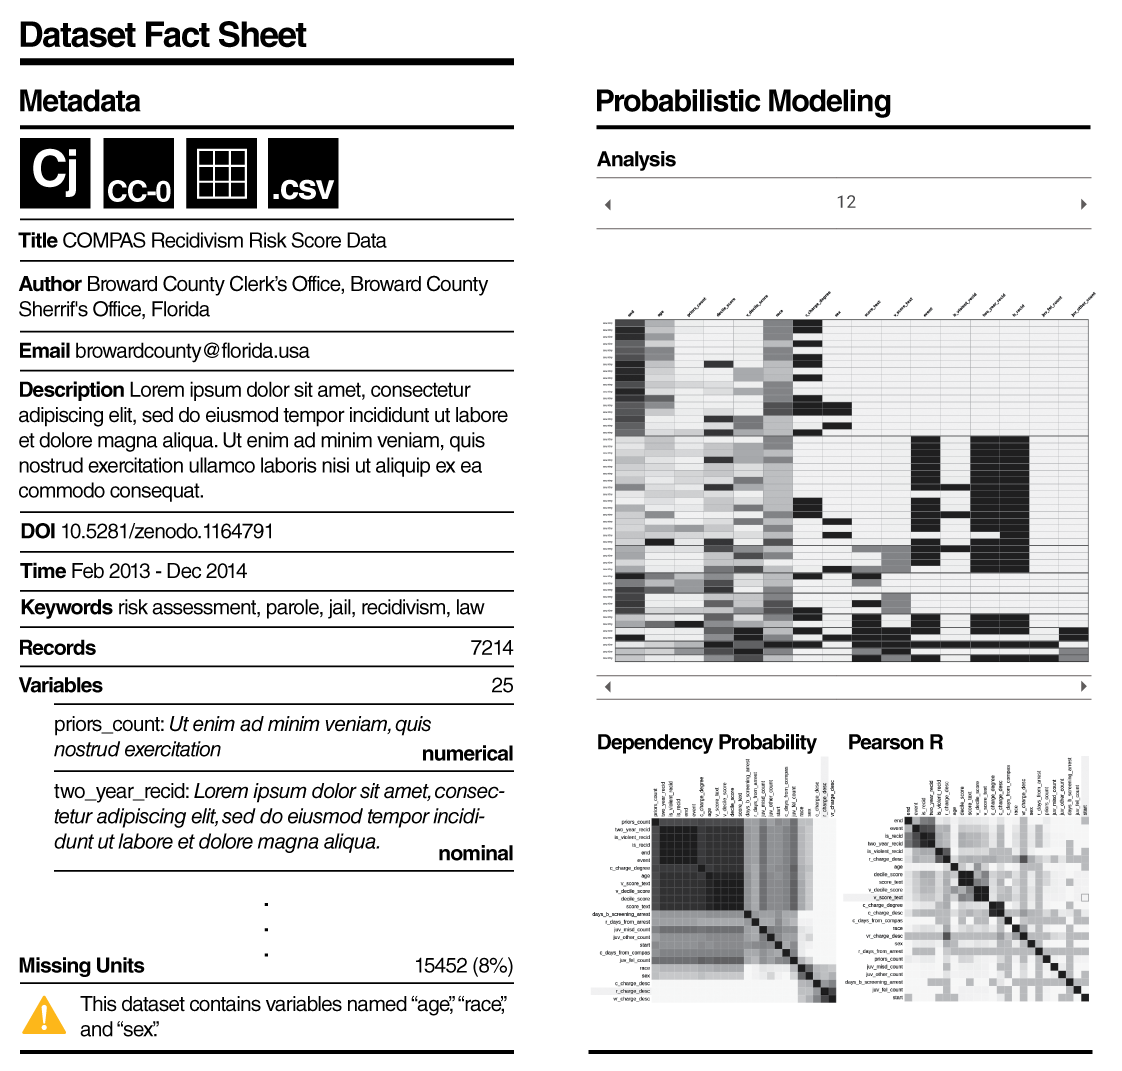
A second team (Holland et al., 2018) also used the nutritional label as an appropriate tool to think about algorithmic transparency. The team developed a framework, the Dataset Nutrition Label, which provides modules that display metadata and source information, textual descriptions and summary statistics of variables, as well as graphs visualizing more complicated information like probabilistic models and ground truth correlations. The Metadata panel summarizes relevant dataset information while the Modeling pane provides model-specific information about performance and accuracy. Other panels go into detail about dataset authorship, model variables and ground truth correlations. The Dataset Nutrition Label contributes largely to transparency by taking a descriptive snapshot of a dataset’s inherent qualities (i.e. number of records and variables) and introducing some interpretable features (i.e. keywords). The Probabilistic Modeling pane requires knowledge of a model’s properties, though a highly visual presentation facilitates understanding.
4. Data Science Education: Charting new pedagogical territory
There is a dearth of scholarship around data science education proper, since most formal academic programs have sprouted up only over the past 5 years or so. Though data science education is still maturing, recent curricular guidelines have been developed (De Veaux et al., 2017) that emphasize theoretical and applied mathematical and computational knowledge. This is exemplified in a report from one of the rare long-term undergraduate data science programs. The program, which includes computer science and mathematics courses, as well as three data science-specific courses: introductory data science, dataset organization and management, and a capstone course (Anderson et al., 2014). A novel aspect to this program is the required completion of a cognate, which is a set of discipline-specific courses that support interdisciplinary applications of data science knowledge. The guidelines also emphasize the integration of communication, reproducibility, and ethics into data science curricula. “Programs in data science should feature exposure to and ethical training in areas such as citation and data ownership, security and sensitivity of data, consequences and privacy concerns of data analysis, and the professionalism of transparency and reproducibility” (Anderson et al., 2014, p. 22). RDS education is rare, particularly as a degree requirement.
Scholars have noted that data science education blends statistics and computer science pedagogical principles, but that there remains a lack of integration between theoretical principles and real world applications (Farahi and Stroud, 2018). Additionally, the interdisciplinary nature of data science necessitates a new kind of pedagogy, one that not only requires robust technical, theoretical, and practical STEM-based training, but also a humanist sensibility that highlights ethical concerns and communication challenges. We can, however, examine pedagogical scholarship that exists in computer science and statistics education to make logical claims about how students learn about data science, and develop best practices.
4.1. General Overview
As in other STEM fields, constructivism and inquiry-based learning are the reigning pedagogical paradigms (diSessa et al., 1988; Council, 2000; Turkle and Papert, 1992). Constructivism emphasizes the learning process as active, iterative, applied, and student-centered; similarly, inquiry-based learning makes the student an autonomous seeker of their own knowledge, involved as much in the question formation (what do I want to know?) as in the answer formation (what do I know and how?).
Students learn computer science concepts through hands-on programming, connecting theory through applied activities and ongoing inquiry (Ben-Ari, 2001). Efforts also have been made to visualize, and to have students visualize, the mechanisms by which known algorithms operate (Hundhausen and Douglas, 2000; Sriadhi et al., 2018). Empirical evidence from experimental design trials supports the fact that these graphics do support learning outcomes, but only if they maximize learner engagement (i.e., they allow for interactivity like algorithm building) (Hundhausen et al., 2002; Naps et al., 2002). In statistics education, one focus has been on offering a holistic view of the data analysis process, compelling students to think about the creation of data as equally important as result significance (Hilliam and Calvert, 2019). Another focus is on the importance of effectively-generated visualizations to communicate statistical concepts (Garfield and Ben-Zvi, 2007; Nolan and Perrett, 2016; Tufte, 2001; Tukey, 1977). Variability rather than inference, for example, is a concept that is more readily understandable through visual representation (Rubin et al., 2006).
The urgency of introducing ethical and social considerations into data science curricula cannot be overstated, particularly with current reports of the ways in which organizations have transgressed privacy and other laws with the help of data science. Both the Association of Computing Machinery (for Computing Machinery, 2018) and the American Statistical Association (Committee, 2016) have issued official guidelines with respect to ethics and ethical conduct for practitioners. There is established cross-disciplinary research on ethical reasoning (boyd, 2010; Knapp, 2016; Leonelli, 2016), with specific recommendations for pedagogy and training that emphasize case studies, field practice, and sensemaking frameworks (Mumford et al., 2008; Sternberg, 2010). In their discussion on teaching ethical computing, Huff and Martin (Huff and Martin, 1995) summarize a framework for introducing ethical analysis that incorporate levels of social analysis (individual through global), responsibility, privacy, reliability, equity, and other related topics. In terms of pedagogy, they make an important recommendation of “incorporation of ethical and social issues in the lab work associated with such standard computer science subjects as database design, human-computer interaction, operating systems, and algorithms” (Huff and Martin, 1995, p. 83) (83). Tractenberg and colleagues (Tractenberg et al., 2015) offer guidelines on introducing ethical reasoning into data science training, and detail two syllabi that have students reflecting on ethical misconduct, societal impacts, privacy and confidentiality considerations, and responsible research practices, though evaluation hinges on written assignments and class discussion only. There do exist courses that could be categorized as RDS courses, though they focus on ethical data science from a humanistic rather than technical perspective. There also exist highly technical courses that touch on RDS topics, though not comprehensively (Friedman and Winograd, 1990; University, 2019; Martin and Holz, 1992; Quinn, 2006). The course that we discuss in this paper is unique in that it centralizes RDS topics in a highly technical data science course.
4.2. Objects-to-interpret-with: Teaching for and Evaluating the Understanding of Data and Complex Models
Here we introduce our notion of students having objects-to-interpret-with, which takes its inspiration from an important concept that emerges through constructivist practices — objects-to-think-with (Papert, 1980). These objects are representations that help students grapple with universal concepts and “understand how ideas get formed and transformed when expressed through different media, when actualized in particular contexts, when worked out by individual minds” (Ackermann, 2001). Our objects of focus likewise assist students in forming heuristic knowledge and understanding contextual knowledge, but specifically target metacognition surrounding ways of interpretation and representation.
Objects-to-interpret-with also stem from Latour’s claim that artifacts that aid in interpretation do so by helping us “understand how the mobilization and mustering of new resources is achieved” (Latour, 1986, p. 6). These objects are never neutral, and elicits the user as a co-creator of knowledge (Gitelman and Jackson, 2013). The best public-facing systems adopt a prosumption view that “enables governing knowledge to appear as the product of co-creation rather than an expert technical and methodological accomplishment. It appears to normalize, neutralize and depoliticize statistical analysis” (Williamson, 2016, p. 133). This more theoretical framing is important because it grounds the object-to-interpret-with as a tool to reveal the partiality and latent mechanisms of underlying algorithms, platforms that run such algorithms, and unforeseeable results that happen when certain datasets interact with machine learning algorithms and platforms.
Objects-to-interpret-with allow us to articulate exactly what students learning to interpret complex machine learning models should know. Lipton (Lipton, 2016), and Selbst and Barocas (Selbst and Barocas, 2018) detail the following technical ways to promote interpretability. Exposure to these maps to different types of knowledge in instructional objectives:
-
•
Engineering algorithmic transparency so that the system reveals how sets of inputs lead to certain outputs, and that there is consistency regardless of the diversity in inputs. For example, one can make explicit feature choices or parameters, or incorporate regularization;
-
•
Developing posthoc methods for models that are very complex and/or remain opaque due to business necessity reasons. These methods allow users to understand model outputs and potentially glean information about how different combinations of inputs yield different results without having low-level access to model specifics;
-
•
Creating interactive platforms that allow users to develop their own understanding about model functioning through consistent manipulation of parameters, inputs, and independent variables.
Interacting with systems engineered for algorithmic transparency supports the development of procedural and strategic knowledge, since it simplifies and makes explicit the process of transforming inputs into outputs, and supports the understanding of the model as general method. Working with posthoc methods develops conceptual thinking, focusing on the model as a schema with multiple interpretations. Experimenting with interactive platforms develops metacognitive thinking and heuristic knowledge, where students implicitly build beliefs about their own learning.
For data science students, the focus is not necessarily on building algorithms, but rather on iterative question formulation and transforming vague goals into measurable parameters (Passi and Barocas, 2019). Objects-to-interpret-with promote making sense of ill-defined information and indefinite meanings to achieve deeper learning. In order for interpretability to occur, a deeper than normal understanding of how inputs lead to outputs is required, and the aforementioned approaches provide more or less of a scaffolding, depending on the sophistication of the student. Additionally, there is a collaborative, constructivist nature to learning (Wenger, 1998). When teaching complex machine learning models to data science students, particularly with a focus on fairness and transparency, it is beneficial to provide diverse presentations to facilitate the development of heuristics, accommodate diverse learning styles, and acknowledge the motley nature of the information being imparted. There are substantive interpretability learning opportunities found in examining isolated elements (e.g., parameters, variables, nature of inputted data, and algorithms) and holistic models. Lipton (Lipton, 2016) details the following modes of presentation that facilitate learning interpretation:
-
•
Text explanations: best for metadata and overall contextualization.
-
•
Visualization: best for highlighting individual elements of a model.
-
•
Local explanations: best for black box models; Identifies “an interpretable model over the interpretable representation that is locally faithful to the classifier” (Ribeiro et al., 2016, p. 3).
- •
This list maps to pedagogical best practices that deliver learners information in ways that maximize understanding since it (1) presents information multimodally (visually, text-bases, and through case studies), (2) provides opportunities for active learning, and (3) develops metacognition. Additionally, the presentation of complex machine learning models provide opportunities for explicit and implicit assessment.
5. Data Science Education: Practical Considerations for Teaching RDS
There remains a dearth of resources and pedagogical methodologies for data science education, particularly for teaching RDS. Section 2 details an RDS course that balances the need for students to engage with topics including data protection, fairness, and transparency from both a technical and an interdisciplinary perspective. Course activities integrate collaborative and inquiry-based learning, allowing students to broadened their technical and domain knowledge by interacting with peers of varying expertise and backgrounds.
5.1. Pedagogical Best Practices for Teaching Interpretability
When thinking about teaching students about transparency and interpretability of data and models, it is important that activities should incorporate an understanding of how to optimize learning with a need to develop students’ technical know-how and impart an ethical and contextual understanding. In 2016, the Park City Mathematics Institute issued recommended guidelines for data science education (De Veaux et al., 2017). In addition to promoting requisite theoretical and technical knowledge and skills, the group highlights as a principle, ”Knowledge transference”, which includes communication, as well as ethics and reproducibility. ”Programs in data science should feature exposure to and ethical training in areas such as citation and data ownership, security and sensitivity of data, consequences and privacy concerns of data analysis, and the professionalism of transparency and reproducibility” (De Veaux et al., 2017, p. 2.8). No specific guidance is offered on how these terms may be defined and/or introduced in a data science context, and below we outline concrete ways to integrate these concepts with technical training, pedagogical best practices, and ethical grounding in mind.
Courses should naturally incorporate the standard data science process, including business and problem understanding, data preparation and munging, modeling, evaluating, and deployment (Provost and Fawcett, 2013). Passi and Barocas conducted an ethnographic study of how professional data scientists complete the iterative data science process in situ (Passi and Barocas, 2019). In this study, they focus on problem formulation, “as much an outcome of our data and methods as of our goals and objectives,” as a metaphor for the larger data mining process that has constantly mutable and latent aspects, which must be reconciled to achieve some result. Students will develop a sense of the sometimes amorphous nature of doing data science in real-world situations.
We should build interdisciplinary frameworks for understanding transparency, interpretability, and other relevant concepts. Critical data studies reveals that platforms, as well as the inputs and algorithms of said platforms, are as much socially constructed as any other cultural artifact. There is a growing recognition that, even though machine learning systems may have been created through business-minded, technology-focus perspectives, legal, philosophical, and socio-cultural critical perspectives are requisite considerations. Emerging subfields like critical data studies, ethical artificial intelligence, and RDS represent this line of thinking. Infusing these perspectives into data science curricula should be a standard.
There is also a need to leverage into coursework real-world platforms that offer distinct definitions of transparency and interpretability. Distinct versions of transparency and limits of interpretability are revealed through broad exposure to different types of platforms.
| Activity | Description | Assessment method |
|---|---|---|
| Replicate an existing study | Students reconstruct a (portion of a) published study and highlight any replication issues | Metrics evaluation: Evaluation of quantitative scores. Content analysis: of replication issues discussion. |
| Reverse outline/engineer a platform | Students outline a machine learning platform to understand relationships between inputs and outputs. | Open coding: A process stemming from HCI research in which students will explicitly label processes related to the platform. |
| Diagnostic learning logs | A meta activity where students outline points of understanding and confusion about machine learning concepts. | Points of confusion: student outlines points of confusion at designated moments throughout a process. |
| Problem recognition tasks | Students are presented with a set of data science problems and an array of algorithmic transparency platforms and work to identify the best procedure to address the problem. | Controlled experiment: different groups are given different platforms with which to explore an identical question. Comparisons and debriefs reveal differences in transparency and interpretability. |
| Process analysis | Students reflect on their process of a deliverable in a meta-reflective exercise. | Cognitive walkthroughs: form of self report where student outlines decisions made to produce label. |
| Peer review | Students evaluate other students’ performance on an activity. | Surveys: Quick method for assessing students’ self perceptions about a task or prior knowledge. Rubric creation: Groups of students formulate the assessment parameters for their peers. |
| Before-After | Students iterate on a task, for example, tweaking a particular parameter or variable. | A/B Testing: of model performance and interpretability. |
| Design and deploy | Students work in groups to deploy a system, potentially using the design sprint technique. | Rapid ethnography: a technique that records behavior as students work together. |
| Create a nutritional label for a machine learning platform | This is a combination of a documented problem solution, where students’ understanding emerges implicitly through process-based explanations, and a focus on varying aspects. | Content analysis: rubric based analysis of student-produced deliverable. (Schraagen et al., 2000) Cognitive walkthroughs: form of self report where student outlines decisions made to produce label. |
Activities should be offered through multiple presentation modes and levels of interactivity to maximize engagement and promote heuristics development (Wierse and Grinstein, 2002). Current learning science theories map these aspects as key to deeper learning that goes beyond the more superficial knowledge of novices (i.e., remembering, understanding, and applying) and approaches the more complex cognitive processes required of expert knowledge (i.e., evaluation, metacognition, and creation) (Mayer, 2010; Council, 2000).
We should offer students opportunities for documentation as explanation and proper evaluation. “Careful validation … is not enough. Normatively evaluating decision-making requires, at least, an understanding of: (1) the values and constraints that shape the conceptualization of the problem, (2) how these values and constraints inform the development of machine learning models and are ultimately reflected in them, and (3) how the output of models inform final decisions” (Selbst and Barocas, 2018, p. 1130). There exists a range of activities that support metacognition, the act of thinking about one’s thinking, that will assist students in thinking more holistically about how models perform and how we assess this performance. Documenting acceptable metrics like F- and AUC scores as valid indicators of the technical performance of a model, but noting that these metrics do not necessarily assist in evaluating fairness and transparency. Activities that compel students to contemplate their own thinking become rich opportunities to expose assumptions and knowledge gaps in the way that we evaluate the data science process.
Importantly, we should layer in assessment, both quantitatively and qualitatively, and both formatively and summatively (Angelo and Cross, 1993; Lazar et al., 2010). Assessing how well students achieve model performance and model interpretability is challenging, given the tension between the two goals. The former is metrics-based and therefore quantitatively assessable, while the latter requires a mix of quantitative and qualitative methods to assess whether or not students can interpret a model or find it transparent.
5.2. Pedagogical Activities for Teaching Interpretability
Pedagogical best practices should inform the development of learning goals, which in turn are used to develop specific activities. Goals can focus on developing skills-building, problem formulation and solving, descriptive and procedural knowledge, heuristics, and more esoteric concepts like metacognition, cooperation, and creativity. Lang focuses on broad categories that lead to activities that support a range of students in building knowledge, understanding critically, and motivating their own learning. For learning within technical domains, these categories are supported through activities like worked examples, exposure to common and unusual problems, in-class group problem solving, explicit teaching of models, interaction with simulations, and reflection (Aleven and Koedinger, 2002; Baker et al., 2016; Ben-Ari, 2001; Dweck, 1986). If we focus more pointedly on learning RDS topics, we need additional pedagogical techniques.
Table 1 showcases several pedagogically-sound activities that work well for teaching students interpretability. These activities are suitable for diverse groups, for example, (1) those of varying technical and theoretical prior knowledge, (2) those from varied disciplinary backgrounds, and (3) those with different learning preferences. These activities, in combination, also support the development of an individual student’s knowledge transitioning from novice to expert level.
The RDS course described in Section 2 incorporates some of these described activities. The final course project (Section 2.2) combines elements of a replication study, process analysis, design and deployment, and nutritional label design. Students replicate a model with an existing dataset and algorithm, and in the process identify transparency flaws, areas for improving interpretability, and ways to improve model performance. Future iterations of the course will tie in further pedagogical principles.
6. Conclusion and Outlook
In this paper we looked at the pedagogical implications of responsible data science, creating explicit parallels between cutting edge data science research, and cutting edge educational research. We recounted a recent experience in developing and teaching a responsible data science course to graduate and advanced undergraduate data science students. Further, focusing on transparency and interpretability, we proposed best practices and concrete implementable techniques for teaching this important topic, for others to use.
We are excited to see the enthusiasm of students, data science practitioners, and instructors for responsible data science. Given this enthusiasm, and the tangible need of both the industry and academia to welcome a new generation of responsible data scientists, we must come together as a community to meet the challenge of developing curricula and teaching responsible data science, while striking the right balance. We are at the beginning of the road, and much work remains: in developing instructional methodologies and materials, creating assignments and assessment instruments, and ensuring that the materials we develop stay up-to-date as our understanding of ethics and responsibility in data science evolves. We must also be deliberate in finding ways to scale up curriculum development and instructor training.
In this article we focused primarily on higher education, and in particular on teaching data science students. Going forward, it is crucial to think about educating current data science practitioners, and members of the general public. As with the data science student population, transparency and interpretability will prove to be a key concept to teach.
A necessary next step is to advance the work of reconciling various disciplinary critiques of interpretability and explainability in machine learning (Gilpin et al., 2018; Shmueli, 2010). Within the legal and philosophical traditions, there are existing ways of interpreting interpretability that have potentials for how students approach material technically. An additional next step is to integrate existing curricular attempts to teach RDS, which overwhelmingly focus on humanistic approaches to the topic, and identify goals in common that allow us to begin to create a taxonomy of RDS pedagogy, and examine the effectiveness of ethical approaches in technical and humanistic courses.
References
- (1)
- op ([n. d.]) [n. d.]. Open Provenance. https://openprovenance.org. [Online; accessed 14-August-2019].
- Aasheim et al. (2015) Cheryl L. Aasheim, Susan Williams, Paige Rutner, and Adrian Gardiner. 2015. Data Analytics vs. Data Science: A Study of Similarities and Differences in Undergraduate Programs Based on Course Descriptions. Journal of Information Systems Education 26, 2 (2015), 103–115. http://jise.org/Volume26/n2/JISEv26n2p103.pdf
- Abedjan et al. (2015) Ziawasch Abedjan, Lukasz Golab, and Felix Naumann. 2015. Profiling relational data: a survey. VLDB J. 24, 4 (2015), 557–581. https://doi.org/10.1007/s00778-015-0389-y
- Ackermann (2001) Edith Ackermann. 2001. Piaget’s Constructivism, Papert’s Constructionism: What’s the difference?. In Conference Proceedings, Vol. 1 and 2. Geneva, Switzerland, 85–94.
- Administration (1994) Food and Drug Administration. 1994. Nutritional Labeling and Education Act (NLEA) Requirements (8/94 - 2/95). https://www.fda.gov/inspections-compliance-enforcement-and-criminal-investigations/inspection-guides/nutritional-labeling-and-education-act-nlea-requirements-894-295#GUIDE%20FOR%20REVIEW%20OF%20NUTRITION
- Aleven and Koedinger (2002) Vincent A. Aleven and Kenneth R. Koedinger. 2002. An effective metacognitive strategy: Learning by doing and explaining with a computer-based Cognitive Tutor. Cognitive Science 26, 2 (2002), 147–179.
- Ananny and Crawford (2016) Mike Ananny and Kate Crawford. 2016. Seeing without knowing: Limitations of the transparency ideal and its application to algorithmic accountability. New Media & Society 20, 3 (2016), 973–989. https://doi.org/10.1177/1461444816676645
- Anderson et al. (2014) Paul Anderson, James Bowring, Renée McCauley, George Pothering, and Christopher Starr. 2014. An undergraduate degree in data science: curriculum and a decade of implementation experience. In Proceedings of the 45th ACM technical symposium on Computer science education. Atlanta, Georgia, 145–150. https://doi.org/10.1145/2538862.2538936
- Angelo and Cross (1993) Thomas A. Angelo and K. Patricia Cross. 1993. Classroom Assessment Techniques: A Handbook for College Teachers (2nd ed.). Jossey-Bass, San Francisco, CA.
- Angwin et al. (2016) Julia Angwin, Jeff Larson, Surya Mattu, and Lauren Kirchner. 2016. Machine bias: There’s software used across the country to predict future criminals. And it’s biased against blacks. (ProPublica). https://www.propublica.org/article/machine-bias-risk-assessments-in-criminal-sentencing
- Baker et al. (2016) Ryan S. Baker, Jody Clarke-Midura, and Jaclyn Ocumpaugh. 2016. Toward general models of effective science inquiry in virtual performance assessments. Journal of Computer Assisted Learning 32, 3 (2016), 267–280.
- Ben-Ari (2001) Mordechai Ben-Ari. 2001. Constructivism in Computer Science Education. Journal of Computers in Mathematics and Science Teaching 20, 1 (2001), 45–73.
- Biessmann et al. (2018) Felix Biessmann, David Salinas, Sebastian Schelter, Philipp Schmidt, and Dustin Lange. 2018. Deep Learning for Missing Value Imputation in Tables with Non-Numerical Data. In Proceedings of the 27th ACM International Conference on Information and Knowledge Management. ACM, 2017–2025.
- boyd (2010) danah boyd. 2010. Privacy and Publicity in the Context of Big Data. https://www.danah.org/papers/talks/2010/WWW2010.html
- Breiman (2001) Leo Breiman. 2001. Statistical Modeling: The Two Cultures. Statist. Sci. 16, 3 (2001), 199–231. https://doi.org/10.1214/ss/1009213726
- Broussard (2018) Meredith Broussard. 2018. Artificial Unintelligence: How Computers Misunderstand the World. MIT Press, Cambridge, Massachusetts.
- Byrd-Bredbenner et al. (2009) Carol Byrd-Bredbenner, Lisa Alfieri, Angela Wong, and Peta Cottee. 2009. The inherent educational qualities of nutrition labels. Family & Consumer Sciences Research Journal 29, 26 (2009). https://doi.org/10.1177/1077727X01293004
- Carmichael and Marron (2018) Iain Carmichael and J.S. Marron. 2018. Data science vs. statistics: two cultures? Japanese Journal of Statistics and Data Science 1, 1 (2018), 117–138. https://doi.org/10.1007/s42081-018-0009-3
- Chamberlin and Powers (2010) Michelle Chamberlin and Robert Powers. 2010. The promise of differentiated instruction for enhancing the mathematical understandings of college students. Teaching Mathematics and its Applications 29, 3 (2010), 113–139. https://doi.org/10.1093/teamat/hrq006
- Chouldechova (2017) Alexandra Chouldechova. 2017. Fair prediction with disparate impact: A study of bias in recidivism prediction instruments. CoRR abs/1703.00056 (2017). arXiv:1703.00056 http://arxiv.org/abs/1703.00056
- Chu and Ilyas (2016) Xu Chu and Ihab F. Ilyas. 2016. Qualitative Data Cleaning. PVLDB 9, 13 (2016), 1605–1608. https://doi.org/10.14778/3007263.3007320
- Committee (2016) GAISE College Report ASA Revision Committee. 2016. Guidelines for assessment and instruction in statistics education (GAISE): College report 2016. http://www.amstat.org/education/gaise
- Council (2000) National Research Council. 2000. How People Learn: Brain, Mind, Experience, and School (expanded edition ed.). The National Academies Press, Washington, DC.
- Datta et al. (2018) Amit Datta, Anupam Datta, Jael Makagon, Deirdre K. Mulligan, and Michael Carl Tschantz. 2018. Discrimination in Online Personalization: A Multidisciplinary Inquiry. In Conference on Fairness, Accountability and Transparency, FAT 2018, 23-24 February 2018, New York, NY, USA. 20–34. http://proceedings.mlr.press/v81/datta18a.html
- Datta et al. (2016) Anupam Datta, Shayak Sen, and Yair Zick. 2016. Algorithmic transparency via quantitative input influence: Theory and experiments with learning systems. In Proceedings of IEEE Symposium on Security and Privacy. IEEE, 598–617.
- Datta et al. (2015) Amit Datta, Michael Carl Tschantz, and Anupam Datta. 2015. Automated Experiments on Ad Privacy Settings. PoPETs 2015, 1 (2015), 92–112. https://doi.org/10.1515/popets-2015-0007
- De Veaux et al. (2017) Richard De Veaux, Mahesh Agarwal, Maia Averett, Benjamin S. Baumer, Andrew Bray, Thomas C. Bressoud, Lance Bryant, Lei Z. Cheng, Amanda Francis, Robert Gould, Albert Y. Kim, Matt Kretchmar, Qin Lu, Ann Moskol, Deborah Nolan, Roberto Pelayo, Sean Raleigh, Ricky J. Sethi, Mutiara Sondjaja, Neelesh Tiruviluamala, Paul X. Uhlig, Talitha M. Washington, Curtis L. Wesley, David White, and Ping Ye. 2017. Curriculum Guidelines for Undergraduate Programs in Data Science. Annual Review of Statistics and Its Application 4 (2017), 2.1–2.16. https://doi.org/10.1146/annurev-statistics-060116-053930
- Diakopoulos (2016) Nicholas Diakopoulos. 2016. Accountability in algorithmic decision making. Commun. ACM 59, 2 (Feb. 2016), 56–62. https://doi.org/10.1145/2844110
- Dinur and Nissim (2003) Irit Dinur and Kobbi Nissim. 2003. Revealing information while preserving privacy. In Proceedings of the Twenty-Second ACM SIGACT-SIGMOD-SIGART Symposium on Principles of Database Systems, June 9-12, 2003, San Diego, CA, USA. 202–210. https://doi.org/10.1145/773153.773173
- diSessa et al. (1988) Andrea A. diSessa, George Forman, and Peter P. Pufall. 1988. Knowledge in pieces. In Constructivism in the Computer Age. Lawrence Erlbaum, Hillsdale, NJ, 49–70.
- Doshi-Velez and Kim (2017) Finale Doshi-Velez and Been Kim. 2017. Towards a rigorous science of interpretable machine learning. (2017). https://arxiv.org/pdf/1702.08608.pdf
- Dweck (1986) Carol S. Dweck. 1986. Motivational processes affect learning. American Psychologist 41 (1986), 1040–1048.
- Dwork (2011) Cynthia Dwork. 2011. A firm foundation for private data analysis. Commun. ACM 54, 1 (2011), 86–95. https://doi.org/10.1145/1866739.1866758
- Dwork et al. (2012) Cynthia Dwork, Moritz Hardt, Toniann Pitassi, Omer Reingold, and Richard S. Zemel. 2012. Fairness through awareness. In Innovations in Theoretical Computer Science 2012, Cambridge, MA, USA, January 8-10, 2012. 214–226. https://doi.org/10.1145/2090236.2090255
- Farahi and Stroud (2018) Arya Farahi and Jonathan Stroud. 2018. The Michigan Data Science Team: A Data Science Education Program with Significant Social Impact. In Proceedings of 2018 DSW. Lausanne, Switzerland.
- for Computing Machinery (2018) Association for Computing Machinery. 2018. ACM code of ethics and professional conduct. https://www.acm.org/code-of-ethics
- Friedler et al. (2016) Sorelle A. Friedler, Carlos Scheidegger, and Suresh Venkatasubramanian. 2016. On the (im)possibility of fairness. CoRR abs/1609.07236 (2016). arXiv:1609.07236 http://arxiv.org/abs/1609.07236
- Friedman and Winograd (1990) Batya Friedman and Terry Winograd. 1990. Computing and social responsibility: a collection of course syllabi. Computer Professionals for Social Responsibility, Palo Alto, CA. https://dl.acm.org/citation.cfm?id=152167
- Garfield and Ben-Zvi (2007) Joan Garfield and Dani Ben-Zvi. 2007. How Students Learn Statistics Revisited: A Current Review of Research on Teaching and Learning Statistics. International Statistical Review 75, 3 (2007). https://doi.org/10.1111/j.1751-5823.2007.00029.x
- Gebru et al. (2018) Timnit Gebru, Jamie Morgenstern, Briana Vecchione, Jennifer Wortman Vaughan, Hanna Wallach, Hal Daumeé III, and Kate Crawford. 2018. Datasheets for Datasets. arXiv preprint arXiv:1803.09010 (2018).
- George (2005) Paul S. George. 2005. A rationale for differentiating instruction in the regular classroom. Theory Into Practice 44, 3 (2005), 185–193. https://doi.org/10.1207/s15430421tip4403_2
- Gillborn et al. (2017) David Gillborn, Paul Warmington, and Sean Demack. 2017. QuantCrit: education, policy, ‘Big Data’ and principles for a critical race theory of statistics. Race, Ethnicity, and Education 2 (2017), 158–179. https://doi.org/10.1080/13613324.2017.1377417
- Gilpin et al. (2018) Leilani H. Gilpin, David Bau, Ben Z. Yuan, Ayesha Bajwa, Michael Specter, and Lalana Kagal. 2018. Explaining Explanations: An Overview of Interpretability of Machine Learning. In DSAA 2018. https://arxiv.org/pdf/1806.00069.pdf
- Gitelman and Jackson (2013) Lisa Gitelman and Virginia Jackson. 2013. Introduction. In ”Raw Data” Is an Oxymoron, Lisa Gitelman (Ed.). MIT Press, Cambridge, MA, 1–14.
- Gleicher (2016) Michael Gleicher. 2016. A Framework for Considering Comprehensibility in Modeling. Big Data 4, 2 (2016), 75–88. https://doi.org/10.1089/big.2016.0007
- Goodfellow et al. (2015) Ian J. Goodfellow, Jonathan Shlens, and Christian Szegedy. 2015. Explaining and harnessing adversarial examples. In Proceedings from the International Conference on Learning Representations 2015. San Diego, CA, 1–11. https://arxiv.org/pdf/1412.6572.pdf
- Goodman and Flaxman (2017) Bryce Goodman and Seth Flaxman. 2017. European Union Regulations on Algorithmic Decision-Making and a “Right to Explanation”. AI Magazine 38, 3 (2017), 50–57. https://doi.org/10.1609/aimag.v38i3.2741
- Guidotti et al. (2018) Riccardo Guidotti, Anna Monreale, Salvatore Ruggieri, Franco Turini, Dino Pedreschi, and Fosca Giannotti. 2018. A Survey of Methods for Explaining Black Box Models. ACM Computing Surveys (CSUR) Surveys 51, 5 (2018). https://doi.org/10.1145/3236009
- Gunaratne and Nov (2017) Junius Gunaratne and Oded Nov. 2017. Using Interactive ”Nutrition Labels” for Financial Products to Assist Decision Making Under Uncertainty. Journal of the Association for Information Science and Technology 68, 8 (2017), 1836–1849. https://doi.org/10.1002/asi.23844
- Hilliam and Calvert (2019) Rachel Hilliam and Carol Calvert. 2019. Interactive statistics for a diverse student population. Open Learning: The Journal of Open, Distance and e-Learning 34, 2 (2019).
- Holland et al. (2018) Sarah Holland, Ahmed Hosny, Sarah Newman, Joshua Joseph, and Kasia Chmielinski. 2018. The Dataset Nutrition Label: A Framework To Drive Higher Data Quality Standards. CoRR abs/1805.03677 (2018). arXiv:1805.03677 http://arxiv.org/abs/1805.03677
- Homelessness ([n. d.]) Partners Ending Homelessness. [n. d.]. Vulnerability Index - Service Prioritization Decision Assistance Tool (VI-SPDAT). http://pehgc.org/wp-content/uploads/2016/09/VI-SPDAT-v2.01-Single-US-Fillable.pdf. [Online; accessed on 14-September-2017].
- Huff and Martin (1995) Chuck Huff and C. Dianne Martin. 1995. Computing consequences: a framework for teaching ethical computing. Commun. ACM 38, 12 (Dec. 1995), 75–84. https://doi.org/10.1145/219663.219687
- Hundhausen and Douglas (2000) Christopher D. Hundhausen and Sarah A. Douglas. 2000. Using visualizations to learn algorithms: should students construct their own, or view an expert’s?. In Proceedings of 2000 IEEE Symposiumon on Visual Languages. IEEE Computer Society Press, Los Alamitos, CA, 21–28.
- Hundhausen et al. (2002) Christopher D. Hundhausen, Sarah A. Douglas, and John T. Stasko. 2002. A Meta-Study of Algorithm Visualization Effectiveness. Journal of Visual Languages and Computing 13 (2002), 259–290. https://doi.org/0.1006/S1045-926X(02)00028-9
- Kelley et al. (2010) Patrick G. Kelley, Lucian Cesca, Joanna Bresee, and Lorrie F. Cranor. 2010. Standardizing privacy notices: An online study of the nutrition label approach. In Proceedings of the SIGCHI Conference on Human Factors in Computing Systems. ACM, Atlanta, Georgia, 1573–1582. https://doi.org/10.1145/1753326.1753561
- Kim et al. (2015) Been Kim, Kayur Patel, Afshin Rostamizadeh, and Julie Shah. 2015. Scalable and interpretable data representation for high-dimensional, complex data. In Proceedings of AAAI 2015. AAAI.
- Kirkpatrick (2017) Keith Kirkpatrick. 2017. It’s Not the Algorithm, It’s the Data. Commun. ACM 60, 2 (Jan. 2017), 21–23. https://doi.org/10.1145/3022181
- Kleinberg et al. (2017) Jon M. Kleinberg, Sendhil Mullainathan, and Manish Raghavan. 2017. Inherent Trade-Offs in the Fair Determination of Risk Scores. In 8th Innovations in Theoretical Computer Science Conference, ITCS 2017, January 9-11, 2017, Berkeley, CA, USA. 43:1–43:23. https://doi.org/10.4230/LIPIcs.ITCS.2017.43
- Knapp (2016) Justin Anthony Knapp. 2016. Engaging the Public in Ethical Reasoning About Big Data. In Ethical Reasoning in Big Data: An Exploratory Analysis, Jeff Collman and Sorin Adam Matei (Eds.). Springer International Publishing, New York, NY, 43–52. https://doi.org/10.1007/978-3-319-28422-4_4
- Lage et al. (2018) Isaac Lage, Andrew Slavin Ross, Been Kim, Samuel Gershman, and Finale Doshi-Velez. 2018. Human-in-the-Loop Interpretability Prior. In NeurIPS 2018. Montréal, Canada. https://papers.nips.cc/paper/8219-human-in-the-loop-interpretability-prior.pdf
- Latour (1986) Bruno Latour. 1986. Visualisation and Cognition: Thinking with Eyes and Hands. In Knowledge and Society Studies in the Sociology of Culture Past and Present, H. Kuklick (Ed.). Vol. 6. Jai Press, 1–40.
- Lazar et al. (2010) Jonathan Lazar, Jinjuan Heidi Feng, and Harry Hochheiser. 2010. Research methods in human-computer interaction. John Wiley & Sons, Indianapolis, IN.
- Lehr and Ohm (2017) David Lehr and Paul Ohm. 2017. Playing with the Data: What Legal Scholars Should Learn about Machine Learning. UC Davis Law Review 51, 2 (2017), 653–717.
- Leonelli (2016) Sabina Leonelli. 2016. Locating ethics in data science: responsibility and accountability in global and distributed knowledge production systems. Philosophical transactions 374, 2083 (2016), 20160122. https://doi.org/10.1098/rsta.2016.0122
- Lipton (2016) Zachary Lipton. 2016. The mythos of model interpretability. 2016 ICML Workshop on Human Interpretability in Machine Learning (WHI 2016) (2016).
- Lou et al. (2012) Yin Lou, Rich Caruana, and Johannes Gehrke. 2012. Intelligible models for classification and regression. In The 18th ACM SIGKDD International Conference on Knowledge Discovery and Data Mining, KDD ’12, Beijing, China, August 12-16, 2012. 150–158. https://doi.org/10.1145/2339530.2339556
- Luban et al. (1992) David Luban, Alan Strudler, and David Wasserman. 1992. Moral Responsibility in the Age of Bureaucracy. Michigan Law Review 90, 8 (1992), 2348–2392.
- Lum and Isaac (2016) Kristian Lum and William Isaac. 2016. To predict and serve? Significance 13 (2016), 14–19. Issue 5.
- Lundberg and Lee (2017) Scott Lundberg and Su-In Lee. 2017. A Unified Approach to Interpreting Model Predictions. In Proceedings of NIPS 2017. NIPS.
- Markham et al. (2018) Annette N. Markham, Katrin Tiidenberg, and Andrew Herman. 2018. Ethics as Methods: Doing Ethics in the Era of Big Data Research—Introduction. Social Media + Society 4, 3 (2018), 1–9. https://doi.org/10.1177/2056305118784502
- Martin and Holz (1992) C. Dianne Martin and Hilary J. Holz. 1992. Non-apologetic computer ethics education: a strategy for integrating social impact and ethics into the computer science curriculum. In Teaching computer ethics, Terrell Ward Bynum, Walter Maner, and John L. Fodor (Eds.). Southern Connecticut State University, New Haven, CT, 50–66. https://rcvest.southernct.edu/teaching-computer-ethics/
- Mayer (2010) Richard E. Mayer. 2010. Applying the Science of Learning. Pearson, New York, NY.
- Mervis (2019) Jeffrey Mervis. 2019. Can a set of equations keep U.S. census data private? Science Magazine (Jan. 2019).
- Mitchell et al. (2018) Shira Mitchell, Eric Potash, Solon Barocas, Alexander D’Amour, and Kristian Lum. 2018. Prediction-Based Decisions and Fairness: A Catalogue of Choices, Assumptions, and Definitions. CoRR abs/1811.07867 (2018). https://arxiv.org/abs/1811.07867
- Moreau et al. (2008) Luc Moreau, Bertram Ludäscher, Ilkay Altintas, Roger S. Barga, Shawn Bowers, Steven P. Callahan, George Chin Jr., Ben Clifford, Shirley Cohen, Sarah Cohen Boulakia, Susan B. Davidson, Ewa Deelman, Luciano A. Digiampietri, Ian T. Foster, Juliana Freire, James Frew, Joe Futrelle, Tara Gibson, Yolanda Gil, Carole A. Goble, Jennifer Golbeck, Paul T. Groth, David A. Holland, Sheng Jiang, Jihie Kim, David Koop, Ales Krenek, Timothy M. McPhillips, Gaurang Mehta, Simon Miles, Dominic Metzger, Steve Munroe, Jim Myers, Beth Plale, Norbert Podhorszki, Varun Ratnakar, Emanuele Santos, Carlos Eduardo Scheidegger, Karen Schuchardt, Margo I. Seltzer, Yogesh L. Simmhan, Cláudio T. Silva, Peter Slaughter, Eric G. Stephan, Robert Stevens, Daniele Turi, Huy T. Vo, Michael Wilde, Jun Zhao, and Yong Zhao. 2008. Special Issue: The First Provenance Challenge. Concurrency and Computation: Practice and Experience 20, 5 (2008), 409–418. https://doi.org/10.1002/cpe.1233
- Mumford et al. (2008) Michael D. Mumford, Shane Connelly, Ryan P. Brown, Stephen T. Murphy, Jason H. Hill, Alison L. Antes, Ethan P. Waples, and Lynn D. Devenport. 2008. A Sensemaking Approach to Ethics Training for Scientists: Preliminary Evidence of Training Effectiveness. Ethics & Behavior 18, 4 (2008), 315–339. https://doi.org/10.1080/10508420802487815
- Naps et al. (2002) Thomas L. Naps, Guido Rößling, Vicki Almstrum, Wanda Dann, Rudolf Fleischer, Christopher Hundhausen, Ari Korhonen, Lauri Malmi, Myles McNally, Susan Rodger, and J. Ángel Velázquez-Iturbide. 2002. Exploring the role of visualization and engagement in computer science education. In Proceedings of ITiCSE-WGR ’02. ACM, Aarhus, Denmark, 131–152.
- Nolan and Perrett (2016) Deborah Nolan and Jamis Perrett. 2016. Teaching and Learning Data Visualization: Ideas and Assignments. The American Statistician 70, 3 (2016), 260–269.
- O’Neil (2016) Cathy O’Neil. 2016. Weapons of Math Destruction: How Big Data Increases Inequality and Threatens Democracy. Crown, New York, NY.
- Papert (1980) Seymour Papert. 1980. Mindstorms: Children, computers, and powerful ideas. Basic Books, New York, NY.
- Passi and Barocas (2019) Samir Passi and Solon Barocas. 2019. Problem Formulation and Fairness. In Proceedings of the ACM Conference on Fairness, Accountability, and Transparency. ACM, 10. https://arxiv.org/pdf/1901.02547.pdf
- Ping et al. (2017) Haoyue Ping, Julia Stoyanovich, and Bill Howe. 2017. DataSynthesizer: Privacy-Preserving Synthetic Datasets. In Proceedings of the 29th International Conference on Scientific and Statistical Database Management, Chicago, IL, USA, June 27-29, 2017. 42:1–42:5. https://doi.org/10.1145/3085504.3091117
- Poursabzi-Sangdeh et al. (2018) Forough Poursabzi-Sangdeh, Jennifer Wortman Vaughan, Daniel G. Goldstein, Jake M. Hofman, and Hannah Wallach. 2018. Manipulating and Measuring Model Interpretability. (2018). https://arxiv.org/pdf/1802.07810.pdf
- Provost and Fawcett (2013) Foster Provost and Tom Fawcett. 2013. Data Science for Business: What You Need to Know About Data Mining and Data-Analytic Thinking. O’Reilly Media, Sebastopol, CA.
- Quinn (2006) Michael J. Quinn. 2006. On teaching computer ethics within a computer science department. Science and Engineering Ethics 12, 2 (June 2006), 335–343. https://doi.org/10.1007/s11948-006-0032-9
- Ribeiro et al. (2016) Marco Tulio Ribeiro, Sameer Singh, and Carlos Guestrin. 2016. ”Why Should I Trust You?”: Explaining the predictions of any classifier. In KDD ’16 Proceedings of the 22nd ACM SIGKDD International Conference on Knowledge Discovery and Data Mining. ACM, San Francisco, CA, USA, 1135–1144. https://doi.org/10.1145/2939672.2939778
- Rubin et al. (2006) Andee Rubin, James Hammerman, and Cliff Konold. 2006. Exploring informal inference with interactive visualization software. In Proceedings of the Seventh International Conference on Teaching Statistics.
- Salganik (2019) Matthew J. Salganik. 2019. Bit By Bit: Social Research in the Digital Age. Princeton University Press.
- Salimi et al. (2019) Babak Salimi, Luke Rodriguez, Bill Howe, and Dan Suciu. 2019. Interventional Fairness: Causal Database Repair for Algorithmic Fairness. In Proceedings of the 2019 International Conference on Management of Data, SIGMOD Conference 2019, Amsterdam, The Netherlands, June 30 - July 5, 2019. 793–810. https://doi.org/10.1145/3299869.3319901
- Schraagen et al. (2000) Jan Maarten Schraagen, Susan F. Chipman, and Valerie L. Shalin. 2000. Introduction to cognitive task analysis. In Cognitive task analysis, Jan Maarten Schraagen, Susan F. Chipman, and Valerie L. Shalin (Eds.). Erlbaum, Mahwah, NJ, 3–23.
- Selbst and Barocas (2018) Andrew Selbst and Solon Barocas. 2018. The Intuitive Appeal of Explainable Machines. Fordham Law Review 87, 3 (2018), 1085 –1139.
- Shmueli (2010) Galit Shmueli. 2010. To explain or to predict? Statist. Sci. 25, 3 (2010), 289–310. https://doi.org/10.1214/10-STS330
- Sriadhi et al. (2018) S. Sriadhi, Robbi Rahim, and Ansari Saleh Ahmar. 2018. RC4 Algorithm Visualization for Cryptography Education. Journal of Physics: Conference Series 1028 (2018). https://doi.org/10.1088/1742-6596/1028/1/012057
- Sternberg (2010) Robert J. Sternberg. 2010. Teaching for Ethical Reasoning in Liberal Education. Liberal Education (Association of American Colleges & Universities) 96, 3 (2010). https://www.aacu.org/publications-research/periodicals/teaching-ethical-reasoning-liberal-education
- Stoyanovich and Goodman (2016) Julia Stoyanovich and Ellen P. Goodman. 2016. Revealing Algorithmic Rankers. http://freedom-to-tinker.com/2016/08/05/revealing-algorithmic-rankers/. Freedom to Tinker (August 5 2016). [Online; accessed 19-August-2019].
- Stoyanovich and Howe (2018a) Julia Stoyanovich and Bill Howe. 2018a. Follow the data! Algorithmic transparency starts with data transparency. https://ai.shorensteincenter.org/ideas/2018/11/26/follow-the-data-algorithmic-transparency-starts-with-data-transparency. The Ethical Machine (November 27 2018). [Online; accessed 19-August-2019].
- Stoyanovich and Howe (2018b) Julia Stoyanovich and Bill Howe. 2018b. Refining the Concept of a Nutritional Label for Data and Models. https://freedom-to-tinker.com/2018/05/03/refining-the-concept-of-a-nutritional-label-for-data-and-models/. Freedom to Tinker (May 3 2018). [Online; accessed 19-August-2019].
- Stoyanovich et al. (2017) Julia Stoyanovich, Bill Howe, Serge Abiteboul, Gerome Miklau, Arnaud Sahuguet, and Gerhard Weikum. 2017. Fides: Towards a Platform for Responsible Data Science. In Proceedings of the 29th International Conference on Scientific and Statistical Database Management, Chicago, IL, USA, June 27-29, 2017. 26:1–26:6. https://doi.org/10.1145/3085504.3085530
- Stoyanovich et al. (2018) Julia Stoyanovich, Ke Yang, and H. V. Jagadish. 2018. Online Set Selection with Fairness and Diversity Constraints. In Proceedings of the 21th International Conference on Extending Database Technology, EDBT 2018, Vienna, Austria, March 26-29, 2018. 241–252. https://doi.org/10.5441/002/edbt.2018.22
- Sweeney (2013) Latanya Sweeney. 2013. Discrimination in Online Ad Delivery. ACM Queue 11, 3 (2013), 10. https://doi.org/10.1145/2460276.2460278
- Tomlinson (2017) Carol Ann Tomlinson. 2017. How to Differentiate Instruction in Academically Diverse Classroom (3rd ed.). ASCD, Alexandria, VA.
- Tractenberg et al. (2015) Rochelle E. Tractenberg, Andrew J. Russell, Gregory J. Morgan, Kevin T. FitzGerald, Jeff Collmann, Lee Vinsel, Michael Steinmann, and Lisa M. Dolling. 2015. Using Ethical Reasoning to Amplify the Reach and Resonance of Professional Codes of Conduct in Training Big Data Scientists. Science and Engineering Ethics 21, 6 (2015), 1485–1507. https://doi.org/10.1007/s11948-014-9613-1
- Tufte (2001) Edward R. Tufte. 2001. The Visual Display of Quantitative Information (second ed.). Graphics Press, Cheshire, CT.
- Tukey (1977) John W. Tukey. 1977. Exploratory data analysis. Addison-Wesley, Reading, PA.
- Turkle and Papert (1992) Sherry Turkle and Seymour Papert. 1992. Epistemological Pluralism and the Revaluation of the Concrete. Journal of Mathematical Behavior 11, 1 (March 1992), 3–33.
- University (2019) Harvard University. 2019. Embedded EthiCS @ Harvard. https://embeddedethics.seas.harvard.edu/about.html
- Valentino-DeVries et al. (2012) Jennifer Valentino-DeVries, Jeremy Singer-Vine, and Ashkan Soltani. 2012. Websites Vary Prices, Deals Based on Users’ Information. https://www.wsj.com/articles/SB10001424127887323777204578189391813881534
- Wenger (1998) Etienne Wenger. 1998. Communities of practice. Cambridge University Press, Cambridge, England.
- Wierse and Grinstein (2002) Andreas Wierse and Georges Grinstein. 2002. Information Visualization in Data Mining and Knowledge Discovery. Morgan Kauffmann Publishers, San Francisco, CA.
- Williamson (2016) Ben Williamson. 2016. Digital education governance: data visualization, predictive analytics, and ‘real-time’ policy instruments. Journal of Education Policy 31, 2 (2016), 123–141. https://doi.org/10.1080/02680939.2015.1035758
- Yang and Stoyanovich (2017) Ke Yang and Julia Stoyanovich. 2017. Measuring Fairness in Ranked Outputs. In Proceedings of the 29th International Conference on Scientific and Statistical Database Management, Chicago, IL, USA, June 27-29, 2017. 22:1–22:6. https://doi.org/10.1145/3085504.3085526
- Yang et al. (2018) Ke Yang, Julia Stoyanovich, Abolfazl Asudeh, Bill Howe, H. V. Jagadish, and Gerome Miklau. 2018. A Nutritional Label for Rankings. In Proceedings of the 2018 International Conference on Management of Data, SIGMOD Conference 2018, Houston, TX, USA, June 10-15, 2018. 1773–1776. https://doi.org/10.1145/3183713.3193568