Solid-Liquid Transition of Deformable and Overlapping Active Particles
Abstract
Experiments and theory have shown that cell monolayers and epithelial tissues exhibit solid-liquid and glass-liquid transitions. These transitions are biologically relevant to our understanding of embryonic development, wound healing, and cancer. Current models of confluent epithelia have focused on the role of cell shape, with less attention paid to cell extrusion, which is key for maintaining homeostasis in biological tissue. Here, we use a multi-phase field model to study the solid-liquid transition in a confluent monolayer of deformable cells. Cell overlap is allowed and provides a way for modeling the precursor for extrusion. When cells overlap rather than deform, we find that the melting transition changes from continuous to first-order-like, and that there is an intermittent regime close to the transition, where solid and liquid states alternate over time. By studying the dynamics of - and -fold disclinations in the hexagonal lattice formed by the cell centers, we observe that these correlate with spatial fluctuations in the cellular overlap, and that cell extrusion tends to initiate near -fold disclinations.
Understanding the dynamics and collective behavior of cells in dense tissues is an important goal of biophysics, with relevance to a number of developmental processes, such as embryogenesis Chuai2012 , wound healing Poujade2007 , and cancer Haeger2014 . For example, the epithelial-mesenchymal transition can be viewed as a solid-liquid transition occurring in vivo Thiery2002 ; Thompson2005 ; Mitchel2019 , where cells become more motile and less adhesive: this transition has been reported to play a role in tissue repair, inflammation, and tumor progression EMT ; Friedl2009 ; Haeger2014 . Experimental studies have also shown that epithelial cells can undergo an unjamming transition between a glassy phase where their dynamics is slow to a fluid phase with large-scale collective motion both in vitro Angelini2011 ; Nnetu2012 ; Park2015 ; Garcia2015 ; Malinverno2017 ; Atia2018 and in vivo Mongera2018 ; Atia2018 .
From a theoretical point of view, an appealing model of a dense tissue is provided by a two-dimensional (2D) confluent cell monolayer (i.e., a space-filling cell monolayer with packing fraction equal to unity). This system can be studied by the cellular Potts model Graner1992 , the vertex Nagai2001 ; Staple2010 ; Fletcher2014 ; Bi2015 and Voronoi Li2014b ; Bi2016 models, and their variants Teomy2018c ; Yan2019 . Such frameworks have recently been used to study the melting transition in monolayers of passive Bi2015 ; Li2018 ; Durand2019 and active/self-motile cells Bi2016 ; Giavazzi2018 ; Barton2017 ; Chiang2016 . Cell motility and deformability distinguish this problem from the 2D melting of crystals of hard or soft disks Engel2013 ; Kapfer2015 ; Hajibabaei2019 ; Digregorio2019 , which proceeds either via a discontinuous transition Saito1982 ; Chui1983 , or through an intermediate hexatic phase and the unbinding of topological defects Kosterlitz1973 ; Halperin1978 ; Nelson1978 ; Young1979 ; Dash1999 ; Gasser2009 .
Existing studies of vertex and Voronoi models of confluent active monolayers suggest that a continuous solid-liquid (or glass-liquid) transition can be observed upon increasing cell motility Bi2016 ; Barton2017 . While useful in providing quantitative predictions, this work has mainly focused on the role of cell intercalation (T1 transitions) in controlling tissue rigidity and less on the role of cell extrusion that in these strictly models may be described by cell removal (T2 transitions) Staple2010 ; Etournay2015 . In many situations, however, cell extrusion is driven by cell crowding and overlap, as commonly seen in confluent epithelia Eisenhoffer2012 . Cell overlap also occurs during early embryogenesis as an epithelial monolayer is converted into a multi-layered epithelium following a tightly coordinated stratification program Koster2007 . Here we consider a model that explicitly allows for cell overlap, interpreted as a precursor for cell extrusion, to examine its role on the solid-liquid transition of a confluent tissue.
To incorporate both particle deformation and overlap we use a multi-phase field model Nonomura2012 ; Palmieri2015 ; Foglino2017 ; Mueller2019 to study melting of a confluent layer of motile deformable particles. The behavior of our system is controlled by the trade-off between deformability and overlap: the less deformable a particle is, the more it overlaps with its neighbors. At high deformability we find a continuous solid-liquid transition with increasing cell motility. The transition becomes first-order-like at low deformability when cells overlap, with an intermediate intermittent state, where the system as a whole alternates between solid and liquid states. Finally, we observe a strong correlation between unbound structural defects (corresponding to - and -fold disclinations in the hexagonal lattice formed by the cell centers) generated upon melting and local fluctuations in cell overlap. Specifically, we find that cellular extrusion is favored at -fold disclinations.
Our model may also serve as a bridge between particle-based and confluent models. Upon decreasing cell deformability, the system transitions from deformable particles that tessellate their domain without overlap, similar to vertex models, to almost-circular overlapping disks. The connection with these two limiting cases is, however, only qualitative. At high deformability, anisotropy of cell shape is strongly correlated with fluidity (Figs. S5 and S6), but, unlike vertex models, it does not provide an order parameter for the liquid state. Conversely, at low deformability, overlap in our model is much higher than that allowed in systems of soft disks.
Our multi-phase field model contains scalar fields, , each representing a different cell. The equilibrium configuration of the cell layer is determined by the minimization of the following free energy Palmieri2015 ; Mueller2019 :
| (1) |
The first three terms determine the shape of the cells. The first term sets and zero as the preferred values of the field inside and outside the cell, respectively. The second term penalizes spatial variations of . Together, they determine the physical properties of the cell boundary, such as the interfacial thickness, which we define as , and surface tension Pagonabarraga2002 . The third term is a soft constraint that sets the preferred area of the cell to that of a circle with target radius . Finally, the fourth term models the steric repulsion between cells by energetically penalizing cell overlap.
To model the dynamics of self-motile active cells, we assume simple relaxational and overdamped dynamics,
| (2) |
where is a friction coefficient and we have included an advection term that propels the cells with velocity , see SM . All cells have the same propulsion speed , while their direction of motion is controlled by rotational noise with diffusivity ,
| (3) |
where is a Wiener process. Cell motility is quantified by the Péclet number , which is the ratio between the cells’ persistence length and their target radius. These equations are a generalization of the active Brownian particle model Romanczuk2012 ; Fily2012 to a system of deformable cells.
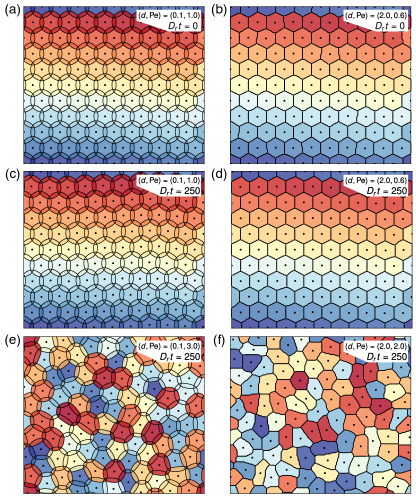
Our model allows cells to both deform and overlap. In general, these are competing effects: deformation is energetically penalized by surface tension, while overlap is penalized by repulsion. We quantify cell deformability through the dimensionless ratio . When , cells tend to acquire a circular shape and overlap with their neighbors (Fig. 1a,c,e). Conversely, when , cells change their shape to match with their neighbors and minimize overlap (Fig. 1b,d,f).
We first examine the role of deformability and motility on the solid-liquid transition at confluence. To this end, we employ a finite difference method to solve numerically Eqs. (2) and (3) for and cells in a rectangular box of aspect ratio that accommodates an undeformed hexagonal cell lattice, with periodic boundary conditions. Choosing as unit of length and as unit of time, we use and as our simulation lattice unit and timestep, respectively. We tune deformability by varying and such that is constant. We initiate the cells in a hexagonal lattice with and allow the system to achieve confluence by setting the cell target area to be larger than the area available to each cell. Further simulation details and the list of parameters are given in the supplemental material.
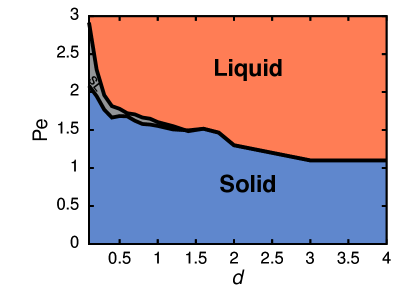
To quantify the melting transition, we compute both dynamical and structural observables SM . Dynamical arrest is quantified through an effective diffusivity Bi2016 ; Giavazzi2018 obtained from the long-time behavior of the mean square displacement of individual cells as , with the diffusivity of an isolated cell. As structural observables, we measure the global bond-orientational order parameter and the structure factor . Choosing as the threshold for a liquid state, the transition lines obtained from the dynamical and structural measurements coincide. The phase diagram displayed in Fig. 2 shows that both deformability and motility facilitate melting. We also find a region of intermittence at low deformability, discussed further below. The width of the plateau in the MSD at intermediate times shrinks with increasing deformability, suggesting that deformability facilitates melting by allowing particles to squeeze more easily through the cages provided by their neighbors.
One of our key results is that the nature of the transition is different at low and high deformability. This can be appreciated by analyzing the standard error of across the parameter space , which shows that there is an intermediate Pe range at for which this quantity is large. Intriguingly, is precisely the region in parameter space where the overlap between cells becomes appreciable, implying that the character of monolayer melting depends on whether the rearrangement of particles occurs by cells squeezing past their neighbors by deforming () or crawling over them by overlapping ().
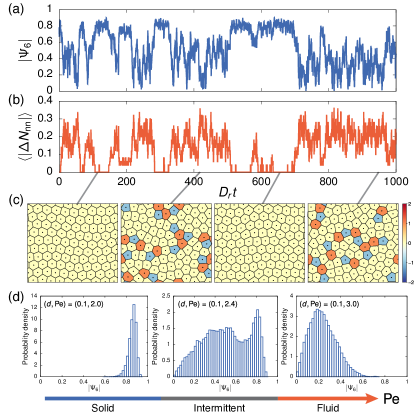
To determine the nature of the intermediate regime found at , we analyze the corresponding time series of (Fig. 3a). The time series shows clear evidence of an intermittent behavior, where the system jumps between two distinct states with different mean values of (see also Suppl. Movie 5). The two states are also apparent from the bimodal character of the probability density function (PDF; Fig. 3d). Since correlates with the melting transition and our solid state is close to a hexagonal crystal, we can associate to a solid state, and values of close to or below to a liquid state. Moreover, the values of in the solid and liquid regimes fluctuate around well-defined means, and hence exhibit unimodal PDFs (albeit with different widths), so that bimodality in the PDF signals intermittence. We also identify intermittence by computing the fraction of defects in the system (Fig. 3b,c), i.e., the fraction of the total number of cells with a coordination number other than six. The time series for shows that defects appear when the monolayer is in the liquid state. In addition, and in line with Ref. Digregorio2019 , we observe that defects in the intermittent phase tend to form grain boundaries and percolate the system (Figs. 3c and S11).
We locate the intermittent region in the phase diagram (Fig. 2) via two separate methods. First, given that there are large fluctuations in in this region, we identify states to be intermittent if both the standard error of and are above . Second, we binarize the time series of and map each time point to either zero (solid) or unity (liquid). For a time series to be intermittent, we require a minimum of two jumps between the states, and a large enough fraction of time spent in either state. Both methods converge and pinpoint a similar parameter region to be intermittent. Further, this region shrinks with increasing (see Figs. S8 and S10). This suggests that intermittence arises because the solid-liquid transition is first-order-like at low deformability, so that coexistence between the two phases is expected at criticality. The first order character is also supported by finite size scaling of at low , where and , computed for systems up to 900 cells (see Fig. S12).
As anticipated, and clear from the phase diagram, the intermittent phase is only present at low deformability, when cells overlap. A possible mechanism through which cell overlap might affect the nature of the transition is the following. When cells are highly deformable and do not overlap with their neighbors, they can escape the local cage in which they are trapped by squeezing through their neighbors. These cage escapes lead to neighbor exchanges, hence to fluidification. On the other hand, if cells are not deformable but can overlap, moving a cell is similar to inserting or moving a coin on a substrate crowded with other coins (as in a “coin-pusher” arcade game). In this case, motion of the coin can either result in simple coin overlap/layering and no motion, or in the collective motion of a raft of coins. The coexistence of different scenarios (overlap or collective motion) may underlie the onset of intermittence in our simulations, and the first-order-like nature of the solid-liquid transition in the low deformability regime. We note a first-order-like glass-to-liquid transition has also been found in systems of active soft disks Fily2014 .
Finally, we analyze the relation between defects in the bond-orientational order and cell overlap. Experiments with monolayers of progenitor stem cells Kawaguchi2017 have shown that these systems can be viewed as active nematics, and that topological defects in the nematic order correlate with the location of cell extrusion and death. Similar behavior has been obtained in MDCK (Madin Darby Canine Kidney) cells Saw2017 ; Mueller2019 . On the other hand, nematic order is often not readily apparent in epithelia, where cells are typically not elongated, and extrusion is presumably associated with high local overlap of a cell with its neighbors Eisenhoffer2012 . Our work offers an alternative interpretation that correlates cell extrusion not with defects in nematic order, but with cell overlap and associated structural defects in cell packing.
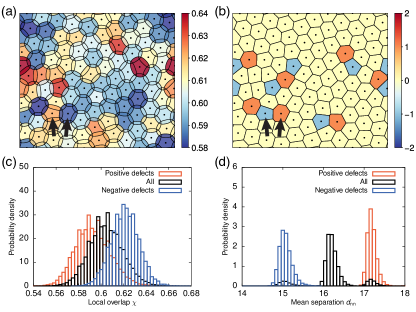
Defects in the hexagonal lattice formed by the cell centers in the ordered solid state are -fold and -fold disclinations and correspond to pentagonal and heptagonal cells, respectively, in the associated Voronoi tessellation Bowick2009 . They are readily identified in the cell packing, as shown in Fig. 4a,b. We define the local overlap of the th cell as , with the Heaviside function. We then search for correlations between defects and overlap by recording both overlap and coordination number for each cell, and constructing the PDFs for the local overlap for pentagonal/heptagonal cells, as well as for the entire cell population (Fig. 4c). The PDFs show that pentagons experience, on average, more overlap with respect to other cells. This can be understood by noting that, while all cells have approximately the same area (Fig. 4a), 5-fold coordinated particles have a smaller mean distance to their neighbors (Fig. 4d). Hence cell overlap is largest at 5-fold defects, suggesting that these may be likely loci of cell extrusion, which is known that can be triggered by cell crowding. Our results suggest that cell extrusions in cell monolayers are likely to occur in the intermittent regime or near the solid-liquid transition, and may originate near 5-fold coordinated cells.
In summary, we have used a multi-phase field model to explore the effect of overlap and motility on the solid-liquid transition in confluent monolayers of active deformable cells. Melting is triggered by increasing motility and/or deformability, which promotes fluidification by allowing cells to squeeze past their neighbors. We have shown that overlap strongly affects the nature of the melting transition in the monolayer. Specifically, when cells overlap rather than deform, the solid-liquid transition changes from continuous to first-order-like, and it is accompanied by an intermediate intermittent regime in which the monolayer alternates between solid and liquid states. This intermittent phase could be relevant to morphological processes that require periodic fluidization to restructure the tissue. We have also found a correlation between the location of topological defects in cell packing and fluctuations in local cell overlap, which suggests that cellular extrusion could be linked to the presence of these defects. Extrusion is an important process in epithelial tissues required for proper biological functioning. While it is normally thought that extrusion is determined by biochemical signaling, recent experiments have suggested a correlation between extrusion and topological defects in the orientational order of elongated or spindle-like cells. Here we suggest an alternative, possibly more general, correlation between extrusion and topological defects in the structure of cell packings that applies even when cells are not elongated.
From a theoretical point of view, it would be of interest to ask whether our active monolayers of deformable cells also exhibit a hexatic phase, which has been recently found in high-density suspensions of active Brownian particles Digregorio2019 ; Digregorio2018 . Addressing this question will require simulations of much larger systems.
Acknowledgements –
This work was supported by the National Science Foundation grants DMR-1609208 (B.L. and M.C.M) and PHY-1748958 (KITP). B.L. would like to acknowledge the hospitality of KITP, where some of this work was done. M.C. acknowledges the Carnegie Trust for the Universities of Scotland for PhD studentship funding. Use was made of computational facilities purchased with funds from the National Science Foundation (CNS-1725797) and administered by the Center for Scientific Computing (CSC). The CSC is supported by the California NanoSystems Institute and the Materials Research Science and Engineering Center (MRSEC; NSF DMR 1720256) at UC Santa Barbara.
B.L. and M.C. contributed equally to this work.
References
- (1) M. Chuai, D. Hughes, and C. J Weijer, Curr. Genomics 13, 267 (2012).
- (2) M. Poujade, E. Grasland-Mongrain, A. Hertzog, J. Jouanneau, P. Chavrier, B. Ladoux, A. Buguin, and P. Silberzan, Proc. Natl. Acad. Sci. USA 104, 15988 (2007).
- (3) A. Haeger, M. Krause, K. Wolf, and P. Friedl, Biochim Biophys Acta 1840, 2386 (2014).
- (4) J. P. Thiery, Nat. Rev. Cancer 2, 442 (2002).
- (5) E. W. Thompson and D. F. Newgreen, Cancer Res. 65, 5991 (2005).
- (6) J. A. Mitchel, A. Das, M. J. O’Sullivan, I. T. Stancil, S. J. DeCamp, S. Koehler, J. P. Butler, J. J. Fredberg, M. A. Nieto, D. Bi, and J.-A. Park, bioRxiv , 665018 (2019).
- (7) J. P. Thiery, H. Acloque, R. Y. Huang, and M. A. Nieto, Cell 139, 871 (2009).
- (8) P. Friedl and D. Gilmour, Nat Rev Mol Cell Biol 10, 445 (2009).
- (9) T. E. Angelini, E. Hannezo, X. Trepat, M. Marquez, J. J. Fredberg, and D. A. Weitz, Proc. Natl. Acad. Sci. USA 108, 4714 (2011).
- (10) K. D. Nnetu, M. Knorr, J. Käs, and M. Zink, New J. Phys. 14, 115012 (2012).
- (11) J. A. Park, J. H. Kim, D. Bi, J. A. Mitchel, N. T. Qazvini, K. Tantisira, C. Y. Park, M. McGill, S. H. Kim, B. Gweon, J. Notbohm, R. Steward, S. Burger, S. H. Randell, A. T. Kho, D. T. Tambe, C. Hardin, S. A. Shore, E. Israel, D. A. Weitz, D. J. Tschumperlin, E. P. Henske, S. T. Weiss, M. L. Manning, J. P. Butler, J. M. Drazen, and J. J. Fredberg, Nat. Mater. 14, 1040 (2015).
- (12) S. Garcia, E. Hannezo, J. Elgeti, J. F. Joanny, P. Silberzan, and N. S. Gov, Proc. Natl. Acad. Sci. USA 112, 15314 (2015).
- (13) C. Malinverno, S. Corallino, F. Giavazzi, M. Bergert, Q. Li, M. Leoni, A. Disanza, E. Frittoli, A. Oldani, E. Martini, T. Lendenmann, G. Deflorian, G. V. Beznoussenko, D. Poulikakos, K. H. Ong, M. Uroz, X. Trepat, D. Parazzoli, P. Maiuri, W. Yu, A. Ferrari, R. Cerbino, and G. Scita, Nat. Mater. 16, 587 (2017).
- (14) L. Atia, D. Bi, Y. Sharma, J. A. Mitchel, B. Gweon, S. A. Koehler, S. J. DeCamp, B. Lan, J. H. Kim, R. Hirsch, A. F. Pegoraro, K. H. Lee, J. R. Starr, D. A. Weitz, A. C. Martin, J.-A. Park, J. P. Butler, and J. J. Fredberg, Nat. Phys. 14, 613 (2018).
- (15) A. Mongera, P. Rowghanian, H. J. Gustafson, E. Shelton, D. A. Kealhofer, E. K. Carn, F. Serwane, A. A. Lucio, J. Giammona, and O. Campàs, Nature 561, 401 (2018).
- (16) F. Graner and J. A. Glazier, Phys. Rev. Lett. 69, 2013 (1992).
- (17) T. Nagai and H. Honda, Philos. Mag. B 81, 699 (2001).
- (18) D. B. Staple, R. Farhadifar, J. C. Röper, B. Aigouy, S. Eaton, and F. Jülicher, Eur. Phys. J. E 33, 117 (2010).
- (19) A. G. Fletcher, M. Osterfield, R. E. Baker, and S. Y. Shvartsman, Biophys. J. 106, 2291 (2014).
- (20) D. Bi, J. H. Lopez, J. M. Schwarz, and M. L. Manning, Nature Phyics 11, 1074 (2015).
- (21) B. Li and S. X. Sun, Biophys. J. 107, 1532 (2014).
- (22) D. Bi, X. Yang, M. C. Marchetti, and M. L. Manning, Phys. Rev. X 6, 021011 (2016).
- (23) E. Teomy, D. A. Kessler, and H. Levine, Phys. Rev. E 98, 042418 (2018).
- (24) L. Yan and D. Bi, Phys. Rev. X 9, 011029 (2019).
- (25) Y.-W. Li and M. P. Ciamarra, Phys. Rev. Mater. 2, 045602 (2018).
- (26) M. Durand and J. Heu, Phys. Rev. Lett. 123, 188001 (2019).
- (27) F. Giavazzi, M. Paoluzzi, M. Macchi, D. Bi, G. Scita, M. L. Manning, R. Cerbino, and M. C. Marchetti, Soft Matter 14, 3471 (2018).
- (28) D. L. Barton, S. Henkes, C. J. Weijer, and R. Sknepnek, PLoS Comput. Biol. 13, (2017).
- (29) M. Chiang and D. Marenduzzo, EPL 116, 28009 (2016).
- (30) M. Engel, J. A. Anderson, S. C. Glotzer, M. Isobe, E. P. Bernard, and W. Krauth, Phys. Rev. E 87, 042134 (2013).
- (31) S. C. Kapfer and W. Krauth, Phys. Rev. Lett. 114, 035702 (2015).
- (32) A. Hajibabaei and K. S. Kim, Phys. Rev. E 99, 022145 (2019).
- (33) P. Digregorio, D. Levis, L. F. Cugliandolo, G. Gonnella, and I. Pagonabarraga, arXiv:1911.06366 (2019).
- (34) Y. Saito, Phys. Rev. Lett. 48, 1114 (1982).
- (35) S. T. Chui, Phys. Rev. B 28, 178 (1983).
- (36) J. M. Kosterlitz and D. J. Thouless, J. Phys. C Solid State Phys. 6, 1181 (1973).
- (37) B. I. Halperin and D. R. Nelson, Phys. Rev. Lett. 41, 121 (1978).
- (38) D. R. Nelson, Phys. Rev. B 18, 2318 (1978).
- (39) A. P. Young, Phys. Rev. B 19, 1855 (1979).
- (40) J. G. Dash, Rev. Mod. Phys. 71, 1737 (1999).
- (41) U. Gasser, J. Phys. Condens. Matter 21, (2009).
- (42) R. Etournay, M. Popović, M. Merkel, A. Nandi, C. Blasse, B. Aigouy, H. Brandl, G. Myers, G. Salbreux, F. Jülicher, and S. Eaton, Elife 4, e07090 (2015).
- (43) G. T. Eisenhoffer, P. D. Loftus, M. Yoshigi, H. Otsuna, C. B. Chien, P. A. Morcos, and J. Rosenblatt, Nature 484, 546 (2012).
- (44) M. I. Koster and D. R. Roop, Annu. Rev. Cell Dev. Biol. 23, 93 (2007).
- (45) M. Nonomura, PLoS One 7, e33501 (2012).
- (46) B. Palmieri, Y. Bresler, D. Wirtz, and M. Grant, Sci. Rep. 5, 11745 (2015).
- (47) M. Foglino, A. N. Morozov, O. Henrich, and D. Marenduzzo, Phys. Rev. Lett. 119, 208002 (2017).
- (48) R. Mueller, J. M. Yeomans, and A. Doostmohammadi, Phys. Rev. Lett. 122, 048004 (2019).
- (49) I. Pagonabarraga, A. J. Wagner, and M. E. Cates, J. Stat. Phys. 107, 39 (2002).
- (50) See online supplemental material, which contains additional details on the model and additional results complementing those shown in the main text.
- (51) P. Romanczuk, M. Bär, W. Ebeling, B. Lindner, and L. Schimansky-Geier, Eur. Phys. J. Spec. Top. 202, 1 (2012).
- (52) Y. Fily and M. C. Marchetti, Phys. Rev. Lett. 108, 235702 (2012).
- (53) Y. Fily, S. Henkes, and M. C. Marchetti, Soft Matter 10, 2132 (2014).
- (54) K. Kawaguchi, R. Kageyama, and M. Sano, Nature 545, 327 (2017).
- (55) T. B. Saw, A. Doostmohammadi, V. Nier, L. Kocgozlu, S. Thampi, Y. Toyama, P. Marcq, C. T. Lim, J. M. Yeomans, and B. Ladoux, Nature 544, 212 (2017).
- (56) M. J. Bowick and L. Giomi, Adv. Phys. 58, 449 (2009).
- (57) P. Digregorio, D. Levis, A. Suma, L. F. Cugliandolo, G. Gonnella, and I. Pagonabarraga, Phys. Rev. Lett. 121, 098003 (2018).