1 \volnumber1
Spectral Classification of M-dwarf Candidate Stars \hauthorCabello et al.
11email: criscabe@ucm.es 22institutetext: Institute of Physics, Eötvös Loránd University, Pázmány Péter sétány 1/a, 1117 Budapest, Hungary
22email: csornyei.geza@csfk.mta.hu 33institutetext: Konkoly Observatory, Research Centre for Astronomy and Earth Sciences, Konkoly Thege Miklós út 15-17, 1121 Budapest, Hungary 44institutetext: Astronomical Institute, Faculty of Mathematics and Physics, Charles University, V Holešovičkách 2, 180 00 Prague, Czech Republic
44email: jaroslav.merc@gmail.com 55institutetext: Institute of Physics, Faculty of Science, P. J. Šafárik University, Park Angelinum 9, 040 01 Košice, Slovak Republic 66institutetext: Physics department, Lancaster University
LA1 4YW Lancaster, United Kingdom
66email: veronica.ferreiros@gmail.com 77institutetext: Gran Telescopio Canarias (GTC), La Palma, Tenerife, Spain
77email: peter.pessev@gtc.iac.es 88institutetext: Instituto de Astrofísica de Canarias (IAC), La Laguna, Tenerife, Spain 99institutetext: Universidad de La Laguna, Departamento de Astrofísica, La Laguna, Tenerife, Spain
Independent Study and Spectral Classification of a Sample of Poorly Studied High Proper Motion M-dwarf Candidate Stars
Abstract
We report an independent spectral classification of a sample of poorly studied M-dwarf candidate stars observed with the OSIRIS instrument at GTC. Our project was carried out as an independent test of the spectral classification. It is crucial for the studies of extrasolar planets orbiting M-dwarfs, since properties of the host star are directly related to understanding the planet properties and possible habitability. Understanding of the statistical properties of the dwarf stars is also crucial for the Simple Stellar Population models that play a major role in the modern astrophysics. H emission was detected in 33% of the sample with evidence of H variability in one object.
keywords:
M dwarfs – stars1 Introduction
Late-type dwarfs are the least massive (M 0.08 - 0.60 M) and coolest stars (Teff 2300 - 3800 K) on the main sequence. They are the most populous objects in the Galaxy (up to 70% of all stars, Henry et al., 1997), but their observations are difficult due to their low luminosity (L 0.0002 - 0.08 L). Analysis of their physical properties is essential for the characterisation of the population of low-mass stars in the Galaxy. It also has significant impact on the initial mass function (IMF), simple stellar population (SSP) and evolutionary population synthesis (ESP) models. Some red dwarfs are known hosts of extrasollar planets (also of ”super-Earth” size).
These stars evolve very slowly (for trillions of years), moreover red dwarfs with the mass less than 0.35 M are fully convective (Reiners & Basri, 2009) therefore the produced helium is remixed with the material of the star prolonging the time they spend on the main sequence. This is the reason why late-type dwarfs have not reached advanced stages of their evolution yet.
Their spectra are dominated by the absorption molecular bands. Some of them reveal strong magnetic activity (Balmer lines, mainly H in emission).
2 Target selection and instrumental setup
This work is primarily based on optical spectroscopic data obtained with the OSIRIS instrument at Gran Telescopio Canarias (GTC), using Long Slit mode. The configuration was R1000R+GR, covering the wavelength range of 5100 - 10000 Å. Observations were carried out at the parallactic angle trough the 1 arcsecond long slit. The data set was obtained through a queue programme between September 2016 and January 2017 (semester 16B). The basics of the sample selection is relying on the 2MASS color indices (Metodieva et al., 2015) in order to avoid contamination by giant stars or galaxies. A limit of proper motion greater of 0.3 arcseconds/year was imposed in order to separate nearby dwarfs from more distant giants. The sample selection was carried out before GAIA DR1 and the proper motions were mostly derived from 2MASS and ALLWISE with a baseline of the observations between 9 and 13 years. Objects in the range 9 J 16 were selected for the observations since brighter objects are most likely already studied and fainter ones were not suitable for observing within relatively short observing blocks even with GTC.
3 Data reduction
Each obtained spectral frame has been processed with the basic long slit spectroscopy reduction included in IRAF (Tody, 1986). By combining the individual spectra in each observing block, significant amount of the random noise introduced by the cosmic rays have been mitigated. The resulting spectra were sufficient for the type determination, which has been performed with the pyhammer python package (Kesseli et al., 2017). This package determines the spectral type of the object by comparing various spectral templates to the input spectra, then determining the best fitting one with the help of the least square fit method.
4 Results
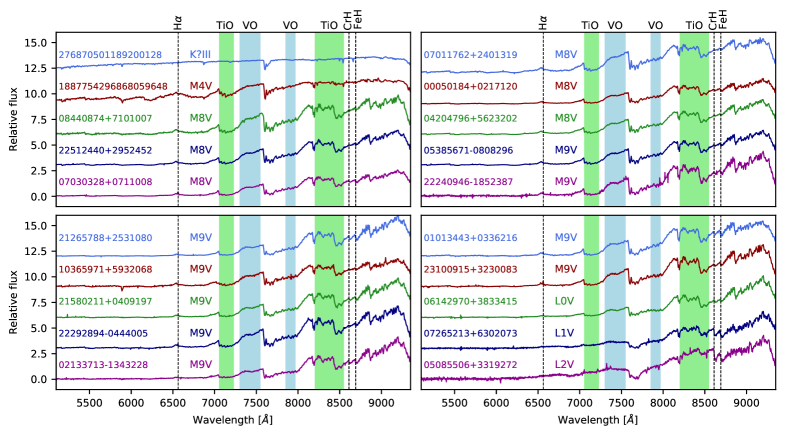
We have analysed a total of 20 spectra: 16 corresponds to M-dwarfs, from types M4 to M9, 3 are classified as early types of L-–dwarfs (L0-L2). The object Gaia DR2 276870501189200128 is a K giant star. Figure 1 shows the spectra for each of our targets111We should note that the K giant and the M4 dwarf, were not primary targets of the observations and their spectra were recorded together with other dwarf stars only by chance.. Oxides molecules like TiO 7053 or VO 7400 bands which dominate the far-optical portions of late M-spectra are replaced by metallic hybrids like FeH 8692 and CrH 8611 or neutral alkalis (doublets Rb I 7800 7948 , Cs I 8521 8943, Na I 5889 5895 ) as the strongest and more significant features in early L-type stars. M-dwarfs can show signals of chromospheric activity and flares. Some studies like Delfosse et al. (1998), Mohanty & Basri (2003) relate high activity with a faster rotation of the star. Schöfer et al. (2019) indicates that stronger magnetic fields in the active stars lead to Zeeman broadening of the individual lines in the band. H is a good indicator of chromospheric activity. According to Cram & Mullan (1979), H goes into deeper absorption for low activity levels and into emission with increasing activity strength. Figure 1 shows H emission specially visible in M stars. Stars in our sample which show a strongest H and consequently a higher level of activity are the M4 Gaia DR2 1887754296868059648, the M8 2MASS J22512440+2952452 and M8 2MASS J08440874+7101007.
We have compiled Gaia photometry (DR2) of our sample of M and L dwarfs. The absolute magnitude was estimated using Gaia parallaxes, reddening map for the interstellar extinction (Schlafly & Finkbeiner, 2011), and extinction coefficients for the Gaia photometric system (Casagrande & VandenBerg, 2018). The Gaia database provides no valid parallax measurement for one star from our sample, 2MASS J03184214+0828002, thus the distance measured for its candidate companion (Luhman et al., 2012) was used for the calculations.

As it is shown in Figure 2, the obtained color-magnitude diagram follows a trend in accordance with the expectations based on the Hertzsprung-Russel diagram. It can also be observed, that the different spectral classes occupy different slices on this diagram, although the applied classification was rather limited given the small amount of incorporated spectral templates in pyhammer. Our results proved that only a limited spectral classification can be done based on the Gaia photometry alone and it should be complemented by spectroscopy.
5 Summary
A spectral classification was carried out for 20 targets: 16 poorly studied M dwarfs, 3 L dwarfs and one K giant star. H emission was detected in 6 objects (33 of the sample) with evidence of H variability in one object. We have compared our spectral classification to Gaia photometry (DR2) concluding that spectral observations are needed for reliable spectral type determination.
Acknowledgements.
The authors would like to acknowledge support from ERASMUS+ grant number 2017-1-CZ01-KA203-035562, and the European Union’s Horizon 2020 research and innovation programme under grant agreement No 730890 (OPTICON).References
- Casagrande & VandenBerg (2018) Casagrande, L. & VandenBerg, D. A., On the use of Gaia magnitudes and new tables of bolometric corrections. 2018, MNRAS, 479, L102, DOI: 10.1093/mnrasl/sly104
- Cram & Mullan (1979) Cram, L. E. & Mullan, D. J., Model chromospheres of flare stars.I. Balmer-line profiles. 1979, ApJ, 234, 579, DOI: 10.1086/157532
- Delfosse et al. (1998) Delfosse, X., Forveille, T., Perrier, C., & Mayor, M., Rotation and chromospheric activity in field M dwarfs. 1998, A&A, 331, 581
- Henry et al. (1997) Henry, T. J., Ianna, P. A., Kirkpatrick, J. D., & Jahreiss, H., The solar neighborhood IV: discovery of the twentieth nearest star. 1997, AJ, 114, 388, DOI: 10.1086/118482
- Kesseli et al. (2017) Kesseli, A., West, A. A., Harrison, B., Veyette, M., & Feldman, D., PyHammer: An Automatic and Visual Suite for Spectral Typing Stars. 2017, in American Astronomical Society Meeting Abstracts, Vol. 229, American Astronomical Society Meeting Abstracts #229, 240.35
- Luhman et al. (2012) Luhman, K. L., Loutrel, N. P., McCurdy, N. S., et al., New M, L, and T Dwarf Companions to Nearby Stars from the Wide-field Infrared Survey Explorer. 2012, ApJ, 760, 152, DOI: 10.1088/0004-637X/760/2/152
- Metodieva et al. (2015) Metodieva, Y., Antonova, A., Golev, V., et al., Low-resolution optical spectra of ultracool dwarfs with OSIRIS/GTC. 2015, MNRAS, 446, 3878, DOI: 10.1093/mnras/stu2370
- Mohanty & Basri (2003) Mohanty, S. & Basri, G., Rotation and Activity in Mid-M to L Field Dwarfs. 2003, ApJ, 583, 451, DOI: 10.1086/345097
- Reiners & Basri (2009) Reiners, A. & Basri, G., On the magnetic topology of partially and fully convective stars. 2009, A&A, 496, 787, DOI: 10.1051/0004-6361:200811450
- Schlafly & Finkbeiner (2011) Schlafly, E. F. & Finkbeiner, D. P., Measuring Reddening with Sloan Digital Sky Survey Stellar Spectra and Recalibrating SFD. 2011, ApJ, 737, 103, DOI: 10.1088/0004-637X/737/2/103
- Schöfer et al. (2019) Schöfer, P., Jeffers, S. V., Reiners, A., et al., The CARMENES search for exoplanets around M dwarfs. Activity indicators at visible and near-infrared wavelengths. 2019, A&A, 623, A44, DOI: 10.1051/0004-6361/201834114
- Tody (1986) Tody, D., The IRAF Data Reduction and Analysis System. 1986, in Proc. SPIE, Vol. 627, Instrumentation in astronomy VI, ed. D. L. Crawford, 733