The Broad-lined Ic Supernova ZTF18aaqjovh (SN 2018bvw):
An Optically Discovered Engine-driven Supernova Candidate with Luminous Radio Emission
Abstract
We present ZTF18aaqjovh (SN 2018bvw), a high-velocity (“broad-lined”) stripped-envelope (Type Ic) supernova (Ic-BL SN) discovered in the Zwicky Transient Facility one-day cadence survey. ZTF18aaqjovh shares a number of features in common with engine-driven explosions: the photospheric velocity and the shape of the optical light curve are very similar to that of the Type Ic-BL SN 1998bw, which was associated with a low-luminosity gamma-ray burst (LLGRB) and had relativistic ejecta. However, the radio luminosity of ZTF18aaqjovh is almost two orders of magnitude fainter than that of SN 1998bw at the same velocity phase, and the shock velocity is at most mildly relativistic (–0.4). A search of high-energy catalogs reveals no compelling gamma-ray burst (GRB) counterpart to ZTF18aaqjovh, and the limit on the prompt GRB luminosity of excludes a classical GRB but not an LLGRB. Altogether, ZTF18aaqjovh represents another transition event between engine-driven SNe associated with GRBs and “ordinary” Ic-BL SNe.
1 Introduction
Broad-lined Type Ic supernovae (Ic-BL SNe) are a subclass of stripped-envelope core-collapse supernovae (CC SNe) characterized by fast ejecta and large kinetic energies. While typical Type Ic SNe have photospheric velocities (measured from Fe II absorption features), Type Ic-BL SNe have at maximum light (Modjaz et al., 2016). The kinetic energy release of Ic-BL SNe is typically (Cano, 2013; Lyman et al., 2016; Prentice et al., 2016), an order of magnitude greater than traditional CC SNe (Woosley & Janka, 2005), although this measurement is highly model-dependent.
A clue to the high energies and fast velocities present in Ic-BL SNe is their connection to long-duration gamma-ray bursts (GRB), reviewed in Woosley & Bloom (2006) , Hjorth & Bloom (2012), and Cano et al. (2017). The association began with the coincident discovery of GRB 980425 and SN 1998bw at Mpc (Galama et al., 1998; Kulkarni et al., 1998). However, GRB 980425 was different from typical GRBs: it was underluminous in -rays ( compared to typical values of –) and subenergetic, with an isotropic equivalent energy four orders of magnitude smaller than that of typical GRBs. Thus, it took the discovery of the cosmological GRB 030329 () in association with SN 2003dh (Hjorth et al., 2003; Stanek et al., 2003) to solidify the relationship between GRBs and SNe.
Since then, SNe accompanying GRBs have been spectroscopically confirmed. All show broad Type Ic-BL features near maximum light, with two exceptions: SN 2011kl had a relatively featureless spectrum, and SN 2013ez more closely resembled a Type Ic (Cano et al., 2017). The GRB-SN association has led to the suggestion that GRBs and Ic-BL SNe are powered by a single central engine (Lazzati et al., 2012; Sobacchi et al., 2017; Barnes et al., 2018). However, a systematic search for radio emission from Ic-BL SNe constrained the fraction harboring a relativistic outflow as bright as that of SN 1998bw to be (Corsi et al., 2016).
Complicating matters, additional underluminous GRBs have been discovered since GRB 980425 and are collectively referred to as low-luminosity GRBs (LLGRBs). LLGRBs are distinguished by isotropic peak luminosities – and a relativistic energy release that is 2–3 orders of magnitude smaller than the from GRBs with fully relativistic outflows (Cano et al., 2017). Due to their lower intrinsic luminosities, LLGRBs are discovered at low redshifts (). Thus, despite the fact that their intrinsic rate might be 10–100 higher than that of classical GRBs (Soderberg et al., 2006; Pian et al., 2006), only seven have been discovered: LLGRB 980425/SN 1998bw, XRF 020903 (Sakamoto et al., 2004; Soderberg et al., 2004a; Bersier et al., 2006), LLGRB 031203/SN 2003lw (Malesani et al., 2004; Soderberg et al., 2004b; Thomsen et al., 2004; Watson et al., 2004), LLGRB 060218/SN 2006aj (Mirabal et al., 2006; Pian et al., 2006; Soderberg et al., 2006), LLGRB 100316D/SN 2010bh (Starling et al., 2011; Bufano et al., 2012), LLGRB 171205A/SN 2017iuk (D’Elia et al., 2018; Wang et al., 2018), and most recently LLGRB 190829A (Chand et al., 2020). LLGRB 060218 and LLGRB 100316D have their own distinct properties: a long -ray prompt emission phase, and long-lived soft X-ray emission that might arise from continued activity of the central engine (Soderberg et al., 2006; Margutti et al., 2013) or dust echoes (Margutti et al., 2015; Irwin & Chevalier, 2016).
Modeling of the radio emission from LLGRBs suggests quasi-spherical ejecta coupled to mildly relativistic material, with no off-axis components (Kulkarni et al., 1998; Soderberg et al., 2006; Pian et al., 2006; Margutti et al., 2013). Thus, it seems that LLGRBs arise from a fundamentally different mechanism to cosmological GRBs. One suggestion is that they represent failed or choked-jet events, and that the gamma rays arise from shock breakout. This is supported by the early light curve of the LLGRB 060218, whose double peak in ultraviolet and optical filters has been modeled as shock breakout into a dense stellar wind (Campana et al., 2006) or into an extended envelope (Nakar, 2015). Another possibility is that the prompt emission is from a successful low-luminosity jet (Irwin & Chevalier, 2016).
A major focus of scientific investigation over the past 20 years has been to unify this diverse array of phenomena: “extreme” SNe with successful, observed jets (classical GRBs), mildly relativistic explosions (LLGRBs or radio-emitting SNe), and ordinary (nonrelativistic) SNe. The traditional avenue to discovering central engines – the detection of a GRB – is severely limited because a number of conditions must be met for a central engine to produce a GRB. First, the jet must be nearly baryon-free—else the available energy is insufficient to accelerate the ejecta to ultrarelativistic velocities, and gamma-ray emission will be stifled by pair-production (Piran, 2004). Next, the jet must successfully escape the star without being choked by the stellar envelope (MacFadyen et al., 2001). Finally, the jet must be directed at Earth.
Today, wide-field optical time-domain surveys have the field of view and cadence to discover engine-driven explosions without relying on a high-energy trigger (e.g. Corsi et al. 2017). Radio observations are central to this effort, because they trace the fastest-moving ejecta. The Zwicky Transient Facility (ZTF; Bellm et al. 2019a; Graham et al. 2019) is conducting several different surveys (Bellm et al., 2019) using a custom mosaic camera (Dekany et al., 2016) on the 48 inch Samuel Oschin Telescope (P48) at the Palomar Observatory. ZTF discovers one Ic-BL SN per month, and we are conducting a follow-up campaign of a subset of these events with the Karl G. Jansky Very Large Array (VLA; Perley et al. 2011). Here, we present our first detection of radio emission from the Ic-BL ZTF18aaqjovh (SN 2018bvw). In Section 2 we describe our optical, radio, and X-ray observations, as well as our search for contemporaneous gamma-ray emission. In Section 3 we constrain the physical properties of the explosion (energy, velocity, and ejecta mass). We present our conclusions in Section 4.
Throughout the paper we use the CDM cosmology from Planck Collaboration et al. (2016).
2 Observations
2.1 Zwicky Transient Facility Discovery
ZTF images are processed and reference-subtracted by the IPAC ZTF pipeline (Masci et al., 2019) using the method described in Zackay et al. (2016), and every 5 point-source detection is saved as an “alert.” Alerts are distributed in Apache Avro format (Patterson et al., 2019) and can be filtered based on a machine-learning real-bogus metric (Duev et al., 2019; Mahabal et al., 2019), host characteristics (including a star-galaxy classifier; Tachibana & Miller 2018111In this context TM18 define star as an unresolved point source and galaxy as an extended unresolved source), and light-curve properties. The ZTF collaboration uses a web-based system called the GROWTH marshal (Kasliwal et al., 2019) to identify, monitor, and coordinate follow-up observations for transients of interest.
ZTF18aaqjovh was discovered in an image obtained on 2018 May 5 UT as part of the ZTF one-day cadence survey, which covers 3000 in two visits (one , one ) per night (Bellm et al., 2019). The alert passed two filters, as part of two systematic surveys being conducted by ZTF: a filter for transients in the local universe that cross-matches sources with a catalog of nearby galaxies (Cook et al., 2019), and a filter for bright transients (Fremling et al., 2019b). Because it passed these filters, the source was reported to the Transient Name Server (TNS222https://wis-tns.weizmann.ac.il; Fremling & Taggart 2018) and received the designation SN 2018bvw. After being reported, it was spectroscopically classified (Section 2.2; Fremling et al. 2019a).
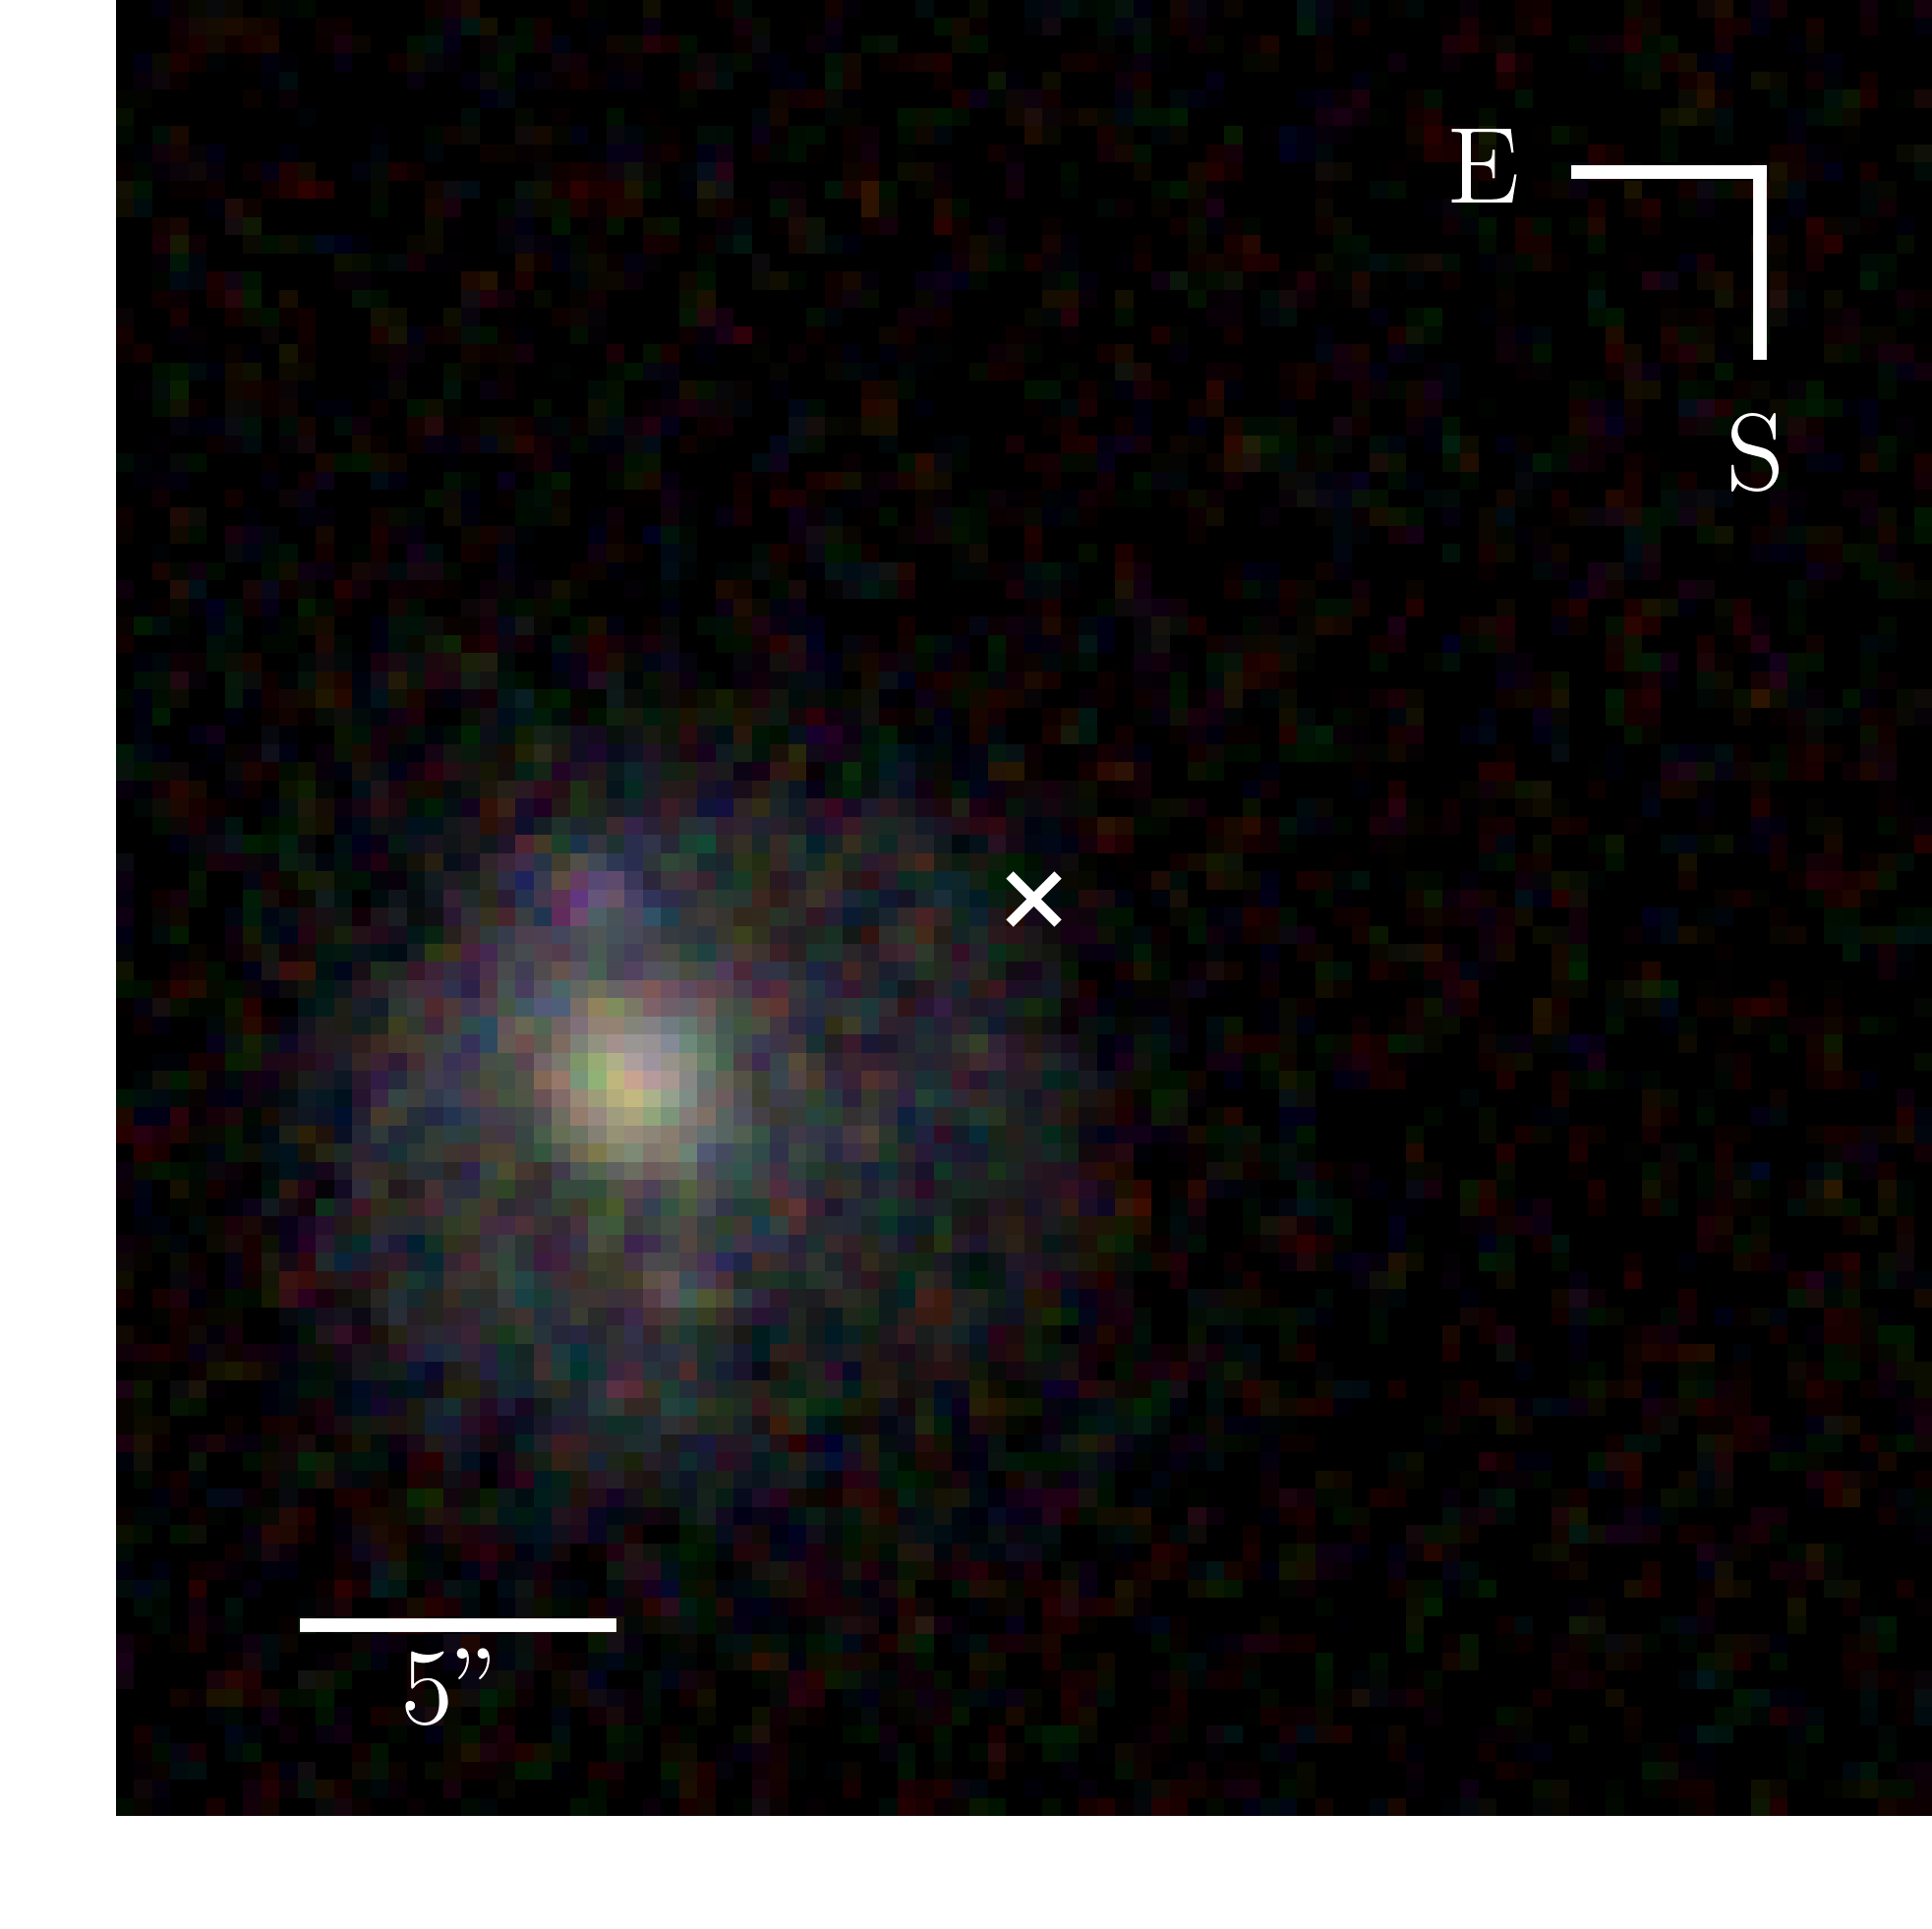
The discovery magnitude was mag, where the error bar is a 1 estimate of the background RMS, derived using a pixel-uncertainty map created for the difference image (Masci et al., 2019). The source position was measured to be , (J2000). The position is 4.71″ from SDSS J115244.11+254027.1, a star-forming galaxy at (248.85 ; Alam et al. 2015). The transient position with respect to the host galaxy is shown in Figure 1, with the host galaxy image constructed from SDSS -, -, and -band cutouts using the method in Lupton et al. (2004). At this distance, the projected offset between ZTF18aaqjovh and the center of the host corresponds to kpc. This offset is larger than the typical offset of Ic-BL SNe accompanied by GRBs, which is kpc (1 confidence), and more consistent with the offsets of Ic-BL SNe without detected GRBs, measured to be kpc (Japelj et al., 2018).
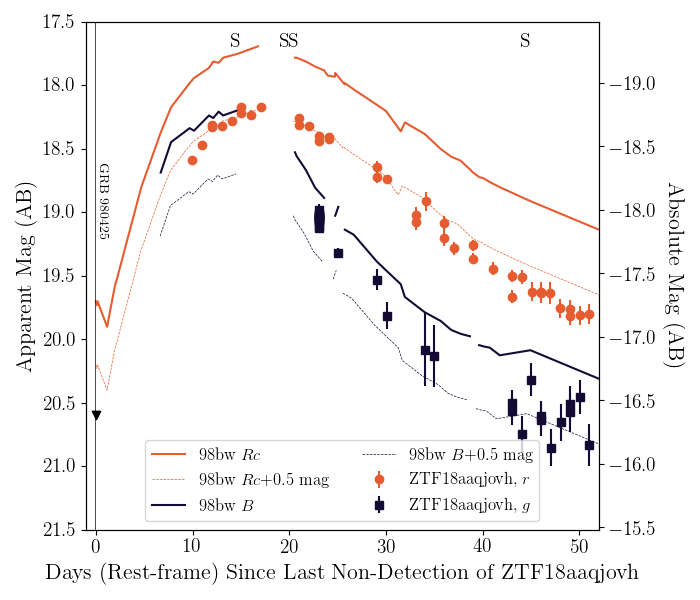
The full light curve, corrected for Milky Way extinction, is provided in Table 1 and shown in Figure 2. The P48 measurements come from forced photometry (Yao et al., 2019). The -band reference image was constructed from data taken between 2018 April 22 and 2018 May 16, so we had to subtract a baseline flux to account for SN light in the reference. To calculate the baseline flux, we measured the mean flux of photometry in images where the SN light was not present: a set of images at and a set of images at . We confirmed that this baseline level was consistent, i.e. that by 400 the SN light had returned to a level consistent with the pre-explosion level.
We obtained two epochs of photometry from the Spectral Energy Distribution Machine (SEDM; Blagorodnova et al. 2018; Rigault et al. 2019) mounted on the automated 60 inch telescope at Palomar (P60; Cenko et al. 2006). Digital image subtraction and photometry for the SEDM was performed using the Fremling Automated Pipeline (FPipe; Fremling et al. 2016). Fpipe performs calibration and host subtraction against SDSS reference images and catalogs (Ahn et al., 2014).
The peak -band absolute magnitude is typical of Ic-BL light curves compiled from untargeted surveys (Taddia et al., 2019), and the light curve of ZTF18aaqjovh is very similar in shape to the light curve of SN 1998bw (Figure 2). Assuming that the time from explosion to peak is the same in ZTF18aaqjovh as in SN 1998bw, we can estimate that the explosion time is about the time of the last nondetection, 2018 April 25 UT. The optical spectra of ZTF18aaqjovh (Section 2.2) suggest that this is accurate to within a few days: the spectrum of ZTF18aaqjovh on May 9 was most similar to that of SN 1998bw at 16 post-explosion. With this , the first detection of ZTF18aaqjovh by ZTF was at days. Throughout the paper, we use this definition of and report all times with respect to this reference point.
| Date | Instr. | Filt. | Mag | |
|---|---|---|---|---|
| (MJD) | (days) | (AB) | ||
| 58217.239572 | -15.94 | P48 | ||
| 58217.240521 | -15.94 | P48 | ||
| 58217.262072 | -15.91 | P48 | ||
| 58218.257859 | -14.92 | P48 | ||
| 58219.216238 | -13.96 | P48 | ||
| 58219.262523 | -13.91 | P48 | ||
| 58221.255984 | -11.92 | P48 | ||
| 58222.259039 | -10.92 | P48 | ||
| 58224.218553 | -8.96 | P48 | ||
| 58224.226030 | -8.95 | P48 | ||
| 58224.233669 | -8.94 | P48 | ||
| 58224.324641 | -8.85 | P48 | ||
| 58227.250903 | -5.93 | P48 | ||
| 58231.276227 | -1.90 | P48 | ||
| 58233.175208 | -0.00 | P48 | ||
| 58233.176146 | 0.00 | P48 | ||
| 58243.170324 | 9.99 | P48 | ||
| 58244.170880 | 10.99 | P48 | ||
| 58245.171447 | 12.00 | P48 | ||
| 58245.172384 | 12.00 | P48 | ||
| 58246.233762 | 13.06 | P48 | ||
| 58247.234363 | 14.06 | P48 | ||
| 58247.358800 | 14.18 | P60 | r | |
| 58248.235324 | 15.06 | P48 | ||
| 58248.236250 | 15.06 | P48 | ||
| 58248.335300 | 15.16 | P60 | r | |
| 58249.234444 | 16.06 | P48 | ||
| 58250.234803 | 17.06 | P48 | ||
| 58254.191401 | 21.02 | P48 | ||
| 58254.192338 | 21.02 | P48 | ||
| 58255.238356 | 22.06 | P48 | ||
| 58256.217651 | 23.04 | P48 | ||
| 58256.218113 | 23.04 | P48 | ||
| 58256.218565 | 23.04 | P48 | ||
| 58256.219028 | 23.04 | P48 | ||
| 58256.219479 | 23.04 | P48 | ||
| 58256.219942 | 23.04 | P48 | ||
| 58256.220393 | 23.04 | P48 | ||
| 58256.220845 | 23.04 | P48 | ||
| 58256.221308 | 23.05 | P48 | ||
| 58256.221759 | 23.05 | P48 | ||
| 58256.222222 | 23.05 | P48 | ||
| 58256.222674 | 23.05 | P48 | ||
| 58256.223125 | 23.05 | P48 | ||
| 58256.223588 | 23.05 | P48 | ||
| 58256.244317 | 23.07 | P48 | ||
| 58256.278032 | 23.10 | P48 | ||
| 58257.232951 | 24.06 | P48 | ||
| 58257.233877 | 24.06 | P48 | ||
| 58258.168634 | 24.99 | P48 | ||
| 58262.202593 | 29.03 | P48 | ||
| 58262.220127 | 29.04 | P48 | ||
| 58262.252870 | 29.08 | P48 | ||
| 58263.235185 | 30.06 | P48 | ||
| 58263.259248 | 30.08 | P48 | ||
| 58266.250648 | 33.07 | P48 | ||
| 58266.251562 | 33.08 | P48 | ||
| 58267.185671 | 34.01 | P48 | ||
| 58267.290174 | 34.11 | P48 | ||
| 58268.167917 | 34.99 | P48 | ||
| 58269.185035 | 36.01 | P48 | ||
| 58269.185972 | 36.01 | P48 | ||
| 58270.173681 | 37.00 | P48 | ||
| 58272.184954 | 39.01 | P48 | ||
| 58272.185880 | 39.01 | P48 | ||
| 58274.198912 | 41.02 | P48 | ||
| 58274.234641 | 41.06 | P48 | ||
| 58276.198576 | 43.02 | P48 | ||
| 58276.199502 | 43.02 | P48 | ||
| 58276.213970 | 43.04 | P48 | ||
| 58276.214907 | 43.04 | P48 | ||
| 58277.193495 | 44.02 | P48 | ||
| 58277.243113 | 44.07 | P48 | ||
| 58278.194016 | 45.02 | P48 | ||
| 58278.237199 | 45.06 | P48 | ||
| 58279.171516 | 46.00 | P48 | ||
| 58279.187500 | 46.01 | P48 | ||
| 58279.207593 | 46.03 | P48 | ||
| 58279.208530 | 46.03 | P48 | ||
| 58280.174988 | 47.00 | P48 | ||
| 58280.227755 | 47.05 | P48 | ||
| 58281.194468 | 48.02 | P48 | ||
| 58281.237141 | 48.06 | P48 | ||
| 58282.193773 | 49.02 | P48 | ||
| 58282.194699 | 49.02 | P48 | ||
| 58282.243113 | 49.07 | P48 | ||
| 58282.244039 | 49.07 | P48 | ||
| 58283.215544 | 50.04 | P48 | ||
| 58283.237836 | 50.06 | P48 | ||
| 58284.203982 | 51.03 | P48 | ||
| 58284.214236 | 51.04 | P48 |
2.2 Spectral Classification
A log of our spectroscopic follow-up observations of ZTF18aaqjovh is provided in Table 2.
On 2018 May 9 UT we obtained a spectrum of ZTF18aaqjovh using the SEDM and compared it to a set of spectral templates from the publicly available Supernova Identification code (SNID; Blondin & Tonry 2007). The best match was to a spectrum of SN 1998bw taken at 16 days post-explosion. As shown in Figure 2, a comparison with the light curve of SN 1998bw suggests that these two spectra were obtained at comparable phases. So, we classified ZTF18aaqjovh as Type Ic-BL.
On 2018 May 14 UT, we observed ZTF18aaqjovh using the Low Resolution Imaging Spectrometer (Oke et al., 1995) on the Keck I 10m telescope. The spectrum was reduced and extracted using LPipe (Perley, 2019). The next day, we observed the source using the Andalusia Faint Object Spectrograph and Camera (ALFOSC333http://www.not.iac.es/instruments/alfosc/) on the Nordic Optical Telescope (NOT; Djupvik & Andersen 2010). The NOT spectrum was reduced in a standard way, including wavelength calibration against an arc lamp, and flux calibration using a spectrophotometric standard star. We obtained another spectrum on 2018 June 8 UT using the Double Beam Spectrograph (DBSP; Oke & Gunn 1982) on the 200 inch Hale telescope at the Palomar Observatory. The DBSP spectrum was reduced using a PyRAF-based pipeline (Bellm & Sesar, 2016). We obtained a final spectrum one month later using LRIS.
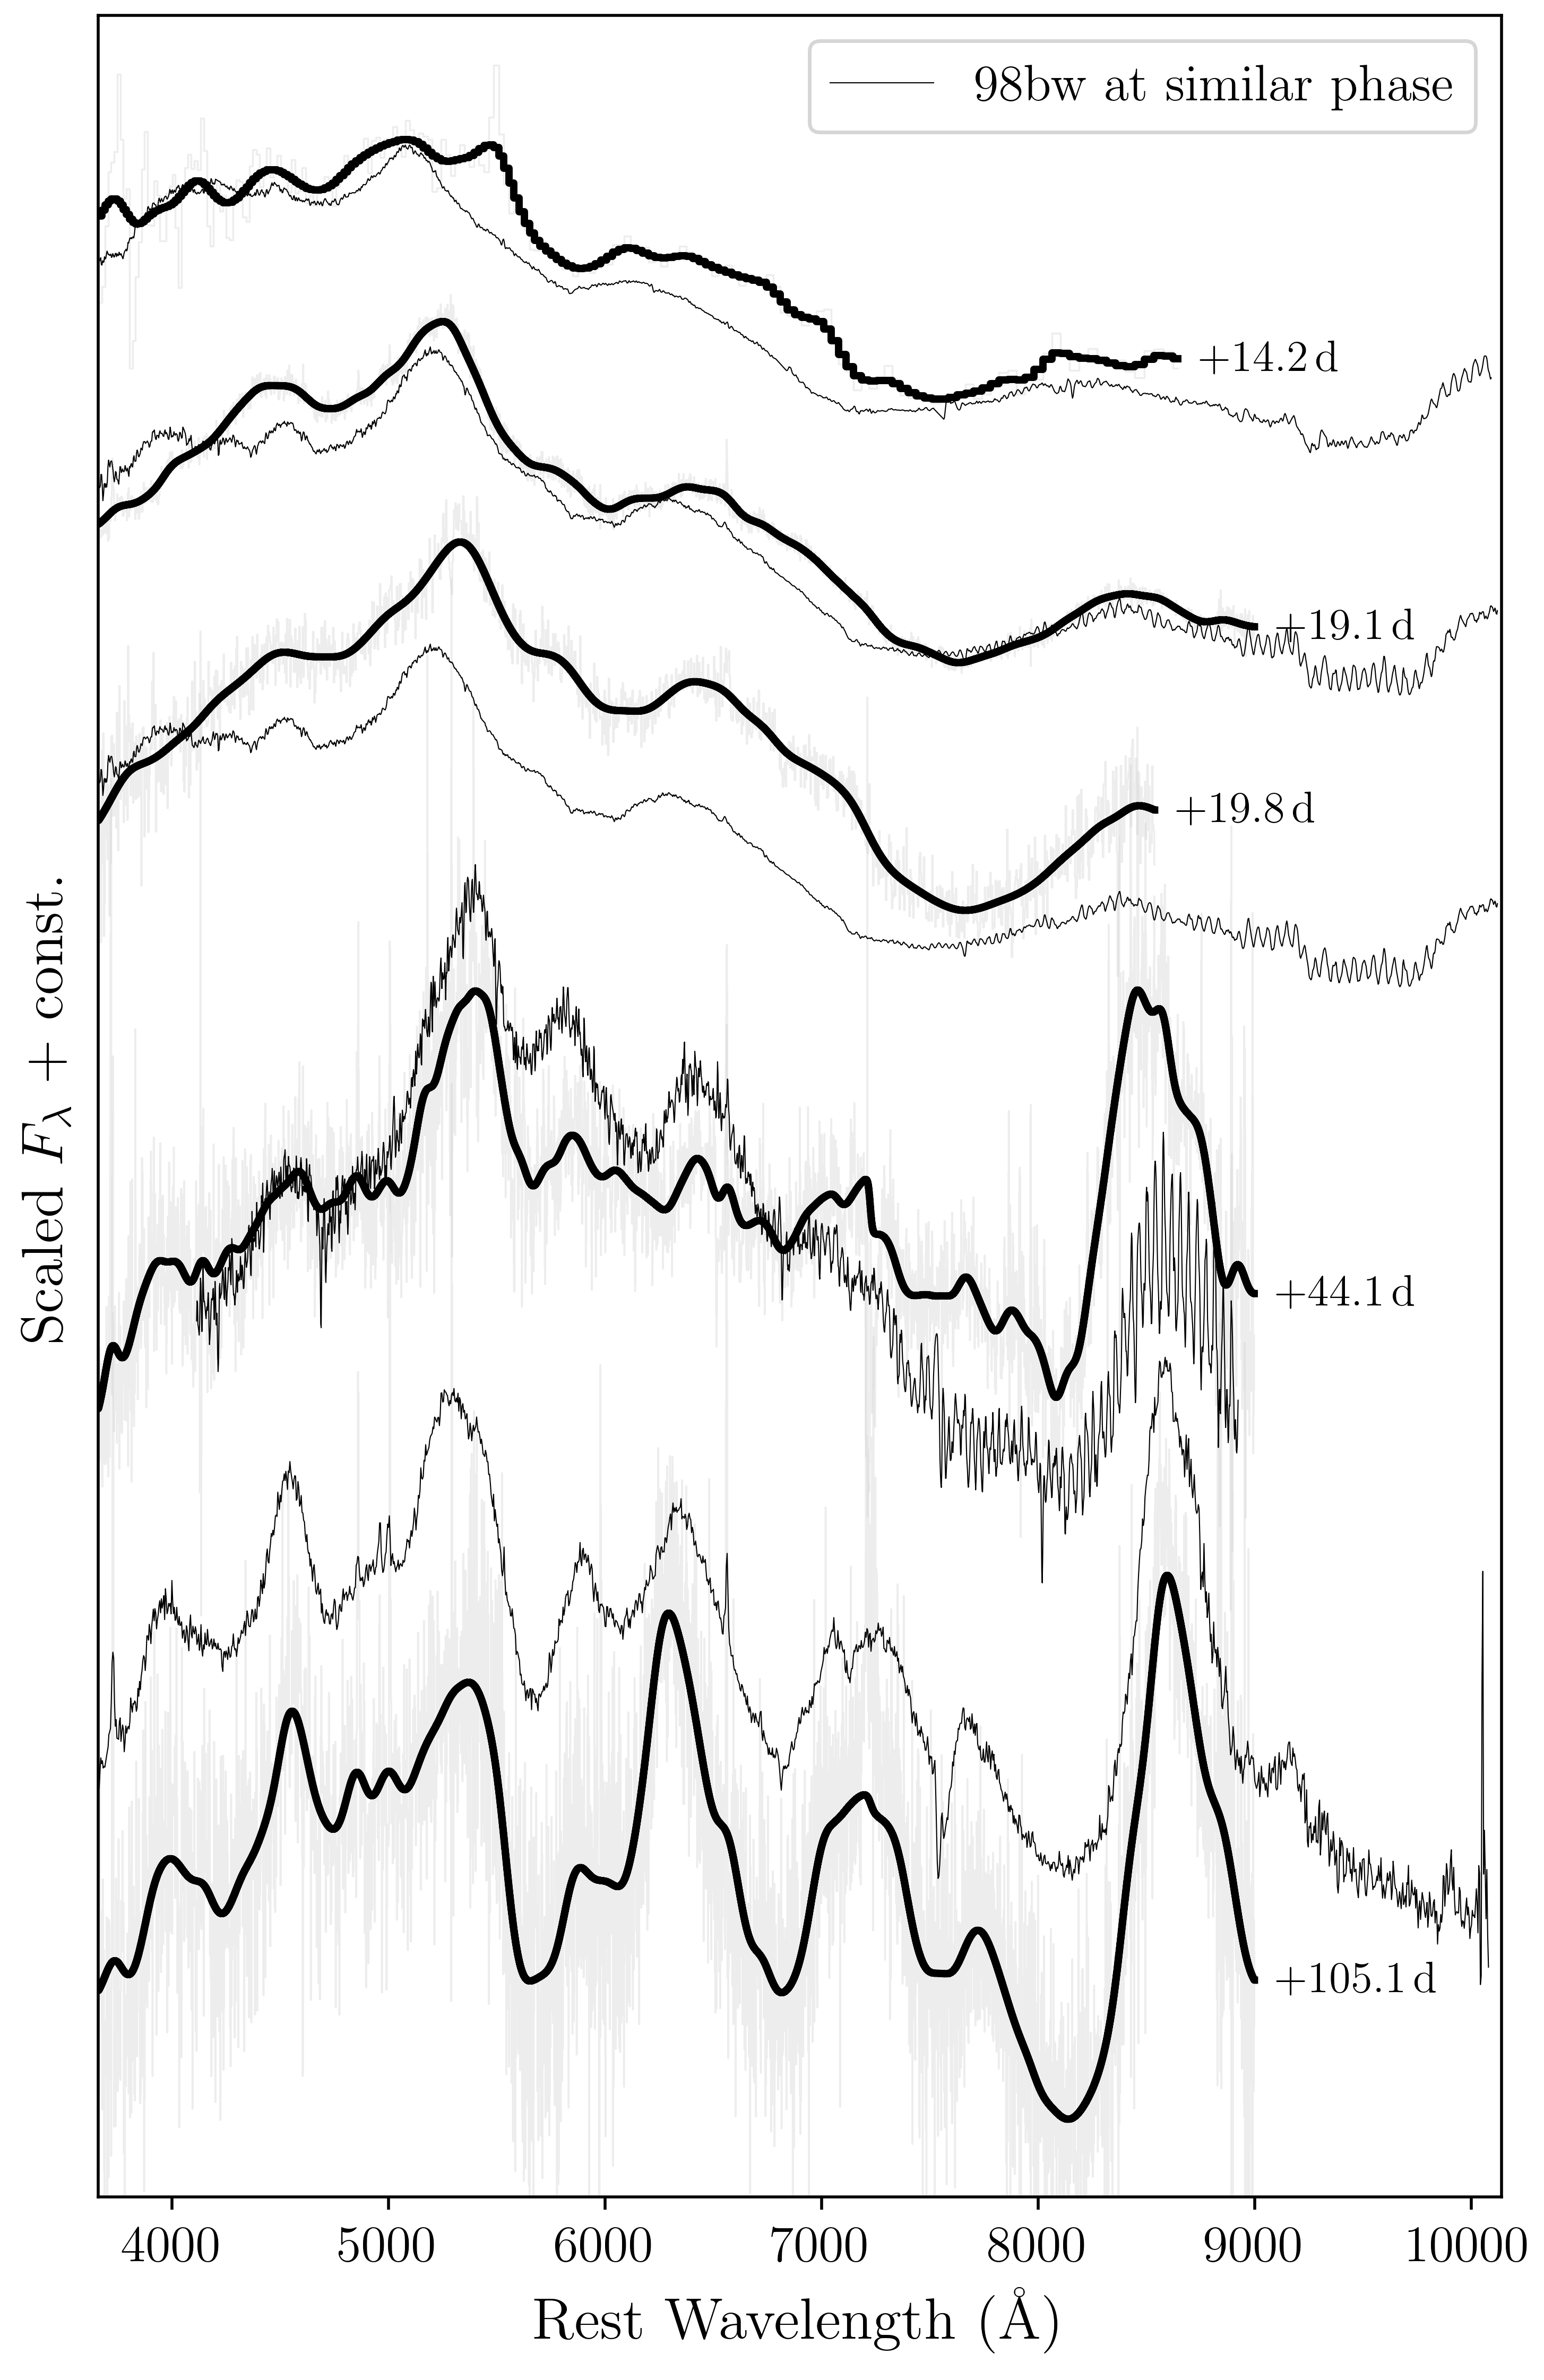
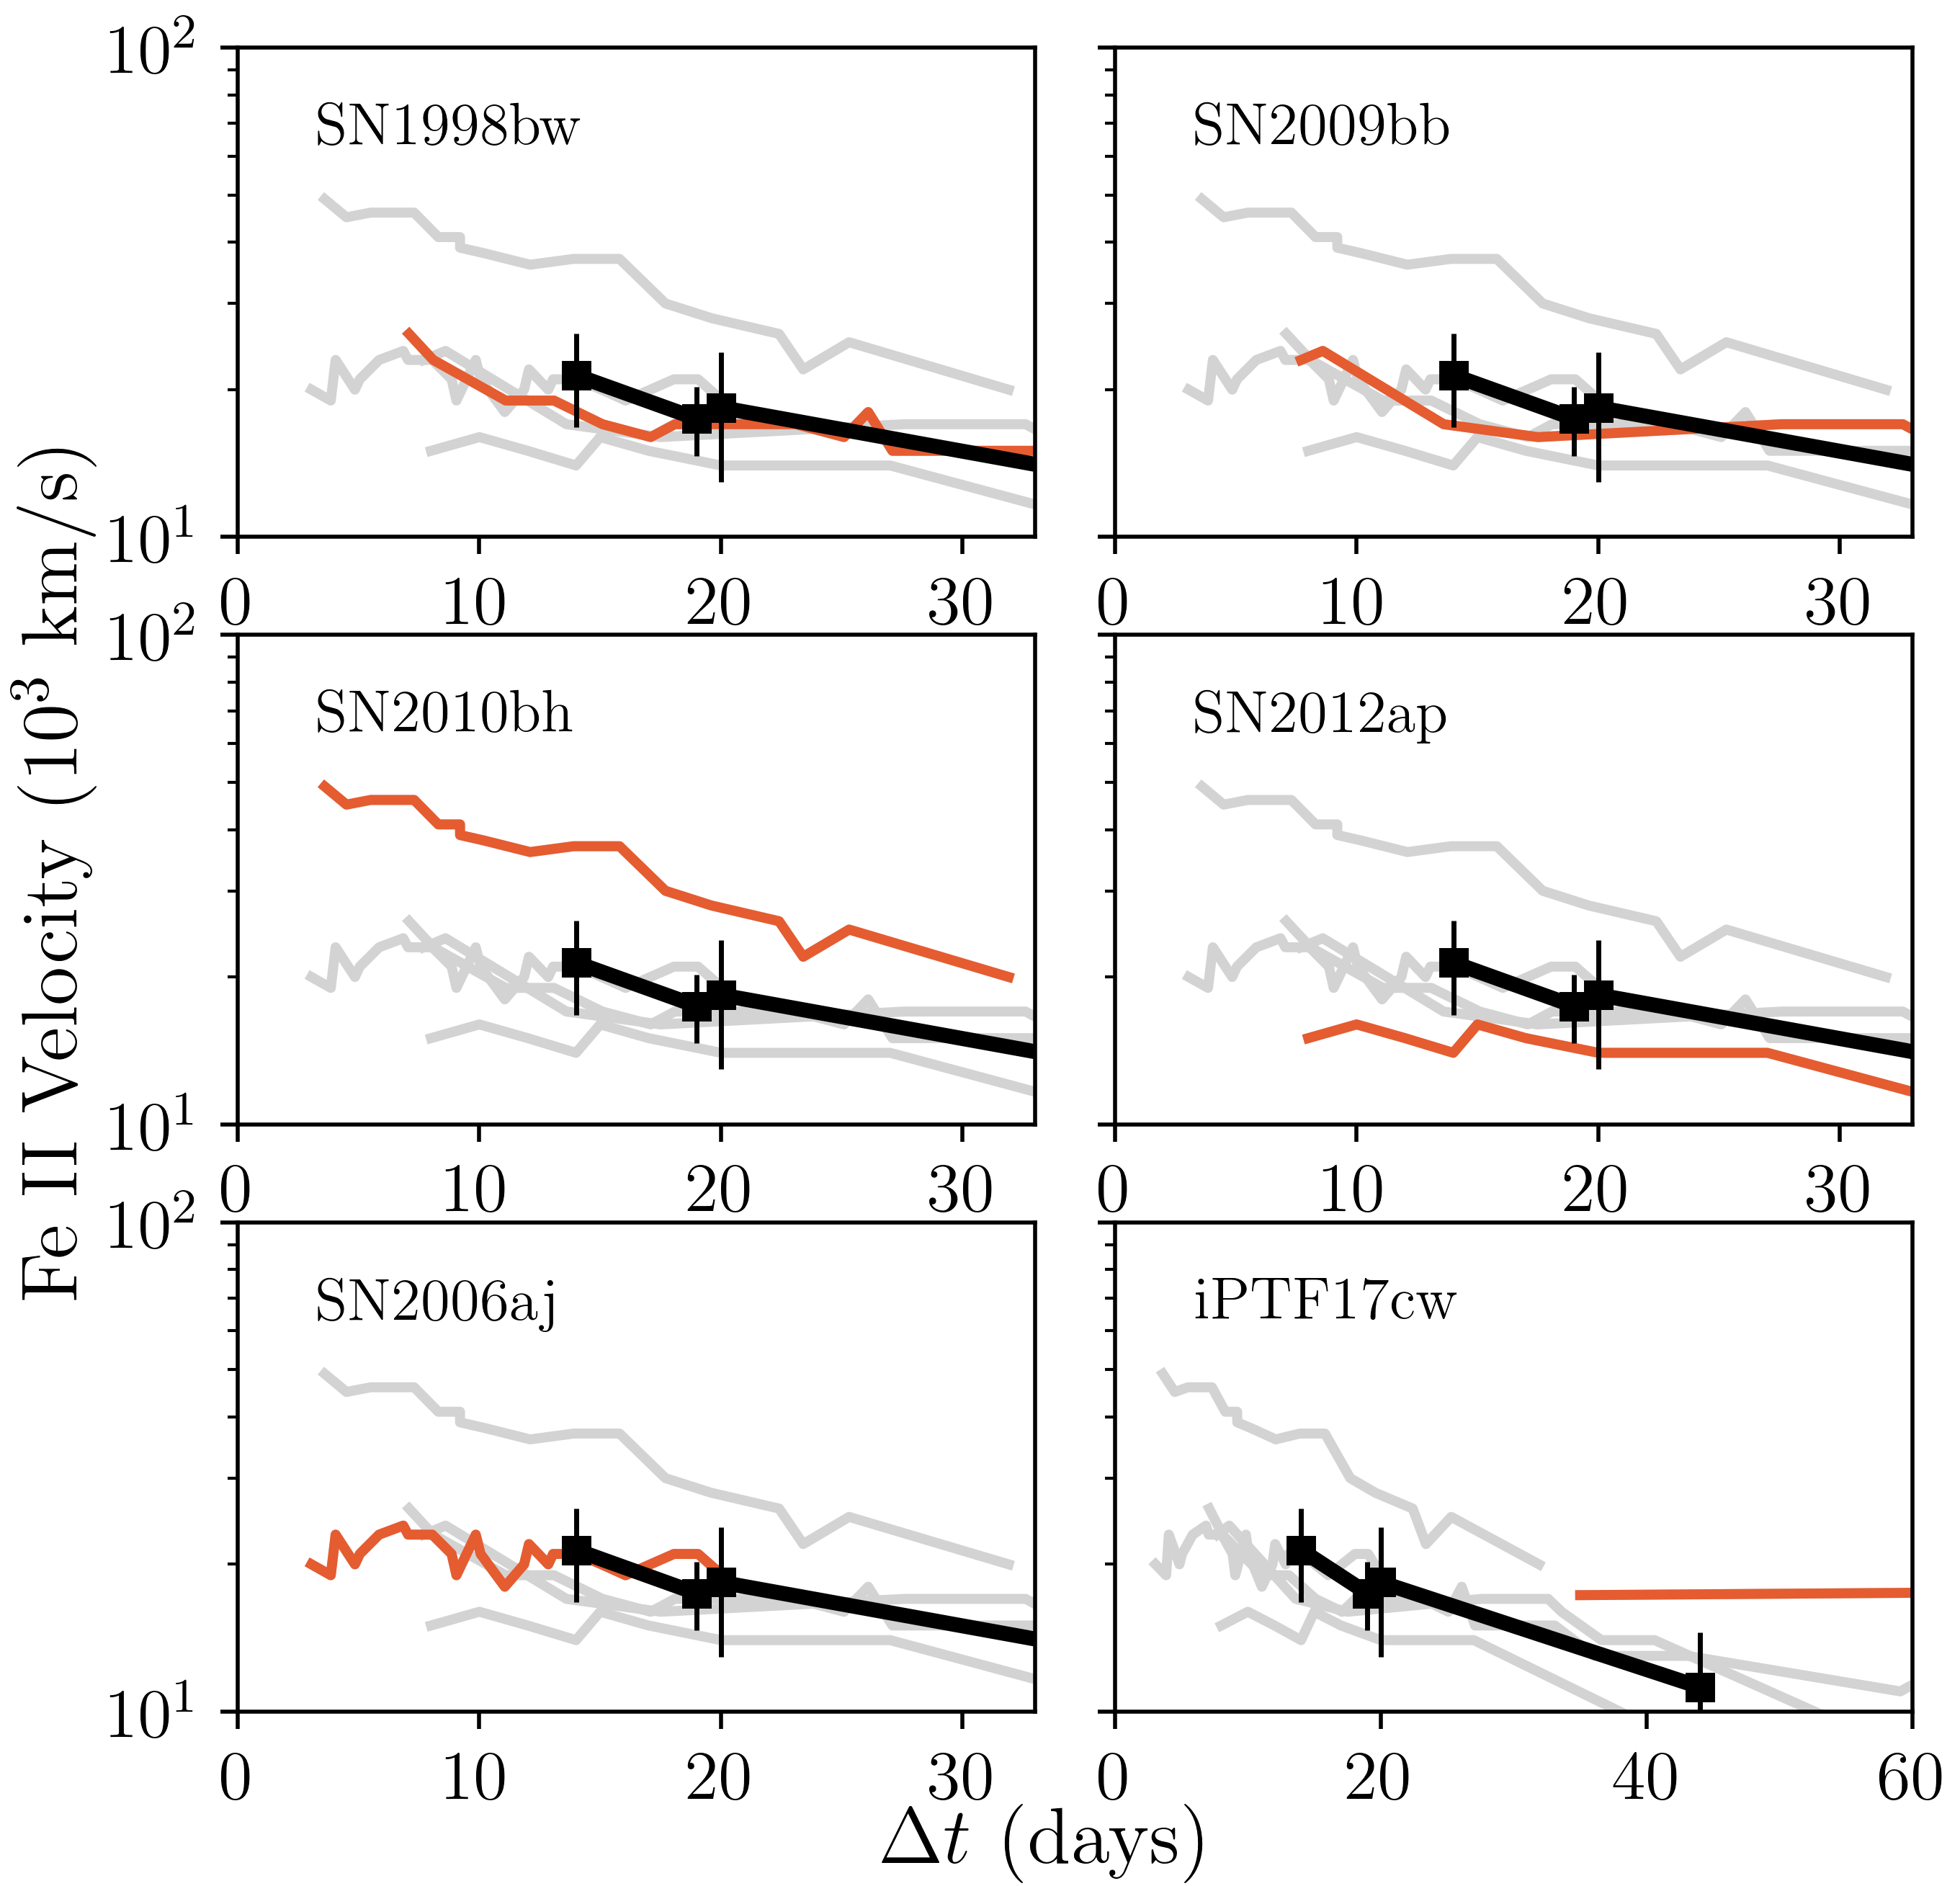
The spectral sequence obtained via our follow-up for ZTF18aaqjovh is shown in Figure 3, compared to spectra of SN 1998bw at similar phases post-explosion. We used our spectra to estimate the photospheric velocity of ZTF18aaqjovh as a function of time. In typical Ic SNe, photospheric velocity is measured using the width of the Fe II 5169 line (e.g., Branch et al. 2002). However, due to the high velocities in Ic-BL SNe, the Fe II 5169 line is blended with the nearby Fe II 4924,5018 lines. So, to perform our velocity measurements, we use the publicly available code444https://github.com/nyusngroup/SESNspectraLib based on the method in Modjaz et al. (2016), which convolves a Ic spectrum with Gaussian functions of varying widths until a best match is reached. For the SEDM measurements, we subtracted the contribution to the velocity from the resolution of the spectrograph, assuming that and that . The resulting velocities are listed in Table 2, and we show the velocity evolution compared to other Ic-BL SNe in Figure 4.
| Date | Tel.+Instr. | Exp. Time | ||
|---|---|---|---|---|
| (MJD) | (days) | (s) | () | |
| 58247.359 | 14 | P60+SEDM | 1800 | |
| 58252.322 | 19 | Keck I+LRIS | 920 | |
| 58253.977 | 20 | NOT+ALFOSC | 2400 | |
| 58277.253 | 44 | P200+DBSP | 2700 | |
| 58338.249 | 105 | Keck I+LRIS | 1720 | N/A |
2.3 Radio Observations
Upon classifying ZTF18aaqjovh as a Type Ic-BL SN (Section 2.2) we triggered the VLA for radio follow-up observations under the program VLA/18A-176 (PI: A. Corsi). A log of our observations is provided in Table 3.
We observed the field of ZTF18aaqjovh with the VLA over several epochs using the S, C, and Ku bands. We used J1150+2417 as our complex gain calibrator, and 3C286 as our flux density and bandpass calibrator. Data were calibrated using the VLA calibration pipeline available in the Common Astronomy Software Applications (CASA; McMullin et al. 2007). After calibration, we inspected the data manually for further flagging. Images of the field were created using the CLEAN algorithm (Högbom, 1974) available in CASA.
In our VLA images, we found a radio point source consistent with the optical position of ZTF18aaqjovh. Although the radio emission from this source remained fairly constant during the three epochs of our monitoring in C-band (see Table 3), its transient nature was confirmed by a nondetection about days after the SN optical discovery. The radio peak flux densities are reported in Table 3. Flux density errors are calculated as the quadrature sum of the image RMS and a fractional absolute flux calibration error.
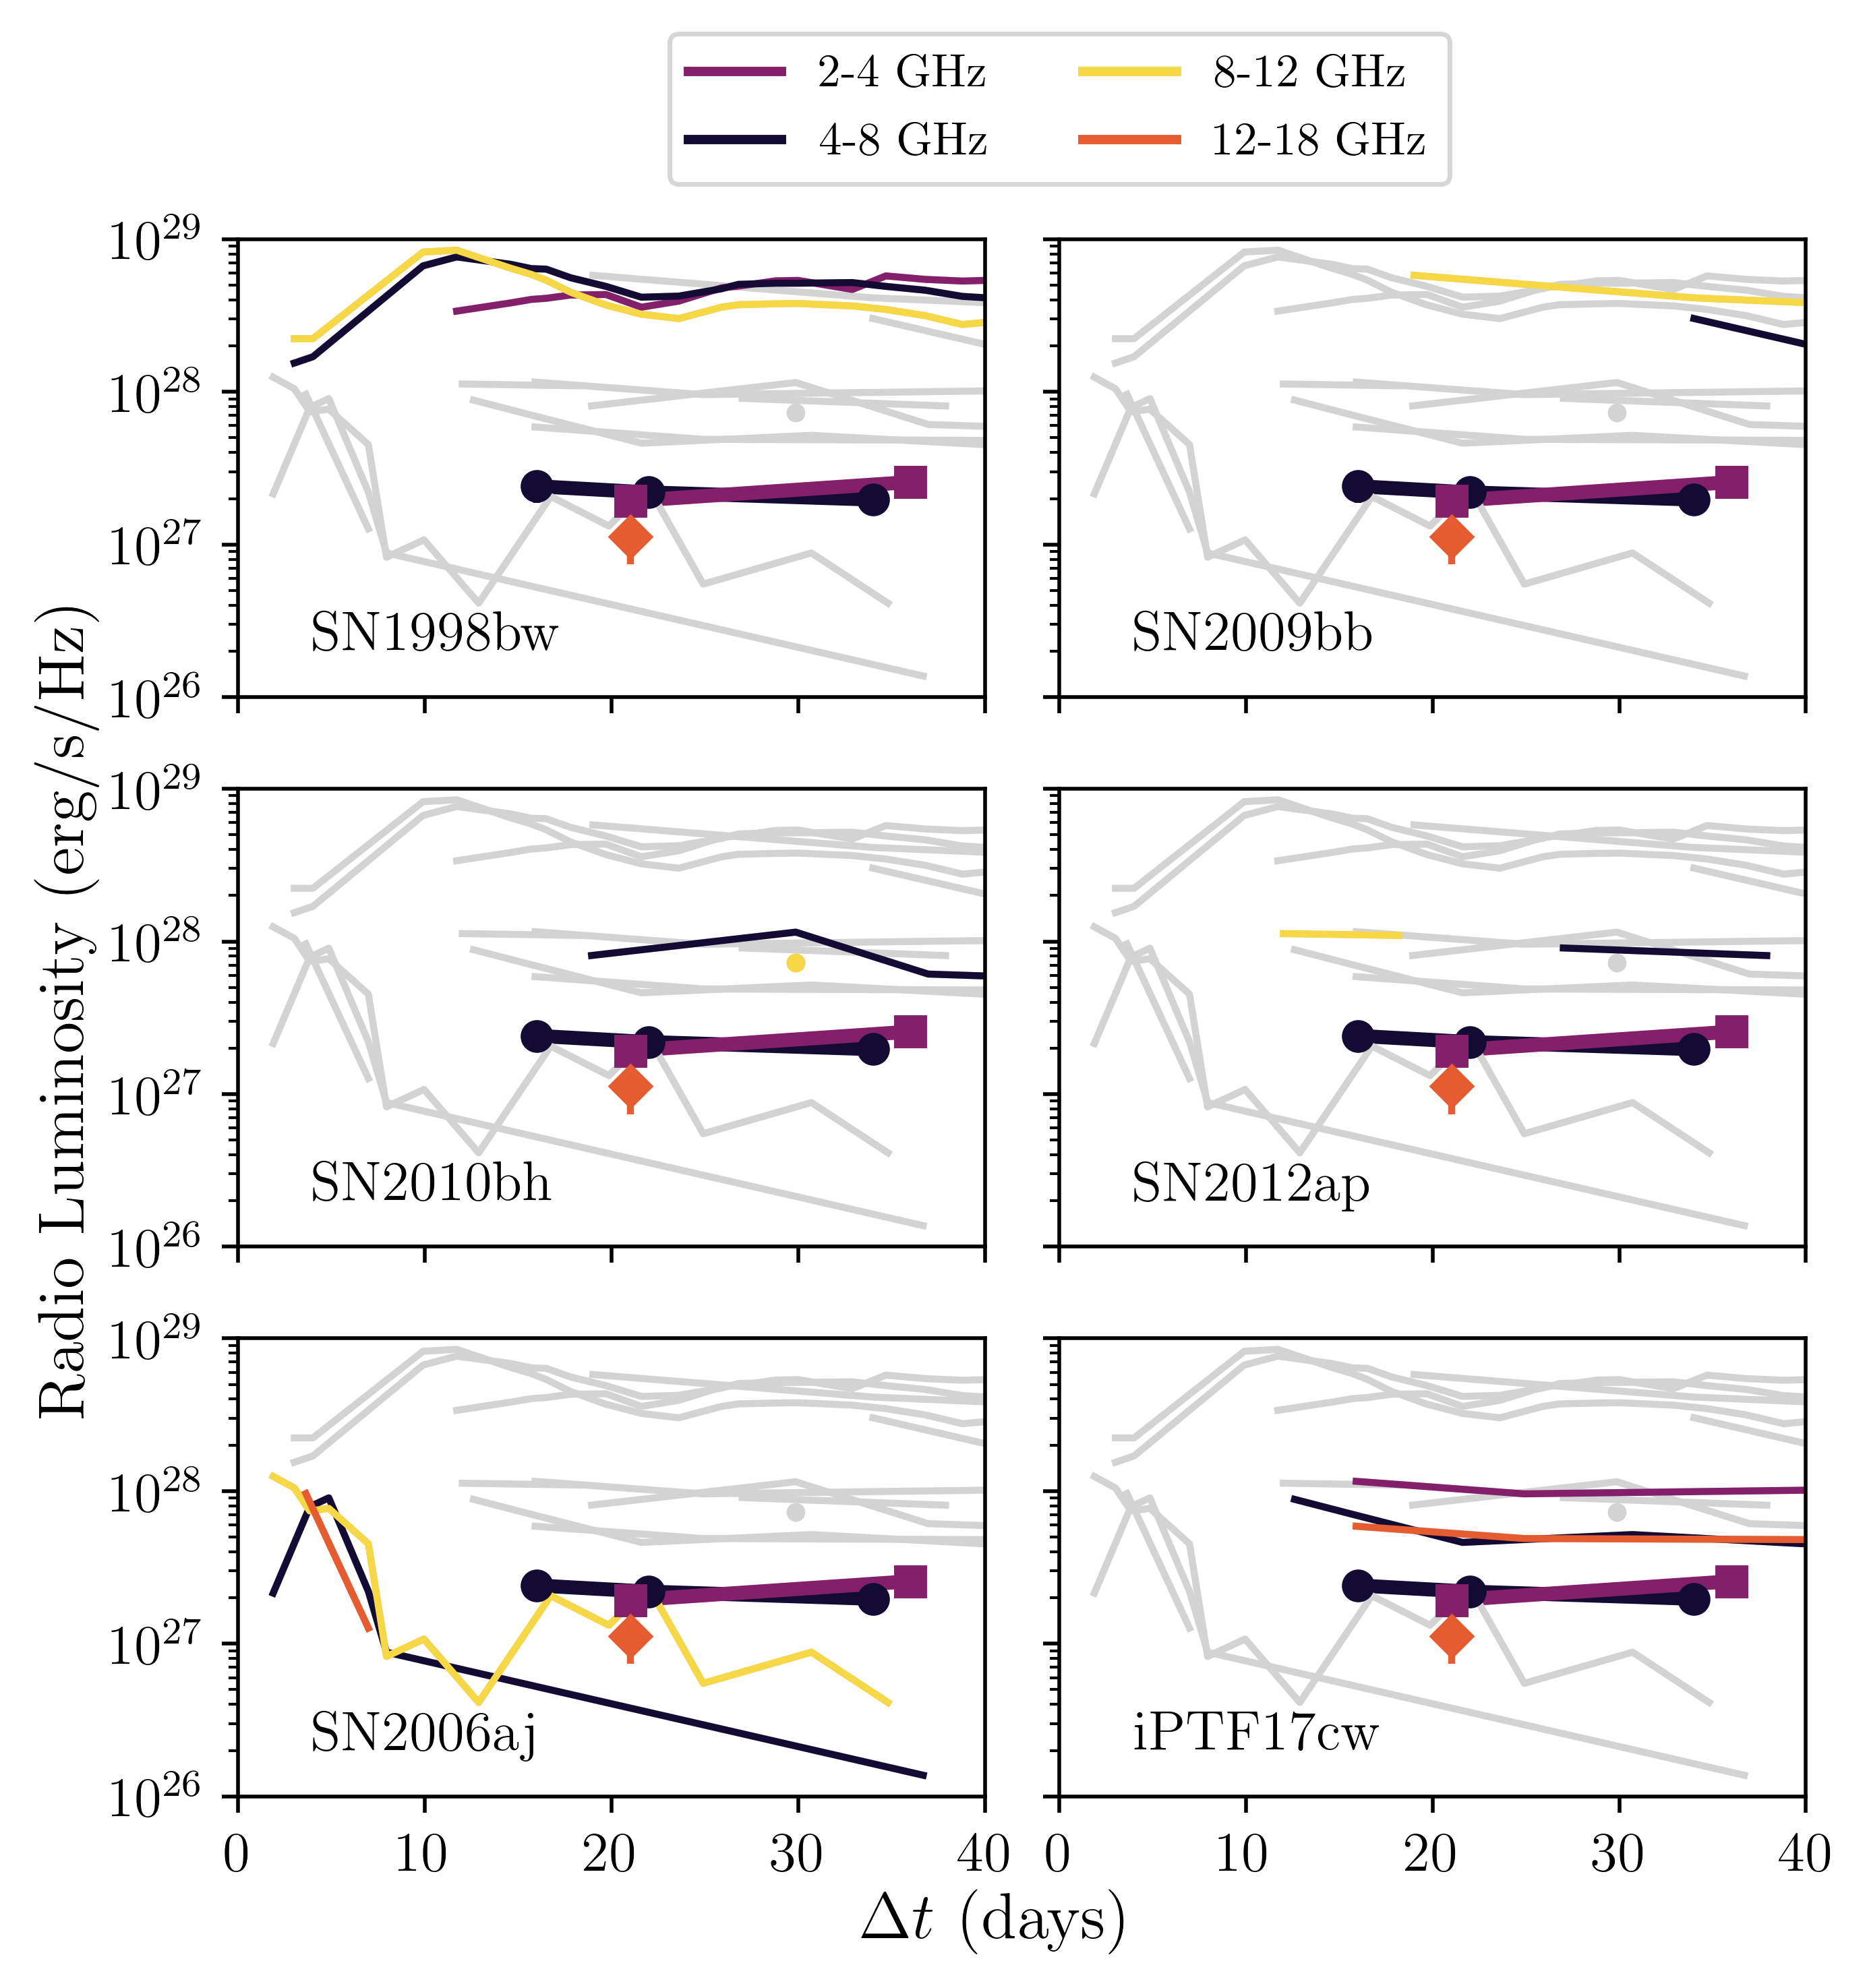
The radio light curve of ZTF18aaqjovh is shown in Figure 5, compared to several other Ic-BL SNe. At the distance of ZTF18aaqjovh, the 6 radio luminosity density at since explosion is . This is over an order of magnitude fainter than SN 1998bw at a similar epoch, and most similar to the luminosity of iPTF17cw at similar frequencies.
| Start Date | Time on-source | Array Config. | ||||
|---|---|---|---|---|---|---|
| (UT) | (hr) | (days) | Jy) | Jy) | Jy) | |
| 2018 May 11 | 0.67 | 16 | – | – | A | |
| 2018 May 16 | 0.67 | 21 | – | A | ||
| 2018 May 17 | 0.67 | 22 | – | – | A | |
| 2018 May 29 | 0.67 | 34 | – | – | A | |
| 2018 May 31 | 1.5 | 36 | – | – | A | |
| 2019 Jan 26 | 1.5 | 276 | – | – | C |
2.4 X-Ray Observations
A log of our X-ray observations is provided in Table 4.
On 2018 May 31 UT, we obtained a 2.5 ks target-of-opportunity observation of the position of ZTF18aaqjovh with the X-ray Telescope (XRT) on board the Neil Gehrels Swift Observatory (Burrows et al., 2005). We built the XRT light curve using the online generator (Evans et al., 2009). On the web form555https://www.swift.ac.uk/user_objects/, we used the default values except for Try to centroid?, which was set to No. The source was not detected with a 3 upper limit of cps. To convert the upper limit from count rate to flux, we assumed a Galactic neutral hydrogen column density666https://heasarc.gsfc.nasa.gov/cgi-bin/Tools/w3nh/w3nh.pl of and a power-law spectrum where is flux (photons ), is energy, and is the photon index. This gives an unabsorbed upper-limit on the 0.3–10 flux of , corresponding to a luminosity of .
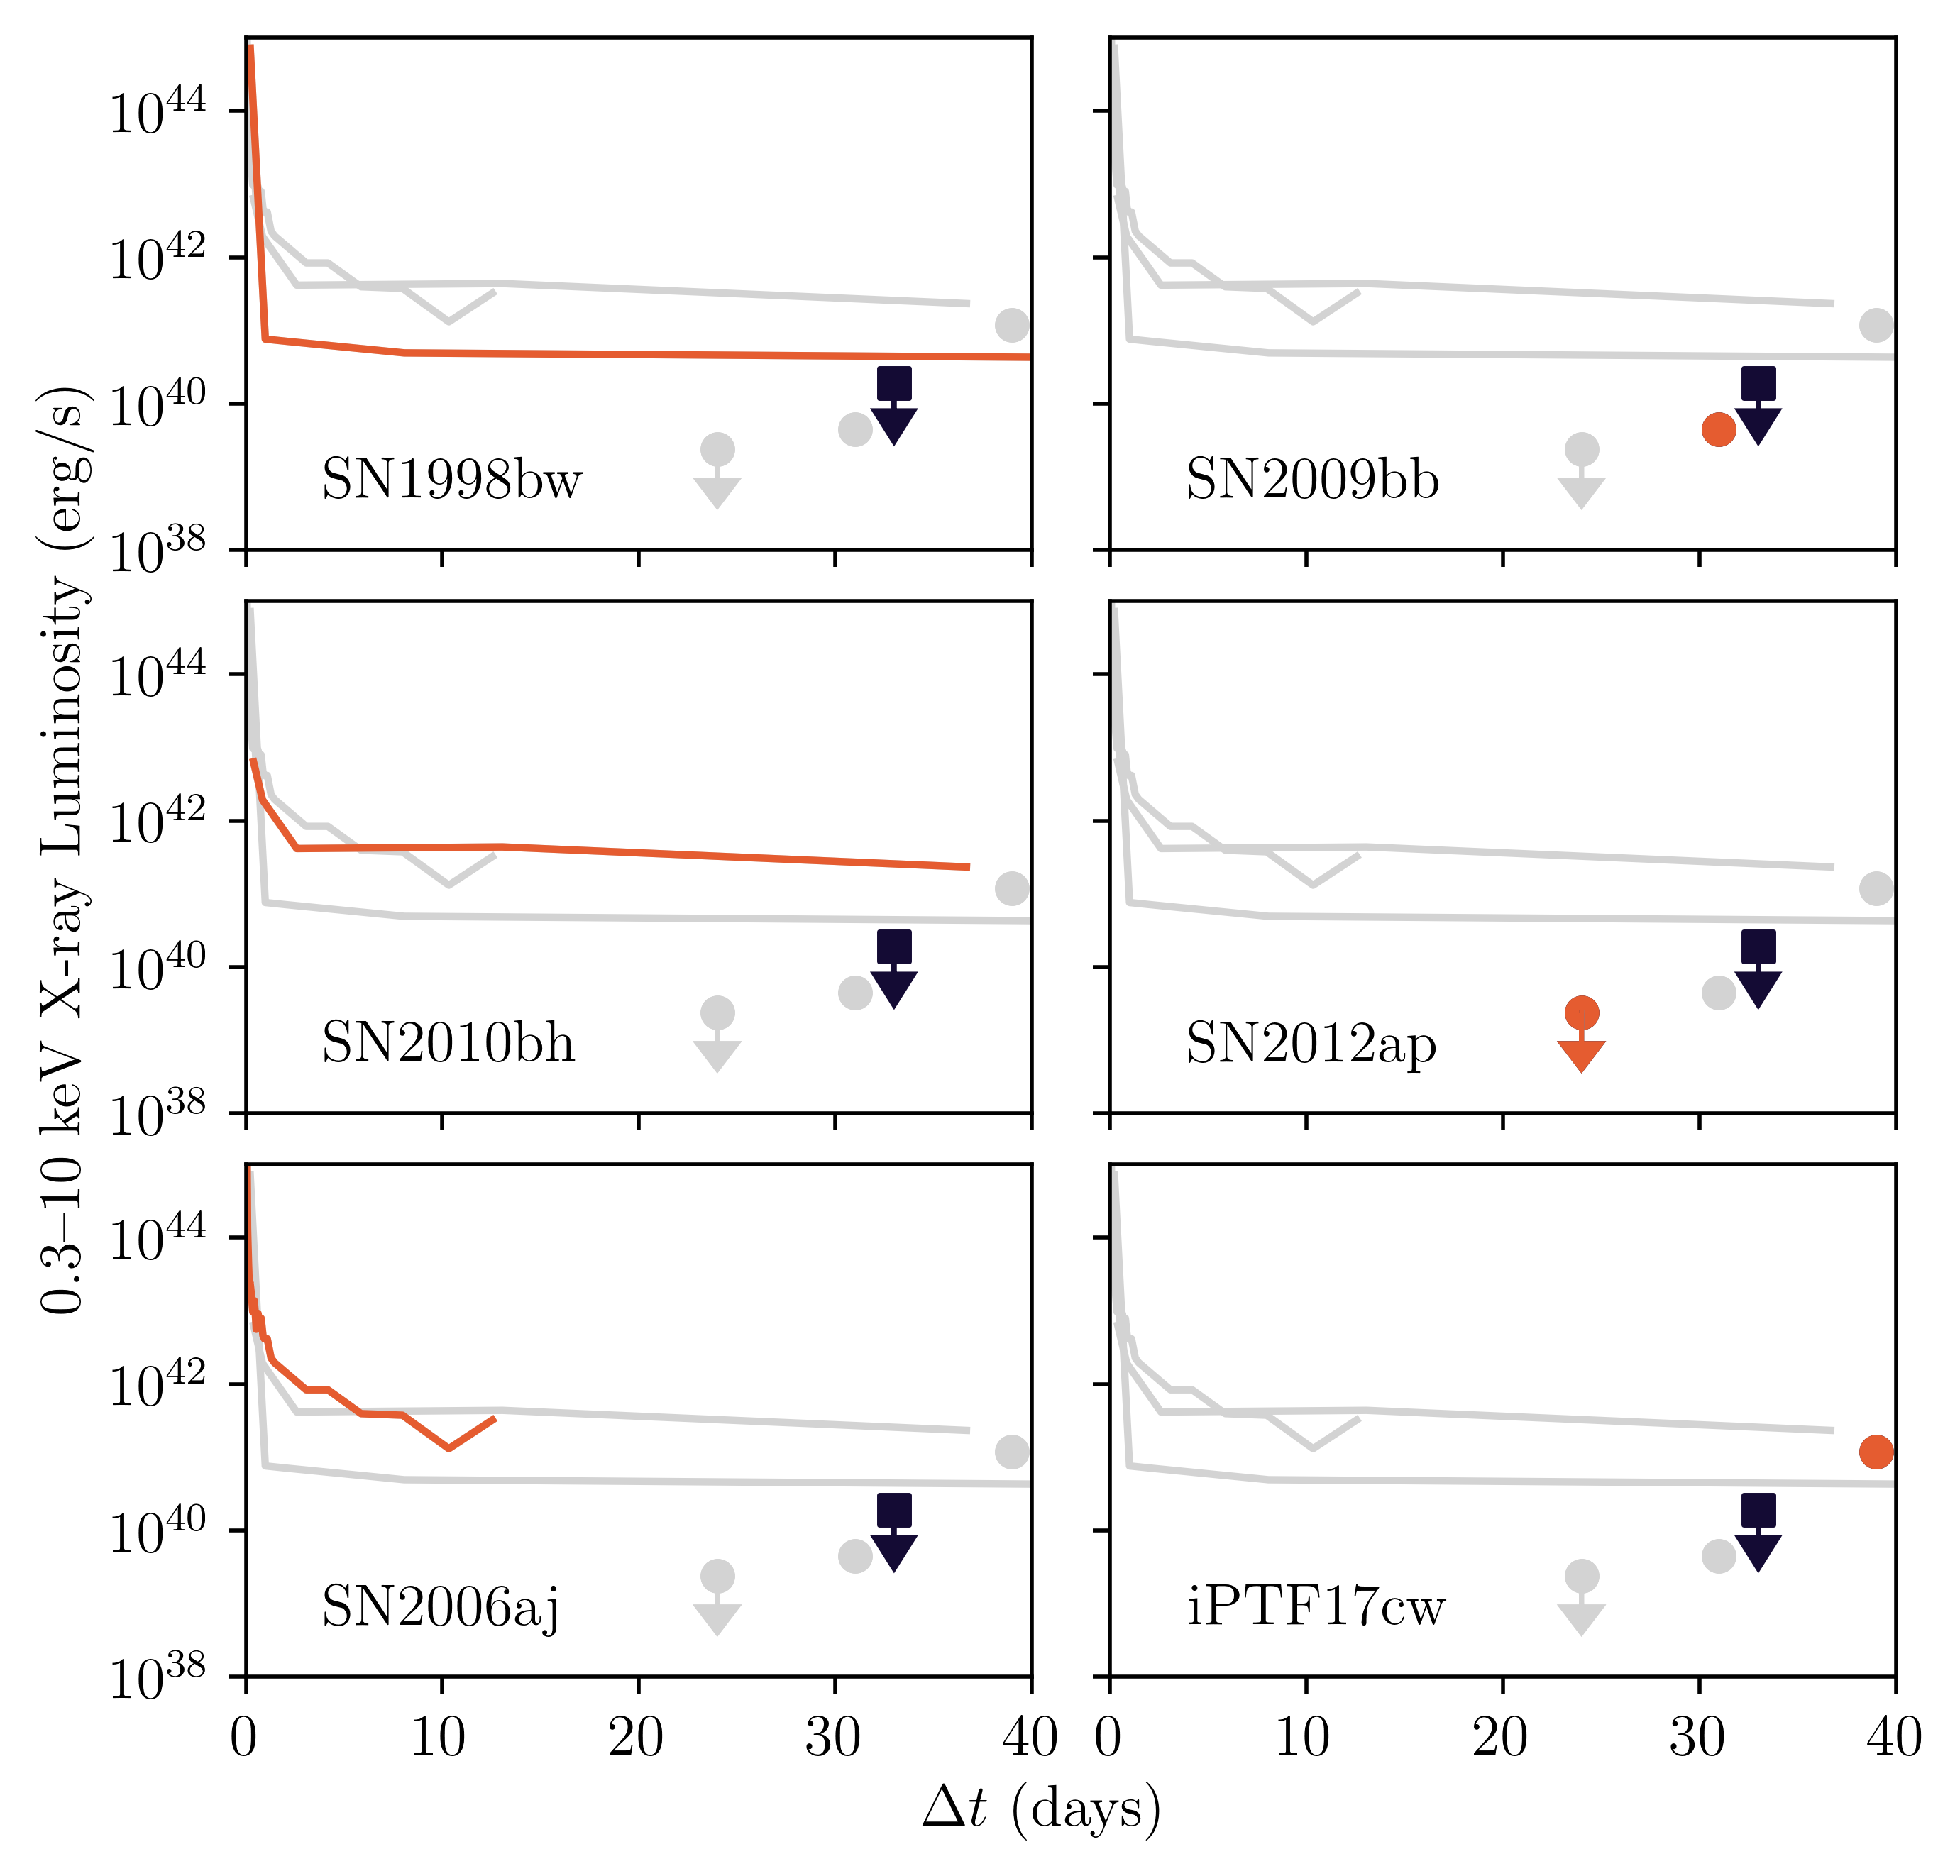
We also obtained two epochs of observations of ZTF18aaqjovh with the Advanced CCD Imaging Spectrometer (ACIS; Garmire et al. 2003) on the Chandra X-ray Observatory via our approved program (No. 19500451, PI: Corsi). The first epoch began at 11:07 on 2018 May 28 UT () under ObsId 20315 (integration time 9.93 ks), and the second began at 11:10 on 2018 July 24 UT () under ObsId 20316. No X-ray emission was detected at the location of ZTF18aaqjovh in either epoch, with a 90% upper limit on the 0.5–7.0 count rate of and , respectively. For the same Galactic and power-law source model that we used in the Swift data, we obtain an upper limit on the unabsorbed 0.3–10 keV flux of in the first epoch and in the second epoch. At the distance of ZTF18aaqjovh, these correspond to upper limits on the X-ray luminosity of and . These upper limits are compared with the X-ray luminosity of radio-loud Ic-BL SNe in Figure 6.
| Start Date | Instr. | Int. | Flux | |
|---|---|---|---|---|
| (UT) | (days) | (ks) | ( ) | |
| 2018 May 28 11:07:06 | 33 | Chandra/ACIS | 9.93 | |
| 2018 May 31 00:33:57 | 36 | Swift/XRT | 2.5 | |
| 2018 July 24 11:10:42 | 90 | Chandra/ACIS | 9.93 |
2.5 Search for Gamma-Rays
We searched for any gamma-ray burst (GRB) coincident with the position and estimated time of first light of ZTF18aaqjovh. As shown in Figure 2 and discussed in more detail in Section 3.1, we can use the relative time between GRB 980425 and the -band peak of SN 1998bw to estimate the time of a GRB associated with ZTF18aaqjovh. If this relative time is the same between the two SNe, then the associated GRB would have been approximately at the time of the last nondetection ( 2018 April 25 UT), 10 days prior to the first detection on 2018 May 5 UT.
To be conservative, we set our search window to be . In Table 5 we list all 20 GRBs detected in this window. Of the 20, all but one are ruled out based on the position of the SN. The only possible counterpart is a GRB on 2018 May 3 03:41:01 () detected by Konus-Wind while Fermi/GBM was offline. The duration of this burst was 35 s. Modeling the spectrum with a cutoff power-law model with and 20–1500 fluence we obtain an , which is typical of LLGRBs (Cano et al., 2017).
| Date | Name | Instr. | Pos. | Verdict | |
|---|---|---|---|---|---|
| (UT) | (days) | ||||
| 2018 Apr 16 | 180416D | -9 | KAI | N | N(a) |
| 2018 Apr 16 | 180416A | -9 | KGI | 113.65, +49.120 | N(b) |
| 2018 Apr 16 | 180416B | -9 | KGAC | 354.233, +78.433 | N(b) |
| 2018 Apr 17 | -8 | K | S | N(c) | |
| 2018 Apr 20 | -5 | KG | 93.510, -28.320 | N(b) | |
| 2018 Apr 20 | -5 | KGI | 83.230, -25.250 | N(b) | |
| 2018 Apr 21 | -4 | K | N | N(c) | |
| 2018 Apr 23 | -2 | KGI | 208.680, +9.840 | N(b) | |
| 2018 Apr 25 | 180425A | 0 | KS | 64.452, -32.952 | N(b) |
| 2018 Apr 26 | 1 | KGI | 251.240, +81.390 | N(b) | |
| 2018 Apr 26 | 1 | KG | 202.410, +58.170 | N(b) | |
| 2018 Apr 26 | 1 | K | N | N(c) | |
| 2018 Apr 26 | 1 | K | S | N(b) | |
| 2018 Apr 27 | 180427A | 2 | KGI | 283.330, +70.300 | N(b) |
| 2018 Apr 28 | 3 | KGI | 92.120, +54.780 | N(b) | |
| 2018 Apr 28 | 3 | K | N | N(c) | |
| 2018 Apr 29 | 4 | KI | S | N(b) | |
| 2018 May 3 | 8 | K | N | Y | |
| 2018 May 4 | 9 | KGI | 220.230, +38.720 | N(b) | |
| 2018 May 4 | 180504A | 9 | KSI | 331.144, -14.658 | N(b) |
Note. — In the Position column, N and S mean that the position is localized to the northern and southern ecliptic hemispheres, respectively. In the Instrument column, K means Konus-Wind, A means Astrosat, I means INTEGRAL SPI-ACS, G means Fermi/GBM, S means Swift/BAT. In the Verdict column, N means that an association is ruled out because (a) the SN position was Earth-occulted for Astrosat and GBM, (b) the SN position is inconsistent with the localized burst position, or (c) the SN position was visible to GBM but not detected. Y means that an association is possible.
However, due to the coarse localization and the implication that the light curve of ZTF18aaqjovh increased to peak brightness much more steeply than the light curve of SN 1998bw, we consider the association with the GRB on May 3 to be unlikely. Assuming it is not related, we can set a limit on the fluence and corresponding isotropic equivalent energy of a prompt burst associated with ZTF18aaqjovh. The Interplanetary Network (IPN) has essentially a 100% duty cycle across the sky, and detects GRBs with down to at 50% efficiency (Hurley et al., 2010, 2016). Using Konus-Wind waiting mode data near and assuming a typical GRB spectrum (a Band function with , and ; Band et al. 1993; Preece et al. 2000), we estimate a peak limiting flux of (20–1500 , 2.944 s scale). At the distance of ZTF18aaqjovh, this corresponds to an upper limit on a GRB peak luminosity of , two orders of magnitude less luminous than classical GRBs but similar to LLGRBs (Cano et al., 2017). We note that the IPN would not be sensitive to LLGRBs such as LLGRB 060218 associated with SN 2006aj (Cano et al., 2017) because of their soft spectra ( for 060218).
3 Analysis and Discussion
3.1 Modeling the Optical Light Curve
As shown in Figure 2, the -band light curve of ZTF18aaqjovh declines slightly faster than the light curve of SN 1998bw, and is 0.4 mag fainter. For an SN with an optical light curve powered by radioactive decay, the “stretch” (width) of the light curve scales with the kinetic energy and ejecta mass as (Valenti et al., 2008; Lyman et al., 2016)
| (1) |
where is the width of the light curve, is the ejecta mass, and is the kinetic energy of the explosion. The degeneracy between and is broken by the photospheric velocity (see Eq. 2 in Lyman et al., 2016):
| (2) |
As shown in Figure 2 and Figure 4, ZTF18aaqjovh has a photospheric velocity close to that of SN 1998bw, and its light curve is narrower. So, we expect the ejecta mass and kinetic energy of ZTF18aaqjovh to be slightly smaller to that of SN 1998bw, which had and , respectively (Lyman et al., 2016), values typical of Ic-BL SNe from untargeted surveys (Taddia et al., 2019).
Finally, assuming that the dominant powering mechanism for the optical light curve is radioactive decay, we have the following energy deposition rate from (Kasen, 2017):
| (3) |
where the decay lifetimes of and are and , respectively. Arnett’s law (Arnett, 1982) states that the instantaneous energy deposition rate is equal to the SN luminosity at peak. Under this assumption, the peak luminosity is simply equal to at that time, so is directly proportional to .
3.2 Properties of the Fastest (Radio-emitting) Ejecta
As shown in Figure 5, the radio luminosity of ZTF18aaqjovh is between that of SN 2006aj and that of iPTF17cw. Due to the faintness of the SN it is unfortunately difficult to measure the true rate of change of the flux, but the slow temporal evolution of the 3-6 GHz flux during the first four epochs of observation ( to ) may imply that the synchrotron self-absorption (SSA) frequency is passing through these frequencies at this time. This is supported by the 3–15 observations at , which suggest that the SSA peak is below 15 and close to 3–6 . Altogether, we conclude that the SSA peak is 3–15 at , and that the peak flux is 20–Jy.
With these estimates of the SSA peak frequency and peak flux, we use the framework laid out in Chevalier (1998) to estimate the shock energy (the amount that has been converted into pressure by the ambient medium), the ambient density, and the mean shock velocity at . The assumption is that the synchrotron spectrum arises from a population of relativistic electrons with a power-law number distribution in Lorentz factor and some minimum Lorentz factor :
| (4) |
For typical radio SNe, (Jones & Ellison, 1991). Here we assume , as in Chevalier (1998). Under this assumption, expressions for the shock radius and magnetic field strength are given in Equations (13) and (14) of Chevalier (1998). The magnetic field strength can then be used to estimate the magnetic energy density, assuming that equal amounts of energy are partitioned into electrons, magnetic fields, and protons (Soderberg et al., 2010).
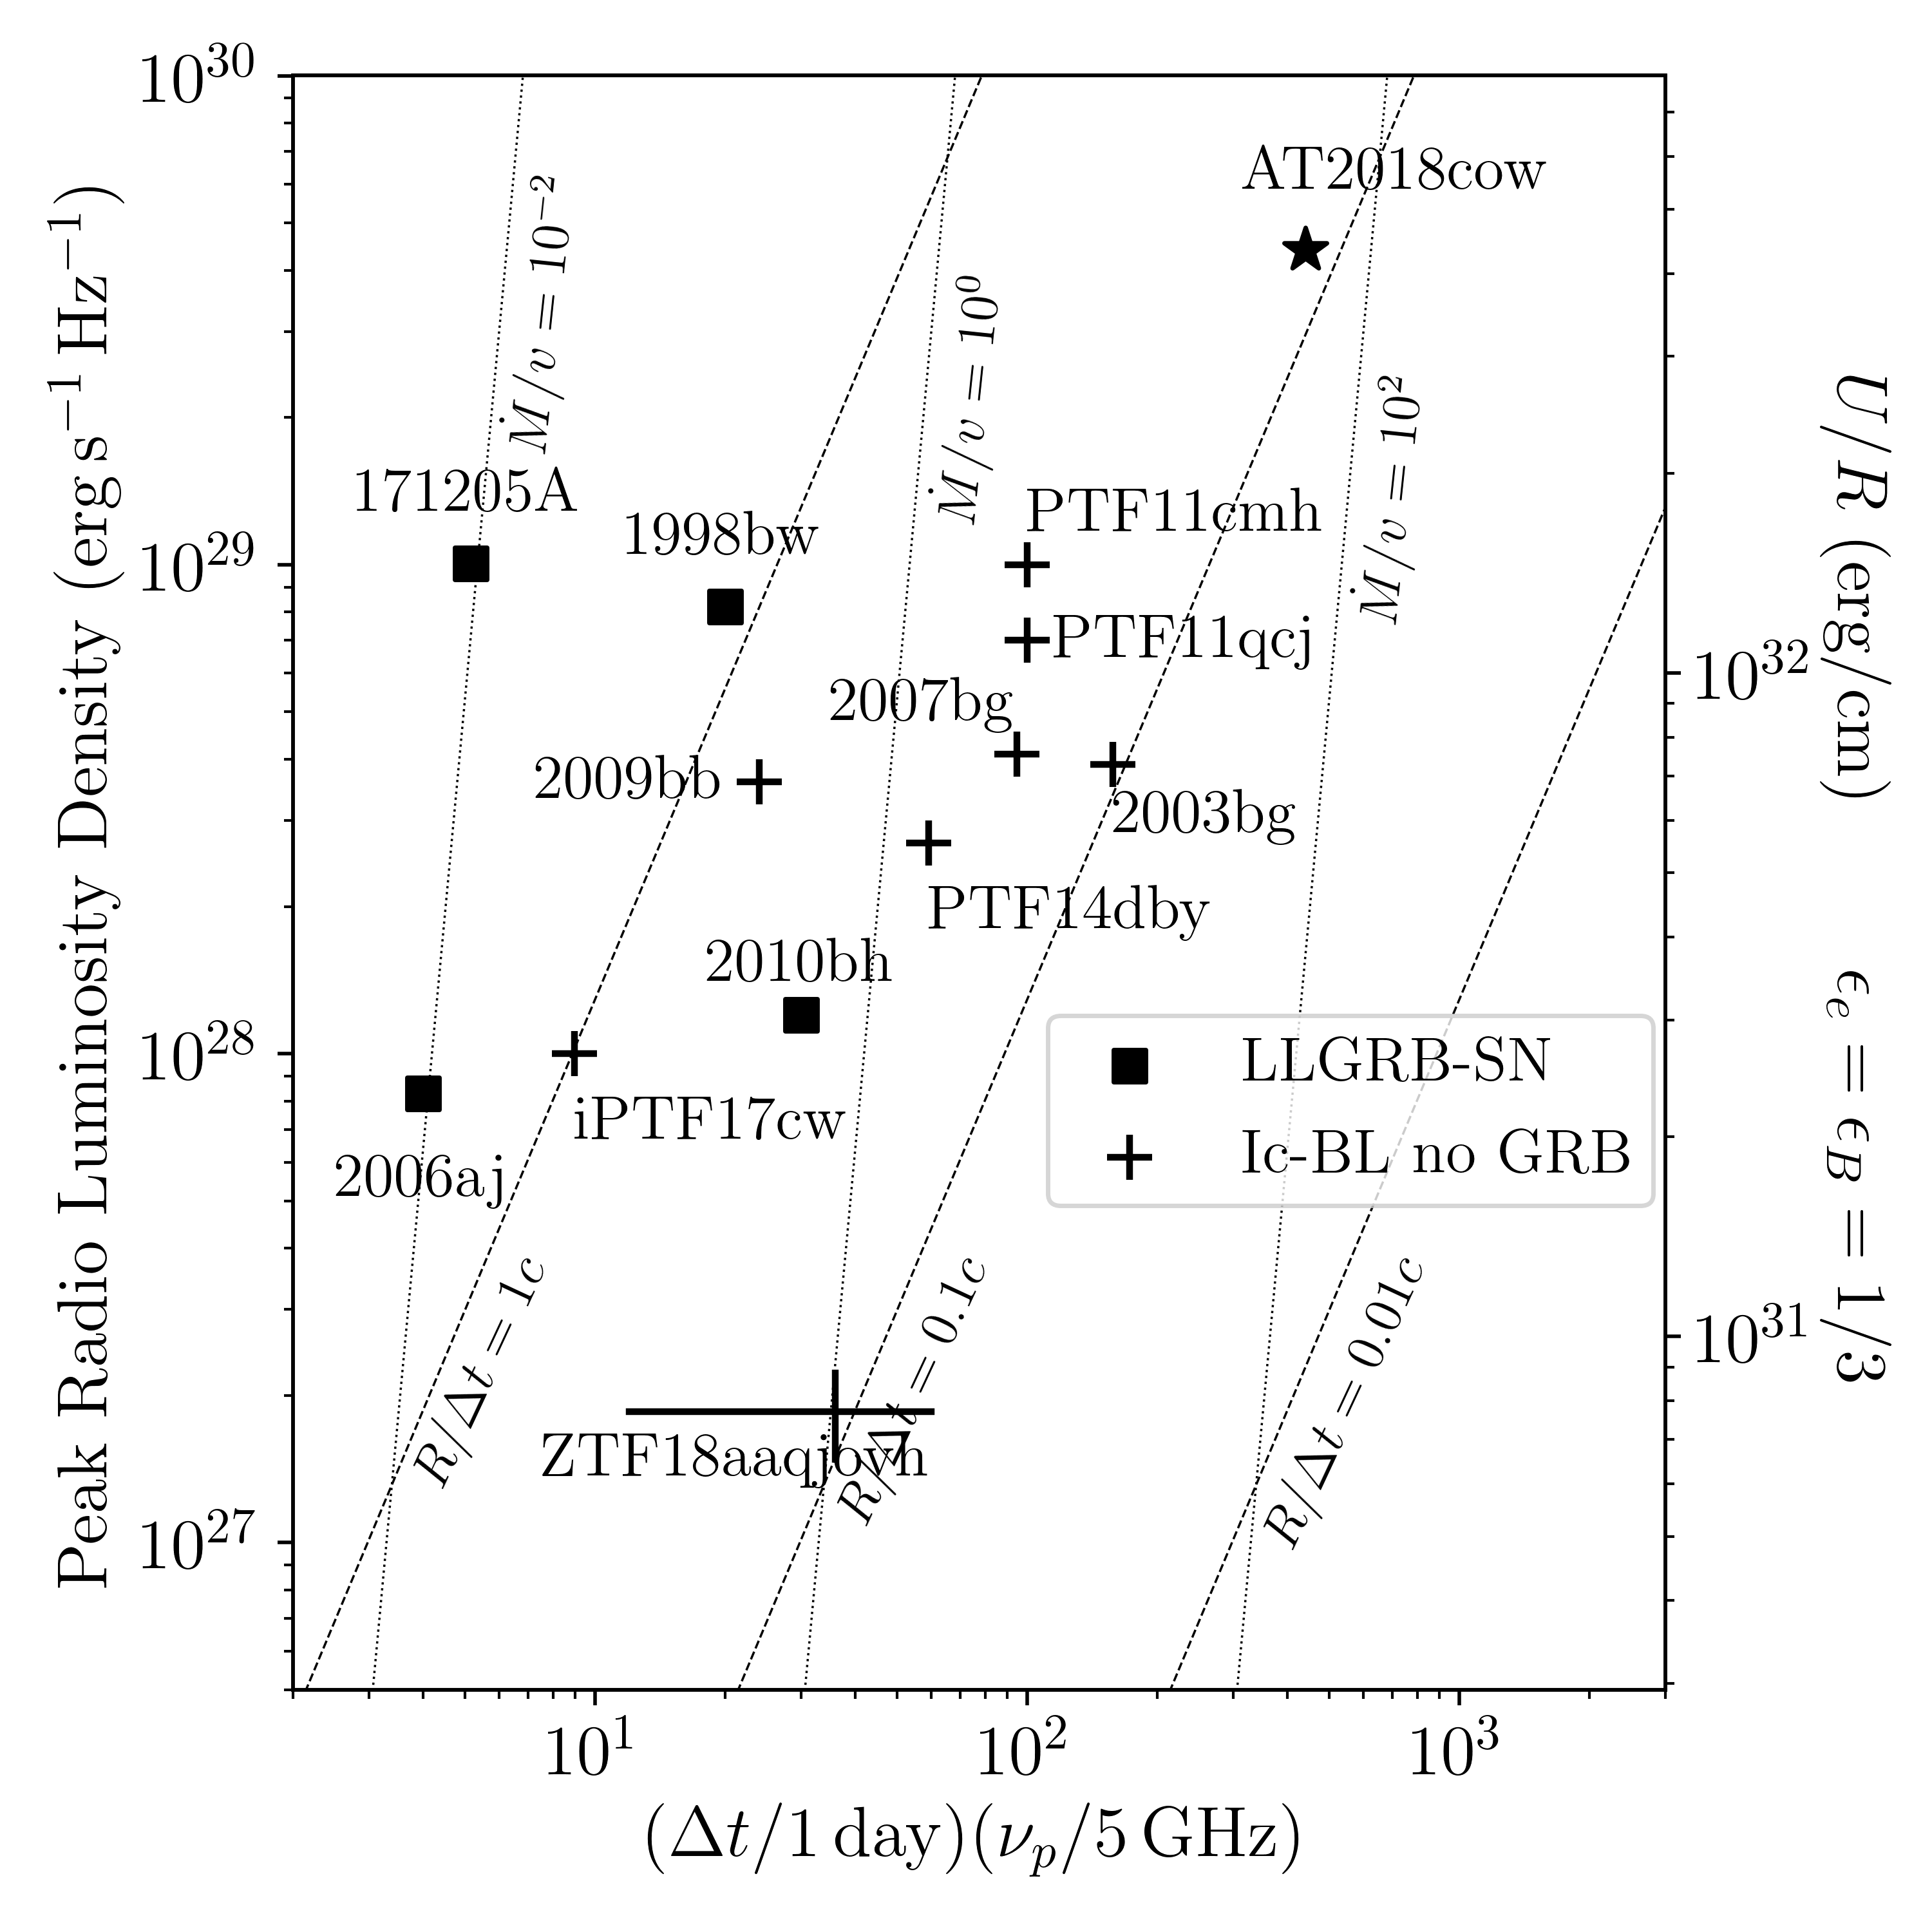
These relations between observables and physical properties are summarized in Figure 7, adapted from Ho et al. (2019). The mean velocity of the shock we derive for ZTF18aaqjovh is –0.4. So, the outflow associated with ZTF18aaqjovh could have been as fast as that observed in the GRB-associated SN 2010bh. The implied mass-loss rate is 0.1–3 , which could be as high as that of the strongly CSM-interacting SN PTF 11qcj (Corsi et al., 2014).
3.3 Modeling the Radio to X-Ray SED
In SN explosions, the shockwave that accelerates electrons into a power-law distribution and produces synchrotron radiation, detected as radio emission, can also produce X-rays (Chevalier & Fransson, 2006) via several mechanisms. X-rays can have the same origin as the radio emission (lying along the same synchrotron spectrum). However, X-rays can also arise from inverse Compton scattering of the optical photons by the electrons producing the radio emission (Chevalier & Fransson, 2006, 2017). For a number of Ic-BL SNe, it seems that the simple synchrotron scenario is insufficient to explain the radio and X-ray observations — in other words, there is an excess of X-ray emission (Soderberg et al., 2006; Margutti et al., 2013; Corsi et al., 2014).
As described in Section 2.4, we do not detect X-ray emission from ZTF18aaqjovh, corresponding to upper limits of at and at . At , this is smaller than the luminosity of X-ray emission associated with iPTF17cw, SN 1998bw (GRB 980425), and SN 2010bh (GRB 031203) at a similar epoch. The 0.3–10 luminosity of SN 2010bh at was (Margutti et al., 2014), which was already the least X-ray luminous LLGRB at this phase (second only to GRB 980425). Due to a lack of data later than 10 we cannot rule out a luminosity similar to SN 2006aj, SN 2009bb, and SN 2012ap (Margutti et al., 2014).
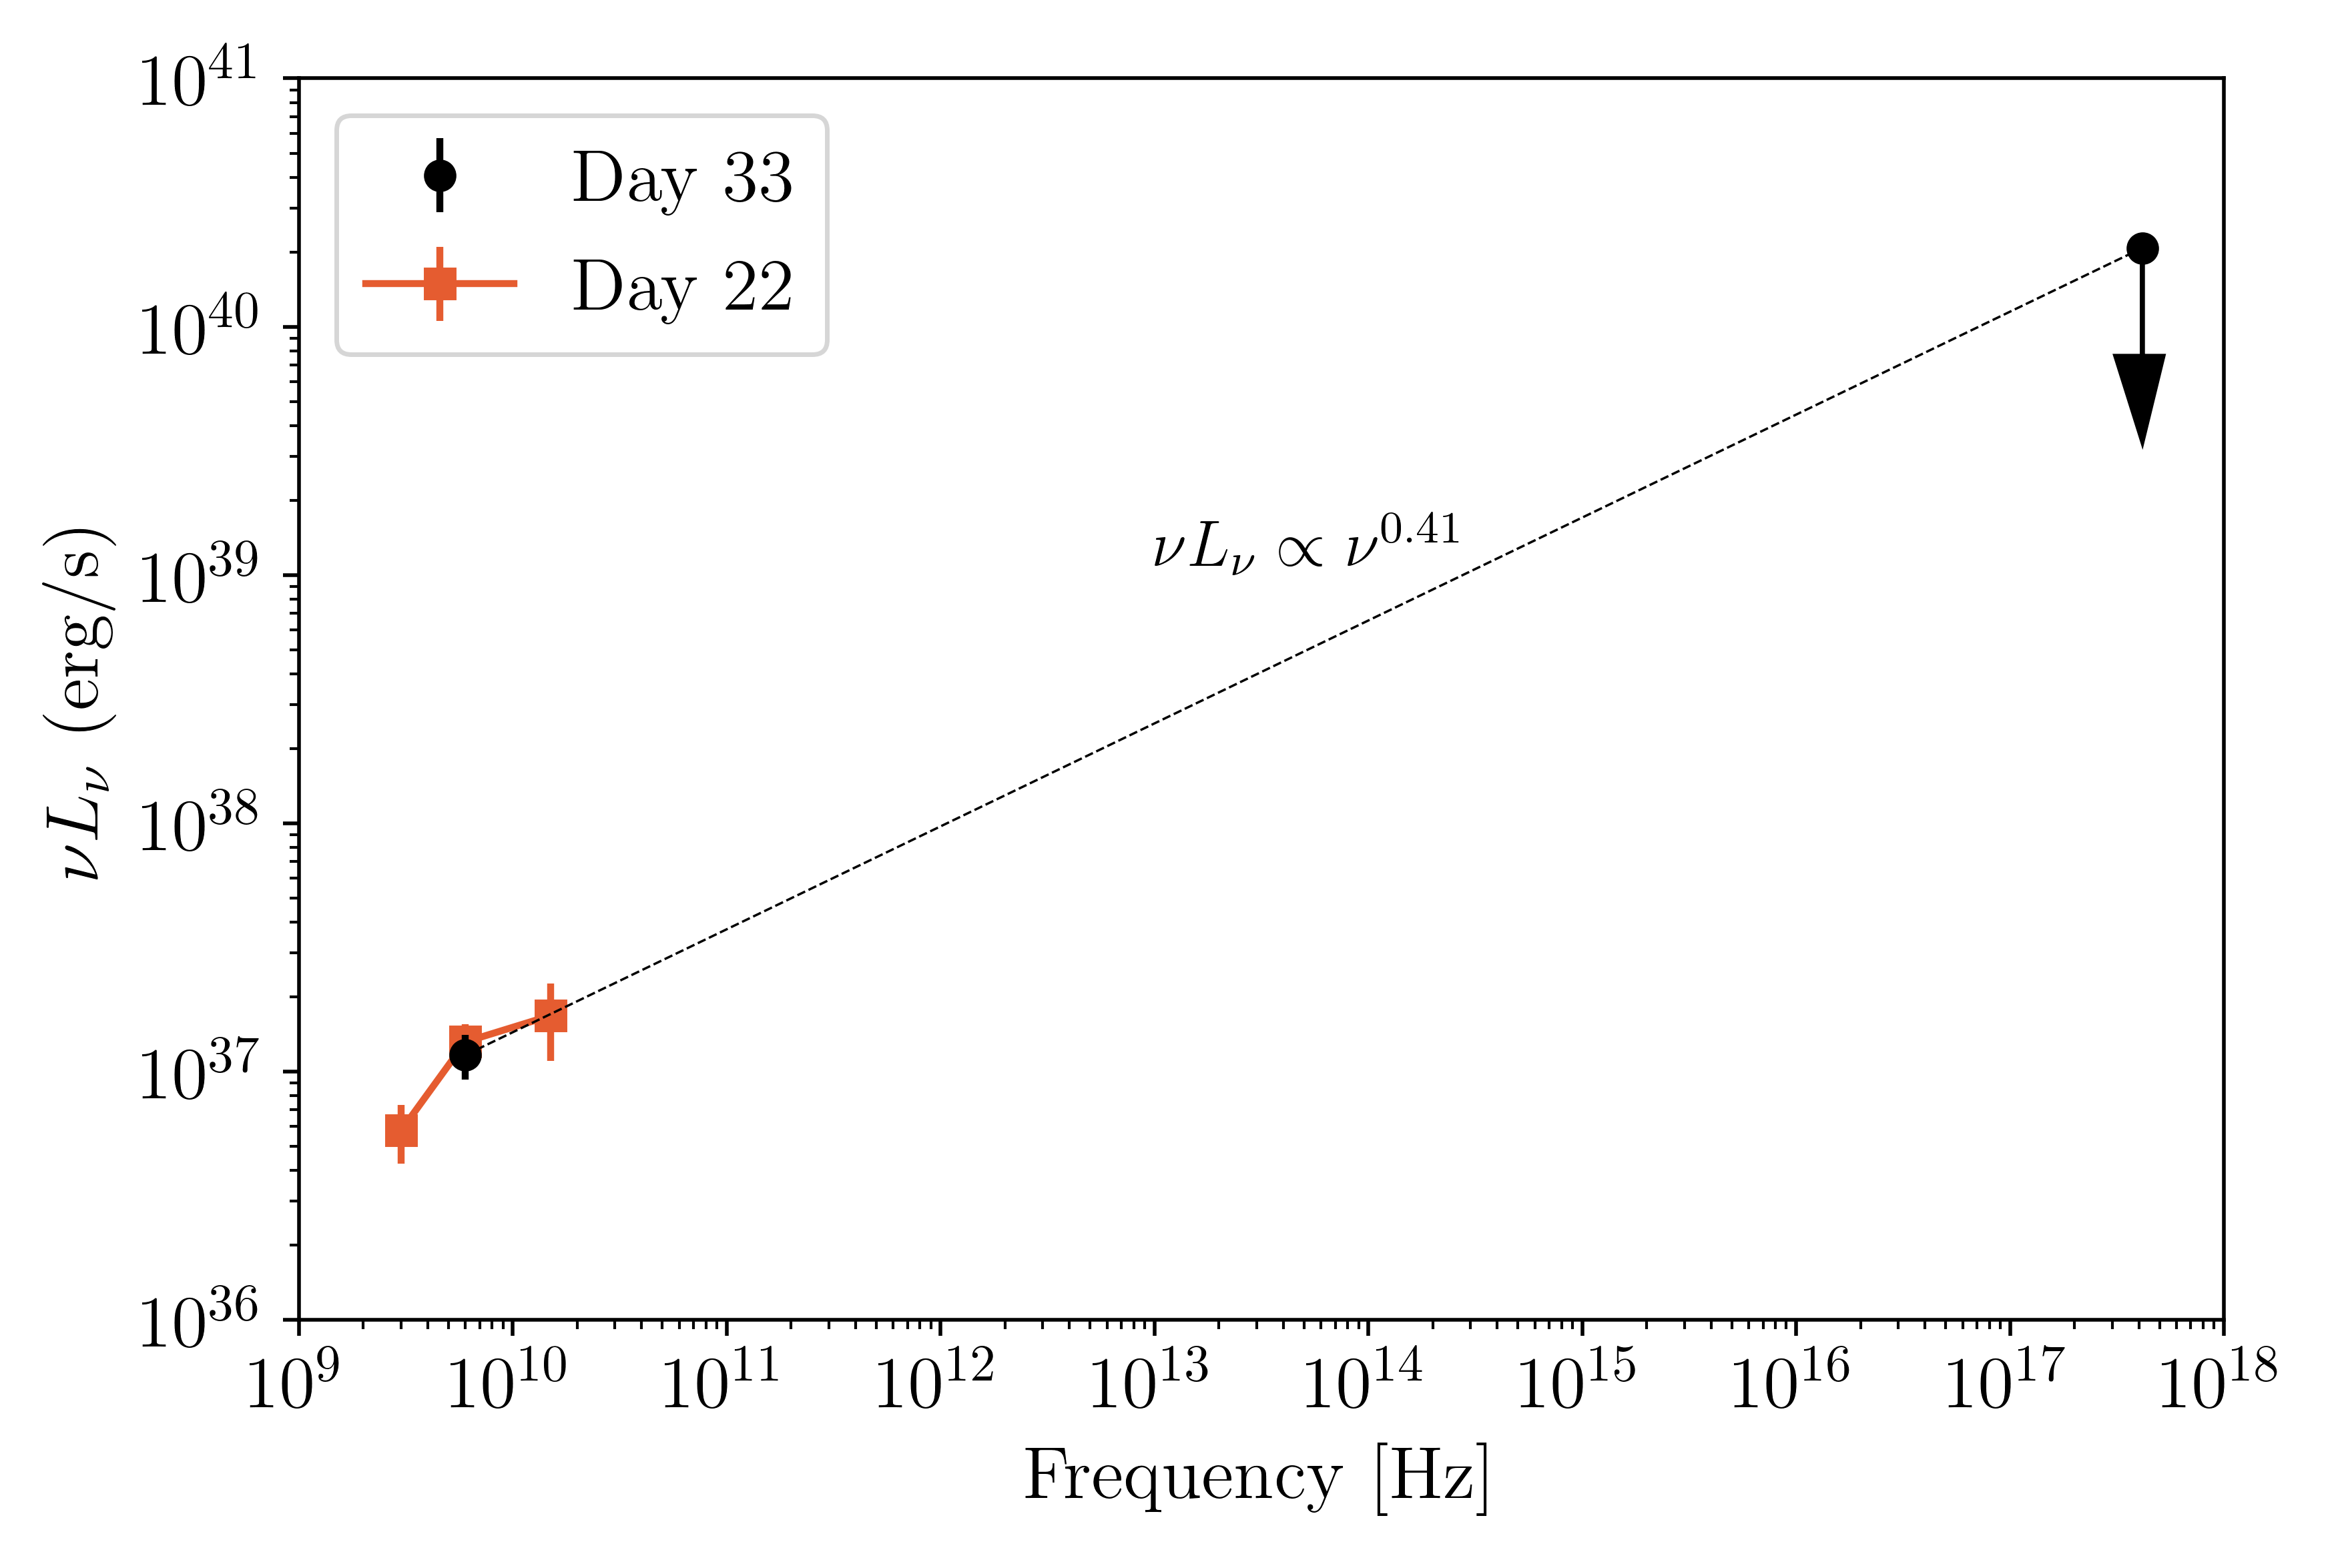
Figure 8 shows the radio luminosity and X-ray upper limit at days, from our observations of ZTF18aaqjovh with the VLA and Chandra on 2018 May 28–29 UT. The spectral index is constrained to be where . A common optically thin spectral index for radio SNe is to (Chevalier, 1998) where . Above the cooling frequency, this steepens to or . Thus we cannot conclude whether there is X-ray emission from an extension of the synchrotron spectrum, or whether there is an excess from some other mechanism such as cosmic-ray-dominated shocks (Chevalier & Fransson, 2006), which has been observed in a number of engine-driven SNe including iPTF17cw (; Corsi et al. 2017), GRB 060218 (; Soderberg et al. 2006), and GRB 100316D (; Margutti et al. 2014).
3.4 Gamma-Ray Burst
In Section 2.5 we searched for coincident GRBs and found one possible counterpart, although the association is highly unlikely due to the close proximity of the burst time with the first detection of the light curve.
Here we work under the hypothesis that ZTF18aaqjovh was associated with a GRB that we missed, and attempt to derive possible constraints on the -ray emission based on the SN properties. From four GRB-SNe, Li (2006) found the following relation between the peak spectral energy of the GRB and the peak bolometric luminosity of the associated SN:
| (5) |
From the peak of the -band light curve of ZTF18aaqjovh, we can estimate , which gives . Using the so-called Amati relationship between a GRB peak energy and its isotropic equivalent energy (Amati, 2006; Li, 2006):
| (6) |
we find an expected for a potential GRB associated with ZTF18aaqjovh. These values of and are similar to what has been measured for LLGRBs (Cano et al., 2017), and would not have been detectable by the IPN.
4 Summary and Conclusions
We have presented optical, X-ray, and radio observations of the Ic-BL SN ZTF18aaqjovh, discovered by ZTF as part of our campaign with the VLA to search for engine-driven explosions. ZTF18aaqjovh shares a number of features in common with relativistic SNe: an optical light curve similar to SN 1998bw and early peaking radio emission similar to iPTF17cw. The limits on X-ray and gamma-ray emission rule out a classical GRB but cannot rule out an LLGRB. Due to the low signal-to-noise of our measurements, we can only constrain the velocity of the forward shock to be 0.06–0.4. Thus, this is at most a mildly relativistic explosion, and we have no definitive evidence of a long-lived central engine.
From radio follow-up observations of Ic-BL SNe discovered by PTF and now ZTF, it has become clear that emission as luminous as that accompanying SN 1998bw is rare. Without a GRB trigger it is challenging to discover explosions similar to SN 2006aj, which had a low-frequency radio light curve that peaked within the first five days and faded more quickly than the light curve of SN 1998bw. In the case of ZTF18aaqjovh, X-ray observations within the first 10 days may have enabled us to detect an X-ray light curve like that accompanying SN 2006aj, but we were unable to observe with Swift due to the proximity of ZTF18aaqjovh to the Sun at the time.
At present, Ic-BL SNe are discovered and classified via brute-force spectroscopy, so unless they are very nearby they are typically not recognized until a week after explosion. It would be useful to develop strategies for discovering Ic-BL SNe earlier in their evolution, perhaps based on the properties of their host environment, or — in higher-cadence surveys – from the presence of an early () peak in the optical light curve, like that seen in SN 2006aj and SN 1998bw. These could perhaps be distinguished from double-peaked light curves of other SN progenitors (e.g. Fremling et al. 2019c) by the luminosity of this first peak, if the redshift to the SN is known.
When the paper has been accepted for publication the data will be made publicly available via WISeREP, an interactive repository of supernova data (Yaron & Gal-Yam, 2012). The code to produce the figures in this paper has been released under https://doi.org/10.5281/zenodo.3634931 (catalog 10.5281/zenodo.3634931).
References
- Ahn et al. (2014) Ahn, C. P., Alexandroff, R., Allende Prieto, C., et al. 2014, ApJS, 211, 17
- Alam et al. (2015) Alam, S., Albareti, F. D., Allende Prieto, C., et al. 2015, ApJS, 219, 12
- Amati et al. (2002) Amati, L., Frontera, F., Tavani, M., et al. 2002, A&A, 390, 81
- Amati (2006) Amati, L. 2006, MNRAS, 372, 233
- Arnett (1982) Arnett, W. D. 1982, ApJ, 253, 785
- Band et al. (1993) Band, D., Matteson, J., Ford, L., et al. 1993, ApJ, 413, 281
- Barnes et al. (2018) Barnes, J., Duffell, P. C., Liu, Y., et al. 2018, ApJ, 860, 38
- Bellm & Sesar (2016) Bellm, E. C., & Sesar, B. 2016, Astrophysics Source Code Library, ascl:1602.002
- Bellm et al. (2019a) Bellm, E. C., Kulkarni, S. R., Graham, M. J., et al. 2019, PASP, 131, 018002
- Bellm et al. (2019) Bellm, E. C., Kulkarni, S. R., Barlow, T., et al. 2019, PASP, 131, 068003
- Bersier et al. (2006) Bersier, D., Fruchter, A. S., Strolger, L.-G., et al. 2006, ApJ, 643, 284
- Blondin & Tonry (2007) Blondin, S., & Tonry, J. L. 2007, ApJ, 666, 1024
- Branch et al. (2002) Branch, D., Benetti, S., Kasen, D., et al. 2002, ApJ, 566, 1005
- Blagorodnova et al. (2018) Blagorodnova, N., Neill, J. D., Walters, R., et al. 2018, PASP, 130, 035003
- Bromberg et al. (2011) Bromberg, O., Nakar, E., & Piran, T. 2011, ApJ, 739, L55
- Bufano et al. (2012) Bufano, F., Pian, E., Sollerman, J., et al. 2012, ApJ, 753, 67
- Burrows et al. (2005) Burrows, D. N., Hill, J. E., Nousek, J. A., et al. 2005, Space Sci. Rev., 120, 165
- Campana et al. (2006) Campana, S., Mangano, V., Blustin, A. J., et al. 2006, Nature, 442, 1008
- Cano (2013) Cano, Z. 2013, MNRAS, 434, 1098
- Cano et al. (2017) Cano, Z., Wang, S.-Q., Dai, Z.-G., & Wu, X.-F. 2017, Advances in Astronomy, 2017, 8929054
- Cappellaro et al. (1997) Cappellaro, E., Mazzali, P. A., Benetti, S., et al. 1997, A&A, 328, 203
- Cenko et al. (2006) Cenko, S. B., Fox, D. B., Moon, D.-S., et al. 2006, PASP, 118, 1396
- Chakraborti et al. (2015) Chakraborti, S., Soderberg, A., Chomiuk, L., et al. 2015, ApJ, 805, 187
- Chand et al. (2020) Chand, V., Banerjee, A., Gupta, R., et al. 2020, arXiv e-prints, arXiv:2001.00648
- Chevalier (1998) Chevalier, R. A. 1998, ApJ, 499, 810
- Chevalier & Fransson (2006) Chevalier, R. A., & Fransson, C. 2006, ApJ, 651, 381
- Chevalier & Fransson (2017) Chevalier, R. A., & Fransson, C. 2017, Handbook of Supernovae, 875
- Clocchiatti et al. (2011) Clocchiatti, A., Suntzeff, N. B., Covarrubias, R., & Candia, P. 2011, AJ, 141, 163
- Cook et al. (2019) Cook, D. O., Kasliwal, M. M., Van Sistine, A., et al. 2019, ApJ, 880, 7
- Corsi et al. (2014) Corsi, A., Ofek, E. O., Gal-Yam, A., et al. 2014, ApJ, 782, 42
- Corsi et al. (2016) Corsi, A., Gal-Yam, A., Kulkarni, S. R., et al. 2016, ApJ, 830, 42
- Corsi et al. (2017) Corsi, A., Cenko, S. B., Kasliwal, M. M., et al. 2017, ApJ, 847, 54
- Dekany et al. (2016) Dekany, R., Smith, R. M., Belicki, J., et al. 2016, Proc. SPIE, 9908, 99085M
- D’Elia et al. (2018) D’Elia, V., Campana, S., D’Aì, A., et al. 2018, A&A, 619, A66
- Djupvik & Andersen (2010) Djupvik, A. A., & Andersen, J. 2010, Astrophysics and Space Science Proceedings, 14, 211
- Duev et al. (2019) Duev, D. A., Mahabal, A., Masci, F. J., et al. 2019, MNRAS, 489, 3582
- Evans et al. (2009) Evans, P. A., Beardmore, A. P., Page, K. L., et al. 2009, MNRAS, 397, 1177
- Fremling et al. (2016) Fremling, C., Sollerman, J., Taddia, F., et al. 2016, A&A, 593, A68
- Fremling & Taggart (2018) Fremling, C., & Taggart, K. 2018, Transient Name Server Discovery Report 2018-691, 1
- Fremling et al. (2019a) Fremling, C., Dugas, A., & Sharma, Y. 2019, Transient Name Server Classification Report 2019-892, 1
- Fremling et al. (2019b) Fremling, U. C., Miller, A. A., Sharma, Y., et al. 2019, arXiv e-prints, arXiv:1910.12973
- Fremling et al. (2019c) Fremling, C., Ko, H., Dugas, A., et al. 2019, ApJ, 878, L5
- Galama et al. (1998) Galama, T. J., Vreeswijk, P. M., van Paradijs, J., et al. 1998, Nature, 395, 670
- Garmire et al. (2003) Garmire, G. P., Bautz, M. W., Ford, P. G., Nousek, J. A., & Ricker, G. R., Jr. 2003, Proc. SPIE, 4851, 28
- Graham et al. (2019) Graham, M. J., Kulkarni, S. R., Bellm, E. C., et al. 2019, PASP, 131, 078001
- Hjorth et al. (2003) Hjorth, J., Sollerman, J., Møller, P., et al. 2003, Nature, 423, 847
- Hjorth & Bloom (2012) Hjorth, J., & Bloom, J. S. 2012, Chapter 9 in ”gamma-ray Bursts, 169
- Ho et al. (2019) Ho, A. Y. Q., Phinney, E. S., Ravi, V., et al. 2019, ApJ, 871, 73
- Högbom (1974) Högbom, J. A. 1974, A&AS, 15, 417
- Hurley et al. (2010) Hurley, K., Golenetskii, S., Aptekar, R., et al. 2010, American Institute of Physics Conference Series, 330
- Hurley et al. (2016) Hurley, K., Svinkin, D. S., Aptekar, R. L., et al. 2016, ApJ, 829, L12
- Irwin & Chevalier (2016) Irwin, C. M., & Chevalier, R. A. 2016, MNRAS, 460, 1680
- Japelj et al. (2018) Japelj, J., Vergani, S. D., Salvaterra, R., et al. 2018, Astronomy and Astrophysics, 617, A105
- Jones & Ellison (1991) Jones, F. C., & Ellison, D. C. 1991, Space Sci. Rev., 58, 259
- Kasen (2017) Kasen, D. 2017, Handbook of Supernovae, 939
- Kasliwal et al. (2019) Kasliwal, M. M., Cannella, C., Bagdasaryan, A., et al. 2019, PASP, 131, 038003
- Kulkarni et al. (1998) Kulkarni, S. R., Frail, D. A., Wieringa, M. H., et al. 1998, Nature, 395, 663
- Laskar et al. (2017) Laskar, T., Coppejans, D. L., Margutti, R., & Alexander, K. D. 2017, GRB Coordinates Network, Circular Service, No. 22216, #1 (2017), 22216, 1
- Lazzati et al. (2012) Lazzati, D., Morsony, B. J., Blackwell, C. H., et al. 2012, ApJ, 750, 68
- Li (2006) Li, L.-X. 2006, MNRAS, 372, 1357
- Lupton et al. (2004) Lupton, R., Blanton, M. R., Fekete, G., et al. 2004, Publications of the Astronomical Society of the Pacific, 116, 133.
- Lyman et al. (2016) Lyman, J. D., Bersier, D., James, P. A., et al. 2016, MNRAS, 457, 328
- MacFadyen et al. (2001) MacFadyen, A. I., Woosley, S. E., & Heger, A. 2001, ApJ, 550, 410
- Mahabal et al. (2019) Mahabal, A., Rebbapragada, U., Walters, R., et al. 2019, PASP, 131, 038002
- Malesani et al. (2004) Malesani, D., Tagliaferri, G., Chincarini, G., et al. 2004, ApJ, 609, L5
- Margutti et al. (2013) Margutti, R., Soderberg, A. M., Wieringa, M. H., et al. 2013, ApJ, 778, 18
- Margutti et al. (2014) Margutti, R., Milisavljevic, D., Soderberg, A. M., et al. 2014, ApJ, 797, 107
- Margutti et al. (2015) Margutti, R., Guidorzi, C., Lazzati, D., et al. 2015, ApJ, 805, 159
- Masci et al. (2019) Masci, F. J., Laher, R. R., Rusholme, B., et al. 2019, PASP, 131, 018003
- McMullin et al. (2007) McMullin, J. P., Waters, B., Schiebel, D., Young, W., & Golap, K. 2007, Astronomical Data Analysis Software and Systems XVI, 376, 127
- Milisavljevic et al. (2015) Milisavljevic, D., Margutti, R., Parrent, J. T., et al. 2015, ApJ, 799, 51
- Mirabal et al. (2006) Mirabal, N., Halpern, J. P., An, D., et al. 2006, ApJ, 643, L99
- Modjaz et al. (2016) Modjaz, M., Liu, Y. Q., Bianco, F. B., & Graur, O. 2016, ApJ, 832, 108
- Nakar (2015) Nakar, E. 2015, ApJ, 807, 172
- Oke & Gunn (1982) Oke, J. B., & Gunn, J. E. 1982, PASP, 94, 586
- Oke et al. (1995) Oke, J. B., Cohen, J. G., Carr, M., et al. 1995, PASP, 107, 375
- Patat et al. (2001) Patat, F., Cappellaro, E., Danziger, J., et al. 2001, ApJ, 555, 900
- Patterson et al. (2019) Patterson, M. T., Bellm, E. C., Rusholme, B., et al. 2019, PASP, 131, 018001
- Perley et al. (2011) Perley, R. A., Chandler, C. J., Butler, B. J., et al. 2011, ApJ, 739, L1
- Perley (2019) Perley, D. A. 2019, PASP, 131, 084503
- Pian et al. (2006) Pian, E., Mazzali, P. A., Masetti, N., et al. 2006, Nature, 442, 1011
- Piran (2004) Piran, T. 2004, Reviews of Modern Physics, 76, 1143
- Planck Collaboration et al. (2016) Planck Collaboration, Ade, P. A. R., Aghanim, N., et al. 2016, A&A, 594, A13
- Preece et al. (2000) Preece, R. D., Briggs, M. S., Mallozzi, R. S., et al. 2000, ApJS, 126, 19
- Prentice et al. (2016) Prentice, S. J., Mazzali, P. A., Pian, E., et al. 2016, MNRAS, 458, 2973
- Rigault et al. (2019) Rigault, M., Neill, J. D., Blagorodnova, N., et al. 2019, A&A, 627, A115
- Sakamoto et al. (2004) Sakamoto, T., Lamb, D. Q., Graziani, C., et al. 2004, ApJ, 602, 875
- Salas et al. (2013) Salas, P., Bauer, F. E., Stockdale, C., & Prieto, J. L. 2013, MNRAS, 428, 1207
- Sobacchi et al. (2017) Sobacchi, E., Granot, J., Bromberg, O., & Sormani, M. C. 2017, MNRAS, 472, 616
- Soderberg et al. (2004a) Soderberg, A. M., Kulkarni, S. R., Berger, E., et al. 2004, ApJ, 606, 994
- Soderberg et al. (2004b) Soderberg, A. M., Kulkarni, S. R., Berger, E., et al. 2004, Nature, 430, 648
- Soderberg et al. (2005) Soderberg, A. M., Kulkarni, S. R., Berger, E., et al. 2005, ApJ, 621, 908
- Soderberg et al. (2006) Soderberg, A. M., Kulkarni, S. R., Nakar, E., et al. 2006, Nature, 442, 1014
- Soderberg et al. (2010) Soderberg, A. M., Chakraborti, S., Pignata, G., et al. 2010, Nature, 463, 513
- Stanek et al. (2003) Stanek, K. Z., Matheson, T., Garnavich, P. M., et al. 2003, ApJ, 591, L17
- Starling et al. (2011) Starling, R. L. C., Wiersema, K., Levan, A. J., et al. 2011, MNRAS, 411, 2792
- Sutherland & Wheeler (1984) Sutherland, P. G., & Wheeler, J. C. 1984, ApJ, 280, 282
- Tachibana & Miller (2018) Tachibana, Y., & Miller, A. A. 2018, PASP, 130, 128001
- Taddia et al. (2019) Taddia, F., Sollerman, J., Fremling, C., et al. 2019, A&A, 621, A71
- Thomsen et al. (2004) Thomsen, B., Hjorth, J., Watson, D., et al. 2004, A&A, 419, L21
- Valenti et al. (2008) Valenti, S., Benetti, S., Cappellaro, E., et al. 2008, MNRAS, 383, 1485
- Wang et al. (2018) Wang, J., Zhu, Z. P., Xu, D., et al. 2018, ApJ, 867, 147
- Watson et al. (2004) Watson, D., Hjorth, J., Levan, A., et al. 2004, ApJ, 605, L101
- Woosley et al. (1999) Woosley, S. E., Eastman, R. G., & Schmidt, B. P. 1999, ApJ, 516, 788
- Woosley & Janka (2005) Woosley, S., & Janka, T. 2005, Nature Physics, 1, 147
- Woosley & Bloom (2006) Woosley, S. E., & Bloom, J. S. 2006, ARA&A, 44, 507
- Yao et al. (2019) Yao, Y., Miller, A. A., Kulkarni, S. R., et al. 2019, ApJ, 886, 152
- Yaron & Gal-Yam (2012) Yaron, O., & Gal-Yam, A. 2012, PASP, 124, 668
- Zackay et al. (2016) Zackay, B., Ofek, E. O., & Gal-Yam, A. 2016, ApJ, 830, 27