Experimentally Calibrated Kinetic Monte Carlo Model Reproduces Organic Solar Cell Current–Voltage Curve
Abstract
Kinetic Monte Carlo (KMC) simulations are a powerful tool to study the dynamics of charge carriers in organic photovoltaics. However, the key characteristic of any photovoltaic device, its current–voltage (–) curve under solar illumination, has proven challenging to simulate using KMC. The main challenges arise from the presence of injecting contacts and the importance of charge recombination when the internal electric field is low, i.e., close to open-circuit conditions. In this work, an experimentally calibrated KMC model is presented that can fully predict the – curve of a disordered organic solar cell. It is shown that it is crucial to make experimentally justified assumptions on the injection barriers, the blend morphology, and the kinetics of the charge transfer state involved in geminate and nongeminate recombination. All of these properties are independently calibrated using charge extraction, electron microscopy, and transient absorption measurements, respectively. Clear evidence is provided that the conclusions drawn from microscopic and transient KMC modeling are indeed relevant for real operating organic solar cell devices.
Department of Physics, Chemistry and Biology, Linköping University, 581 83 Linköping, Sweden \SectionNumbersOn
1 Introduction
Kinetic Monte Carlo (KMC) simulations have successfully been used to model the charge carrier dynamics in organic photovoltaics (OPVs) on the ps to s time scale. For instance, it was shown that in thin-film OPV devices, thermalization in the disorder-broadened density of states (DOS) does not complete before charges are extracted.1, 2, 3, 4 The conclusions from these studies are drawn from the fitting of time-resolved experiments performed under certain bias conditions such as short circuit or open circuit. Other authors used KMC modeling to focus on the process of charge recombination and its dependence on the morphology in slabs of material, i.e., in absence of contacts.5, 6, 7, 8, 9 However, it is still an open question to which extent nonequilibrium phenomena and other aspects that are not accounted for in macroscopic simulations such as quasi-equilibrium drift–diffusion (DD) models, govern the steady-state operation of complete OPV devices. To answer the question, it would be highly desirable to have a microscopic model that is also able to describe the current–voltage (–) curve, particularly the open-circuit voltage () and the fill factor.
Modeling – curves with KMC has so far proven nearly impossible. One of the main challenges is the presence of two injecting contacts. While it may be acceptable to consider the contacts as simple sinks for electrons and holes in transient extraction experiments (performed at ), this simplification does not work for situations closer to . When the internal field is low, contacts inject many charge carriers into the active layer. This high carrier density is demanding from the computational point of view and challenging to correctly account for. Even though a few concepts exist how contacts can be implemented in KMC, literature studies have so far failed to fully describe – data of real devices or are based on assumptions that are not justified experimentally.10, 11, 12
Besides computational challenges, the injected charge density also sets the boundary conditions for the recombination of photogenerated carriers.13 Charge recombination generally becomes more important when going from short circuit to open circuit because transport will slow down. Indeed, the competition between charge extraction and recombination has been demonstrated to be the main determinant of the device fill factor.14, 15, 16 For a device model to be reliable it must therefore capture the hopping transport characteristics and the recombination kinetics at the same time. Even though the mechanisms of charge recombination are highly disputed, it is commonly accepted that the morphology plays a key role.17, 18, 6 For instance, it is well documented that aggregated donor or acceptor domains may lower the recombination rate.19, 20, 21, 22 However, although the morphology of many donor/acceptor blends is well characterized by electron microscopy and other techniques, the nanostructure is often neglected in KMC and an effective medium is assumed instead.23
Here, we present a KMC model that successfully predicts device – curves while simultaneously accounting for nonequilibrium hopping transport and recombination dynamics. We show that this is only possible when correct assumptions are made on the injection barriers, the morphology of the active layer, and the charge recombination rate. All these properties are calibrated by independent experimental techniques such as charge extraction, electron microscopy and transient absorption. We are thereby introducing a device model that works on a multitude of length and time scales. As such it will be useful for future investigations on the interplay between elementary processes and device characteristics of organic solar cells and other optoelectronic devices.
2 Results and Discussion
2.1 Material System
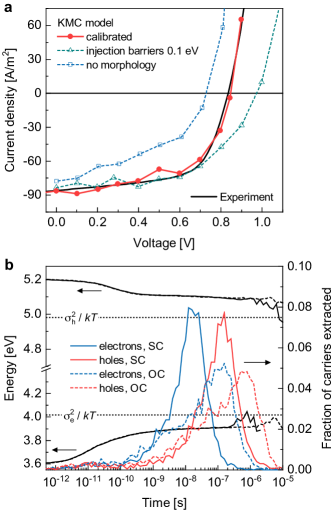
The aim of this work is to develop and experimentally calibrate a KMC model that fits both transient experiments and device – curves. Our material system for experimental calibration is TQ1:P\ceC71BM,24 an archetypal polymer/fullerene blend. The reason for choosing TQ1:P\ceC71BM is that for this specific system a clear picture of the carrier dynamics has emerged from time-resolved measurements and previous modeling, which is summarized in a recent review article.23 Hence, many of the parameters for the KMC model are already known; in particular, it has been shown that the charge extraction in thin devices with an active-layer thickness is strongly affected by nonequilibrium effects. Figure 1 shows the experimental – curve of a 72-nm thick TQ1:P\ceC71BM solar cell under simulated sunlight. The device displays an open-circuit voltage of 835 mV, a short-circuit current of , a fill factor of 0.63, and an efficiency of 4.5%.
2.2 KMC Describes Device Current–Voltage Curve
The KMC model, which is extended and experimentally calibrated in this work to fully describe OPV devices, has been introduced previously.1, 3 Briefly, it implements the extended Gaussian disorder model on a simple cubic lattice and takes into account: excitons; charge transfer (CT) pairs; electrons and holes; morphology via the allocation of individual hopping sites to different material phases; charge injection/extraction by hopping from/to the Fermi level of the respective contact; full Coulomb interactions, including those by image charges in the electrodes; periodic boundary conditions in the lateral directions.
Charge transport is described in terms of the Miller–Abrahams model, in which the hopping rate from site to site separated by a distance is given by
| (1) |
where is the attempt-to-hop frequency, the inverse localization length, the energy difference between the sites, and the thermal energy. Hopping is assumed to take place in a Gaussian DOS,
| (2) |
where is the single particle energy, the mean energy, and the width of the Gaussian DOS or the energetic disorder. We note that without of loss of generality, also other energy distributions could be assumed in the model, such as an exponential DOS. From previous studies, however, it is known that a Gaussian DOS gives the most appropriate description for the present TQ1:P\ceC71BM system both when describing transient and steady-state experiments.23, 25 In this work, only hopping between nearest neighbors on a regular, six-fold coordinated lattice was considered. In this configuration, the localization length is unimportant; the first exponential term of Equation (1) was implicitly included in , that is, the rate of downward nearest-neighbor hops.
The core working principle of a KMC model is to simulate the time evolution of a system based on the transition rates of all possible events (here: hops, generation, recombination, injection). The event that occurs at a certain point in time is randomly selected with the transition rates used as weighting factors. The time step between single events is calculated as , where is a random number drawn from a homogeneous distribution between 0 and 1, and the sum of the rates of all possible events. A typical simulation starts with a number of photogenerated excitons. Excitons may separate into CT pairs/free charges or recombine after their lifetime. Diffusion of excitons by Förster and Dexter energy transfer are both accounted for. An additional on-site barrier of 0.8 eV is used to facilitate charge separation in molecularly mixed phases. Further details on the used KMC algorithm can be found in the Supplementary Information of Ref. 3.
As mentioned above, the presence of injecting contacts causes computational challenges. Charge injection is mediated by the injection barriers, i.e., the energy offset between the contact Fermi level and the respective molecular orbital of the semiconductor. Especially for low barriers, carriers may oscillate multiple times across the contact interface before injection/extraction finally takes place. We mitigated this ‘small barrier’ problem by only allowing for a transfer if the number of charges next to the contact interface deviates from its equilibrium value. The transfer is modeled as hopping event with an attempt frequency of the same order as for the transport of the faster carrier (here: electrons) in the semiconductor. This ensures that charge collection is not limited by the contacts. Both the cathode and anode were considered nonselective; hence, possible losses due to diffusion of carriers into the ‘wrong’ contact are implicitly accounted for.
An advantage of KMC simulations is that no explicit assumptions about the formalism of charge recombination need to be made. Recombination of free charges involves the formation of a CT pair as intermediate. Exciton formation is explicitly allowed, but requires overcoming the relevant energy level offset between the TQ1 and P\ceC71BM; as such, it can be interpreted as the inverse of charge separation, i.e., the splitting of (CT) excitons into free electrons and holes. As discussed in more detail below, it is then the inverse lifetime of the CT state that determines the recombination rate and must be calibrated experimentally.
| Parameter | Value |
|---|---|
| Simulated volume [sites] | |
| Nearest neighbor distance, [nm] | |
| Energetic disorder electrons, [meV] | |
| Attempt-to-hop frequency electrons, [] | |
| Energetic disorder holes, [meV] | |
| Attempt-to-hop frequency holes, [] | |
| Inverse exciton lifetime, [] | |
| Inverse CT state lifetime, [] | |
| Injection barrier height [eV] | |
| Contact attempt-to-hop frequency, [] |
The filled circles in Figure 1a show that after the calibration discussed below, the KMC model fits the – curve of the TQ1:P\ceC71BM solar cell well within experimental accuracy and matches both the device and fill factor. Table 1 lists the key parameters used for the simulations. We note that these values are not the result of a fitting routine but come from independent characterizations. The hopping parameters were chosen in such a way that they represent earlier experiments, such as time-resolved electric-field-induced second harmonic generation (TREFISH)4 and temperature-dependent space-charge-limited currents (SCLC),4, 26 but at the same time allow efficient calculations. This was done by assuming a single disorder for electrons and holes () and adjusting the attempt frequencies such that the macroscopic transport characteristics of TQ1:P\ceC71BM, e.g., the contrast between electron and hole mobility, are still captured (see Supporting Information for details). Figure 1b shows that also with the symmetrized hopping parameters, relaxation in the DOS is far from being complete when photogenerated carriers are extracted. This is true for both short-circuit and open-circuit conditions, which indicates that nonequilibrium effects may affect charge extraction along the entire – curve. A detailed discussion of how the nonequilibrium effects influence the individual performance parameters will be the topic of another publication.
The main result of this study is that a KMC model that can describe full – characteristics requires an appropriate description and calibration of the injection barriers and the morphology in the active layer. If wrong or too simple assumptions are made on these properties, our otherwise well validated KMC model can no longer describe the device (Figure 1a, open symbols). Because this mainly concerns and the fill factor, these observations are closely related to the charge recombination. In the following sections we will therefore focus on the factors that determine the shape of the – curves in the fourth quadrant, that is the injection barrier height, the blend morphology, and the recombination rate.
2.3 Calibration of Injection Barriers
The injection barriers set the carrier density in the device around the built-in voltage. To get a realistic estimate of the barrier height, we compare the results of charge extraction experiments in the dark with device simulations. As KMC calculations are computationally too expensive for this approach, we used a DD model instead.27, 28 This is justified because the charges treated here were not photogenerated, but injected from the contacts, so that the complexities of exciton/charge separation are bypassed. Furthermore, charges are injected from thermalized reservoirs (contacts), so that it is reasonable to describe them by a quasi-equilibrium mobility. The mobility values were estimated by inserting the hopping parameters in Table 1 in the mobility functional by Pasveer et al.29 Charge recombination is assumed to be strictly bimolecular with the steady-state recombination coefficient () taken from experimental studies on TQ1:P\ceC71BM.30, 31
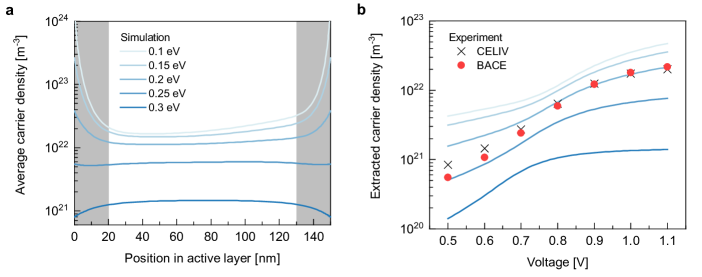
Figure 2a illustrates the effect of the injection barrier height on the average carrier density. Here, we chose devices with an active-layer thickness of 150 nm; only at these larger thicknesses a ‘bulk’ region is established, which makes the comparison with charge-extraction experiments more reliable.32, 33 Note that especially at higher densities the carrier profiles are not perfectly symmetric, which is due to the imbalanced electron and hole transport.34, 28 The experiments to be simulated are charge extraction by linearly increasing voltage (CELIV) and bias-assisted charge extraction (BACE). In both techniques, the device is held at a certain pre-bias () until a steady state is reached; the charges in the device are then extracted by applying a triangular (CELIV) or rectangular (BACE) voltage pulse. The dark carrier density is calculated from the transient current via
| (3) |
where is the elementary charge, the active-layer thickness, the displacement current measured at , and the time at which charge extraction is completed. Note that in the form of Equation (3), the carrier density represents the average of electrons and holes, as pointed out by Hawks et al.35
Figure 2b shows that CELIV and BACE give a consistent picture of the carrier density as a function of voltage. At , which approximately corresponds to open-circuit conditions under 1-sun illumination, is about . This is the same order of magnitude as for the photogenerated carrier density and indicates the importance of injected carriers for charge recombination. As can be seen, the best description of the dark carrier density and its voltage dependence is obtained for a barrier height of 0.2 eV; with this value, the KMC model reproduces the experimental – curve (see Figure 1). We note that the discrepancy between CELIV/BACE and DD simulation at voltages well below the built-in voltage is merely due to experimental limitations. In this regime, most carriers are situated in the thin space-charge regions close to the contacts, which makes them only partly visible to charge-extraction experiments.36, 14
If instead too small injection barriers are selected as input for the KMC model, it can no longer describe both and the fill factor. The open triangles in Figure 1 illustrate this for a barrier height of 0.1 eV. Although this is not pursued further in this work, we would like to stress that this finding shows that defining a contact as ‘Ohmic’, in the sense that it does not limit injection and extraction in a particular experiment, is insufficient. Here, injection barriers of 0.1 and 0.2 eV both give rise to ‘Ohmic’ injection, implying bulk-limited transport under forward bias, but these barriers are not equivalent in terms of the resulting photovoltaic behavior.
Another interesting observation is that, as one would expect, lowering the injection barriers from 0.2 to 0.1 eV leads to an increase in . But at the same time the fill factor becomes reduced, so that the overall power conversion efficiency stays roughly the same. Hence, we can deduce from our KMC simulations that reducing the injection barriers does not per se lead to a better performing solar cell device. Closer examination of this aspect, however, requires more extensive parameter studies, which are beyond the scope of the present paper and will be the subject of future work.
2.4 Morphology Governs Charge Recombination
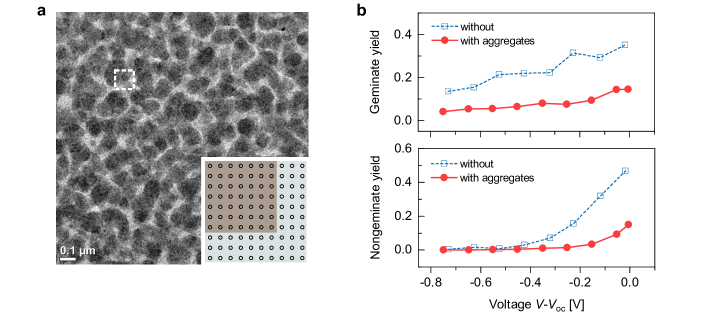
In our previous KMC studies the photoactive blend was assumed as an effective hopping medium without any morphological features.3, 1, 4 This zero-order approximation is reasonable when describing experiments on the ps–s timescale where charge recombination is insignificant. However, we find that the effective-medium approach fails to fully describe the device – curve (Figure 1, open squares). In order to obtain a more realistic picture of the morphology, we performed transmission electron microscopy (TEM). Figure 3a shows a representative bright-field (BF) TEM image of a TQ1:P\ceC71BM blend that was prepared the same way as for device fabrication. The image displays a granular structure with clusters of dark contrast of about 100 nm in size. Dark regions in BF-TEM images of polymer/fullerene blends are commonly attributed to fullerene domains because of their higher density. However, this assignment is not unambiguous; the different intensities could also be caused by phase contrast due to local crystallinity differences. For comparison, we investigated the same sample in scanning transmission electron microscopy (STEM) mode using a high-angle annular dark field (HAADF) detector.37, 38 In the Supporting Information we show that HAADF-STEM reveals very similar structures as in Figure 3a, but of inverted contrast. This clearly confirms that the clusters seen in TEM are P\ceC71BM aggregates, in agreement with earlier work on similar blend systems.39
The main effect of aggregation is to reduce the energy gap between the highest occupied molecular orbital (HOMO) and the lowest unoccupied molecular orbital (LUMO) compared to the amorphous material. This creates an energy cascade with a driving force for carriers to move from the (molecularly mixed) amorphous regions towards the (material-pure) aggregates and will affect the way how charges separate and recombine.19, 22, 21, 20 We implemented the aggregates in the KMC model as inclusions in a unit cell describing the mixed donor/acceptor phase (Figure 3a, inset). Inclusions were assumed to consist of pure P\ceC71BM with a 0.2 eV lower-lying LUMO compared to the mixed phase; all other properties were left unchanged to keep the number of unknown parameters at a minimum. We did not consider pure TQ1 domains, as our TEM experiments do not provide any evidence for them. This is reasonable, since TQ1 is a relatively amorphous polymer that has no strong tendency to form aggregates, in particular in blends with excess fullerene.40
Note that the aggregate size in the KMC model is smaller than what is suggested from the electron microscopy images. This was done to keep the simulation box computationally tractable while still getting reasonable statistics. The size of the inclusions and the unit cell were chosen such that the donor/acceptor ratio of the blend is maintained. A detailed examination of the structure size on the device performance is beyond the scope of this work; however, first tests indicate that the actual size of the aggregates is much less important than their presence. Likewise, a 0.1 eV lower-lying LUMO for the aggregate phase did not make any relevant difference as compared to the used 0.2 eV.
Only with the inclusions in the effective hopping medium we were able to match the fill factor of the experimental devices. Figure 3b shows that this is due to a reduction of the charge recombination. Importantly, the presence of aggregates simultaneously reduces the yields of geminate and nongeminate recombination. This confirms earlier suggestions that the generation and recombination of free charges are coupled via the ability of CT pairs to separate.41, 42 In other words, the possibility for carriers (here: electrons) to lower their energy by moving to the aggregates will not only increase the charge separation yield, but also reduce the nongeminate recombination. This is a clear hint that the different ability to form aggregates/phase-pure domains may explain why different OPV materials show so different recombination rates compared to the Langevin model. In the context of this work, however, it means that it is the kinetics of the CT states, i.e., how they dissociate and (re-)associate, that must be calibrated experimentally.
2.5 Calibration of the Recombination Rate
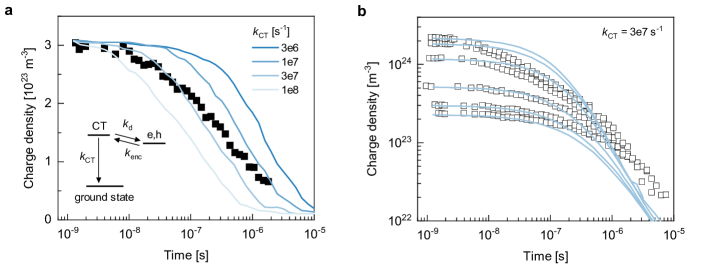
The inset in Figure 4 illustrates the kinetic model of charge recombination that has emerged from literature.41, 19, 30, 42, 2 As we discuss to some detail in the Supporting Information, recombination in TQ1:P\ceC71BM is not limited by the rate at which free carriers meet to form an interfacial CT complex. This implies that the probability for the CT pair to dissociate is much higher than to decay to the ground state (). It has been shown that in such a situation an equilibrium between CT states and free charge carriers is established.41, 2 The position of the equilibrium is determined by the rate , which is the relevant parameter in the KMC model to calibrate the recombination.
In order to do so, we use the results of transient absorption (TA) experiments. TA is a pump-probe technique that optically tracks a carrier population created by a short light pulse over time. As the experiment is carried out under flat-band conditions, the measured decay solely reflects the recombination kinetics. Figure 4a shows the TA decay of a TQ1:P\ceC71BM device for a pump fluency of taken from literature.43 The traces are attempts to describe the experiment with our KMC model. One can clearly see that the (inverse) CT state lifetime is the crucial parameter for the decay dynamics. The best fit on short time scales is obtained for . Figure 4b demonstrates that with the calibrated value for , we are able to reasonably describe transient absorption data for a range of initial carrier densities.
On longer time scales, however, the fit between TA experiment and KMC model is not as good. The reason for this are the symmetrized transport parameters we use for computational effectiveness. As discussed in the Supporting Information, the disorder and attempt-to-hop frequency are largely interchangeable, i.e., increasing the one parameter can be compensated by decreasing the other and vice versa. This interchangeability allows us to use the values given in Table 1, which keep the KMC calculations manageable, while still reproducing the measured quasi-steady state mobilities. Nevertheless, using symmetrized transport parameters remains a simplification, so that some of the details necessary to describe the full TA traces are lost. In Figure S2 we show that a better fit can be obtained when the ‘real’, non-symmetrized values for and are used in the simulation. However, significant differences between the parameter sets are only noticeable at very high initial carrier densities () and on the time scale of s and beyond. At those times, most of the carriers have already been extracted, as can be seen from the histograms in Figure 3b and from previous experiments.1, 4, 23 Hence, the use of the simplified transport parameters is well justified when describing a solar cell under standard operating conditions.
3 Conclusions
We have presented a KMC model that fully describes the – curve of a disordered organic solar cell under solar illumination. The agreement between experiment and simulation is obtained by experimentally calibrating the injections barriers, the blend morphology, and the dynamics of the CT state involved in charge recombination. Our work clearly highlights the importance of contacts for a KMC model to describe operating OPVs. We find that seemingly small changes in the injection barrier height can have major impact on the device and fill factor. This confirms that injected charges play a key role in the apparent recombination mechanism. Furthermore, we find charge recombination to be limited by the fate of the intermediate CT exciton, which can be influenced by the presence of aggregates in the active layer, and not by the transport of electrons and holes; our results indicate that the energy difference between the aggregated and mixed regions and the aggregate size is not that important, but the presence of aggregates is.
The platform introduced in this work will be useful for future studies on properties of OPV materials that are not accessible via macroscopic, quasi-equilibrium modeling techniques such as drift–diffusion. Questions to be answered include but are not limited to how nonequilibrium effects affect the device operation and what the critical morphological factors are that determine the charge recombination. Finally, we point out that our results give strong support that the conclusions derived from previous transient KMC studies are also relevant for OPVs under standard operating conditions.
4 Experimental Section
Device Fabrication:
Binary solution of poly[[2,3-bis(3-octyloxyphenyl)-5,8-quinoxalinediyl]-2,5-thiophenediyl] (TQ1) and [6,6]-phenyl-\ceC71-butyric acid methyl ester (P\ceC71BM) in weight ratio 1:2.5 was prepared in chlorobenzene to a total concentration of . The device structure was ITO/PEDOT:PSS (30 nm)/TQ1:P\ceC71BM (72 nm)/LiF (0.6 nm)/Al (90 nm). ITO-coated glass substrates were boiled in a 5:1:1 mixture (by volume) of deionized water, ammonium hydroxide (25%) and hydrogen peroxide (28%) at for 15 min for cleaning. PEDOT:PSS (Baytron P VP Al 4083) was spin-coated onto the ITO glasses at 3000 rpm for 40 s, followed by annealing at for 10 min. The active layer was spin coated at 500 rpm for 60 s. The LiF/Al top electrode was deposited by thermal evaporation through a shadow mask to get an active area of .
Electrical Measurements:
Current–voltage curves were recorded with a Keithley 2401 source measure unit under standard AM1.5G illumination () using an Oriel LSH-7320 solar simulator. Dark charge extraction measurements were performed using a pulse generator (SRS DG 535) and a function generator (SRS DS 345) for applying the extraction voltage pulse and an oscilloscope (Tektronix TDS 680B) for recording the current transient. Devices were mounted in a vacuum cryostat kept at room temperature. The measurement setup was controlled from a computer using a LabVIEW program. In the CELIV experiments, a steady-state voltage was applied in forward bias of the solar cell and a linearly increasing extraction pulse with and a total pulse length of was used for charge extraction. For the BACE measurements, the same as used in the CELIV measurements was applied and charges were extracted using a rectangular voltage pulse with an amplitude 2.5 V and a pulse length of .
Electron Microscopy:
Samples for TEM were prepared by floating off TQ1:P\ceC71BM films from PEDOT:PSS-coated glass substrates in deionized water. This was followed by picking up the films directly on TEM copper mesh grids for imaging. BF-TEM images were taken at an acceleration voltage of 200 kV in a FEI Tecnai T20 instrument. HAADF-STEM images were taken at an acceleration voltage of 300 kV in a FEI Titan 80-300.
This project has received funding through European Union’s Horizon 2020 research and innovation programme under the Marie Skłodowska-Curie grant agreement No 799801 (‘ReMorphOPV’). T.U., G.P. and E.O. acknowledges funding by Vetenskapsrådet (project ‘OPV2.0’). A.M. acknowledges support from the Knut and Alice Wallenberg Foundation (KAW 2016.0494) for Postdoctoral Research at Stanford University. S.D. and R.Ö. acknowledge financial support from the Jane & Aatos Erkko foundation (project ‘ASPIRE’). G.P. and E.O. thank the Chalmers Material Analysis Laboratory for their support of microscopes.
Keywords
Organic Photovoltaics, Kinetic Monte Carlo Simulations, Charge Injection, Charge Recombination, Morphology
References
- Melianas et al. [2014] Melianas, A.; Pranculis, V.; Devižis, A.; Gulbinas, V.; Inganäs, O.; Kemerink, M. Dispersion-Dominated Photocurrent in Polymer:Fullerene Solar Cells. Adv. Funct. Mater. 2014, 24, 4507–4514
- Howard et al. [2014] Howard, I. A.; Etzold, F.; Laquai, F.; Kemerink, M. Nonequilibrium Charge Dynamics in Organic Solar Cells. Adv. Energy Mater. 2014, 4, 1301743
- Melianas et al. [2015] Melianas, A.; Etzold, F.; Savenije, T. J.; Laquai, F.; Inganäs, O.; Kemerink, M. Photo-Generated Carriers Lose Energy During Extraction from Polymer-Fullerene Solar Cells. Nat. Commun. 2015, 6, 8778
- Melianas et al. [2017] Melianas, A.; Pranculis, V.; Xia, Y.; Felekidis, N.; Inganäs, O.; Gulbinas, V.; Kemerink, M. Photogenerated Carrier Mobility Significantly Exceeds Injected Carrier Mobility in Organic Solar Cells. Adv. Energy Mater. 2017, 7, 1602143
- Lyons et al. [2012] Lyons, B. P.; Clarke, N.; Groves, C. The Relative Importance of Domain Size, Domain Purity and Domain Interfaces to the Performance of Bulk-Heterojunction Organic Photovoltaics. Energy Environ. Sci. 2012, 5, 7657–7663
- Heiber et al. [2015] Heiber, M. C.; Baumbach, C.; Dyakonov, V.; Deibel, C. Encounter-Limited Charge-Carrier Recombination in Phase-Separated Organic Semiconductor Blends. Phys. Rev. Lett. 2015, 114, 136602
- Groves and Greenham [2008] Groves, C.; Greenham, N. C. Bimolecular Recombination in Polymer Electronic Devices. Phys. Rev. B 2008, 78, 155205
- Coropceanu et al. [2017] Coropceanu, V.; Brédas, J. L.; Mehraeen, S. Impact of Active Layer Morphology on Bimolecular Recombination Dynamics in Organic Solar Cells. J. Phys. Chem. C 2017, 121, 24954–24961
- Kaiser and Gagliardi [2019] Kaiser, W.; Gagliardi, A. Kinetic Monte Carlo Study of the Role of the Energetic Disorder on the Open-Circuit Voltage in Polymer/Fullerene Solar Cells. J. Phys. Chem. Lett. 2019, 10, 6097–6104
- Meng et al. [2010] Meng, L.; Shang, Y.; Li, Q.; Li, Y.; Zhan, X.; Shuai, Z.; Kimber, R. G. E.; Walker, A. B. Dynamic Monte Carlo Simulation for Highly Efficient Polymer Blend Photovoltaics. J. Phys. Chem. B 2010, 114, 36–41
- Meng et al. [2011] Meng, L.; Wang, D.; Li, Q.; Yi, Y.; Brédas, J. L.; Shuai, Z. An Improved Dynamic Monte Carlo Model Coupled with Poisson Equation to Simulate the Performance of Organic Photovoltaic Devices. J. Chem. Phys. 2011, 134, 124102
- Kipp and Ganesan [2013] Kipp, D.; Ganesan, V. A Kinetic Monte Carlo Model with Improved Charge Injection Model for the Photocurrent Characteristics of Organic Solar Cells. J. Appl. Phys. 2013, 113, 234502
- Würfel et al. [2019] Würfel, U.; Perdigón-Toro, L.; Kurpiers, J.; Wolff, C. M.; Caprioglio, P.; Rech, J. J.; Zhu, J.; Zhan, X.; You, W.; Shoaee, S.; Neher, D.; Stolterfoht, M. Recombination between Photogenerated and Electrode-Induced Charges Dominates the Fill Factor Losses in Optimized Organic Solar Cells. J. Phys. Chem. Lett. 2019, 10, 3473–3480
- Neher et al. [2016] Neher, D.; Kniepert, J.; Elimelech, A.; Koster, L. J. A. A New Figure of Merit for Organic Solar Cells with Transport-limited Photocurrents. Sci. Rep. 2016, 6, 24861
- Bartesaghi et al. [2015] Bartesaghi, D.; Del Carmen Pérez, I.; Kniepert, J.; Roland, S.; Turbiez, M.; Neher, D.; Koster, L. J. A. Competition Between Recombination and Extraction of Free Charges Determines the Fill Factor of Organic Solar Cells. Nat. Commun. 2015, 6, 7083
- Kaienburg et al. [2016] Kaienburg, P.; Rau, U.; Kirchartz, T. Extracting Information about the Electronic Quality of Organic Solar-Cell Absorbers from Fill Factor and Thickness. Phys. Rev. Appl. 2016, 6, 024001
- Göhler et al. [2018] Göhler, C.; Wagenpfahl, A.; Deibel, C. Nongeminate Recombination in Organic Solar Cells. Adv. Electron. Mater. 2018, 4, 1700505
- Lakhwani et al. [2014] Lakhwani, G.; Rao, A.; Friend, R. H. Bimolecular Recombination in Organic Photovoltaics. Annu. Rev. Phys. Chem. 2014, 65, 557–581
- Burke and McGehee [2014] Burke, T. M.; McGehee, M. D. How High Local Charge Carrier Mobility and an Energy Cascade in a Three-Phase Bulk Heterojunction Enable >90% Quantum Efficiency. Adv. Mater. 2014, 26, 1923–1928
- Jamieson et al. [2012] Jamieson, F. C.; Domingo, E. B.; McCarthy-Ward, T.; Heeney, M.; Stingelin, N.; Durrant, J. R. Fullerene Crystallisation as a Key Driver of Charge Separation in Polymer/Fullerene Bulk Heterojunction Solar Cells. Chem. Sci. 2012, 3, 485–492
- Sweetnam et al. [2014] Sweetnam, S.; Graham, K. R.; Ngongang Ndjawa, G. O.; Heumüller, T.; Bartelt, J. A.; Burke, T. M.; Li, W.; You, W.; Amassian, A.; McGehee, M. D. Characterization of the Polymer Energy Landscape in Polymer:Fullerene Bulk Heterojunctions with Pure and Mixed Phases. J. Am. Chem. Soc. 2014, 136, 14078–14088
- McMahon et al. [2011] McMahon, D. P.; Cheung, D. L.; Troisi, A. Why Holes and Electrons Separate So Well in Polymer/Fullerene Photovoltaic Cells. J. Phys. Chem. Lett. 2011, 2, 2737–2741
- Melianas and Kemerink [2019] Melianas, A.; Kemerink, M. Photogenerated Charge Transport in Organic Electronic Materials: Experiments Confirmed by Simulations. Adv. Mater. 2019, 1806004
- Wang et al. [2010] Wang, E.; Hou, L.; Wang, Z.; Hellström, S.; Zhang, F.; Inganäs, O.; Andersson, M. R. An Easily Synthesized Blue Polymer for High‐Performance Polymer Solar Cells. Adv. Mater. 2010, 22, 5240–5244
- Melianas et al. [2019] Melianas, A.; Felekidis, N.; Puttisong, Y.; Meskers, S. C. J.; Inganäs, O.; Chen, W. M.; Kemerink, M. Nonequilibrium Site Distribution Governs Charge-Transfer Electroluminescence at Disordered Organic Heterointerfaces. Proc. Natl. Acad. Sci. USA 2019, 116, 23416–23425
- Upreti et al. [2019] Upreti, T.; Wang, Y.; Zhang, H.; Scheunemann, D.; Gao, F.; Kemerink, M. Experimentally Validated Hopping-Transport Model for Energetically Disordered Organic Semiconductors. Phys. Rev. Applied 2019, 12, 064039
- Burgelman et al. [2000] Burgelman, M.; Nollet, P.; Degrave, S. Modelling Polycrystalline Semiconductor Solar Cells. Thin Solid Films 2000, 361-362, 527–532
- Wilken et al. [2020] Wilken, S.; Sandberg, O. J.; Scheunemann, D.; Österbacka, R. Watching Space Charge Build up in an Organic Solar Cell. Sol. RRL 2020, 4, 1900505
- Pasveer et al. [2005] Pasveer, W. F.; Cottaar, J.; Tanase, C.; Coehoorn, R.; Bobbert, P. A.; Blom, P. W. M.; de Leeuw, D. M.; Michels, M. A. J. Unified Description of Charge-Carrier Mobilities in Disordered Semiconducting Polymers. Phys. Rev. Lett. 2005, 94, 206601
- Murthy et al. [2013] Murthy, D. H. K.; Melianas, A.; Tang, Z.; Juška, G.; Arlauskas, K.; Zhang, F.; Siebbeles, L. D. A.; Inganäs, O.; Savenije, T. J. Origin of Reduced Bimolecular Recombination in Blends of Conjugated Polymers and Fullerenes. Adv. Funct. Mater. 2013, 23, 4262–4268
- Roland et al. [2019] Roland, S.; Kniepert, J.; Love, J. A.; Negi, V.; Liu, F.; Bobbert, P.; Melianas, A.; Kemerink, M.; Hofacker, A.; Neher, D. Equilibrated Charge Carrier Populations Govern Steady-State Nongeminate Recombination in Disordered Organic Solar Cells. J. Phys. Chem. Lett. 2019, 10, 1374–1381
- Kirchartz and Nelson [2012] Kirchartz, T.; Nelson, J. Meaning of Reaction Orders in Polymer:Fullerene Solar Cells. Phys. Rev. B 2012, 86, 165201
- Deledalle et al. [2014] Deledalle, F.; Tuladhar, P. S.; Nelson, J.; Durrant, J. R.; Kirchartz, T. Understanding the Apparent Charge Density Dependence of Mobility and Lifetime in Organic Bulk Heterojunction Solar Cells. J. Phys. Chem. C 2014, 118, 8837–8842
- Scheunemann et al. [2019] Scheunemann, D.; Wilken, S.; Sandberg, O. J.; Österbacka, R.; Schiek, M. Effect of Imbalanced Charge Transport on the Interplay of Surface and Bulk Recombination in Organic Solar Cells. Phys. Rev. Appl. 2019, 11, 054090
- Hawks et al. [2015] Hawks, S. A.; Finck, B. Y.; Schwartz, B. J. Theory of Current Transients in Planar Semiconductor Devices: Insights and Applications to Organic Solar Cells. Phys. Rev. Appl. 2015, 3, 044014
- Kniepert et al. [2014] Kniepert, J.; Lange, I.; van der Kaap, N. J.; Koster, L. J. A.; Neher, D. A Conclusive View on Charge Generation, Recombination, and Extraction in As-Prepared and Annealed P3HT:PCBM Blends: Combined Experimental and Simulation Work. Adv. Energy Mater. 2014, 4, 1301401
- Loos et al. [2009] Loos, J.; Sourty, E.; Lu, K.; de With, G.; van Bavel, S. Imaging Polymer Systems with High-Angle Annular Dark Field Scanning Transmission Electron Microscopy (HAADF-STEM). Macromol. 2009, 42, 2581–2586
- Alekseev et al. [2015] Alekseev, A.; Hedley, G. J.; Al-Afeef, A.; Ageev, O. A.; Samuel, I. D. W. Morphology and Local Electrical Properties of PTB7:PC71BM Blends. J. Mater. Chem. A 2015, 3, 8706–8714
- Bäcke et al. [2015] Bäcke, O.; Lindqvist, C.; de Zerio Mendaza, A. D.; Gustafsson, S.; Wang, E.; Andersson, M. R.; Müller, C.; Olsson, E. Mapping Fullerene Crystallization in a Photovoltaic Blend: An Electron Tomography Study. Nanoscale 2015, 7, 8451–8456
- Wang et al. [2013] Wang, E.; Bergqvist, J.; Vandewal, K.; Ma, Z.; Hou, L.; Lundin, A.; Himmelberger, S.; Salleo, A.; Müller, C.; Inganäs, O.; Zhang, F.; Andersson, M. Conformational Disorder Enhances Solubility and Photovoltaic Performance of a Thiophene–Quinoxaline Copolymer. Adv. Energy Mater. 2013, 3, 806–814
- Burke et al. [2015] Burke, T. M.; Sweetnam, S.; Vandewal, K.; McGehee, M. D. Beyond Langevin Recombination: How Equilibrium Between Free Carriers and Charge Transfer States Determines the Open-Circuit Voltage of Organic Solar Cells. Adv. Energy Mater. 2015, 5, 1500123
- Shoaee et al. [2019] Shoaee, S.; Armin, A.; Stolterfoht, M.; Hosseini, S. M.; Kurpiers, J.; Neher, D. Decoding Charge Recombination through Charge Generation in Organic Solar Cells. Sol. RRL 2019, 3, 1900184
- Andersson et al. [2013] Andersson, L. M.; Melianas, A.; Infahasaeng, Y.; Tang, Z.; Yartsev, A.; Inganäs, O.; Sundström, V. Unified Study of Recombination in Polymer:Fullerene Solar Cells Using Transient Absorption and Charge-Extraction Measurements. J. Phys. Chem. Lett. 2013, 4, 2069–2072