Calibration and reference simulations for the
auditory periphery model of Verhulst et al. 2018 version 1.2
| Abbreviations | |||
| ABR | Auditory Brainstem Response | IC | Inferior Colliculus |
| AM | Amplitude Modulation | IIR | Infinite Impulse Response |
| AN | Auditory Nerve | MTF | Modulation Transfer Function |
| CF | Characteristic Frequency | NH | Normal hearing |
| CN | Cochlear Nucleus | HI | Hearing impaired |
| EFR | Envelope Following Response | pe SPL | peak-equivalent Sound Pressure Level |
| FFT | Fast Fourier Transform | W-I,-III,-V | Waves I, III, V |
The code of the auditory periphery model can be retrieved from: https://github.com/HearingTechnology/ Verhulstetal2018Model/. The current model version can be cited as follows: “We adopted the model of the human auditory periphery described by Verhulst, Altoè, and Vasilkov (Verhulst2018a) in the v1.2 implementation (Osses Vecchi & Verhulst, 2019).”
Abstract
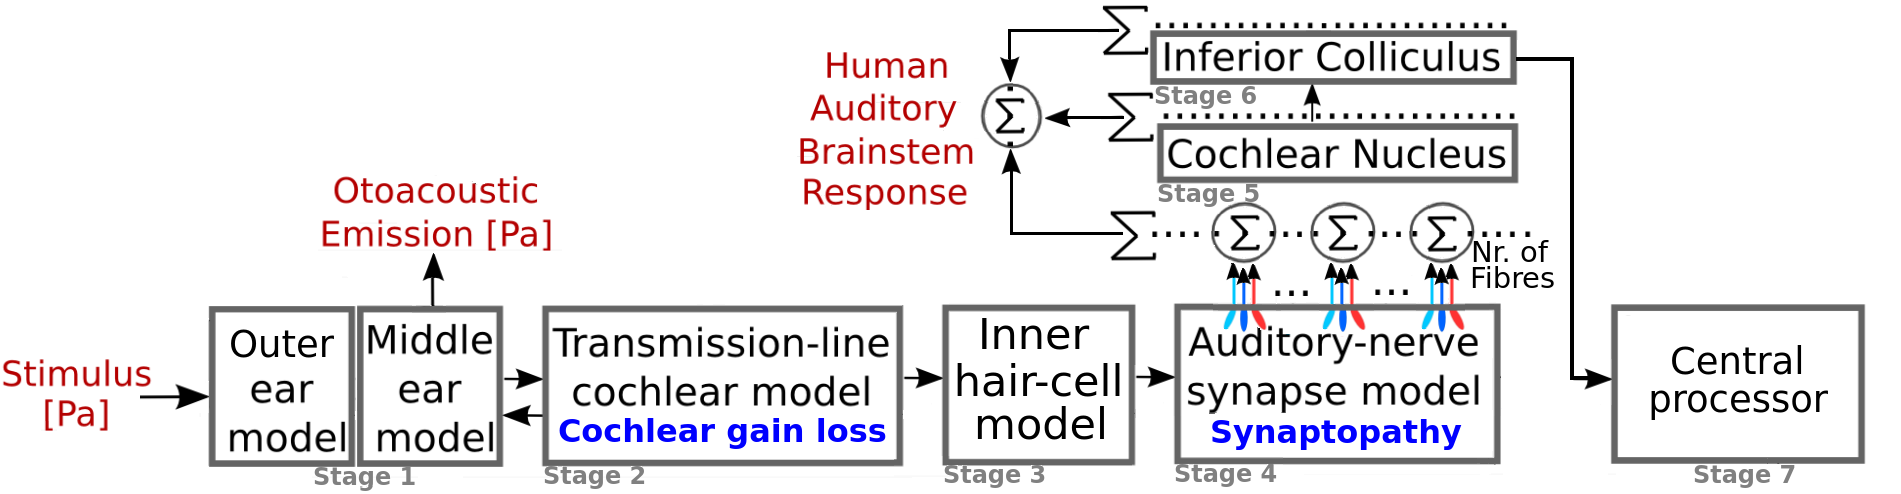
This document describes a comprehensive procedure of how the biophysical model published by Verhulst et al. (2018) [[]]Verhulst2018a can be calibrated on the basis of reference auditory brainstem responses (ABRs). Additionally, the filter design used in two of the model stages, cochlear nucleus (CN) and inferior colliculus (IC), is described in detail. These descriptions are valid for a new release of the Verhulst et al. model, version 1.2, as well as for previous versions of the model (version 1.1 or earlier), whose block diagram is shown in Fig. 1 [[, see also,]their Fig. 1]Verhulst2018a,Osses2019b. The differences between the model versions are explicitly mentioned and simulations to basic auditory stimuli are shown for model versions 1.1 and 1.2. Version 1.2 of the model includes a new implementation of the CN and IC stages (Stages 5 and 6). All previous model stages (Stages 1-4 in Fig. 1: outer and middle ear, transmission-line cochlear filter bank, inner hair cell model, and auditory nerve model) remained unchanged.
In the new release (model version 1.2), in addition to the updated CN and IC stages, we employed a different calibration procedure to match human reference ABR amplitudes of waves I, III, and V more faithfully. This release note shows the implications of these model adjustments on the simulations presented in the original 2018 model paper. For this purpose, results from two model versions are reported:
The main difference between IC model stages relates to the degree of IC inhibition that was applied, with more inhibition in v1.2 than implemented in v1.1. The time domain simulations presented in this document show that this change in inhibition strength does not drastically change the results presented in the original paper. However, v1.2 more correctly captures the physiologically derived CN and IC inhibition/excitation strengths [Nelson2004].
1 Model description
The model of the auditory periphery, whose framework is described in [Verhulst2018a, Verhulst2015, Verhulst2012], offers a quantitative description of different functional components of the hearing system, providing simulated neural representations in the ascending auditory pathway up to the inferior colliculus. Its functioning was evaluated on the basis of human otoacoustic emissions [Verhulst2012] and auditory evoked potentials [Verhulst2018a, Verhulst2015]. The block diagram of the model is shown in Fig. 1. The first processing stage of the model is the outer- and middle-ear models. The outer ear model [Pralong1996] simulates the presentation of sounds through circumaural headphones. If the outer ear is omitted, then the sounds are assumed to be presented via in-ear earphones. After the outer- and middle-ear filters (Stage 1), the signal is fed into a transmission-line cochlear filter bank (Stage 2) where basilar membrane vibrations are simulated at 401 equidistant cochlear locations. A non-linear compression is applied to the cochlear vibrations, followed by a conversion into inner-hair-cell receptor potentials (Stage 3). These potentials are used to generate spike-rate patterns at the level of the auditory nerve (AN, Stage 4), which are related to fibres that have high- (HSR, 70 spikes/s), medium- (MSR, 10 spikes/s), and low-spontaneous rates (LSR, 1 spikes/s). These patterns are finally combined (13 HSR, 3 MSR, and 3 LSR fibres, i.e., 13-3-3) to form the input to a model of the spherical bushy cell in the cochlear nucleus (Stage 5) and inferior colliculus (Stage 6). The information across simulated characteristic frequencies available at the outputs of Stages 4, 5, and 6 offer a correlate of human brainstem responses recorded from scalp electrodes. The “central processor stage” (Stage 7) represents a way to integrate the simulated information in the ascending auditory pathway that is assumed to represent the way in which human listeners code and compare sounds among each other [Osses2019b, Verhulst2018b].
Model update in v1.2
In model v1.2 two changes were introduced to the CN/IC model description (script ic_cn2018.py, from the GitHub repository). One of the changes (correction of a bug) is relevant and affects the IC stage implementation while the other is a minor change that was introduced to the lowpass filter design of alpha functions (v1.2 using Eq. (LABEL:eq:coeffv12), v1.1 using Eq. (LABEL:eq:coeffv11), see Section LABEL:sec:CN+IC).
A bug in the v1.1 IC implementation resulted in a dominance of the excitatory neural responses while the effect of the inhibitory responses was nearly marginal. This situation was a consequence of using and as scaling constants for the excitatory and inhibitory signals, respectively, instead of and as shown later in Eq. (LABEL:eq:IC). The excitation-dominated IC outputs were due to the much larger value than .
As a consequence of correcting this bug, the original M5 scaling factor (referred to as AW-V in the model paper [Verhulst2018a]) had to be updated to maintain human-like ABR wave-V amplitudes. Because we needed to re-calibrate, we decided to adopt a more accurate procedure to calibrate the model constants to match the normative data by