Thermodynamic stability and vibrational anharmonicity of black phosphorene - beyond quasi-harmonic analysis
Abstract
Thermodynamic stability and vibrational anharmonicity of single layer black phosphorene (SLBP) are studied using a spectral energy density (SED) method. Thermal stability of SLBP sheet is analyzed by computing phonon dispersion at 300 K, which shows that SLBP sheet is dynamically stable at finite temperature and survives the crumpling transition. Temperature evolution of all zone center optic phonon modes are extracted, including experimentally forbidden IR and Raman active modes. Mode resolved phonon frequencies of optic modes shows significant deviation from quasi-harmonic prediction, which is ascribed to the effects of inclusion of higher order phonon-phonon scattering processes. Further, temperature sensitivity of each mode is analyzed by computing their first order temperature co-efficient (). The quasi-harmonic values are one order magnitude smaller than the SED and experimental values; which again substantiate that quasi-harmonic methods are inadequate, and a full anaharmonic analysis is essential to explain structure and dynamics of SLBP at finite temperatures.
The search for 2D materials with novel, structural, electronic and thermal properties has geared up in past few years (Zhou et al., 2019). Single layer of black phosphorous, known as black phosphorene (SLBP) is a special member in 2D family due to its intriguing structural and electronic properties (Li et al., 2014; Churchill and Jarillo-Herrero, 2014; Xia et al., 2014). The band gap ( 1.5 eV) (Liu et al., 2014) and carrier mobility ( 1000 cm2 V-1 s-1)(Li et al., 2014) of SLBP make it a promising candidate for nano (Liu et al., 2014; Li et al., 2014; Xia et al., 2014) and opto-electronic device fabrications (Churchill and Jarillo-Herrero, 2014; Xia et al., 2014). SLBP also found its application in photo-transistors (Liu et al., 2014; Li et al., 2014; Xia et al., 2014),(Qin et al., 2014; Low et al., 2014; Lv et al., 2014), thermo-electric devices (Qin et al., 2014; Lv et al., 2014; Fei et al., 2014) and gas sensors (Suvansinpan et al., 2016).
Being a technologically promising material in many industries, it is essential to have knowledge on its vibrational and thermal properties. The vibrational dynamics of mono and few-layer phosphorene have been extensively studied using Raman scattering techniques(Fei and Yang, 2014; Su and Zhang, 2015; Łapińska et al., 2016) As per group theoretical analysis (Cai et al., 2015), there are six Raman active modes but only three of them have been detected due to the constraints imposed by Raman scattering geometry. Similarly the temperature evolution of IR active modes are also not reported in literature. In Raman spectroscopy, factors like substrate effect, thickness, laser power and morphology etc., will alter the intrinsic phonon transport in SLBP (Zhang et al., 2014; Liu et al., 2015; Su and Zhang, 2015).
Under such circumstances atomistic simulations will help to predict the intrinsic material properties. Ab initio simulation have been employed to study the lattice dynamics properties of SLBP (Aierken et al., 2015; Cai et al., 2015; Łapińska et al., 2016). Also, strain evolution of phonon modes are studied in detail within the ab inito frame work (Wang et al., 2015; Aierken et al., 2015; Fei and Yang, 2014). Aierken et al (Aierken et al., 2015) used the quasi-harmonic approximation (QHA) to understand the thermal and vibrational properties. The authors warned the usage of quasi-harmonic approach at high temperature due to the emergence of strong phonon-phonon interaction, which is not incorporated in QHA. Motivated from the above facts, the objective of the present study is set as, analyze the thermodynamic stability and intrinsic vibrational anharmonicity of all optic phonon modes in SLBP with full anharmonicity of effective interaction, irrespective of present experimental and theoretical constraints.
To compute the finite temperature structural and vibrational properties a spectral energy density (SED) method is used in conjunction with MD simulation (Anees et al., 2015). In SED method, anharmonicities of all orders are naturally incorporated, hence it would bring out the intrinsic phonon transport properties. A detailed theoretical derivations of SED can be found in our previous paper (Anees et al., 2015). For the sake of readability, a brief description of SED method is given below. The SED method works in two sequences, firstly a lattice dynamics (LD) calculation is done to obtain the polarization vector of normal mode of vibration (where, = wave vector, = mode index & = number of basis atoms). Secondly, MD simulations are performed at desired temperature to obtain the velocities, of atom (where is the cell-index) at time t. Further, project these velocities onto mode of vibration, and thus define a quantity as,
The Fourier transform and then power spectrum will yield the mode resolved phonon frequencies and linewidths of all phonon modes at any point in the Brillouine zone.
In the present study, MD simulation are performed using LAMMPS package (Plimpton, 1995). The phosphorous-phosphorous interaction in SLBP is defined using Stillinger-Weber (SW) potential parametrized by Jiang et al (Jiang et al., 2015). The SW potential describes the non-linear properties of covalent crystals, reasonably, accurately (Abraham and Batra, 1989), which makes the prediction of higher order phonon transport more accurate in SLBP (Hong et al., 2015). Periodic boundary conditions are employed in all three direction, and a vacuum separation of 20 Å is provided along c-axis to eliminate the un-physical interactions between the periodic images. Further, to get rid of the residual stresses, the system is relaxed in conjugate gradient algorithm. The lattice parameters of relaxed structures are a = 4.596 Å & b = 3.278 Å, which shows an excellent agreement with earlier studies(Kou et al., 2015; Su and Zhang, 2015). Phonon frequencies and polarizations are computed under harmonic approximation (T = 0 K) using a combination (Anees et al., 2015) of LAMMPS and PHONOPY (Togo and Tanaka, 2015). To compute the finite temperature properties a simulation cell of size 50x50x1 (10000 atoms) is adapted, and the system is equilbrated in isobaric-isothermal (NPT) ensemble for 0.5 ns. Once ensuring the equilbration & thermalization, the NPT ensemble is unfixed and coupled to NVE ensemble; further the velocities of each atoms are collected in a predefined interval of 5 fs, and the total simulations time is 3.2 ns.
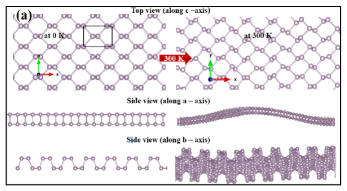
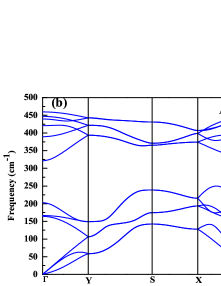
The unit-cell of SLBP is a rectangle containing four basis atoms and belongs to space group (Figure 1). Similar to graphene and 2D h-BN, SLBP also posses a honeycomb lattice structure, covalentely bonded P atoms forms a puckered like structure. SLBP unitcell contains 4 basis atom, hence there are 12 modes of vibration (3 acoustic (A) + 9 optic (O)). Figure 1 shows the phonon dispersion (at T =0 K) of SLBP. The acoustic modes are labeled based on their polarization (L-longitudinal, T-transverse and Z-out of plane) and the optic modes are designated as per group theoretical notation at point. The absence of imaginary modes in phonon dispersion ensures the structural stability of SLBP. The out of plane acoustic (ZA) mode shows a behaviour near the long wavelength limit, which is a fingerprint of typical 2D system (Lifshitz, 1952). The slope and thus group velocities of LA and TA branch is relatively small along armchair () with respect to zig-zag () direction, also the high frequency optic mode frequencies are more flat along the armchair direction in comparison with zig-zag and it is in accordance with previous observation (Cai et al., 2015).
According to group theoretical analysis (Cai et al., 2015), among nine optic modes, two are IR active ( and ), six are Raman active (, , , , , ) and one is inactive (). Though there are six Raman active modes, only three (, , ) of them have been reported experimentally(Cai et al., 2015). The LD mode frequency is 321.59 cm-1, which is underestimated by 10.8 % in comparison with Raman data (360.61 cm-1)(Liu et al., 2014). The mode predicted by LD (439.55 cm-1) shows an excellent agreement with Raman measurement (438.90 cm-1)(Liu et al., 2014). The difference is only 0.1 % which is negligibly small. Similarly, the LD mode frequency (446.90 cm-1) is overestimated by 4.7 % in comparison with Raman values (469.00 cm-1) (Liu et al., 2014). The agreement between the LD and experiment is satisfactory; although the present SW potential is the best among available in literature for predicting phonon spectra and their non-linear interaction, it needs further refinement to make the prediction more accurate.
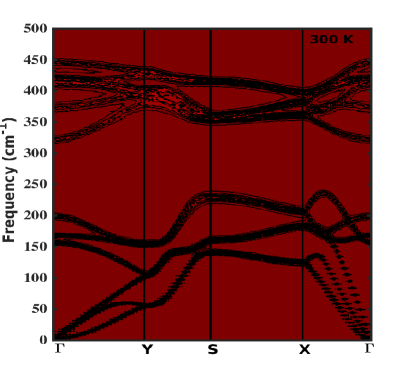
Finite temperature structural stability of SLBP is analyzed by computing the phonon dispersion at 300K using SED method. Figure 2 shows the phonon dispersion curves at 300 K, which shares a resemblance with LD phonon dispersion curves (Figure 1). The quadratic nature of ZA mode is preserved at 300 K as well. In SED phonon dispersion all modes are real and positive, which confirms that the SLBP sheet is dynamically stable and survives the crumpling transitions at finite temperature. Temperature induced broadening of phonon branches are conspicuous in SED phonon dispersion, which is a manifestation of anharmonicity. Temperature induced broadening is less for low lying acoustic modes than the optic modes, which indicates that acoustic modes have higher life time and they are less prone to temperature changes in comparison with optic modes.
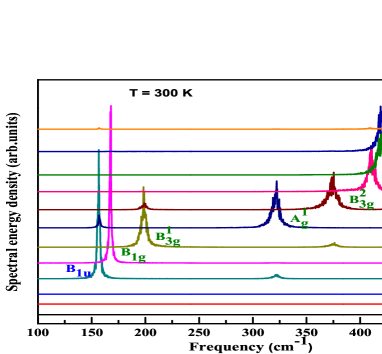
It should be noted that many optic mode branches are merged due to the broadening effect. Hence, in-order to analyze the vibrational anharmonicity of optic phonons, mode resolved phonon spectra are computed at point. Figure 2 shows the zone center phonon spectra at 300 K. The temperature induced peak shift and broadening are discernible. To extract the exact mode frequency shift, the peak positions are fitted to a Lorentzian function. Figure 3 shows the temperature evolution of optic mode frequencies. In the present study, the calculations are restricted in the temperature range of 100 K - 400 K. Above 500 K, there is an abrupt change in potential energy, signifies that system is unstable above this temperature. Experimentally, the decomposition temperature of SLBP is 598 K (Su and Zhang, 2015), which is corroborating with the above observation. Below 100 K the quantum effect will be dominant, that cannot be tapped in classical MD simulations.
In-order to get a qualitative understanding on role of anharmonicity of optic mode frequency shift, two different types of calculations are performed. In first one, the mode frequency shift is computed at temperature dependent lattice parameter (QH-LD). In the second one SED method in conjunction with an isothermal-isobaric (NPT) ensemble MD simulation (NPT-MD) is employed to obtain the frequency shift as a function of temperature. From figure 3, it is evident that all QH-LD modes are red-shifted with increase in temperature. SLBP shows thermal expansion in these temperature range (Aierken et al., 2015), once the lattice expands, the bonds become softer, hence the associated force constants and then phonon frequencies would exhibit a red-shift. The NPT-MD mode frequencies are also red-shifted with much steeper variations. In NPT-MD, the strong phonon-phonon coupling effects are present along with the thermal expansion. This strong phonon-phonon coupling leads to the enhanced red-shift of mode frequencies. This results envisages the strong anharmonicity associated with optic phonon modes. To check the non-linearity associated with eigen vectors, the phonon peak positions of lowest () and highest () frequency modes are computed without eigen vectors. The peak position obtained for & are 158.312 cm-1 & 446.355 cm-1, respectively. These values are 1.75 cm-1and 1.73 cm-1 higher than that obtained via projection technique, and the difference is too small to be considered.

The temperature sensitivity of each mode is analyzed by computing their first order temperature co-efficient . In-order to extract the values of , the frequency shift of each mode is fitted with a linear equation (Su and Zhang, 2015; Najmaei et al., 2013; Anees et al., 2016), where is the extrapolated peak position to 0 K. The values (Table 1) are deduced from the slope of the plot. The quasi-harmonic values of Raman , and modes are one order magnitude smaller than the NPT-MD and experimental values. This result again substantiate that quasi-harmonic methods are in-adequate to capture the strong anharmonicity in SLBP.
| mode | expt. | ||
|---|---|---|---|
| -0.0031 | -0.0473 | — | |
| -0.0047 | -0.0377 | — | |
| -0.0021 | -0.0610 | — | |
| -0.0025 | -0.0290 | -0.0158 (Su and Zhang, 2015) | |
| -0.0084 | -0.0401 | — | |
| -0.0031 | -0.0547 | — | |
| -0.0093 | -0.0668 | -0.0315 (Su and Zhang, 2015) | |
| -0.0176 | -0.0663 | -0.0312 (Su and Zhang, 2015) | |
| -0.0158 | -0.0692 | — |
The value of NPT-MD mode ( -0.0290 cm-1/K) shows good agreement with Raman data (-0.0158 cm-1/K). For other 2 Raman modes ( & ) the NPT-MD values are roughly twice that of experimental values. This can be understood as follows, the mode is out plane mode, while & are in-plane modes. The in-plane mode frequencies are more susceptible to substrate effect. Due to mismatch of thermal expansion co-efficients the substrate will induce a compressive strain on film, which alter the shift in mode frequencies, this phenomena had already observed in graphene (Balandin et al., 2008; Yoon et al., 2011). The above arguments are strengthened with the findings of Su et al (Su and Zhang, 2015), they found that the values of thin BP films are more sensitive to the substrate effect than thick BP film. Along with substrate effect, the temperature induced ripples have significant effect on thermal expansion of 2D materials (Anees et al., 2017), this ripple morphology get altered while transferring to substrate, which again affects the intrinsic vibrational properties (Robinson et al., 2015). The values of un-detected Raman active, IR and inactive modes are also tabulated in Table 1. These modes also shows significant deviation from quasi-harmonic prediction, signifies their strong anharmonic nature. Based on the above analysis, the temperature sensitivity of Raman active modes can be expressed as > > > > > . Fei et al (Fei and Yang, 2014) reported that for and modes the strain induced inter-atomic distance variation is more than that of , hence they shows significant shift in mode frequencies, which is in agreement with above observation. In the case of IR active mode, mode shows more deviation from quasi-harmonic prediction and their temperature sensitivity can be written as > .
In conclusion, the structural stability and temperature evolution of optic phonon modes of single layer black phosphorene (SLBP) are studied beyond the conventional quasi-harmonic methods. Finite temperature structural stability analysis shows that SLBP sheet is thermodynamically stable and sustain the crumpling transition. Vibrational anharmonicity of optic modes are analyzed by performing quasi-harmonic lattice dynamics (QH-LD) and spectral energy density (SED) method in conjunction with an isothermal-isobaric MD (NPT-MD) simulations as a function of temperature. Mode resolved phonon frequencies of optic modes, which includes experimentally forbidden IR and Raman active modes are extracted. The QH-LD optic mode frequencies shows significant deviation with respect to NPT-MD, its ascribed to the inclusion of all higher order phonon-phonon scattering processes in the later. Temperature sensitivity of each mode is gauged by computing their first order temperature co-efficient, which again exhibits the effects of strong anharmonicity associated with optic modes in SLBP. The present study reveals that, one has to go beyond the conventional harmonic and quasi-harmonic analysis to explain the structural and vibrational dynamics of single layer black phosphorene, in which anharmonicity plays crucial role at finite temperatures.
References
- Zhou et al. (2019) J. Zhou, L. Shen, M. D. Costa, K. A. Persson, S. P. Ong, P. Huck, Y. Lu, X. Ma, Y. Chen, H. Tang, and Y. P. Feng, Scientific Data 6, 86 (2019).
- Li et al. (2014) L. Li, Y. Yu, G. J. Ye, Q. Ge, X. Ou, H. Wu, D. Feng, X. H. Chen, and Y. Zhang, Nature Nanotechnology 9, 372 (2014).
- Churchill and Jarillo-Herrero (2014) H. O. H. Churchill and P. Jarillo-Herrero, Nature Nanotechnology 9, 330 (2014).
- Xia et al. (2014) F. Xia, H. Wang, and Y. Jia, Nature Communications 5, 4458 (2014).
- Liu et al. (2014) H. Liu, A. T. Neal, Z. Zhu, Z. Luo, X. Xu, D. Tománek, and P. D. Ye, ACS Nano 8, 4033 (2014).
- Qin et al. (2014) G. Qin, Q.-B. Yan, Z. Qin, S.-Y. Yue, H.-J. Cui, Q.-R. Zheng, and G. Su, Scientific Reports 4, 6946 (2014).
- Low et al. (2014) T. Low, M. Engel, M. Steiner, and P. Avouris, Phys. Rev. B 90, 081408 (2014).
- Lv et al. (2014) H. Y. Lv, W. J. Lu, D. F. Shao, and Y. P. Sun, Phys. Rev. B 90, 085433 (2014).
- Fei et al. (2014) R. Fei, A. Faghaninia, R. Soklaski, J.-A. Yan, C. Lo, and L. Yang, Nano Letters 14, 6393 (2014).
- Suvansinpan et al. (2016) N. Suvansinpan, F. Hussain, G. Zhang, C. H. Chiu, Y. Cai, and Y.-W. Zhang, Nanotechnology 27, 065708 (2016).
- Fei and Yang (2014) R. Fei and L. Yang, Applied Physics Letters 105, 083120 (2014).
- Su and Zhang (2015) L. Su and Y. Zhang, Applied Physics Letters 107, 071905 (2015).
- Łapińska et al. (2016) A. Łapińska, A. Taube, J. Judek, and M. Zdrojek, The Journal of Physical Chemistry C 120, 5265 (2016).
- Cai et al. (2015) Y. Cai, Q. Ke, G. Zhang, Y. P. Feng, V. B. Shenoy, and Y.-W. Zhang, Advanced Functional Materials 25, 2230 (2015).
- Zhang et al. (2014) S. Zhang, J. Yang, R. Xu, F. Wang, W. Li, M. Ghufran, Y.-W. Zhang, Z. Yu, G. Zhang, Q. Qin, and Y. Lu, ACS Nano 8, 9590 (2014).
- Liu et al. (2015) X. Liu, J. D. Wood, K.-S. Chen, E. Cho, and M. C. Hersam, The Journal of Physical Chemistry Letters 6, 773 (2015).
- Aierken et al. (2015) Y. Aierken, D. Çak ır, C. Sevik, and F. M. Peeters, Phys. Rev. B 92, 081408 (2015).
- Wang et al. (2015) Y. Wang, C. Cong, R. Fei, W. Yang, Y. Chen, B. Cao, L. Yang, and T. Yu, Nano Research 8, 3944 (2015).
- Anees et al. (2015) P. Anees, M. C. Valsakumar, and B. K. Panigrahi, 2D Materials 2, 035014 (2015).
- Plimpton (1995) S. Plimpton, Journal of Computational Physics 117, 1 (1995).
- Jiang et al. (2015) J.-W. Jiang, T. Rabczuk, and H. S. Park, Nanoscale 7, 6059 (2015).
- Abraham and Batra (1989) F. F. Abraham and I. P. Batra, Surface Science 209, L125 (1989).
- Hong et al. (2015) Y. Hong, J. Zhang, X. Huang, and X. C. Zeng, Nanoscale 7, 18716 (2015).
- Kou et al. (2015) L. Kou, Y. Ma, S. C. Smith, and C. Chen, The Journal of Physical Chemistry Letters 6, 1509 (2015).
- Togo and Tanaka (2015) A. Togo and I. Tanaka, Scr. Mater. 108, 1 (2015).
- Lifshitz (1952) M. Lifshitz, Zh. Eksp. Teor. Fiz. 22, 475 (1952).
- Najmaei et al. (2013) S. Najmaei, P. M. Ajayan, and J. Lou, Nanoscale 5, 9758 (2013).
- Anees et al. (2016) P. Anees, M. C. Valsakumar, and B. K. Panigrahi, Applied Physics Letters 108, 101902 (2016).
- Balandin et al. (2008) A. A. Balandin, S. Ghosh, W. Bao, I. Calizo, D. Teweldebrhan, F. Miao, and C. N. Lau, Nano Letters 8, 902 (2008).
- Yoon et al. (2011) D. Yoon, Y.-W. Son, and H. Cheong, Nano Letters 11, 3227 (2011).
- Anees et al. (2017) P. Anees, M. C. Valsakumar, and B. K. Panigrahi, Phys. Chem. Chem. Phys. 19, 10518 (2017).
- Robinson et al. (2015) B. J. Robinson, C. E. Giusca, Y. T. Gonzalez, N. D. Kay, O. Kazakova, and O. V. Kolosov, 2D Materials 2, 015005 (2015).