Electron double-emission spectra for Helium atoms in intense 400 nm laser pulses
Abstract
Double photoelectron emission from He atoms by intense laser pulses with a wave length of is computed for intensities . Joint momentum distributions confirm the characteristics seen in classical trajectory calculations. The pronounced transition from back-to-back to side-by-side emission with increasing intensity, the ratios, and a modulation of joint energy spectra agree well with a recent experiment [Henrichs et al., PRA 98, 43405 (2018)], if one admits an increase of experimental intensities by a factor . We find that Freeman resonances enhance anti-correlated emission, we identify the signature of electron repulsion in joint angular distributions, and we interpret the modulation of joint energy spectra as a signature of multiple recollsions.
pacs:
32.80.-t,32.80.Rm,32.80.FbI Introduction
Double-ionization of noble gas atoms has been and still is being investigated for studying the effects of elementary correlation and for gauging computational methods. Notably the measurement of enhanced double-ionization by strong laser pulses Walker et al. (1994) has triggered a large number of theoretical studies and consensus has emerged that “recollision”, where the first emitted electron collides with the still-bound one, is the primary mechanism of double ionization. Variants of this basic mechanism have been used to explain in increasing detail spectra using short, intense pulses that were obtained by cold target recoil ion momentum spectroscopy (COLTRIMS) Ullrich et al. (2003).
The assignment of the observed spectral features to specific mechanisms remains a challenge for theory. The Helium atom is, in principle, accessible to a complete numerical solution of its time-dependent Schrödinger equation (TDSE) and the computation of fully differential spectra, even if the parameter range where this can be achieved remains narrow. However, an accurate time-dependent wave function by itself does not provide physical insight or intuitive mechanisms. For that, the use of classical and semi-classical models is of interest. Such models have been very successful in strong field physics Katsoulis et al. (2018); Vilà et al. (2018); Price et al. (2014).
The recollision model for non-sequential double ionization (NSDI) consists of three steps: (1) electron leaves the atom, typically by tunnel ionization; (2) picks up energy in the laser field; (3) it returns to the vicinity of the nucleus and collides with the other electron . The scenarios for the interaction in step (3) are often phrased in terms of classical mechanics. If the first electron’s energy is large enough, it can knock out the second one in an collision and the two leave nearly at the same time. When the energy imparted to is below the ionization threshold, the simultaneous presence of laser can still allow detachment by suppressing the potential barrier. The mechanisms where the release occurs within a narrow time-window of the recollision we call “double-ionization upon recollision” (DUR), which subsumes direct knock-out and release by suppression of the binding barrier as well as tunneling Liu et al. (2008); Haan et al. (2008); Ye and Liu (2010). For the correlation of electron momenta, one has to also include scattering of the returning electron by the nucleus. Such a process is the ”slingshot-NSDI” Katsoulis et al. (2018), where the momentum of is reverted and which leads to the anti-correlated emission of the two electrons.
When an actual excited state is formed with a decay time that is not locked to the recollision event, one speaks of “recollision induced excitation with subsequent ionization” (RESI) Haan et al. (2006); Shaaran et al. (2010), which suppresses correlation between the recolliding and the second emitted electron. A similar pattern, where, however, correlation is maintained, is the formation of a quasi-bound state of both electrons which can survive for at least one-quarter cycle and gets ionized with the electrons moving into the same direction (“double delayed ejection”, Emmanouilidou et al. (2011)).
In the present paper we present ab initio quantum mechanical calculations of double-ionization of the He atom by short and intense laser pulses at a carrier wavelength of 394.5 nm and relate these to recent measurements and some of the mechanisms listed above. Dependence of angular correlation on pulse intensity and pulse duration is used as the main observable.
We present joint energy and momentum distributions at various intensities and pulse durations and find generally good agreement with measurement. Our analysis supports DUR as a main contributor to anti-correlated double emission. Anti-correlation is further enhanced by Freeman resonances, a genuinely quantum phenomenon. Finally, we will point to another manifestation of quantum mechanics, namely the modulation by of the joint energy distribution along lines of constant sum energy — the “checkerboard pattern” of Ref. Henrichs et al. (2018). In classical language this translates into repeated electron collisions. We also present calculations with ultrashort pulses (2 fs FWHM, parameters of Ref. Katsoulis et al. (2018)), that generally support the slingshot mechanism of Ref. Katsoulis et al. (2018), although the match is found at lower than predicted intensity.
II Methods and laser parameters
II.1 Two-electron calculations
The Hamiltonian of the He-atom with infinite nuclear mass is (using atomic units )
| (1) |
with the ionic Hamiltonian
| (2) |
Interaction with the laser is described in dipole approximation and velocity gauge, where is defined below.
For numerically solving the TDSE and for computing spectra we use the time-dependent recursive indexing (tRecX) code Scrinzi (2019). tRecX implements the time-dependent surface flux (tSurff) method Scrinzi (2012); Tao and Scrinzi (2011) (see also Refs. Hofmann et al. (2014); Karamatskou et al. (2014); Yue et al. (2014); Majety et al. (2015a, b); Torlina et al. (2014); Zielinski et al. (2016)), infinite range exterior complex scaling (irECS) McCurdy et al. (2004); Scrinzi (2010), and FE-DVR methods Rescigno and Mccurdy . In brief, the full two-electron calculation is restricted to within a surface radius with irECS absorption beyond . tSurff is based on the idea that beyond all interactions can be neglected and spectra are reconstructed from the time-evolution of values and derivatives on a four-dimensional hypersurface . Expansions into single-particle angular momenta and FE-DVR radial functions are used. The most critical convergence parameter is and, to a lesser degree, the number of angular momenta. All convergence parameters were varied systematically to ensure sufficient accuracy. In the majority of calculations angular momentum quantum numbers and were used for each electron. Mostly, was used, but critical points were investigated with radius . We obtain a He ground state energy of with and the three decimal digits exact value of with . For a detailed discussion of the method and its convergence, see Ref. Zielinski et al. (2016).
Alternative to extracting single emission spectra from the full two-electron calculation, we also used a single-active-electron model with the Hamiltonian
| (3) |
which has the ionization potential a.u. and largely reproduces results from the full calculation, see below.
II.2 Differential spectra
Starting from the fully differential momentum spectrum we compute various partially differential spectra.
The co-planar joint angular distributions (JADs) at given energy sharing , are defined by choosing the first electron at and taking into account cylindrical symmetry, i.e.
| (4) |
with for and for . For experimentally realistic JADs we average over a small energy region , which is comparable to the spectral width of the pulses used here.
Joint distributions of momentum in polarization- (-) direction and joint energy distributions are defined as
| (5) | ||||
| (6) |
where is the integration over the solid angle of . We adopt the term “back-to-back” (B2B) emission for the part of with opposite signs of the , i.e. the upper left and lower right quadrants in the -plane, and we call emission with equal signs of and “side-by-side” (SBS).
For the study of (anti-)correlation of double electron emission we introduce the ratio of B2B to SBS emission
| (7) | ||||
| (8) |
such that larger indicates more anti-correlation.
We will further study the correlation at individual energy sharing points using the ratio where the integration for is restricted to a small region surrounding .
II.3 Laser pulses
The dipole field of a laser pulse with peak intensity and linear polarization in -direction is defined as with
| (9) |
The wave-length was chosen as exactly to match the experimental wave length used in Ref. Henrichs et al. (2018), with the corresponding photon energy of . For the pulse envelope we used two different shapes: a “flat top” trapezoidal function with a linear rise and descent over a single optical cycle () and constant amplitude in between. This somewhat unrealistic pulse shape is chosen to better isolate the intensity dependent effects of Freeman resonances. For examining the robustness and experimental observability of effects we chose as a more realistic envelope. Pulse durations are specified by the FWHM w.r.t. intensity. The carrier-envelope phase , in general, affects all non-linear processes. Even for pulses with a duration of 14 opt.cyc.we see some impact on JADs. With few- or single-cycle pulses, the dependence of spectra on is very pronounced and one needs to average over for comparing to experiments without phase-stabilization.
II.4 Ponderomotive shifts and Freeman resonances
The ac-Stark shifts of ground and excited states differ, leading to intensity-dependent resonance conditions known as Freeman resonances Freeman et al. (1987). In good approximation, the shift of excited states energies relative to the ground state is equal to the ponderomotive potential , leading to the -photon Freeman resonance condition
| (10) |
where and are field-free ground and excited state energies of the He-atom. The validity of this formula for the present purposes was verified by Floquet calculations with the single-electron Hamiltonian Eq. (3).
Similarly, photo-electron peaks are shifted to lower energies by as the ponderomotive potential of the continuum electron is not converted into kinetic energy due to the rapid passage of the pulse. The -photon peaks in single- and double-emission appear at energies
| (11) |
and
| (12) |
respectively, where and are the ionization potentials for single and double ionization. Note that for the pulse parameters used here, reaches up to several photon energies.
III Single electron emission
In the He atom, single-ionization at longer wave length is little affected by multi-electron effects. At 800 nm this had been observed for photoemission with linear Zielinski et al. (2016) as well as elliptical polarization Majety et al. (2015b). We find the same to hold at the present shorter wavelength. The difference in total yields obtained from model and full two-electron calculation is about 20%. After normalization, the shapes of the spectra agree within a few % in the energy range up to 100 eV. As the single ionization calculation can easily be pushed to complete convergence this also supports the correctness of the full calculation.
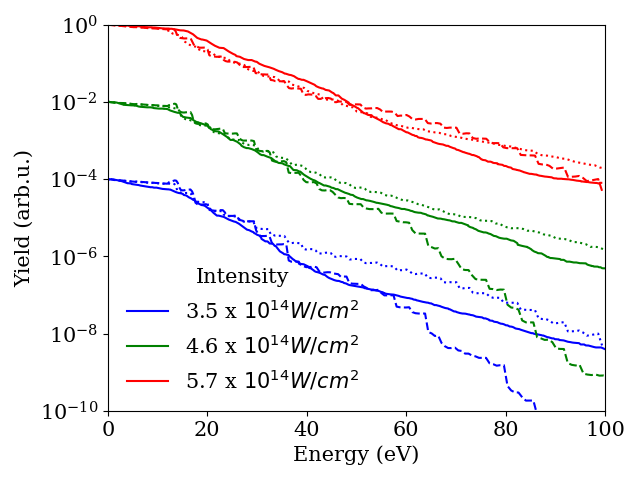
In Fig 1 we compare the spectral shapes at two sets of intensities, and , respectively, to three measured spectra from Ref. Henrichs et al. (2018). We verified that on the level of the comparison the exact pulse duration does not matter. The two sets of intensities are chosen w.r.t. the lowest intensity of of Ref. Henrichs et al. (2018): the difference of ponderomotive shifts at 3.5 and is approximately one photon energy. Photo-electron peaks at the two intensities are located at the same energies, just differing by one photon number. Both triplets of intensities will be used in further comparison with experimental data.
Somewhat surprisingly, for this rather simple observable the agreement is not satisfactory for either set of intensities. Strikingly, at and the predicted pronounced cutoff is not found in the experimental data. The calculations at the higher set of intensities bear more similarity to the experimental data but agreement at the high photo-electron energies remains off by nearly an order of magnitude.
The difficulty in using single-electron spectra for intensity calibration is that the photoionization threshold shifts with intensity by one or several photon energies () and channel closure occurs. For example, at intensity the 10-photon transition falls right onto the ionization threshold and at higher intensity a minimum of 11 photons is needed for ionization. If the signal is averaged over individual photo-electron peaks, the low-energy photo-electron spectrum appears to change shape rather erratically. If individual photoelectron peaks were resolved one should be able to reliably gauge the intensity with an ambiguity of multiples of . For resolving that ambiguity one needs additional information: the checkerboard pattern observed in double emission (sec. IV.3) allows distinguishing even and odd photon counts, reducing ambiguity to multiples of two photon energies, .
The ambiguous comparison of the single-electron spectra precludes the use of these spectra for gauging the experimental intensity. The double emission calculations below suggest that the actual experimental intensities were higher than quoted in Henrichs et al. (2018).
IV Double electron emission
IV.1 Joint momentum distributions
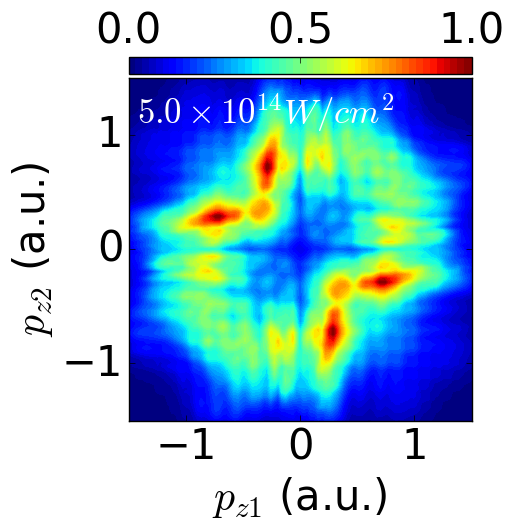
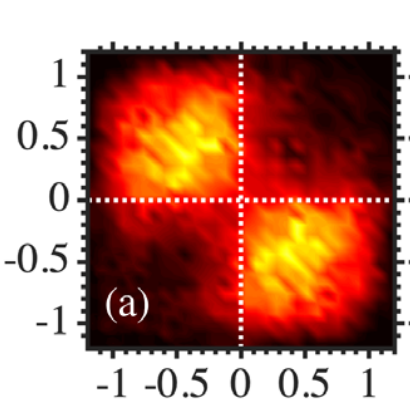
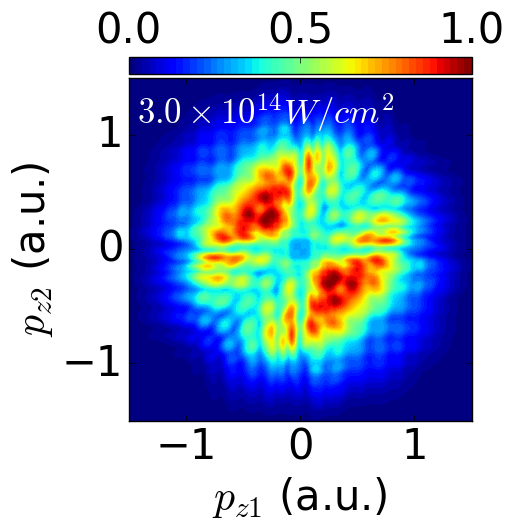
In Fig. 2 we show the joint momentum distributions obtained at our two intensity sets and the corresponding data digitized from Ref. Henrichs et al. (2018). At the lower intensities from to “back-to-back”(B2B) emission into the quadrants with opposite sign of the -momentum is more prominent. This changes markedly at , where the “side-by-side” (SBS) emission dominates. The same transition appears in experiment, although at a nominal intensity near .
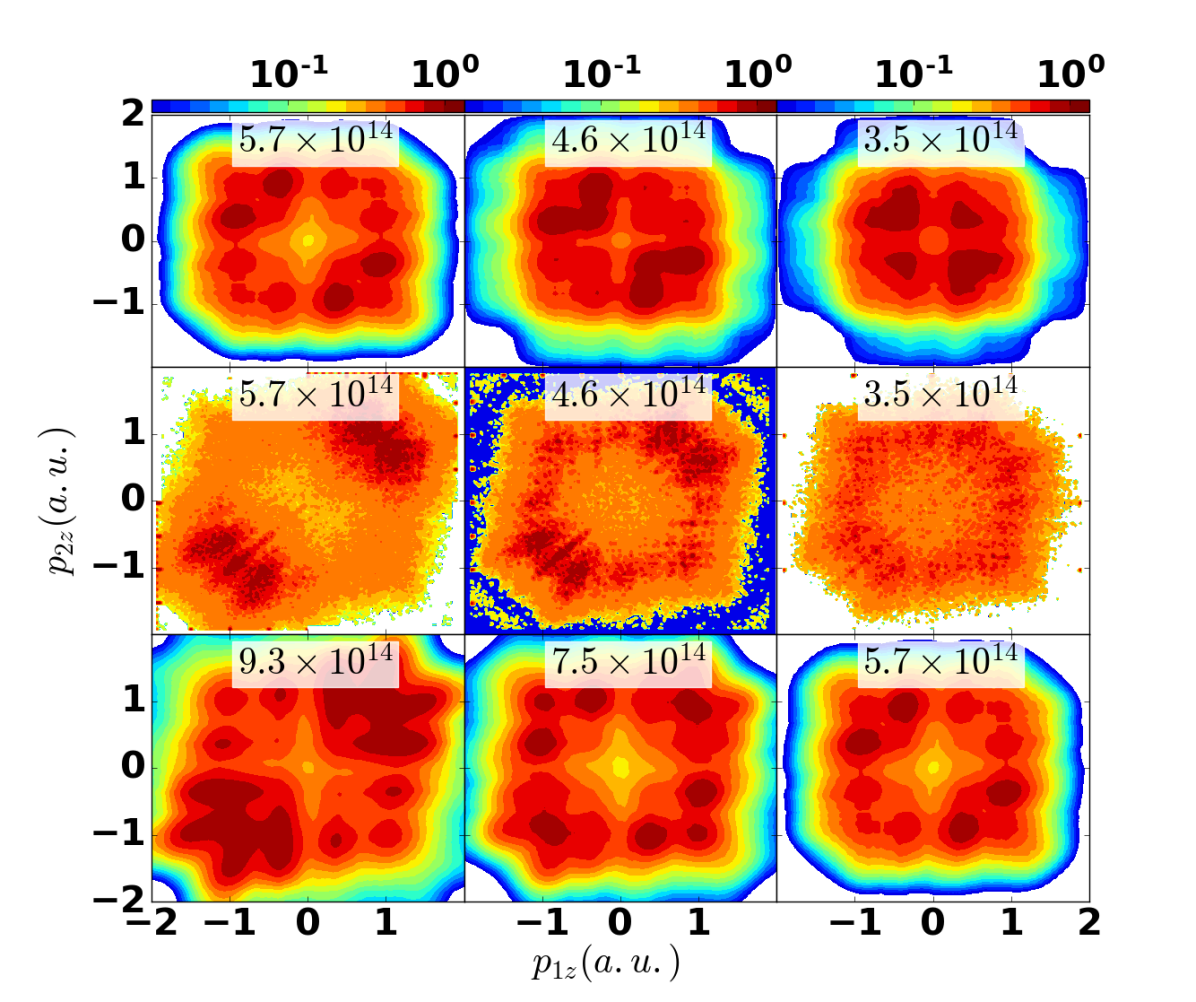
We note that the transition to dominantly SBS emission occurs at the intensities in the simulation where the energy of the recolliding electron approaches the threshold for excitation of , cf. Ref. Sheehy et al. (1998), see also Sec. IV.4. An inelastic collision at that threshold leaves both electrons at comparatively low momentum and unbounded or loosely bound, respectively. From such a state, acceleration by the laser into similar directions is favored.
IV.2 Ratio of to yields
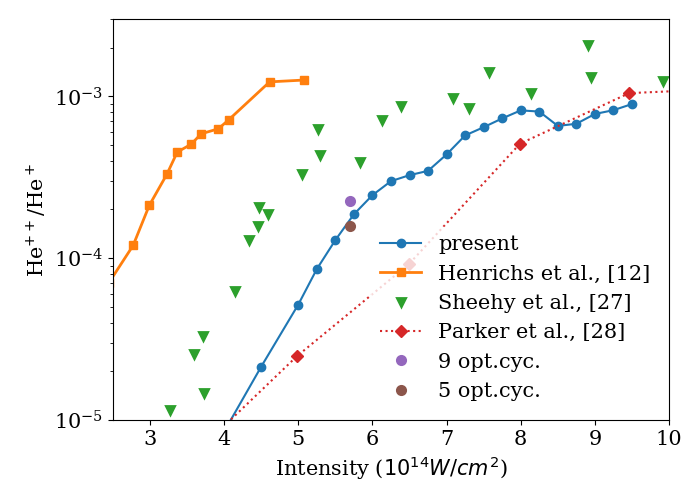
The question of experimental intensities also arises, when we consider the ratio of the yields of total double to single ionization. Fig. 3 compares our simulations with the experimental results from references Sheehy et al. (1998) and Henrichs et al. (2018). Our results suggest that the intensities in both experiments should be scaled to higher values, with about a factor two for Ref. Henrichs et al. (2018). The discrepancy to Ref. Sheehy et al. (1998) was discussed in Ref. Henrichs et al. (2018) considering in particular the shorter pulse duration used inHenrichs et al. (2018). For the bulk of our simulations we use short pulses of (7 opt.cyc. FWHM), even shorter than in Ref. Henrichs et al. (2018). As recollision occurs within one or at most two optical cycles, pulse-duration effects are expected to be small and mostly due to the wider spectrum of shorter pulses. Crosschecks at intensity show variations of as we change pulse duration from 5 to , see Fig. 3.
Fig. 3 also includes results from the ab initio calculation Parker et al. (2000), which are close to our results at most intensities. In Ref. Parker et al. (2000) yields are accumulated outside a finite radius, which is in spirit comparable to the present tSurff calculation, but it differs by the use of flat-top pulses and by the actual extraction method, which plausibly accounts for the observed differences.
IV.3 The checkerboard pattern
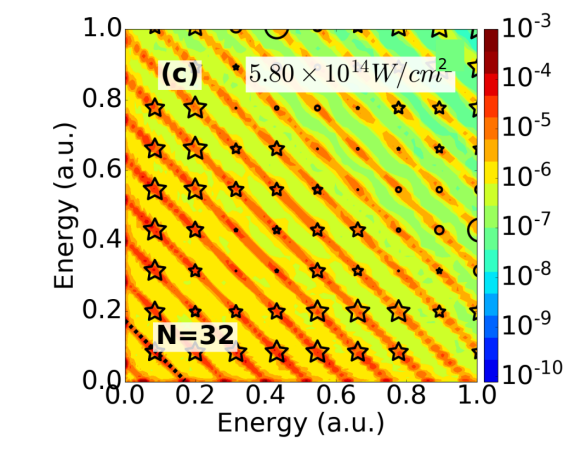
An interesting observation reported in Ref. Henrichs et al. (2018) is the appearance of a “checkerboard” pattern in the energy distributions. In Fig. 4 we show joint energy spectra at two different intensities and line-outs of the spectrum along the 40 and 48-photon peaks according to Eq. (12) for B2B and SBS events separately. The line-outs highlight the modulation of the yield at energy differences . In the line-out for the higher intensity of and 48 photons, modulation becomes weaker in the SBS events, but remains pronounced in B2B. These observations are consistent with Ref. Henrichs et al. (2018), where the pattern was only observed in B2B and became washed out with intensity, although at nominally lower intensities.
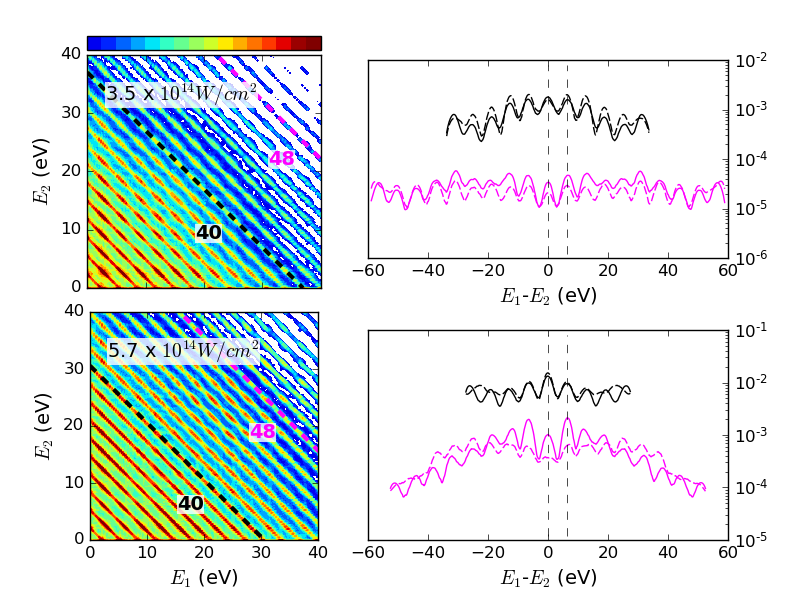
In absence of interaction a trivial checkerboard pattern would appear in the emission of two electrons whenever there are photon-peaks in the emission of the individual electrons. This cannot be the primary cause for the pattern observed here, as independent (“sequential”) emission of the electrons is several orders of magnitude less intense than the recollision induced double emission. In general, periodicity of emission modulates energy patterns at multiples of the photon energy, which is interpreted as photon counts and energy conservation, Eq. (12). The checkerboard pattern shows that the energy difference favors multiples of the photon energy, , which implies multiple interactions between the electrons that are separated in time: the mechanism involves at least two contributions to double-ionization that are separated by one-half of the optical period. Such multiple recollisions where suggested for double-ionization Liu et al. (2008); Haan et al. (2008); Ye and Liu (2010), being more dominant at lower energies and favoring B2B emission. The energy modulation shown in Fig. 4 supports these classical predictions. The fact that the pattern appears in experiment in B2B but non in SBS emission Henrichs et al. (2018) also fits the picture.
IV.4 Anti-correlation and Freeman resonances
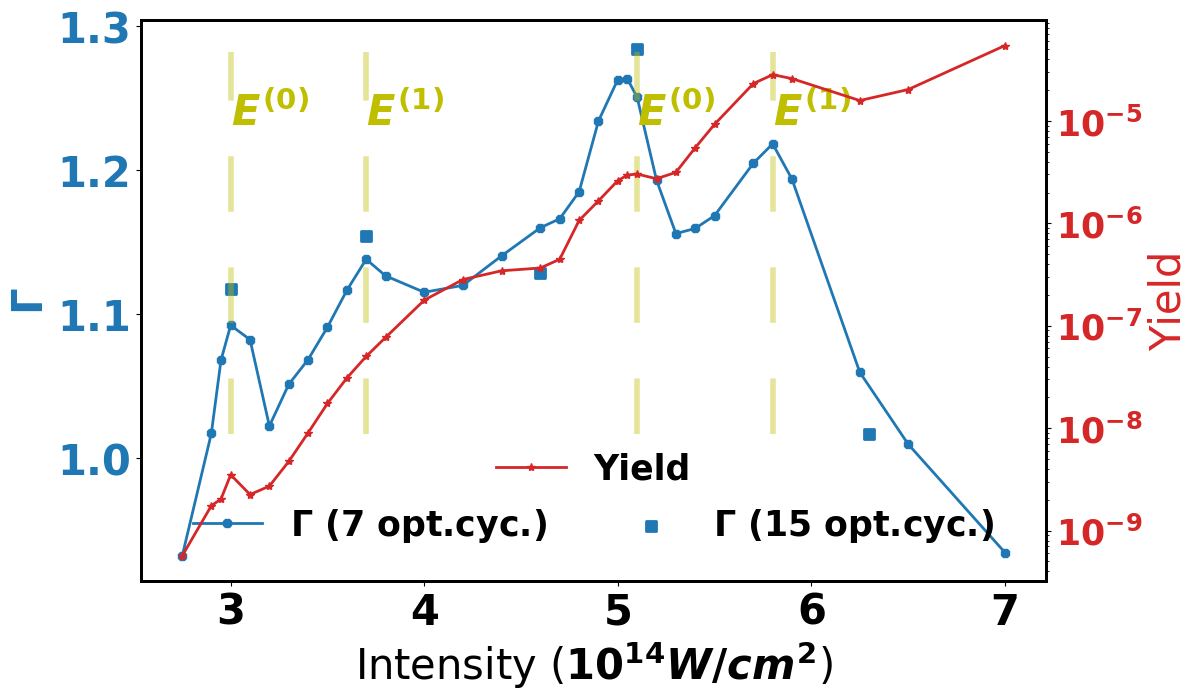
Fig. 5 shows the anti-correlation ratio , Eq. (7), and the total double-ionization yields for intensities from to . In both curves we see peaks when lowest excited energies shift into Freeman resonance, Eq. 10. The curves are calculated with a 9 opt.cyc. flat top pulse. A few additional points were calculated with a pulse duration of 15 opt.cyc.: is further enhanced and while it drops slightly off-resonance, as to be expected.
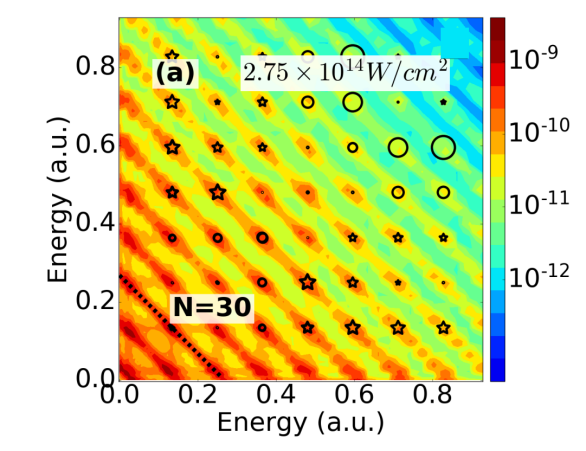
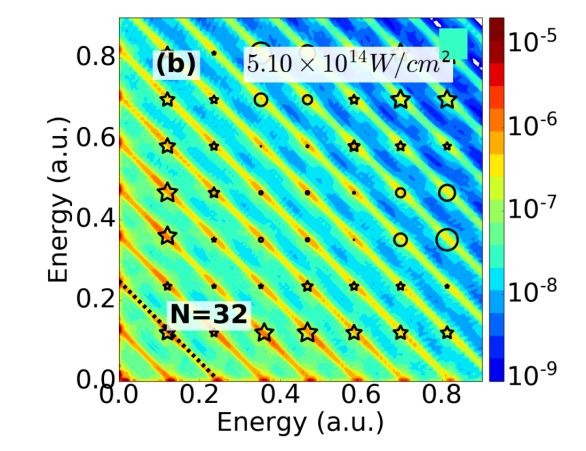
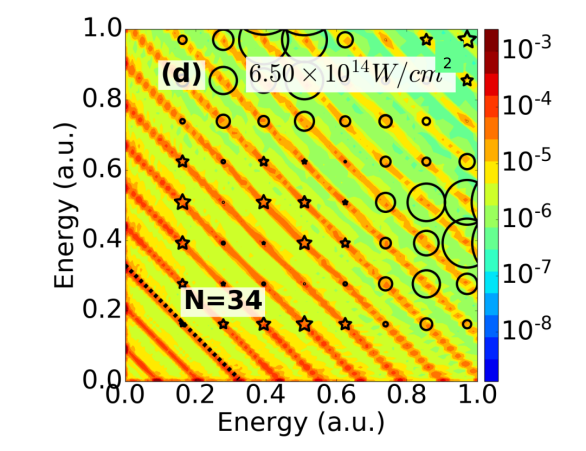
An overview of the dependence of on the photo-electron energies for 4 different intensities is shown in Fig. 6. We see that in general points of non-equal energy sharing are more anti-correlated, . This TDSE result supports the prediction of preferred anti-correlated emission at non-equal energy sharing Haan et al. (2008); Ye and Liu (2010) based on the analysis of classical trajectories. The classical simulations were interpreted by taking into account the modification of the classical potential by the simultaneous action of the re-approaching electron and the laser field. In more quantum mechanical language this is excitation simultaneous with tunneling and/or over barrier ionization. The mechanisms are distinguished from the conventional idea of RESI (resonant excitation with subsequent ionization) in that excitation and ionization happen within the time-frame of a given recollision and therefore the directions of electron emission become (anti-)correlated. In contrast, in RESI the two single ionizations would ultimately occur without narrow correlation in time and leave emission directions largely independent.
A more precise mapping of the mechanisms onto quantum mechanics is difficult: both, the presence of a rather strong field and the brevity of the interaction deprives individual states of their identity. Wavefunctions can, with great success, be associated with trajectories at larger distances from the nucleus, but the mapping breaks down as one approaches to within the range of the electrons’ de-Broglie wave lengths. Still, the behavior of anti-correlated emission corroborates the essence of Refs. Haan et al. (2008); Ye and Liu (2010): the contribution from “double-emission upon recollsion” (DUR) is important, in addition to a possible RESI background.
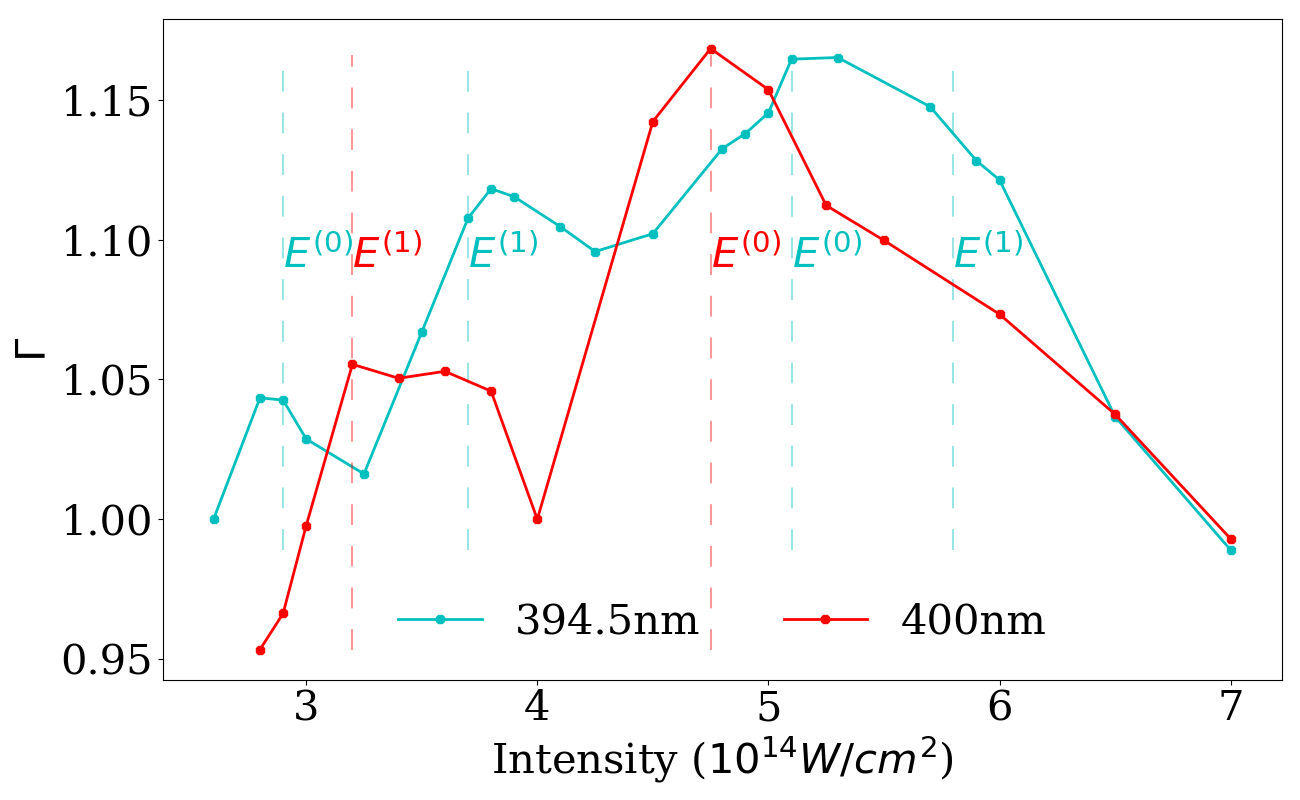
Fig. 5 was computed with flat-top pulses for better exposure of the mechanism, but Freeman peaks in anti-correlation also appear with the more realistic pulse envelope, as shown in Fig. 7.
Freeman resonances do not appear in classical simulation, as they depend on the quantization of excitation energies. Resonance implies in particular that there is a well-defined photon energy and that the process spans several optical periods. In such a mechanism, standard multi-photon type excitation is followed double-ionization from the excited state. The fact that Freeman resonances enhance anti-correlation indicates that that mechanism is of DUR-type.
IV.5 Joint angular distributions
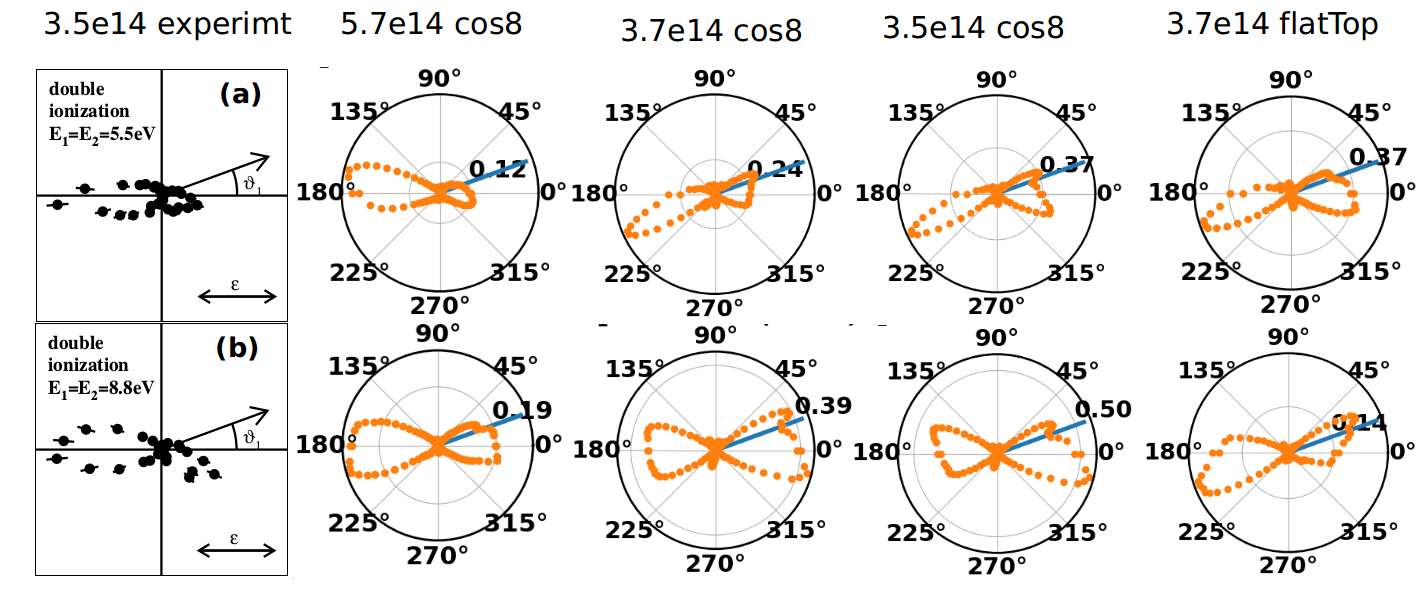
JADs strongly depend on the total energy, the energy sharing between the two electrons, and on the laser parameters. Fig. 8 reproduces two JADs from Ref. Henrichs et al. (2018) together with our results. For illustration we have chosen two points with equal energy sharing at 5.5 and 8.8 eV, respectively. Experiment and simulation agree in showing clear angular anti-correlation. Near intensity , the JAD bends into the lower half plane, away from the first emitted electron. At the higher intensity of anti-correlation is less pronounced and shapes are more similar to the experimental ones. Apart from that general qualitative behavior, the spectra vary significantly with the exact pulse shape and intensity. Because of the high sensitivity to intensities, e.g. comparing 3.5 and , a more detailed comparison of computed JADs with experiment is not possible at this point.
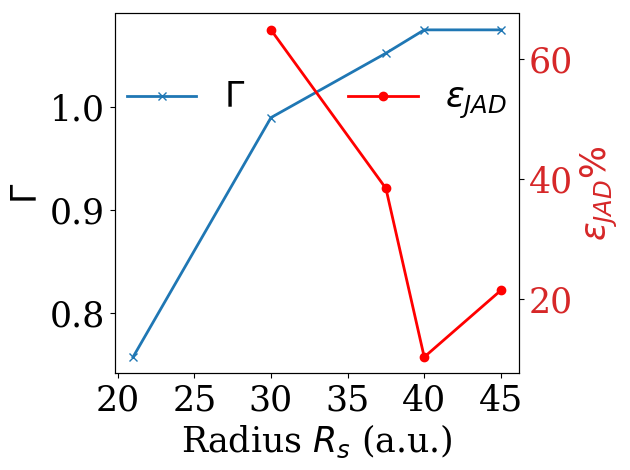
By studying the convergence with increasing we see that the bulk of correlation effects originates at distances from the nucleus. Fig.9 shows the convergence of the anti-correlation ratio and the maximal relative error of the energy-integrated angular distributions
| (13) |
where refers to results obtained with the next smaller box size. While is converged for the purpose of the present argument, convergence of the JADs remains delicate, but qualitatively correct results may be expected at interaction ranges .
IV.6 Double-emission by short pulses
We also investigated double emission by extremely short pulses of 2 fs FWHM with the purpose of identifying a signature of the ”slingshot” mechanism for B2B emission which was proposed in Katsoulis et al. (2018). In that mechanism, the first electron reverts momentum in a close encounter (”slingshot”), while the second electron is emitted with some delay that results in B2B emission. Ref. Katsoulis et al. (2018) reports pronounced B2B emission at the pulse duration of 2 fs and intensity as a signature of the mechanism. Fig. 10 compares that classical finding with our TDSE simulations. The result for favors unequal energy sharing, which is characteristic of a DUR process. In contrast, the result bears great similarity with the classical simulation with more weight on equal energy sharing.
While our finding does not rule the slingshot mechanism at , it indicates important double ionization through alternative pathways with unequal energy sharing. Note that we use the exact same pulse as in Ref. Katsoulis et al. (2018).
The slingshot mechanism may be dominating at the lower intensity. However, attempts to trace the classical motion of the two electrons studying time-dependent spatial correlations in the quantum wave function failed due to the general difficulty of such a mapping. In addition, we remark that the very large band width of the 2 fs pulse admits lower order multi-photon ionization, which erodes the quasi-static tunneling picture employed for initial ionization in the classical model. Also, by their very construction, classical calculations do not account for effects of the quantum mechanical structure of the atom, as for example, the Freeman resonances discussed above.
V Conclusions
The ab initio quantum mechanical calculations of single- and double-emission confirm the generally important role of DUR-type double-ionization, where the second ionization is simultaneous with the recollision, if we accept the enhancement of B2B emission as a signature of the process. This is supported further by the relatively stronger B2B emission at spectral points with large differences between electron energies.
Comparing with recent experimental results on double emission spectra Henrichs et al. (2018), we find good qualitative agreement, if we allow for an increase of experimental intensities by a factor . Such an adjustment is suggested by three different and largely independent observables: the ratio, the dependence of B2B emission on intensity, and the intensity where the checkerboard pattern in joint-energy distributions fades.
Unfortunately, the ambiguity of intensity could not be resolved using the single-electron spectra published in Henrichs et al. (2018): this observable can be computed easily and with great reliability, but we were unable to establish convincing agreement at any set of intensities. Again higher than the experimental intensities appear to be favored.
For JADs we can clearly identify the effect of electron repulsion, analogous to what was reported in Henrichs et al. (2018). Comparison with experiment beyond that general level is hampered by the sensitivity of the JADs to intensity, carrier-envelope phase, pulse-duration, and exact pulse shape. On the computational side, for reliable convergence of JADs one needs to take into account the interaction between electrons over large spatial regions , which inflates tSurff computations to large scale.
We find that at the given pulse parameters Freeman resonances affect double emission in general and that they disproportionally enhance B2B emission. Taking B2B emission as an indicator for a DUR mechanism, this suggests that DI through a Freeman resonance is primarily DUR.
We finally offer a simple explanation for the checkerboard pattern noted in Henrichs et al. (2018), which also appeared in earlier simulations at 800 nm Zielinski et al. (2016): the modulation at energy-differences of means that the underlying process involves periodic re-encounters of the two electrons at one-half of the optical period, i.e. multiple recollisions.
Acknowledgments
J.Z. was supported by the DFG Priority Programme 1840, QUTIF. We are grateful for fruitful discussions with G. Katsoulis, A. Emmanouilidou K. Henrichs, and R. Dörner.
References
- Walker et al. (1994) B. Walker, B. Sheehy, L. F. DiMauro, P. Agostini, K. J. Schafer, and K. C. Kulander, Physical Review Letters 73, 1227 (1994).
- Ullrich et al. (2003) J. Ullrich, R. Moshammer, A. Dorn, R. Dörner, L. P. H. Schmidt, and H. Schmidt-Böcking, Reports on Progress in Physics 66, 1463 (2003).
- Katsoulis et al. (2018) G. P. Katsoulis, A. Hadjipittas, B. Bergues, M. F. Kling, and A. Emmanouilidou, Physical Review Letters 121, 263203 (2018).
- Vilà et al. (2018) A. Vilà, J. Zhu, A. Scrinzi, and A. Emmanouilidou, Journal of Physics B: Atomic, Molecular and Optical Physics 51, 065602 (2018).
- Price et al. (2014) H. Price, C. Lazarou, and A. Emmanouilidou, Physical Review A 90, 053419 (2014).
- Liu et al. (2008) Y. Liu, S. Tschuch, A. Rudenko, M. Dürr, M. Siegel, U. Morgner, R. Moshammer, and J. Ullrich, Phys. Rev. Lett. 101, 53001 (2008).
- Haan et al. (2008) S. L. Haan, Z. S. Smith, K. N. Shomsky, and P. W. Plantinga, Journal of Physics B: Atomic, Molecular and Optical Physics 41, 211002 (2008).
- Ye and Liu (2010) D. F. Ye and J. Liu, Phys. Rev. A 81, 43402 (2010).
- Haan et al. (2006) S. L. Haan, L. Breen, A. Karim, and J. H. Eberly, Physical Review Letters 97, 103008 (2006).
- Shaaran et al. (2010) T. Shaaran, M. T. Nygren, and C. Figueira De Morisson Faria, Physical Review A 81, 063413 (2010).
- Emmanouilidou et al. (2011) A. Emmanouilidou, J. S. Parker, L. R. Moore, and K. T. Taylor, New Journal of Physics 13, 043001 (2011).
- Henrichs et al. (2018) K. Henrichs, S. Eckart, A. Hartung, D. Trabert, K. Fehre, J. Rist, H. Sann, M. Pitzer, M. Richter, H. Kang, M. S. Schöffler, M. Kunitski, T. Jahnke, and R. Dörner, Physical Review A 98, 43405 (2018).
- Scrinzi (2019) A. Scrinzi, tRecX web page: trecx.physik.lmu.de (2019).
- Scrinzi (2012) A. Scrinzi, New Journal of Physics 14, 085008 (2012).
- Tao and Scrinzi (2011) L. Tao and A. Scrinzi, New Journal of Physics 14, 013021 (2011).
- Hofmann et al. (2014) C. Hofmann, A. S. Landsman, A. Zielinski, C. Cirelli, T. Zimmermann, A. Scrinzi, and U. Keller, Physical Review A - Atomic, Molecular, and Optical Physics 90, 043406 (2014).
- Karamatskou et al. (2014) A. Karamatskou, S. Pabst, Y. J. Chen, and R. Santra, Physical Review A - Atomic, Molecular, and Optical Physics 89, 069907 (2014).
- Yue et al. (2014) L. Yue, L. B. Madsen, L. Yue, and L. B. Madsen, Physical Review A 90, 063408 (2014).
- Majety et al. (2015a) V. P. Majety, A. Zielinski, and A. Scrinzi, New Journal of Physics 17, 63002 (2015a).
- Majety et al. (2015b) V. P. Majety, A. Zielinski, and A. Scrinzi, Journal of Physics B: Atomic, Molecular and Optical Physics 48, 25601 (2015b).
- Torlina et al. (2014) L. Torlina, F. Morales, J. Kaushal, H. G. Muller, I. Ivanov, A. Kheifets, A. Zielinski, A. Scrinzi, S. Sukiasyan, M. Ivanov, and O. Smirnova, Nature Physics 11, 503 (2014).
- Zielinski et al. (2016) A. Zielinski, V. P. Majety, and A. Scrinzi, Physical Review A 93, 1 (2016).
- McCurdy et al. (2004) C. W. McCurdy, M. Baertschy, and T. N. Rescigno, Journal of Physics B: Atomic, Molecular and Optical Physics 37, 17 (2004).
- Scrinzi (2010) A. Scrinzi, Physical Review A 81, 053845 (2010).
- (25) T. N. Rescigno and C. W. Mccurdy, Numerical grid methods for quantum-mechanical scattering problems, Tech. Rep.
- Freeman et al. (1987) R. R. Freeman, P. H. Bucksbaum, H. Milchberg, S. Darack, D. Schumacher, and M. E. Geusic, Physical Review Letters 59, 1092 (1987).
- Sheehy et al. (1998) B. Sheehy, R. Lafon, M. Widmer, B. Walker, L. F. DiMauro, P. A. Agostini, and K. C. Kulander, Physical Review A - Atomic, Molecular, and Optical Physics 58, 3942 (1998).
- Parker et al. (2000) J. S. Parker, L. R. Moore, D. Dundas, and K. T. Taylor, Journal of Physics B: Atomic, Molecular and Optical Physics 33, L691 (2000).