Observations of Orion Source I Disk and Outflow Interface
Abstract
We imaged the continuum and molecular line emission from Orion Source I (SrcI) with up to 30 mas (12 AU) resolution at 43, 99, 223, and 340 GHz in an attempt to probe the structure and chemistry of the circumstellar disk and bipolar outflow associated with this high mass protostar. The continuum spectral index ranges from 2 along the midplane of the disk to 3 along the edges, consistent with dust that is optically thick in the midplane but becomes optically thin at the periphery. Salt (NaCl) emission is visible where the dust is optically thin; it provides a unique tracer of the velocity field within the disk. All other molecules that we have mapped – H2O, AlO, SiO, SiS, SO, and SO2 – appear to originate primarily in the bipolar outflow. The base of the outflow is corotating with the disk. SiS shows a filamentary structure that is most prominent along the edges of the outflow. The molecular distributions suggest that Si and Al released from dust grains in the disk react with oxygen derived from H2O to form SiO and AlO, and with SO and SO2 to form SiS.
1 Introduction
The Kleinmann-Low Nebula in Orion, at a distance 415 pc (Menten et al., 2007; Kim et al., 2008; Kounkel et al., 2018), is the nearest interstellar cloud in which massive ( ) stars are forming. The two most massive stars in this region, Source I (SrcI) and the Becklin-Neugebauer Object (BN), appear to be recoiling from one another at 35-40 (Rodríguez et al., 2005; Gómez et al., 2008; Goddi et al., 2011b), suggesting that they were ejected from a multiple system via dynamical decay approximately 500 years ago (Bally et al., 2017). SrcI has a mass 15 (Ginsburg et al., 2018), with a rotating accretion disk and a molecular outflow that is prominent in SiO. The disk around SrcI has been well studied as it is the closest known disk around a high mass protostar (Hirota et al., 2014; Plambeck & Wright, 2016; Ginsburg et al., 2018); it is associated with SiO and \ceH2O masers (Reid et al., 2007; Goddi et al., 2009; Plambeck et al., 2009; Matthews et al., 2010; Goddi et al., 2011b; Niederhofer et al., 2012; Greenhill et al., 2013). Recently dozens of spectral lines of NaCl and KCl were identified in this disk (Ginsburg et al., 2019). The rich chemistry of SrcI’s disk and outflow raises the question of whether this source is a paradigm for high-mass star formation, or an anomaly born in the unique environment created by the SrcI/BN interaction and associated explosive outflow (Bally et al., 2017).
In this paper, we present high resolution images of SrcI that were made from JVLA and ALMA data at 43, 99, 223, and 340 GHz. We use continuum images with 30 mas (12 AU) resolution to probe the dust opacity across the disk. We discuss chemical pathways that can lead to the observed molecular distributions.
2 Observations and Data Reduction
Table 1 provides a summary of the observations, including project codes.
2.1 43 GHz
The spectral setup for the 43 GHz JVLA observations included 16 wideband windows, each covering 116 MHz bandwidth and 58 spectral channels. The JVLA wideband setup is 64 channels covering 128 MHz; the reduction script trimmed off end channels because of analog filter rolloff. The data were self-calibrated using a strong SiO , maser feature at -3.5 that was observed simultaneously in a narrowband window with spectral resolution 0.3 km s-1.
The wide band average with a mean frequency of 42.65 GHz and a bandwidth of 1.4 GHz excludes 4 spectral windows containing spectral line emission. We made images with the synthesized beam width of 56 44 mas, and convolved to 30 mas and 50 mas resolution for comparison with images at 99 GHz (see below).
2.2 99 GHz
ALMA observations at 99 GHz (Band 3; B3) on 2017 Oct 12 and 17 included 4 spectral windows, each with a bandwidth of 1.875 GHz and 960 spectral channels. The wide band average with a mean frequency of 99.275 GHz and a bandwidth of 7.5 GHz excludes channels containing spectral line emission. The data were calibrated using observatory supplied scripts. We made images with the synthesized beam width 45 36 mas, and convolved to 30 mas and 50 mas resolution for comparison with images at 43 GHz.
2.3 223 and 340 GHz
The 223 GHz (ALMA Band 6; B6) and 340 GHz (ALMA Band 7; B7) observations and calibration are described in Ginsburg et al. (2018). These data were not self-calibrated. The observational parameters are given in Table 1.
In order to compare the SrcI outflow with the large scale structure associated with the SrcI/BN explosion mapped in CO by Bally et al. (2017), we imaged other spectral lines that fell within the passband of these lower resolution observations (ADS/JAO.ALMA#2013.1.00546.S). The data were calibrated using the observatory-supplied CASA scripts. We made mosaic images from these data in a 30′′ field around SrcI in SO, SO2, and SiO emission with 1.5 0.9 ′′ angular and 2 velocity resolution. We used only the ALMA 12m array data in these images to filter out the large scale structure and enhance the filamentary structures.
The Miriad software package (Sault et al., 1995) was used to image and analyze all the data in this paper.
3 THE SRC I DISK
We used both CLEAN and Maximum Entropy algorithms to image the JVLA and ALMA data. We convolved the continuum images to a common resolution of 30 mas and 50 mas resolution in order to make spectral index images between 43, 99, 223 and 340 GHz. Because the 43 GHz data were self-calibrated, the wideband image was spatially offset from the higher frequency images. We aligned the 43 GHz image with the 99 GHz image using Miriad task imdiff which finds optimum parameters in a maximum likelihood sense for making one image approximate another image. The parameters adjusted were shifts 9 mas in RA and -2 mas in DEC to an image center at RA = 05:35:14.513, DEC = -05:22:30.576 used in the following figures. The 99, 223, and 340 GHz data were not self calibrated, only the 43 GHz image position was adjusted. Src I is moving at Dx=6.3, Dy=-4.2 mas/yr (Goddi et al., 2011b) . The 99, 223, and 340 GHz image data were acquired within a month period (see Table 1) and the offset in the images from the proper motion is less than 0.4 AU.
3.1 Spectral Index Distribution
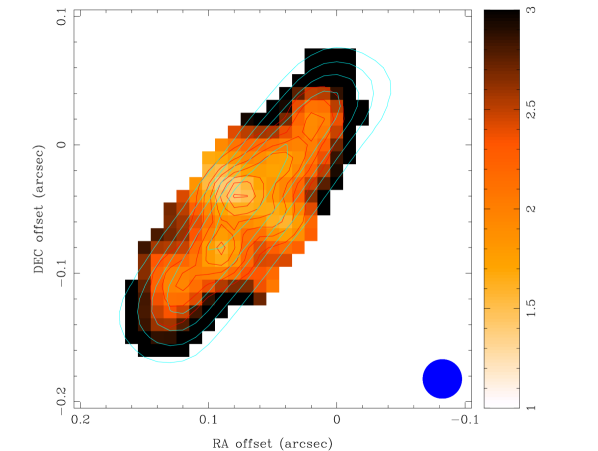
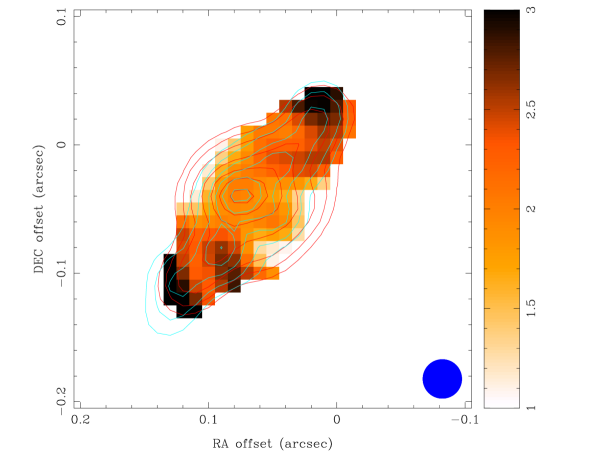
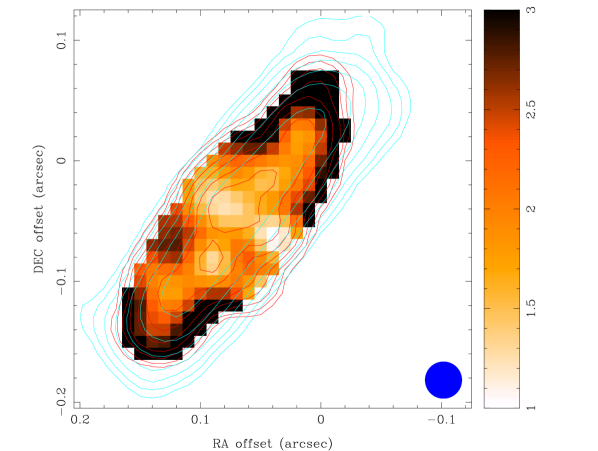
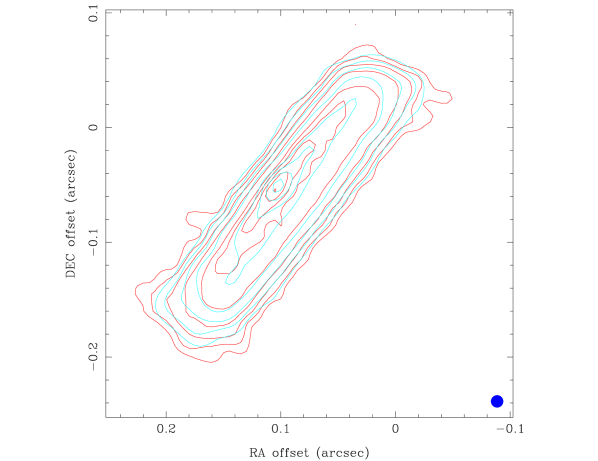
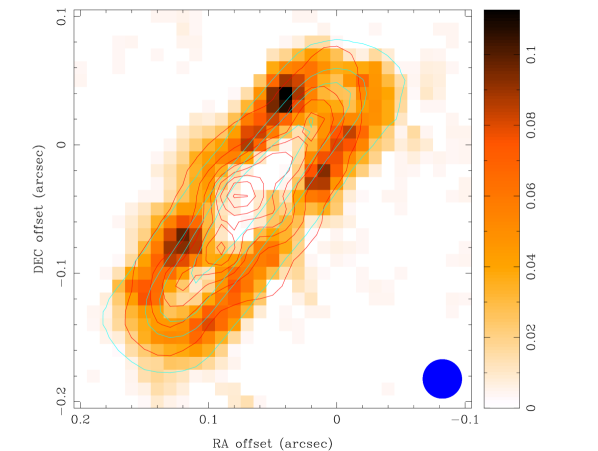
Figures 1, 2 and 3 show the spectral index computed from the ratio of continuum brightness at 340, 223, 99, and 43 GHz at 30 mas resolution. At 50 mas resolution, the same spectral index distributions are seen, convolved to the lower resolution. The RMS noise levels on the continuum images are 4 K, 3 K, 7 K, and 6 K, respectively; the images were clipped at 5% of the peak for the spectral index calculation. The figures show that spectral index 2 along the midplane of the disk, consistent with optically thick emission, almost certainly from dust (Plambeck & Wright, 2016). The spectral index steepens to 3 at the edges and ends of the disk, indicating emission from optically thin dust. In figure 2, we see that the central source is more prominent at 43 GHz, and also note the steepening of the spectral index at the ends of the disk between 43 and 99 GHz.
Uncertainties in the spectral indices are dominated by the absolute flux calibration accuracy of 10% for each frequency band. A multiplicative error in the flux ratio is an additive error in the spectral index of +0.15 and -0.18 in the 340/99 GHz spectral index image, +0.22 and -0.28 in the 223/99 GHz image, and +0.11 and -0.13 in the 99/43 GHz image. A least squares fit from 43 to 340 Ghz to the spectral index at the central position gives 1.6 +/- 0.1, whereas at the ends of the disk the fitted spectral index is 3.4 +/- 0.3. The spectral index variations across the images are significant.
3.2 Disk Structure
Ginsburg et al. (2018) fitted the observed structure of the disk from B3 and B6 ALMA continuum observations at 50 and 20 mas resolution, respectively. They determined that the disk has a length of 100 AU, and vertical FWHM height of 20 AU. They also detected a compact source near the center of the disk, smeared parallel to the disk major axis. The model residuals shown by Ginsburg et al. (2018) have a halo of emission at the 30 K level in the B6 image that may be from optically thin dust, as it was not seen in the B3 image. This halo of emission is evident in Figure 3, where both B3 and B6 are plotted at the same logarithmic contour levels.
Table 2 summarizes the results of Gaussian fits to the disk size in our 4 continuum images. The disk major axis increases with observing frequency, which is expected as the dust optical depth increases. The minor axis is largest at 43 GHz, however, indicating that the central point source is more prominent at lower frequencies.
If we assume that the disk is circular and infinitesimally thin, we can set a lower limit on its inclination angle. The 224 and 340 GHz source sizes given in Table 2 imply that this lower limit is 78-80°.
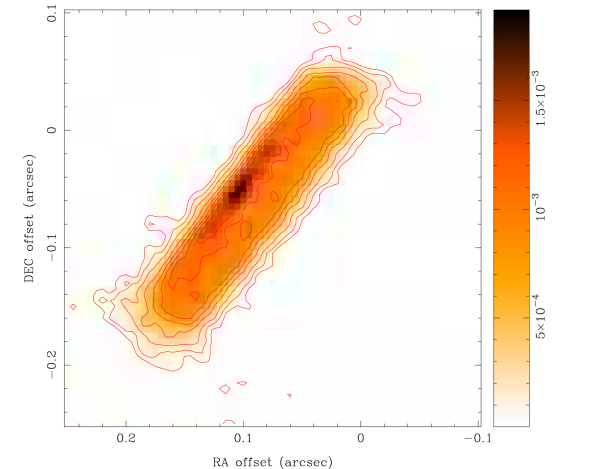
In Figure 4 we show a Maximum Entropy image of the B7 continuum emission. The lower limit to the inclination estimated from the major and minor axes of the Maximum Entropy image is 791∘ measured at the 400 K contour (99 19 AU), and 741∘ measured at the 25 K contour (239 45 AU). The lowest contours at the ends of the disk suggest a flared structure, so the inclination measured at the 400 K contour is better determined. If the disk were inclined by as much as 74 or 79∘, the 20 AU disk thickness, would imply that the SW edge should be slightly curved. The incredibly straight SW edge in Figure 4, suggests that the inclination is closer to 90∘.
A third estimate of the disk orientation can be obtained from the SiO outflow. At the highest velocities, the SiO outflow is blue-shifted to the NE, and red-shifted to the SW. This is more easily seen in Figure 1 of Plambeck et al. (2009), which maps the large scale structure of the SiO outflow. The blue-shifted emission at -13.5 subtends an angle 27∘ at a radius 1300 AU to the NE, and the red-shifted emission at 21.9 subtends an angle 26∘ at a radius 1400 AU. The red-blue asymmetry in the outflow implies that the NE edge of the disk is tipped toward us. Proper motion measurements of compact structures in the outflow could enable us to derive an inclination from the SiO outflow. Matthews et al. (2010) derive an inclination 85° from SiO masers close to the disk.
In Figure 5, we compare Maximum Entropy images of the 340 GHz and 223 GHz continuum emission, both convolved by a 10 mas Gaussian beam. As expected, the convolution reduces the gradients at the edges of the disk, which are still steeper on the NE edge than the SW edge. In both images, the brightness temperature plateau of the disk, ignoring the compact source on the NE side, is 400 K. The brightness falls to 200 K on the 223 GHz image, where the brightness on the 340 GHz image is still 400 K. If we attribute this to dust emission, then the dust opacity at 223 GHz is 0.7, where the emission is still optically thick at 340 GHz. At the disk edges, the logarithmic contour levels are approximately evenly spaced, suggesting an exponential gradient in the emission. The 1/ scale height estimated from the gradient between 400 and 25 K at the edge of the disk at 340 GHz 2 AU on the facing, NE side, to 4 AU on the SW side. We may be seeing deeper into the disk on the facing, NE side where the continuum emission is brighter.
Since the disk surface layers are being torn up by the outflow as the dust grains are destroyed, however, it is likely that the spectral index of the dust emission varies through the surface layers, and we do not make further interpretation of the density profile of the disk surface.
3.3 Salt Emission
Figure 6 shows NaCl emission at 232.51 GHz overlayed on contours of 99 GHz and 340 GHz continuum images. Salt emission is found in the dust layer at the surface of SrcI where there is a large spectral index gradient. A gradient in the dust opacity may help to explain the discrepancy in the NaCl excitation temperatures estimated from rotationally and vibrationally excited levels (Ginsburg et al., 2019). Figure 7 shows a comparison of NaCl emission at 232.51 GHz and 335.51 GHz averaged in 5 channels, overlaid on the spectral index image between 99 and 223 GHz. Both NaCl lines have peaks in the surface layers on both sides of the disk at close to the same positions. The 335 GHz NaCl , line is strongly attenuated where the spectral index is less than 2. The 232 GHz NaCl , line is less attenuated and shows a bridge of emission between the two peaks. The NaCl emission is brighter on the NE side of the disk which is facing towards us. This could also be because there is less attenuation by the disk . Thus, we suggest that the rotational temperatures, over a large range of observing frequencies, could be underestimated because of greater dust opacity at high frequencies, whereas the vibrational temperatures, over a small range of frequencies, are less affected.

4 THE SRC I OUTFLOW
4.1 H2O
Figure 8 shows \ceH2O emission at 232.687 GHz overlayed on 43 GHz continuum, and spectral index images. H2O emission extends from the surface of the SrcI disk into the outflow, and rotates with the SrcI disk. In contrast with the salt emission, the H2O emission is more closely associated with the inner part of the disk, shown here at 43 GHz. The H2O emission may be in part excited by radiation from the central source, and is brighter on the NE side where we see deeper into the disk. Hirota et al. (2017) present a model where the H2O comes from the disk surface, and is driven by a magnetocentrifugal disk wind (Matthews et al., 2010; Vaidya & Goddi, 2013; Greenhill et al., 2013; Hirota et al., 2017).

4.2 AlO
We mapped the AlO N=6-5 line at 229.69387 GHz, and the AlO N=9-8 line at 344.4537 GHz. Figure 9 shows 229.694 GHz AlO emission overlayed on 43 GHz continuum and \ceH2O emission at 232.687 GHz. AlO emission is coextensive with \ceH2O, but the peaks are further out, and brighter on the NE side of SrcI. Since the NE side of the disk is facing towards us, we may be able to see deeper into the central regions. The distributions of AlO emission and \ceH2O shown here are consistent with those presented by Tachibana et al. (2019) for AlO N=13-12 and N=17-16 emission lines at 497 and 650 GHz, and \ceH2O at 643 GHz (Hirota et al., 2017). Tachibana et al. (2019) attribute the distribution of AlO as due to its formation at the base of the outflow, and condensation further out into the outflow. Our observations with higher angular resolution, suggest that AlO emission peaks downstream of the \ceH2O, and may be produced by grain destruction and oxidized by O released by the dissociation of \ceH2O, or released as AlO further out in the outflow than the \ceH2O emission.
4.3 SiO
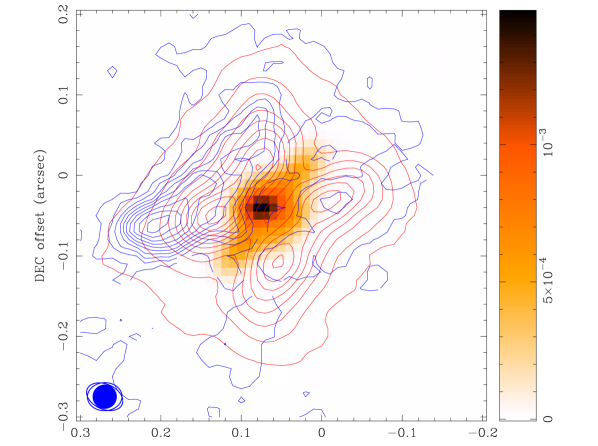
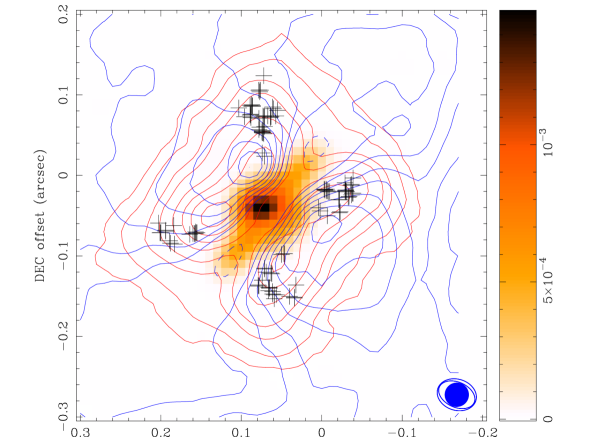
The SiO masers associated with SrcI have been mapped using VLBI at 43 GHz (Kim et al., 2008; Matthews et al., 2010), and 86 GHz (Issaoun et al., 2017). The and , and masers positions lie in an X pattern, with blue-shifted emission in the south and east arms, and red-shifted emission in the north and west arms. The and and masers can be interpreted as tracing a wide angle outflow arising from the surface of the almost edge on rotating disk (Issaoun et al., 2017). No masers are located within a 14 AU band in PA 141∘ that corresponds to the continuum emission from the disk (Matthews et al., 2010). Goddi et al. (2009) modeled the SiO maser excitation including both radiative and collisional excitation. The model predicts densities = to cm-3 for the , and to cm-3 for the transitions. The transition is favored where , closer to SrcI than as is observed (Kim et al., 2008; Matthews et al., 2010) . Figure 10 shows SiO , emission at 217.10498 GHz overlaid on the 43 GHz continuum and 232.69 GHz \ceH2O emission. The centroid positions of the masers mapped using the VLBA are indicated by the black crosses which lie along the ridges of the peak \ceH2O emission. \ceH2O peaks closer to the disk, and SiO extends farther into the lobes. The SiO , distribution is similar to that of the SiO , mapped by Kim et al. (2019). Kim et al. (2019) also mapped the \ce^29SiO v=2 J=11-10 and SiO v=4 J=11-10 lines. The spatial and velocity distribution of these high excitation lines also suggest that they are associated with the base of the outflow at the surface of the disk.
These distributions fit into a scenario where the SiO is formed from grain destruction following the dissociation of \ceH2O (Schilke et al., 1997). In these models, grain mantles and grain cores are destroyed in shocks; Si is released into the gas phase, and then oxidized by dissociation products of \ceH2O. In the Src I disk Si can be ablated from disrupted grains by shock velocities 25 . In the post shock gas, \ceH2O is depleted onto grains and converted to OH. OH reacts with Si to form SiO, and \ceSiO2 if OH is abundant. Cohen et al. (2006) note the absence of OH masers within 1300 AU of SrcI where SiO is prominent. OH masers occur in densities cm-3, close to a shock front where the OH abundance is high. Gain path lengths 1 - 10 AU, not necessarily contiguous, suffice to produce OH masers (Gray et al., 1992), so either chemistry or maser excitation is responsible for their absence closer to SrcI. Greenhill et al. (2013) suggest that shocks from a magnetocentrifugal wind from SrcI, can inject energy further out in the outflow where the outflow speed exceeds the Alfven and sound speeds. SiO emission extends from the surface of SrcI into the extended outflow lobes, and rotates with SrcI. SiO is a good tracer of shocks. The implication is that the OH is depleted in the inner regions where there is free Si. Our data suggest that chemistry and shock excitation play a significant role in determining these molecular distributions.
4.4 SiS
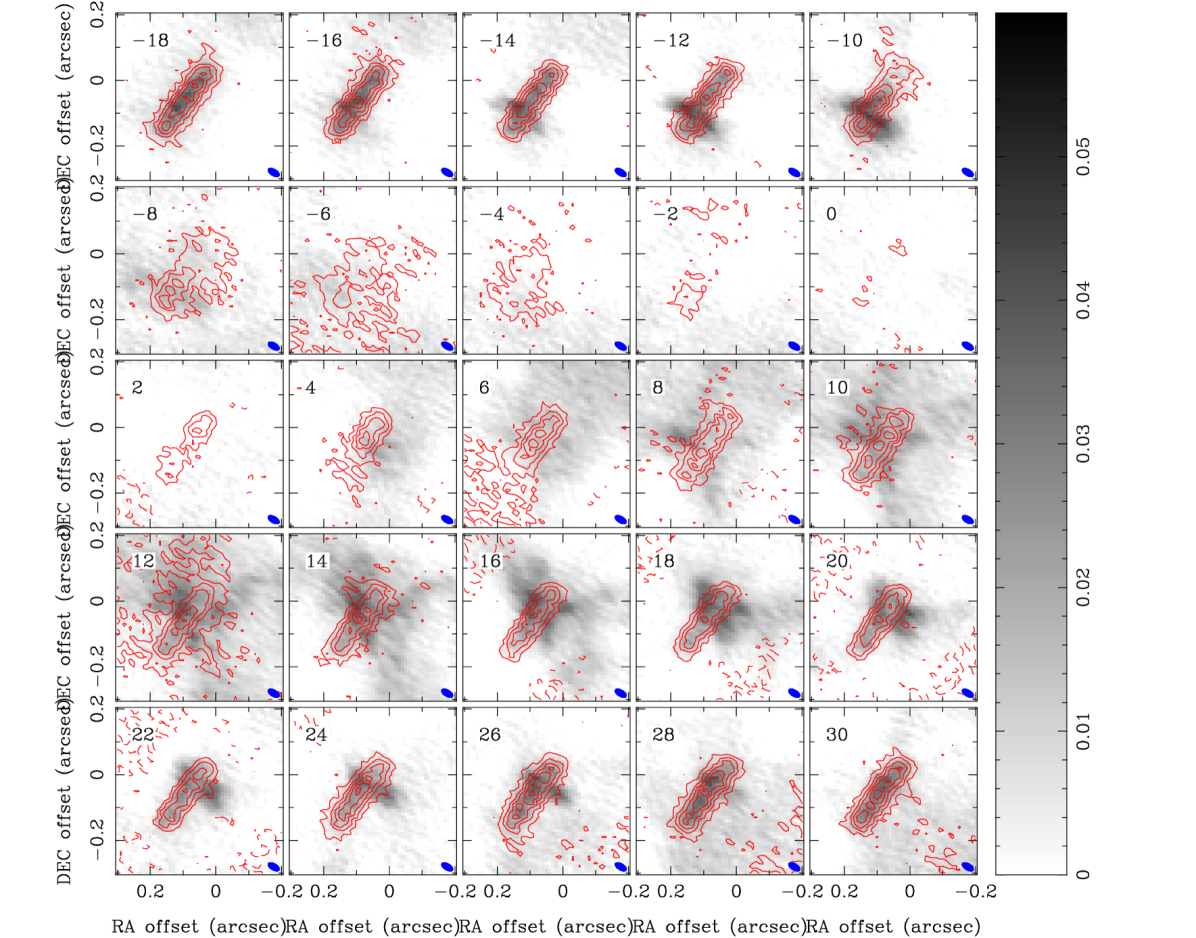
Figure 11, Figure 12, and Figure 13, show three-color images of the 217.817 GHz SiS line. These color images clearly show the wide-angle bipolar wind from Src I. This feature in SiS is highly limb-brightened. In addition to motion away from Src I with the blueshifted lobe extending NE and redshifted lobe extending SW, the SiS outflow exhibits rapid expansion away from the outflow axis. The SiS outflow is highly asymmetric with a stubby NE blue lobe and a much longer SW red lobe. Weak emission can be traced to the lower-right edge of the figures above. Also note the patch of SIS emission near the SW corner of the image at the ”core” velocities.
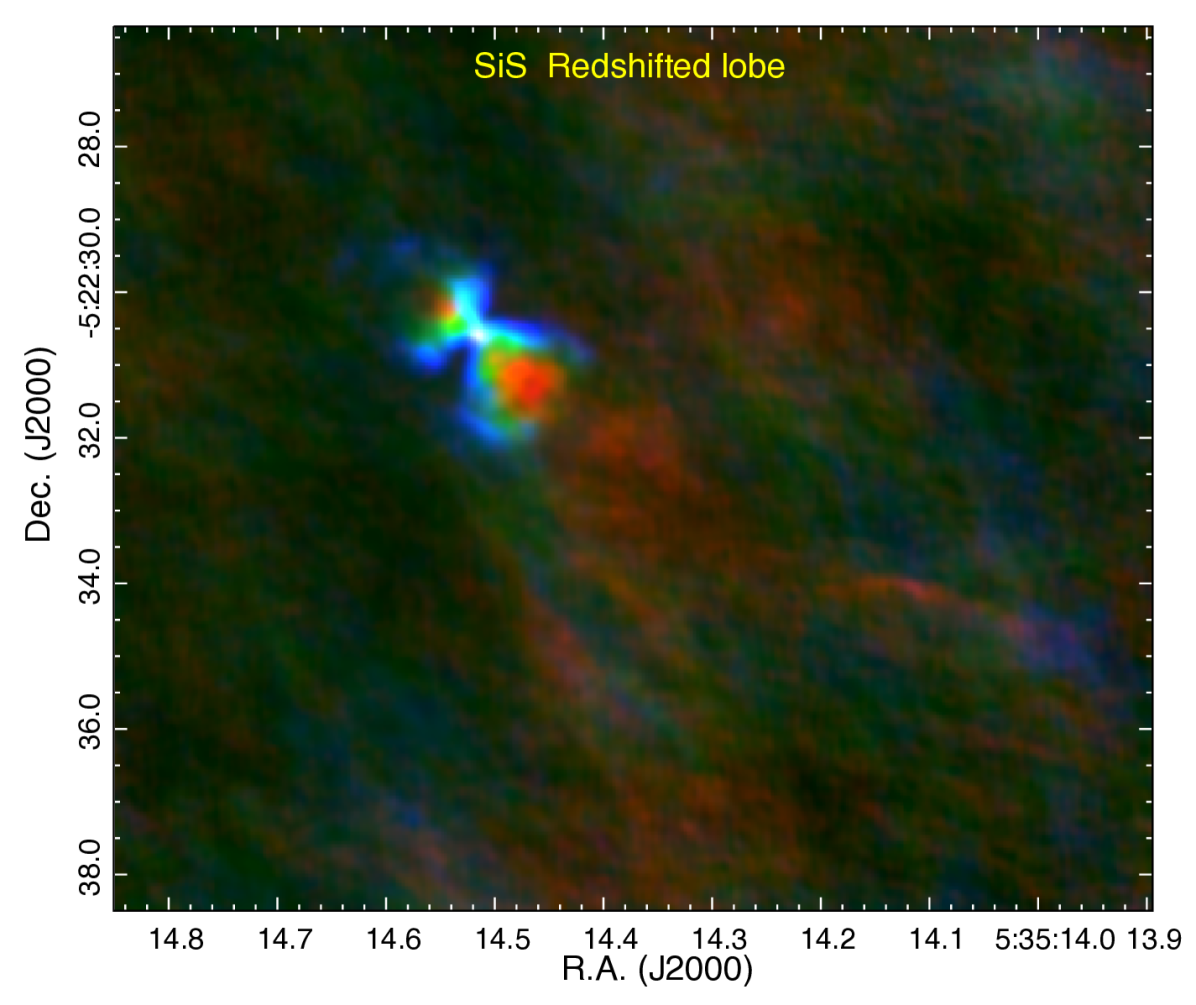

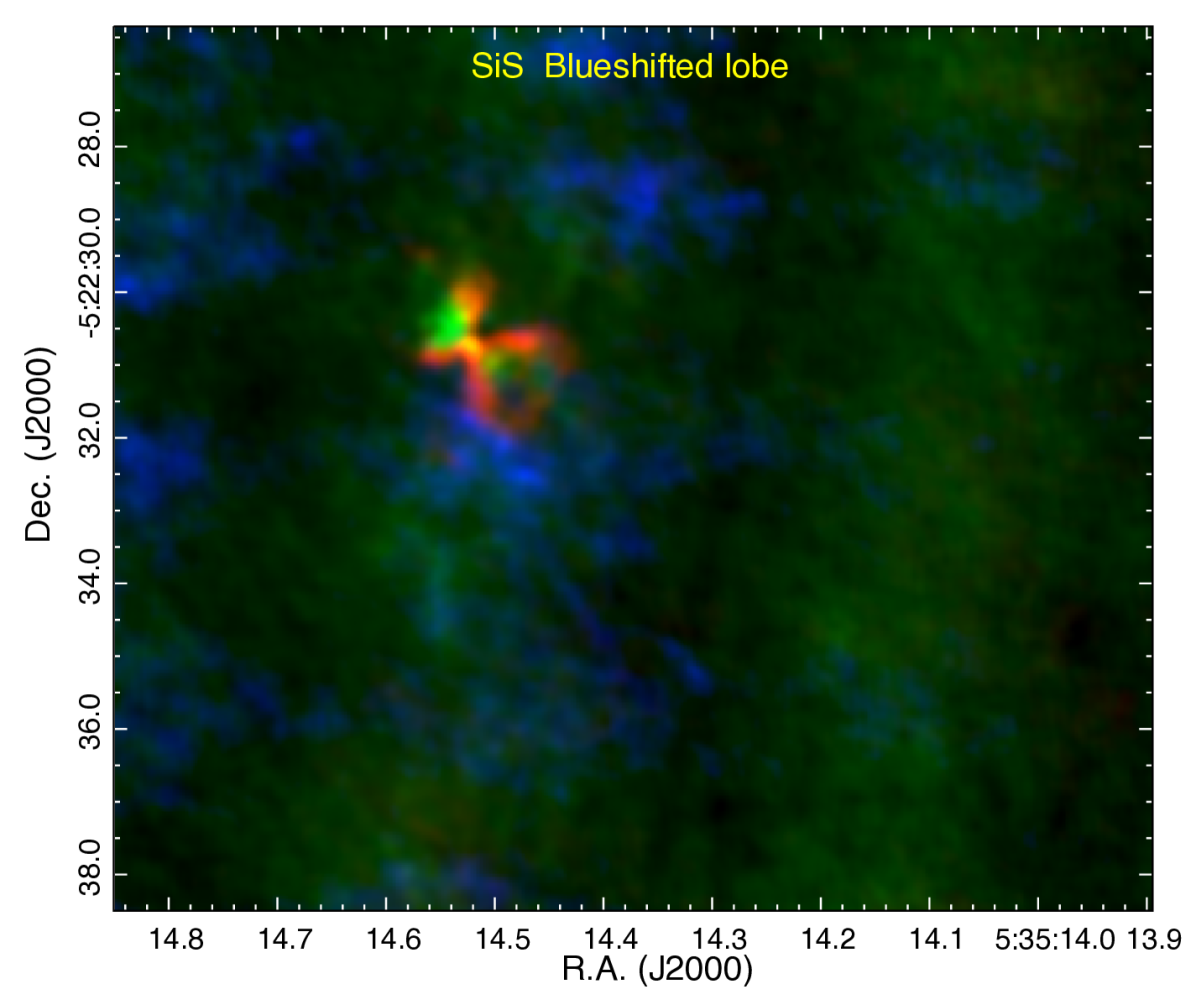
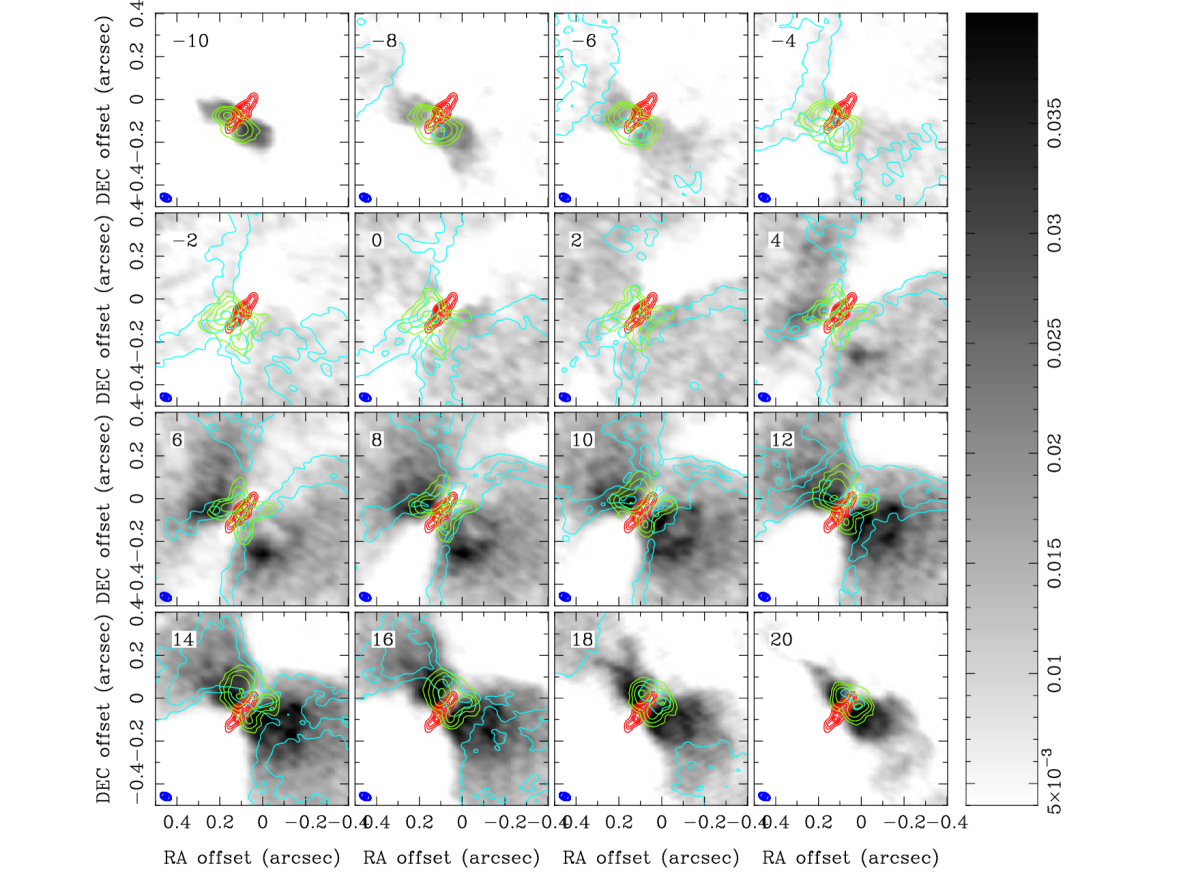
Figure 14 compares the 217.817 GHz SiS line with SiO and \ceH2O emission in 2 velocity channels. Like SiO and \ceH2O, SiS shows rotation close to SrcI. Approximately 50 AU above and below the SrcI disk, close to the maximum extent of the \ceH2O emission region, the SiO column expands abruptly into a turbulent wide angle outflow. Filaments of SiS emission are particularly prominent along the edges of the outflow.
The distributions of SiO and SiS are consistent with the model of Podio et al. (2017), who argue that SiO results from dust grain destruction, whereas SiS is the product of gas phase chemistry. SiO and SiS are also seen in L1157-B1 in the outflow from this low mass protostar (Podio et al., 2017). As in Orion, SiO and SiS have different spatial distributions: SiO is seen where the molecular jet impacts the outflow cavity wall, but SiS is detected only at the leading edge of the outflow. Zanchet et al. (2018) also considered silicon, oxygen, and sulfur chemistry in postshock gas in protostellar outflows. They found that the main SiS-forming reactions are Si + SO and Si + \ceSO2, and that SiS is efficiently destroyed through reaction with atomic oxygen.
4.5 SO and \ceSO2
Figure 15 shows the SO emission at 344.31 GHz, and \ceSO2 at 334.67 GHz in 2 velocity channels. Both SO and \ceSO2 are heavily absorbed across SrcI at velocities of -8 to +4 . This is consistent with the 0.2″ resolution spectra of SrcI plotted by Plambeck & Wright (2016), in which sulfur-bearing species, including CS and \ceH2S as well as SO and \ceSO2, exhibit prominent blueshifted absorption profiles. Since the velocity width of the absorption is comparable with the halfwidth of the SiO emission lines, it is likely that the absorbing molecules are located in the (cooler) outer layers of the SrcI outflow, rather than in unrelated foreground gas. Examining Figure 15, one sees that SO emission (gray scale) follows the rotation of the outflow close to the disk, while \ceSO2 does not show this small scale structure. Models of C-type shocks with velocities 5-40 km/s and densities cm-3 can enhance SO and \ceSO_2 abundances by 2 orders of magnitude. SO decreases quickly after the passage of a shock, whilst \ceSO_2 is enhanced during and for some time after the shock (Pineau des Forets et al., 1993).
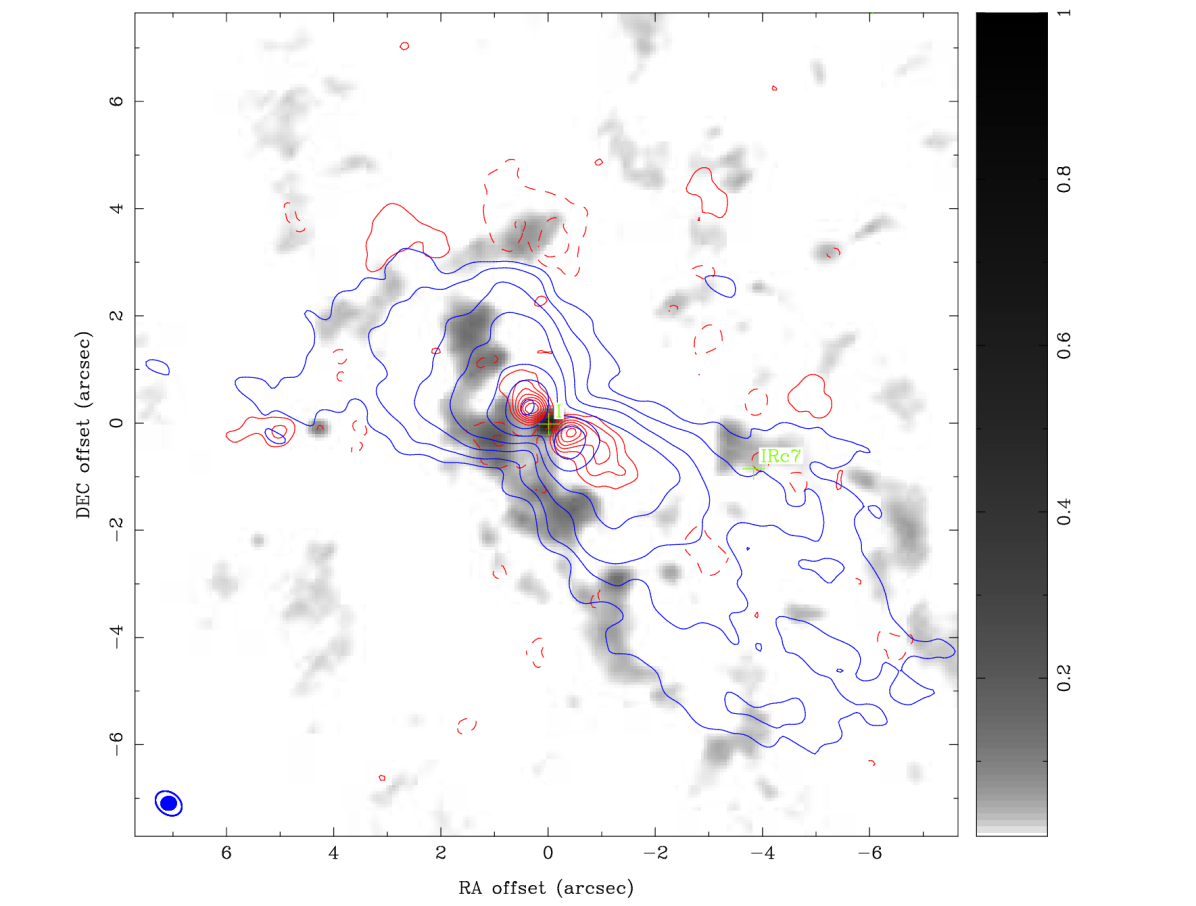
The SO and \ceSO2 distributions are over-resolved in these ALMA observations. At lower resolution, SO and \ceSO2 are seen as a shell of expanding gas, with enhanced abundances where the outflow from SrcI impacts dense clumps around the edges of the outflow (Wright et al., 1996; Wright & Plambeck, 2017). Goddi et al. (2011a) suggested that the hot core is excited by the SrcI outflow impacting a dense core. The correspondence of these continuum clumps with the edge of the outflow is shown in Figure 16.
4.6 Unidentified line emission along outflow axis
Figure 16 also shows an unidentified line that appears in two lobes along the outflow axis, centered on SrcI. Assuming the line is centered at 5, like the SiO, the rest frequency of the U-line is 354.4945 GHz. Gaussian fits to the spectra at the 2 peaks give velocities 4.3 +/- 0.1, FWHM 5.8 +/- 0.2 km/s for the NE peak, and +5.7 +/- 0.1 km/s, FWHM 6.7 +/- 0.2 km/s for the SW peak.
The U-line is blueshifted to NE like the SiO outflow, but the FWHM is smaller, and the emission is more confined along the outflow axis. There is a vibrationally excited HCN line at 354.4604 GHz 26km/s from the U-line centered on 354.4945 GHz in this image. The U-line image has well defined spectral peaks, and has low sidelobes and is probably therefore quite compact, whereas the image of the HCN line emission has large sidelobes suggesting missing larger scale structure. The U-line could be an SiO isotopologue or a high vibrational transition illuminated by the central source. The Lovas catalog lists an unidentified line at 354.4968 GHz. In the CDMS catalog there are many lines from 354.49 to 354.50 GHz. Most of them are organic molecules except TiO2 at 354.4977 GHz, but it is also not convincing.
| freq | project code | date | time | synth beam | baseline |
|---|---|---|---|---|---|
| (GHz) | (min) | (milliarcsec) | (meters) | ||
| 43 | VLA/18A-136 | 2018-03-06 | 291 | 5644 at PA 33 | 500 - 36600 |
| 99 | 2017.1.00497.S | 2017-10-12 | 158 | 4536 at PA 47 | 40 - 16200 |
| 216-220 | 2013.1.005446.S | 2014-12 to 2015-04 | 15 | 1500930 at PA -8 | 14 - 330 |
| 224 | 2016.1.00165.S | 2017-09-19 | 44 | 3919 at PA 66 | 40 - 10500 |
| 340 | 2016.1.00165.S | 2017-11-08 | 45 | 2611 at PA 58 | 90 - 12900 |
| 350 | 2012.1.00123.S | 2014-07-26 | 24 | 276260 at PA 85 | 30 - 730 |
| freq | beam | deconvolved size | integrated flux |
|---|---|---|---|
| (GHz) | (arcsec, PA) | (arcsec, PA) | (mJy) |
| 43 | 0.06 ×0.04, 33° | 0.099 ±0.002 ×0.057 ±0.002, -40.4°±2.7° | 10 ±1 |
| 99 | 0.04 ×0.04, 47° | 0.151 ±0.005 ×0.044 ±0.002, -37.8°±1.3° | 58 ±6 |
| 224 | 0.04 ×0.02, 66° | 0.197 ±0.003 ×0.042 ±0.003, -37.3°±0.4° | 256 ±25 |
| 340 | 0.03 ×0.01, 58° | 0.234 ±0.005 ×0.042 ±0.002, -37.4°±0.3° | 630 ±63 |
5 DISCUSSION and CONCLUSIONS
Our analysis has focused on understanding whether the chemistry seen in SrcI is a result of an “anomalous” history of interactions with its environment, or whether it is directly attributable to the physical conditions of SrcI and its associated outflow, making SrcI a paradigm for the study of high-mass star formation.
The distributions of \ceH2O, SiO, AlO, and SiS lend strong support to a model in which dust grains are ablated and destroyed close to the disk surface, producing an oxygen rich outflow. The strong SiO maser emission, and AlO mapped in the outflow close to the disk, suggest that refractory grain cores as well as the grain mantles are destroyed. Lenzuni et al. (1995) investigated the evaporation of dust grains in protostellar cores. Carbon grains are destroyed at temperatures 800 – 1150 K. Silicate grains are evaporated at temperatures K, followed by AlO at 1700 K. SiO and AlO may be released directly from the grains, or may be formed in the gas phase by the oxidation of Si and Al. Thermal emission from the ground state, , SiO traces a turbulent, wide angle outflow extending over 1000 AU from a position close to the maximum extent of the \ceH2O emission from the disk (Plambeck et al., 2009). SiS traces a more filamentary structure which is prominent at edges of extended SiO outflow. Zanchet et al. (2018), in a study of silicon, oxygen, and sulfur chemistry, found that the main formation for SiS are from SO and \ceSO2 which are seen as a shell around the edges of the outflow (Wright et al., 1996).
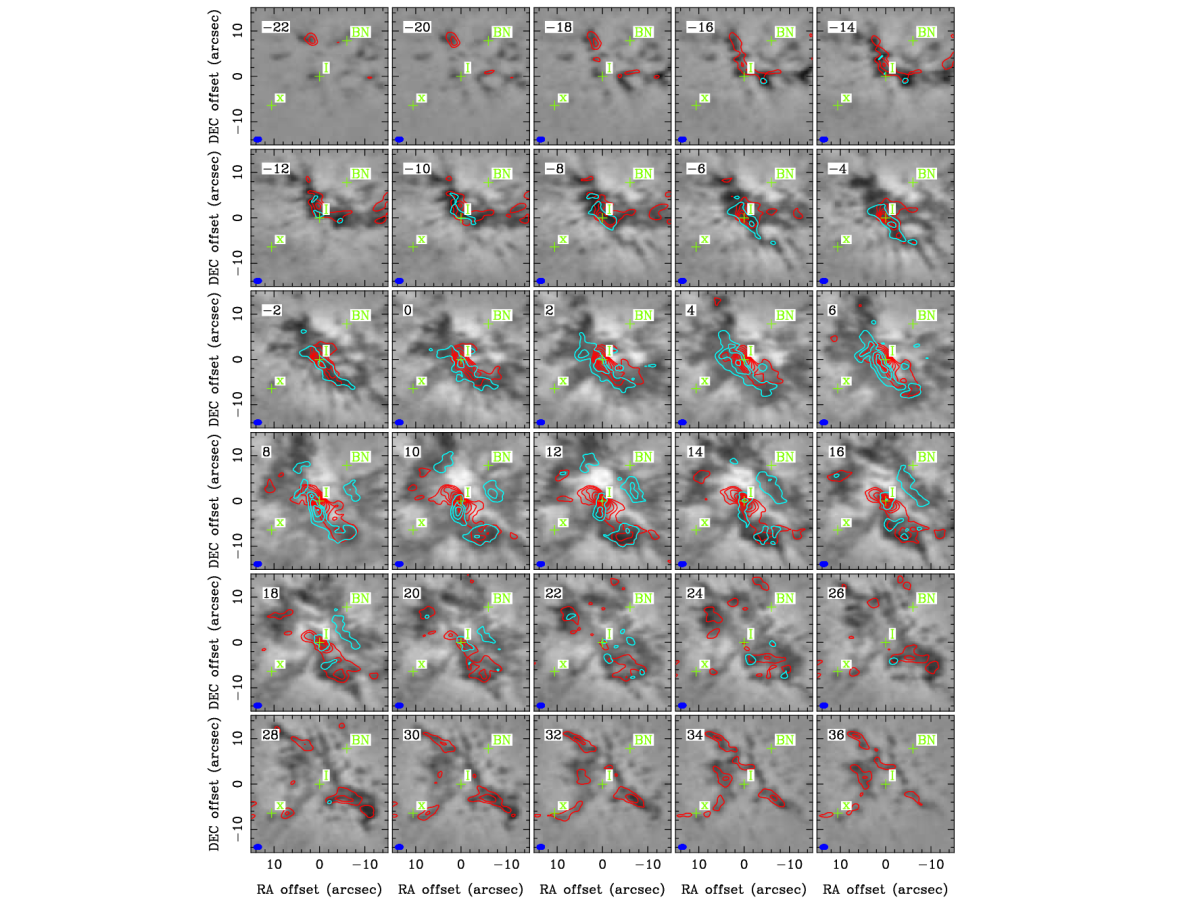
One might ask if the chemistry of the bipolar outflow is distinct from that of the larger “finger system” produced by the BN-SrcI explosive event. The finger system is over an arcminute in extent, and so is almost completely resolved out in our high resolution images. CO emission from the fingers was mapped by Bally et al. (2017) with approximately 1″ resolution using mosaic observations with ALMA. Those data also cover transitions of SiO (J=5-4 v=0; 217.105 GHz), SO (219.95 GHz), and \ceSO2 (216.64 GHz). We used the mosaic ALMA data to generate 2 channel maps of these three molecular lines over a 30″ region centered on SrcI. These images are compared in Figure 17. Both the SiO and SO images exhibit streamers similar those seen in CO; the situation for \ceSO2 is less clear. The SiO fingers east of SrcI at velocities 30 were noted earlier by Plambeck et al. (2009) (see their Figure 4). It is extremely difficult to distinguish the outflow from the finger system in any of these images. In these molecular lines, at least, there appear to be no clear chemical or excitation differences between the bipolar outflow and the explosive event.
It is possible that the SrcI/BN interaction, resulting in a collapse of a binary protostar in SrcI, and the disruption of the disk around SrcI, dredged up the inner part of the disk, and made oxygen and sulfur rich material available for both the SrcI outflow and the explosion, and moved dust grains containing refractory material like AlO and salts to the outer parts of the disk where they could be ablated by the SrcI outflow. The energy for the ejection of SrcI and BN, and the explosion in the gas must have come from gravitational binding energy exceeding 1048 ergs (Bally et al., 2017). The violence of the interaction 550 years ago would have strongly shocked the disk, resulting in chemistry. The AlO and salts could be a bi-product of this interaction. As the disk relaxed from its perturbed state, it could have triggered a major accretion event onto the central binary or a merger which produced the current Src I outflow with about the same age. At 50 AU, the disk is well inside the Src I gravitational radius for a 10 km s-1 ejection speed. Thus the disk is likely made of material that was already bound to one of more stars involved in the interaction - no need for Bondi-Hoyle accretion over the last 500 years. Moeckel & Goddi (2012) studied the chances of disk survival in binary-single stellar interactions with N-body simulations.
Observations of other high mass protostar outflows are required to see if \ceH2O, sulfur and Si molecules, and salts are common or if the SrcI outflow is unusual. We adopt as a working hypothesis, that the rich chemistry seen in SrcI is a direct consequence of the outflow from a high mass protostar and does not depend on the particular environment and history of SrcI.
If, indeed, Orion SrcI, as the closest and best studied example of a young high mass protostar, is a paradigm model, then future observations of other high-mass star formation regions will have many tools available. The resolution and sensitivity of our ALMA observations are sufficient to detect disks and outflows similar to those seen in SrcI out to 2 kpc. Our 50 mas resolution images (100 AU at 2 kpc) have an RMS brightness sensitivity 10 K at 2 velocity resolution which would be sufficient to detect and image SiO, SiS, \ceH2O, and salt distributions in outflows from putative disks around other high mass protostars.
Our observations from 43 to 350 GHz allow us to map the dust opacity at the surface of the disk around SrcI. NaCl and KCl trace the rotation of the surface layers of SrcI, allowing us to estimate the mass of the protostar. Salt emission is confined to the dust layer where there is a large spectral index gradient. NaCl excitation temperatures estimated from rotational transitions over a large range of frequencies could be underestimated because of greater dust opacity at high frequencies, whereas the vibrational temperatures, estimated over a small range of frequencies, are less affected.
H2O emission maps the distribution of material released from grain mantles. SiO maps the more extended outflow. Maps of SiS and SO in other outflows could support the role of gas phase chemistry in the post shock gas in the outflow.
References
- Bally et al. (2017) Bally, J., Ginsburg, A., Arce, H., et al. 2017, ApJ, 837, 60
- Cohen et al. (2006) Cohen, R. J., Gasiprong, N., Meaburn, J., & Graham, M. F. 2006, MNRAS, 367, 541
- Ginsburg et al. (2018) Ginsburg, A., Bally, J., Goddi, C., Plambeck, R., & Wright, M. 2018, ApJ, 860, 119
- Ginsburg et al. (2019) Ginsburg, A., McGuire, B., Plambeck, R., et al. 2019, The Astrophysical Journal, 872, 54. https://doi.org/10.3847%2F1538-4357%2Faafb71
- Goddi et al. (2009) Goddi, C., Greenhill, L. J., Chandler, C. J., et al. 2009, ApJ, 698, 1165
- Goddi et al. (2011a) Goddi, C., Greenhill, L. J., Humphreys, E. M. L., Chandler, C. J., & Matthews, L. D. 2011a, ApJ, 739, L13
- Goddi et al. (2011b) Goddi, C., Humphreys, E. M. L., Greenhill, L. J., Chandler, C. J., & Matthews, L. D. 2011b, ApJ, 728, 15
- Gómez et al. (2008) Gómez, L., Rodríguez, L. F., Loinard, L., et al. 2008, ApJ, 685, 333
- Gray et al. (1992) Gray, M. D., Field, D., & Doel, R. C. 1992, A&A, 262, 555
- Greenhill et al. (2013) Greenhill, L. J., Goddi, C., Chandler, C. J., Matthews, L. D., & Humphreys, E. M. L. 2013, ApJ, 770, L32
- Hirota et al. (2014) Hirota, T., Kim, M. K., Kurono, Y., & Honma, M. 2014, ApJ, 782, L28
- Hirota et al. (2017) Hirota, T., Machida, M. N., Matsushita, Y., et al. 2017, Nature Astronomy, 1, 0146
- Issaoun et al. (2017) Issaoun, S., Goddi, C., Matthews, L. D., et al. 2017, A&A, 606, A126
- Kim et al. (2019) Kim, M. K., Hirota, T., Machida, M. N., et al. 2019, ApJ, 872, 64
- Kim et al. (2008) Kim, M. K., Hirota, T., Honma, M., et al. 2008, PASJ, 60, 991
- Kounkel et al. (2018) Kounkel, M., Covey, K., Suárez, Genaro a nd Román-Zúñiga, C., et al. 2018, AJ, 156, 84
- Lenzuni et al. (1995) Lenzuni, P., Gail, H.-P., & Henning, T. 1995, ApJ, 447, 848
- Matthews et al. (2010) Matthews, L. D., Greenhill, L. J., Goddi, C., et al. 2010, ApJ, 708, 80
- Menten et al. (2007) Menten, K. M., Reid, M. J., Forbrich, J., & Brunthaler, A. 2007, A&A, 474, 515
- Moeckel & Goddi (2012) Moeckel, N., & Goddi, C. 2012, MNRAS, 419, 1390
- Niederhofer et al. (2012) Niederhofer, F., Humphreys, E. M. L., & Goddi, C. 2012, A&A, 548, A69
- Pineau des Forets et al. (1993) Pineau des Forets, G., Roueff, E., Schilke, P., & Flower, D. R. 1993, MNRAS, 262, 915
- Plambeck & Wright (2016) Plambeck, R. L., & Wright, M. C. H. 2016, ApJ, 833, 219
- Plambeck et al. (2009) Plambeck, R. L., Wright, M. C. H., Friedel, D. N., et al. 2009, ApJ, 704, L25
- Podio et al. (2017) Podio, L., Codella, C., Lefloch, B., et al. 2017, Monthly Notices of the Royal Astronomical Society: Letters, 470, L16
- Reid et al. (2007) Reid, M. J., Menten, K. M., Greenhill, L. J., & Chandler, C. J. 2007, ApJ, 664, 950
- Rodríguez et al. (2005) Rodríguez, L. F., Poveda, A., Lizano, S., & Allen, C. 2005, ApJ, 627, L65
- Sault et al. (1995) Sault, R. J., Teuben, P. J., & Wright, M. C. H. 1995, in ASP Conf. Ser. 77: Astronomical Data Analysis Software and Systems IV, Vol. 4, 433. http://adsabs.harvard.edu/cgi-bin/nph-bib_query?bibcode=1995adass...4..433S&db_key=AST
- Schilke et al. (1997) Schilke, P., Walmsley, C. M., Pineau des Forets, G., & Flower, D. R. 1997, A&A, 321, 293
- Tachibana et al. (2019) Tachibana, S., Kamizuka, T., Hirota, T., et al. 2019, The Astrophysical Journal, 875, L29. https://doi.org/10.3847%2F2041-8213%2Fab1653
- Vaidya & Goddi (2013) Vaidya, B., & Goddi, C. 2013, MNRAS, 429, L50
- Wright & Plambeck (2017) Wright, M. C. H., & Plambeck, R. L. 2017, The Astrophysical Journal, 843, 83
- Wright et al. (1996) Wright, M. C. H., Plambeck, R. L., & Wilner, D. J. 1996, ApJ, 469, 216
- Zanchet et al. (2018) Zanchet, A., Roncero, O., Agúndez, M., & Cernicharo, J. 2018, ApJ, 862, 38