Short gamma-ray bursts within 200 Mpc
Abstract
We present a systematic search for short-duration gamma-ray bursts (GRBs) in the local Universe based on 14 years of observations with the Neil Gehrels Swift Observatory. We cross-correlate the GRB positions with the GLADE catalogue of nearby galaxies, and find no event at a distance 100 Mpc and four plausible candidates in the range 100 Mpc 200 Mpc. Although affected by low statistics, this number is higher than the one expected for chance alignments to random galaxies, and possibly suggests a physical association between these bursts and nearby galaxies. By assuming a local origin, we use these events to constrain the range of properties for X-ray counterparts of neutron star mergers. Optical upper limits place tight constraints on the onset of a blue kilonova, and imply either low masses () of lanthanide-poor ejecta or unfavorable orientations (30 deg). Finally, we derive that the all-sky rate of detectable short GRBs within 200 Mpc is yr-1 (68% confidence interval), and discuss the implications for the GRB outflow structure. If these candidates are instead of cosmological origin, we set a upper limit of 2.0 yr-1 (90% confidence interval) to the rate of nearby events detectable with operating gamma-ray observatories, such as Swift and Fermi.
keywords:
gamma-ray burst: general – gravitational waves – star: neutron – nuclear reactions, nucleosynthesis, abundances1 Introduction
Short-duration gamma-ray bursts (sGRBs) are sudden and brief flashes of gamma-ray radiation lasting less than 2 seconds (Kouveliotou et al., 1993). Their origin has been traditionally linked to the coalescence of two neutron stars (NSs; Eichler et al. 1989; Ruffert & Janka 1999; Rosswog et al. 2003; Rezzolla et al. 2011; Giacomazzo et al. 2013) or a neutron star and a black hole (NS-BH; Rosswog 2005; Faber et al. 2006; Shibata & Taniguchi 2011), although no direct proof was found until the historic observations of GW170817 and its gamma-ray counterpart GRB 170817A (Abbott et al., 2017a, b). Consistent with the notion of an old progenitor population, Tanvir et al. (2005) had suggested that a significant fraction (10-25%) of sGRBs lied in the local Universe, likely harbored in early-type galaxies. These findings, based on crude BATSE localizations of the gamma-ray emission, were not confirmed by the accurate afterglow positions obtained by the Neil Gehrels Swift Observatory (Gehrels et al., 2004, 2005). In 14 years of the Swift mission, over 100 sGRBs were detected (Lien et al., 2016), and 70 were localized to an arcsecond or sub-arcsecond accuracy, yet no event was clearly associated to a nearby (200 Mpc) galaxy. Swift observations showed instead that sGRBs reside in all types of galaxy environments spanning a broad range of redshifts, from 0.1 to 2 (Berger, 2014). The all-sky rate of sGRBs was consequently revised to a lower value of 5 Gpc-3 yr-1 (e.g. Coward et al., 2012; Jin et al., 2015; Wanderman & Piran, 2015; Ghirlanda et al., 2016).
The discovery of GW170817/GRB170817A at a distance of only 40 Mpc was surprising. It revealed the presence of a local population of faint gamma-ray transients following NS mergers (Abbott et al., 2017a). GW170817 was associated with the kilonova AT2017gfo, characterized by an early bright optical emission with -16 mag at 12 hours after the merger (e.g. Coulter, et al., 2017), and followed by a delayed afterglow, peaking at 160 days after the merger (e.g. Troja et al., 2017; Hallinan et al., 2017; Troja et al., 2018b; Mooley et al., 2018; Resmi et al., 2018; Margutti, et al., 2018; Lamb et al., 2019; D’Avanzo et al., 2018). Another sGRB, GRB 150101B at a distance of =0.1341, was later identified as a GW170817-like explosion with a bright optical kilonova and a late-peaking afterglow (Troja et al., 2018a), showing that this class of transients could be detected by Swift and ground-based facilities to much larger distances. These new results pose the question why local events were not identified before the advent of sensitive GW detectors.
Observational biases could have played a fundamental role. The typical strategy for the localization of GRB counterparts is based on rapid X-ray observations. However, due to its low-luminosity and delayed onset, an off-axis X-ray afterglow component would be undetectable at early times. Had a GW170817-like event happened during Swift mission’s lifetime, it would probably belong to the sub-sample of Swift sGRBs with no X-ray counterpart. This could explain in part the lack of identifications.
A kilonova component similar to AT2017gfo is instead well above the sensitivity of most ground-based telescopes up to distances of 200 Mpc. Therefore, in the case of a local sGRB, the lack of a kilonova detection appears puzzling. Observations of cosmological sGRBs place tight constraints on the optical emission for at least some events (Gompertz et al., 2018; Rossi et al., 2019), showing that diversity in the kilonova behavior is to be expected. A kilonova fainter or redder than AT2017gfo could have been easily missed in past searches. Such diversity is also expected on theoretical grounds, e. g. a weaker optical emission could characterize NS-BH mergers or be the signature of NS-NS mergers which promptly collapse to a BH (Tanaka et al., 2014; Kawaguchi et al., 2016). Furthermore, even if an optically bright kilonova was indeed present, the identification of a counterpart embedded within its galaxy light can be a challenging task, especially in the absence of a precise X-ray position.
Based on these considerations, the dearth of nearby sGRBs does not automatically rule out the presence of a local population of faint gamma-ray transients, analogous to GW170817. In this paper we address this open question, and explore whether the lack of local sGRBs in the Swift sample can be mostly ascribed to observing biases or is indicative of a true low rate of nearby events. A first attempt to identify a group of nearby under-luminous bursts was made by Yue et al. (2018), who, however, focused on candidates already reported through GRB Circular Notices and did not perform a comprehensive and homogeneous search over the entire database. Systematic searches were recently carried out by Mandhai et al. (2018) and Bartos et al. (2019) with different sample selection criteria and methodologies. Mandhai et al. (2018) did not find any robust evidence for a population of local sGRBs and constrained their all-sky rate to 4 yr-1 within 200 Mpc. Bartos et al. (2019) instead proposed a large sample of candidates, supporting a rate as high as 10% of the total sGRB sample (Gupte & Bartos, 2018). In this work, we provide an alternative strategy for finding local sGRBs and present a homogeneous re-analysis of the ultraviolet and optical observations in order to constrain the presence of a kilonova, and characterize the contribution of the underlying host galaxy. This is a critical step as the limits and sensitivities typically reported in GRB Circular Notices refer to field objects, and do not represent well our ability to detect optical transient sources within bright nearby galaxies. The paper is organized as follows: in Section 2 we present the selected sample of sGRBs, and detail our search strategy for nearby galaxies and data analysis. Results are presented in Section 3. In Section 4 we discuss their implications for the local rate of sGRBs and their outflow structure. Conclusions are summarized in Section 5. Uncertainties are quoted at the 1 confidence level for each parameter of interest and upper limits are given at a 2 level, unless stated otherwise. We adopted a standard CDM cosmology (Planck Collaboration et al., 2018).
| GRB | Fluencea | R. A. | Dec | 90% error | SNR | Partial Coding | XRT start | 90% upper limit | |
|---|---|---|---|---|---|---|---|---|---|
| [s] | [ | (J2000) | (J2000) | [arcmin] | [ | ||||
| erg cm-2] | erg cm-2 s-1] | ||||||||
| Group : Failed to Trigger On-board | |||||||||
| 080121b | 0.32 | 31 | 09:09:01.8 | +41:50:21.3 | 2.5 | 8.3 | 63% | 2.3 d | 4 |
| 090815C | 0.5760.271 | 41 | 04:17:53.5 | -65:54:28.4 | 2.9 | 6.8 | 77% | 0.4 d | 7 |
| 091117 | 0.64 | 256 | 02:03:50.0 | -16:56:45.2 | 2.8 | 7.0 | 8% | 1.1 d | 16 |
| 100216Ab,c | 0.208 | 2.60.9 | 10:17:03.1 | +35:31:26.4 | 3.1 | 6.0 | 35% | 2.5 d | 5 |
| 100224A | 0.4840.244 | 3.40.8 | 05:33:52.1 | -07:59:38.4 | 2.6 | 7.8 | 100% | – | – |
| 101129Ad | 0.3500.050 | 134 | 10:23:41.0 | -17:38:42.0 | 3.0 | 6.1 | 12% | 0.5 d | 30 |
| 120817Bc | 0.072 | 174 | 00:33:14.4 | -26:25:40.8 | 2.5 | 8.5 | 5% | 0.8 d | 21 |
| 140402A | 0.9 | 52 | 13:50:31.0 | +05:59:41.8 | 2.7 | 7.2 | 66% | 0.65 d | 10 |
| 180718A | 0.0840.023 | 53 | 22:24:04.6 | +02:47:23.3 | 3.0 | 6.3 | 25% | 1.3 d | 10 |
| Group : triggered bursts + rapid follow-up | |||||||||
| 050906b,d | 0.1280.016 | 1.00.3 | 03:31:13.5 | -14:37:13.1 | 2.8 | 6.9 | 70% | 79 s | 56 |
| 050925 | 0.0920.014 | 7.00.9 | 20:13:56.9 | +34:19:46.1 | 1.5 | 16.8 | 41% | 72 s | 354 |
| 051105A | 0.0560.014 | 1.60.4 | 17:41:12.2 | +34:56:40.5 | 2.3 | 9.0 | 80% | 68 s | 16 |
| 070209b | 0.0680.018 | 2.00.4 | 03:04:56.6 | -47:23:16.7 | 2.2 | 9.7 | 85% | 78 s | 16 |
| 070810B | 0.0720.023 | 1.60.4 | 00:35:49.3 | +08:49:07.8 | 2.3 | 8.5 | 100% | 62 s | 27 |
| 100628Ae | 0.0360.008 | 2.00.5 | 15:03:46.3 | -31:39:10.6 | 2.1 | 10.8 | 70% | 86 s | 24 |
| 130626A | 0.1600.029 | 6.00.8 | 18:12:29.6 | -09:31:29.5 | 1.8 | 13.5 | 100% | 111 s | 1840 |
| 170112A | 0.0560.018 | 1.30.4 | 01:00:55.7 | -17:13:57.5 | 2.5 | 8.1 | 100% | 62 s | 47 |
| Group : observing constraints or observed during slew | |||||||||
| 050202 | 0.1120.031 | 3.10.6 | 19:22:20.5 | -38:43:49.4 | 2.2 | 9.7 | 58% | – | – |
| 070923 | 0.0400.009 | 3.90.7 | 12:18:33.9 | -38d:16:52.5 | 1.9 | 12.2 | 77% | – | – |
| 071112B | 0.3040.090 | 4.70.9 | 17:20:47.6 | -80:53:08.5 | 2.3 | 9.4 | 79% | 62 min | 17 |
| 081101 | 0.1800.042 | 7.01.1 | 06:23:20.3 | -00:06:17.5 | 1.7 | 13.9 | 51% | 111 min | 4 |
| 090417A | 0.0680.021 | 2.20.5 | 02:19:58.4 | -07:08:45.8 | 2.7 | 7.2 | 30% | – | – |
| 110420B | 0.0840.021 | 5.51.0 | 21:20:10.9 | -41:16:36.7 | 2.2 | 10 | 36% | 43 min | 15 |
| 111126A | 0.6720.039 | 71 | 18:24:07.1 | +51:28:06.1 | 2.5 | 8.3 | slew | – | – |
| 120229A | 0.2360.037 | 4.10.7 | 01:20:09.8 | -35:47:54.4 | 1.9 | 12.5 | 86% | – | – |
| 140414A | 0.4960.068 | 12.41.2 | 13:01:20.3 | +56d:54:41.8 | 1.7 | 13.7 | slew | 11.7 hr | 60 |
| 140606A | 0.3400.094 | 5.11.0 | 13:27:11.7 | +37:35:55.8 | 2.4 | 8.6 | 87% | – | – |
| 151228A | 0.2760.040 | 8.31.1 | 14:16:04.8 | -17:39:59.1 | 1.8 | 13.3 | 100% | 2.1 d | 24 |
| 160612A | 0.2480.048 | 9.61.0 | 23:13:27.3 | -25:22:28.1 | 1.7 | 13.9 | slew | 2.1 d | 31 |
| 160726A | 0.7280.043 | 27.22.4 | 06:35:14.3 | -06:37:01.4 | 1.3 | 21.2 | 56% | – | – |
| 170325A | 0.3320.071 | 8.61.3 | 08:29:55.9 | +20:31:32.5 | 2.0 | 11.4 | slew | – | – |
| 180715A | 0.6840.088 | 12.61.9 | 15:40:20.5 | -00:53:57.5 | 2.0 | 11.3 | 85% | 53 min | 31 |
| Group : INTEGRAL bursts | |||||||||
| 081226B | 0.5 | 10 | 01:41:58.8 | -47:26:20 | 2.2 | – | – | 2.7 hr | 21 |
| 110112B | 0.3 | 10 | 00:42:23.8 | +64:24:22.6 | 2.6 | – | – | 15.5 hr | 30 |
| 131224A | 0.8 | 3 | 19:47:20 | +31:40:03 | 2.0 | – | – | 3 hr | 28 |
a Fluence calculated in the 15-150 keV energy range for Swift GRBs (Lien et al., 2016) and 20-200 keV for INTEGRAL GRBs.
b Bursts with a GLADE catalog local galaxy (D200 Mpc) inside the 90% error region
c Standard tools fail to estimate the error for these bursts.
d Standard tools fail to estimate the value. is retrieved from GCNs (Parsons et al., 2005; Cummings et al., 2010).
e The X-ray candidate counterpart shows only 7 total counts with 0.7 of expected background. This yields a low statistical significance, below what we define as detection threshold.
2 Data Analysis
2.1 Sample selection
2.1.1 Swift bursts
We considered all the events detected by Swift between January 1st, 2005 and January 1st, 2019, as reported in the online BAT GRB catalogue111https://swift.gsfc.nasa.gov/results/batgrbcat/ (Lien et al., 2016).
We found 119 events classified as sGRBs ( 2 s),
with 37 events not associated with any X-ray or optical counterparts.
We did not include sGRBs with extended emission (Norris & Bonnell, 2006), whose classification and progenitor are still highly uncertain.
In addition, since the traditional 2-s cut might introduce a significant contamination from the population of long GRBs (Bromberg et al., 2013),
we adopted a stricter selection criterion of 1 s. This choice reduces the number of interlopers without significantly impacting the sample size.
Out of 96 sGRBs with 1 s,
we select 32 events without afterglow counterpart222
GRB070406, although reported in the BAT catalogue, was removed from the analysis due to the low significance (4 ) of the signal in BAT..
Table 1 lists their properties.
Prompt emission properties were derived from the Swift/BAT data using standard analysis procedures (Lien et al., 2016). Swift/XRT upper limits
were derived using the online Swift tool333http://www.swift.ac.uk/user_objects/, and converted into fluxes using a conversion factor of 410-11 erg cm-2 cts-1, typical of GRB afterglows (Evans et al., 2009).
This sample can be divided into three sub-groups:
Group a: these events (9 in total) were not detected through the on-board trigger algorithm, and were found at a later time by a human-based analysis.
As can be derived from Table 1,
the lack of on-board detection is either due to a low -ray fluence in the BAT bandpass (intrinsic factor) or to an unfavorable position (extrinsic factor), at the edges of the BAT field of view (partial coding 25%).
Group b: these events (8 in total) were triggered normally and rapidly (1000 s) observed with Swift’s narrow field instruments, yet no afterglow was found.
Group c: about half of the bursts with no afterglow counterpart (15 in total) were affected by extrinsic factors,
such as observing constraints or a spacecraft’s slew, which delayed their identification and observations. Therefore this group include bursts triggered on-board but without early afterglow observations and bursts which were not triggered the on-board because observed during a slew.
2.1.2 Other missions
Short GRBs detected by the Fermi Gamma-ray Telescope or through the InterPlanetary Network (IPN) are characterized by large error regions, and are not well suited for our study. We include in our selection bursts localized by the INTEGRAL Soft Gamma-Ray Imager444https://www.isdc.unige.ch/integral/science/grb#ISGRI (ISGRI; Lebrun, et al. 2003), with a typical localization uncertainty of 3 arcmin. We found 5 events classified as short bursts: GRB 150831A, also triggered by Swift, and GRB 070707 have an afterglow counterpart, whereas the three remaining bursts (GRB 131224A, GRB 110112B and GRB 081226B) have no detected afterglow. This fourth group (Group d) is also listed in Table 1.
The four sub-groups identified in Table 1 form our “Total Sample" of bursts. External factors (e.g. disabled trigger during the slew, proximity to the Sun) often affected their observations. In these cases, bursts were likely drawn from the standard population of cosmological sGRBs, and the lack of an afterglow counterpart could simply be the result of sub-optimal observations. After excluding these events, we define a “Gold Sample” of 13 bursts (bold-face in Table 1) observed in optimal conditions, yet not detected by Swift. We consider that this sample is more likely to intrinsically differ from the general population. These are bursts which had a favorable sky position (partial coding 25%) and failed to trigger BAT (group ), or bursts whose afterglow was not detected despite rapid (1,000 s) follow-up observations (group ).
2.2 Search for nearby galaxies
We cross-correlated the burst positions in Table 1 with the GLADE v2.3 catalogue of nearby galaxies (Dálya et al., 2018). GLADE contains 3 million objects classified as galaxies and is complete in terms of their measured B-band luminosity up to 40 Mpc. Its completeness decreases to 40% at 200 Mpc. SGRBs typically reside in bright galaxies (Gehrels et al., 2016) and, by considering only the brighter half of galaxies, the completeness of the catalogue increases to 90% up to 200 Mpc.
We considered a match if we find one or more nearby galaxies (estimated distance of 200 Mpc) within the quoted 90% error region. Four matches were found out of the 13 bursts in our “Gold Sample”, corresponding to 31%. These matches are GRB 050906, GRB 080121, GRB 070810B and GRB 100216A No other match is found by including the remaining 22 bursts of the “Total Sample”. We note that a bright (17.01 mag) galaxy HyperLEDA PGC890767 lies within the error region of the BAT GRB 091117 and a galaxy HyperLEDA PGC501449 (18.6 mag) lies within the error region of the INTEGRAL GRB 081226B. However, no information on their distances are available, and we do not include them in our selection.
We repeated the same analysis using the BAT positions from the sample of sGRBs with an XRT localization, and from the sample of long GRBs. In both cases, we found a significantly lower match rate555For completeness we report that two sGRBs with X-ray afterglow match with a nearby GLADE galaxy: GRB 150101A and GRB 070809, as noted by Tunnicliffe, et al. (2014). However, the optical properties of GRB 070809 seem to favor 0.2 (Jin et al., 2019). (3-4%). Since the accuracy of the BAT localization depends on the signal-to-noise ratio, weak bursts have less accurate positions than average. We tested whether the higher match rate of the “Gold Sample” of bursts was a consequence of their lower fluences and hence larger error regions. We simulated 1,000 random sky positions with the same localization accuracy of our “Gold Sample” and found that the match rate remains low (3%), confirming that the size of the error region does not drive the result.
The match rate between sGRBs with no X-ray afterglow and nearby galaxies is therefore higher than the rate expected from chance alignments, possibly as a result of a real physical connection between some of these bursts and nearby galaxies. Due to the low number of events, this excess is only marginally significant (98%) at a statistical level (Gehrels, 1986).
2.3 Optical data reduction
We examined in detail the follow-up observations for the four sGRBs possibly associated to nearby galaxies. Our dataset includes archival data from the UltraViolet and Optical Telescope (UVOT; Roming et al., 2005) aboard Swift, the Low Resolution Imaging Spectrometer (LRIS; Oke et al. 1995) on the 10 m Keck I telescope, and the Gemini Multi-Object Spectrographs (GMOS; Hook et al. 2004) on the 8.1 m Gemini-North telescope.
Swift data were reduced in a standard fashion using the HEASOFT package v6.26.1 and the latest calibration files. Aperture photometry was performed on the images using the prescriptions of Breeveld et al. (2010).
Ground-based imaging data were reduced using standard techniques for CCD data reduction, including e.g. bias subtraction, cosmic-ray rejection, flat-field correction. We used custom IDL scripts and the standard Gemini IRAF666IRAF is distributed by the National Optical Astronomy Observatory, which is operated by the Association of Universities for Research in Astronomy (AURA) under a cooperative agreement with the National Science Foundation. package. If the target was observed for two or more epochs, we searched for variability by performing image subtraction with HOTPANTS (Becker, 2015). Magnitudes were calculated using aperture photometry and calibrated against the SDSS DR15 catalogue (Blanton et al., 2017). Upper limits were derived by seeding the images with artificial point-like sources of known brightness.
3 Results
3.1 X-ray constraints
XRT upper limits on the early afterglow phase were derived using the online Swift tool777http://www.swift.ac.uk/user_objects/, and are reported in Table 1.
In order to estimate the typical sensitivity of the Swift observations we derive the upper limit at a single position within the BAT error region referred to the first snapshot taken by the instrument after the detection. They may differ from the values reported in GRB Circular Notices, often derived using longer integration times.
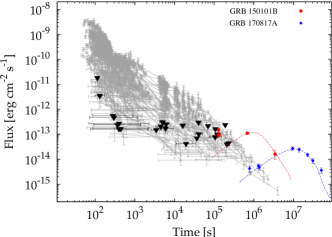
In Figure 1 we compare these X-ray limits (3- c.l.) to the Swift sample of sGRB afterglows, and to the off-axis X-ray afterglows of GW170817/GRB170817A and GRB150101B detected by Chandra (Troja et al., 2018a, 2019). For early follow-up (6 hrs) observations with no XRT detection, the X-ray afterglow must be fainter than the average sGRB population, although still within the distribution of observed X-ray fluxes. Upper limits become less constraining in the case of delayed (12 hrs) observations. In no case were Swift observations sensitive to late-peaking afterglows, such as GW170817.
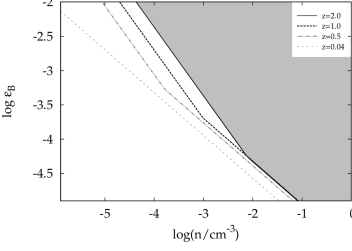
The early XRT upper limits can be used to constrain the properties of an on-axis GRB explosion. In order to do this, we explore the allowed parameter space that would lead to a non-detection at early times. We apply the standard model of synchrotron afterglow emission (Mészáros & Rees, 1997; Sari, et al., 1998) using the formulation of Granot & Sari (2002) for a constant density interstellar medium (ISM), and including Inverse Compton (IC) corrections (Sari & Esin, 2001; Zou et al., 2009; Beniamini et al., 2015). This model is completely described by a set of five parameters: {, , , , }, where is the slope of the electrons’ power-law energy distribution, and are the fractions of the burst kinetic energy that exist in the magnetic field and electrons respectively, and is the circumburst particle density. We adopt and as canonical values (Beniamini & van der Horst, 2017). We also assumed a gamma-ray efficiency of (Beniamini et al., 2015) to convert the gamma-ray energy released into blastwave kinetic energy , and an outflow Lorentz factor =300 (Ghirlanda, et al., 2018).
The allowed parameter space is defined by requiring that the X-ray flux is below the XRT sensitivity (2 erg cm-2 s-1) at the time of first observation (70 s). This yields two conditions:
| (1) |
| (2) |
where is the luminosity distance. The true parameter space for non-detections is the maximum allowed value of and from the two regions, as shown in Figure 2. We find that, at any redshift, the scenario of on-axis sGRBs is consistent with the lack of X-ray detection if these explosions happened in a tenuous environment, cm-3 for . The density can be greater than cm-3 only for .
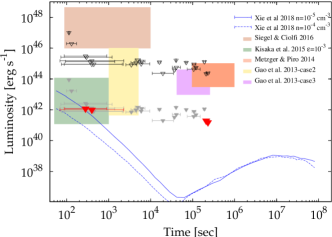
We also compare the X-ray upper limits with models of alternative X-ray counterparts to NS mergers (Figure 3). A first set of models discuss the emission from a long-lived and highly magnetized NS remnant. Gao et al. (2013), Siegel & Ciolfi (2016) and Metzger & Piro (2014) predict bright X-ray counterparts, which can be ruled out by the XRT upper limits assuming a local origin (200Mpc) for the short GRBs in our sample. The predictions of Siegel & Ciolfi (2016) fall above our limits even assuming =1 for all the busts (open downward triangles in Figure 3).
A second set of models consider the X-ray emission arising from the interaction between the relativistic jet and the merger ejecta (Kisaka & Nakamura, 2015; Xie & MacFadyen, 2018), and predict faint signals that peak at early times. These are only weakly constrained by the XRT limits. Kisaka & Nakamura (2015) propose that photons emitted from the jet are scattered at large angles by the surrounding ejecta, producing a nearly isotropic X-ray transient. XRT limits can exclude part of the parameter space, but remain consistent with this model for low on-axis X-ray luminosity ( erg s-1) or a low scattering parameter (). Xie & MacFadyen (2018) discuss instead the possibility of an X-ray flash immediately after the merger. When the relativistic jet emerges from the cloud of ejecta, a shock-heated layer of mildly relativistic material (2) radiates non-thermally in the X-ray band. This emission is below our upper limits for typical densities of the external medium ( cm-3).
3.2 Candidate events within 200 Mpc
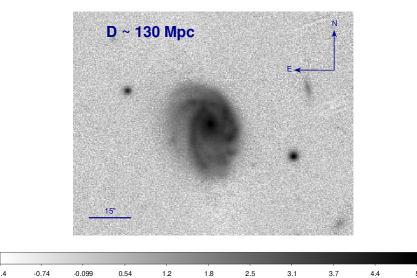
The four matches found in the “Gold sample” are GRB050906, GRB080121, GRB070810B, and GRB100216A. Their prompt emission is shown in Figure 4–7 together with their putative host galaxies. Below we discuss in detail their properties and compare them with the electromagnetic counterparts of GW170817.
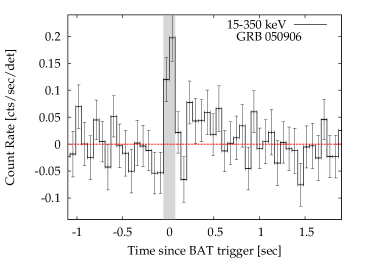
3.2.1 GRB050906
This burst was studied in detail by Levan et al. (2008) who noted the proximity with IC328 and the companion IC327 at redshift =0.031 (134 Mpc). Whereas the two galaxies lied outside the BAT position used in Levan et al. (2008), IC328 is fully consistent with the updated position reported in the 3rd BAT catalogue (Lien et al., 2016). The image of the galaxy within the updated BAT error region is available in the online supplementary material. The maximum distance between the center of the galaxy and the border of the 90% BAT error region is 240 which corresponds to a maximum offset of 150 kpc.
The GRB prompt emission is marginally detected by BAT (it was at the limit of the trigger threshold with a SNR=6.9, Figure 4) and not particularly hard in spectrum. At a distance of 130 Mpc, its energy release would be 21046 erg. Despite the close distance and the rapid follow-up, no afterglow counterpart was found. Levan et al. (2008) suggested that this unusual properties could be evidence of an extra-galactic soft gamma-ray repeater. Instead, here we discuss whether they could be consistent with a NS merger.
If IC328 is indeed the host galaxy of GRB 050906, then the burst environment is markedly different from GW170817. The galaxy morphology indicates a late-type galaxy, its colors suggest a relatively high stellar mass, , and a moderate star formation rate log(SFR/M⊙ yr 1.2 (Levan et al., 2008). Although different from NGC 4993 (e.g. Im, et al., 2017), these global properties are consistent with the heterogeneous environment of sGRBs (Berger, 2014).
No lower limit for compact object mergers is available for this GRB since LIGO was not operative at the time of the burst.
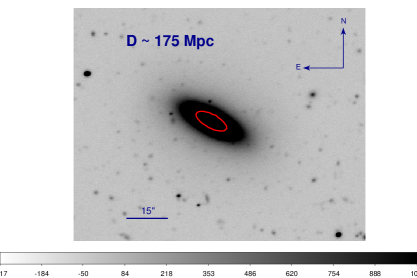
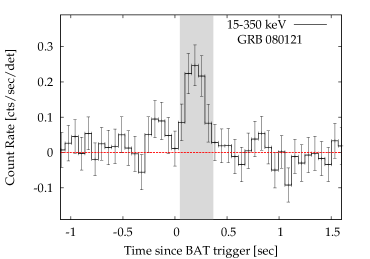
3.2.2 GRB070810B
The prompt phase observed by BAT consist of a very short (=0.07 s) single pulse (Figure 5). XRT observations started 62 s after the trigger, but no reliable X-ray afterglow was identified. No optical counterpart is found in the early UVOT observations, starting 65 seconds after the trigger (Marshall, et al., 2007).
A bright early-type galaxy (Figure 5) at =0.0385 (175 Mpc; Thoene et al., 2007) lies within the BAT error circle. The maximum projected offset, derived considering the border of the 90% BAT error region, would be 215, corresponding to 175 kpc
At this distance, the burst isotropic-equivalent energy would be erg in 15–150 keV. The putative host is an evolved spheroidal galaxy, detected by the Wide-field Infrared Survey Explorer (WISE; Cutri et al. 2013) with W1=14.790.02 AB mag, and W2=15.470.03 AB mag . Using the relation of Wen et al. (2013), we infer a stellar mass of 9.8. From UV observations with the GALaxy Evolution EXplorer (GALEX; Bianchi et al. 2017), this galaxy has a magnitude of 23.010.17 AB mag and 20.930.06 AB mag in the far and near UV band, respectively. Using the relations provided by Iglesias-Páramo et al. (2006), we derive a star formation rate of log(SFR/M⊙ yr 0.21 (see the complete table included in the online supplementary material). The galaxy’s morphology, its large stellar mass and low star formation are similar to the environment of GW170817, and other nearby sGRBs such as GRB 150101B (Troja et al., 2018a) and GRB050724A (Berger, 2014).
This burst happened during LIGO’s fifth science run (S5). Analysis of the GW data could only exclude that the merger happened within 2 Mpc for a NS-NS merger, and 6 Mpc for a NS-BH merger (90% confidence level; Abadie et al. (2010)).
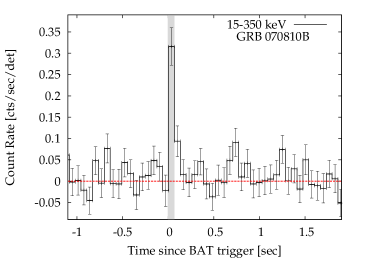
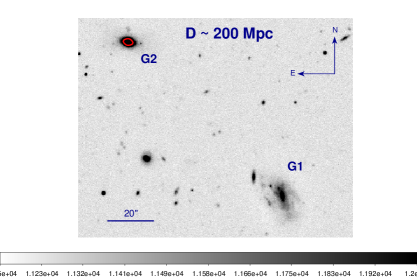
3.2.3 GRB080121
GRB 080121 was discovered through the ground-based analysis of Swift/BAT data (Cummings & Palmer, 2008). Its prompt gamma-ray phase (Figure 6) consists of a single pulse of 0.2 s with a faint precursor emission (inset of Figure 6) visible in the soft energy range (50 keV). XRT and UVOT observations started 2.3 days after the GRB and found no credible counterpart (Troja, et al., 2008).
Two bright SDSS galaxies, SDSS J090858.15+414926.5 (G1 in Figure 6) and SDSS J090904.12+415033.2 (G2 in Figure 6) lie within the BAT position (Lien et al., 2016). The maximum projected offset, derived considering the maximum distance between the galaxy’s center and the border of the 90% error region, is 220 (200 kpc) and 180 (170 kpc) from G1 and G2, respectively.
G1 is a face-on late-type galaxy at a distance of 20314 Mpc with an absolute B-band magnitude =-18.5 mag. G2 is instead an early-type galaxy at 20714 Mpc with =-18.8 mag. If the burst is indeed associated to any of these galaxies, its energy release would be erg in the 15-150 keV energy range. The precursor displays properties similar to the sample presented in Troja, et al. (2010), but, at this distance, would have a much lower energy budget 3 erg.
G1 is reported in the WISE catalogue (Cutri et al., 2013) with =18.940.05 AB mag and =19.430.15 AB mag, and in the GALEX catalogue with mFUV=19.830.12 AB mag, mNUV=19.520.06 AB mag. Based on these values, we estimate a stellar mass log(M/M⊙)8.1 (Wen et al., 2013) and an unobscured star formation rate of log(SFR/M⊙ yr -0.27 (Iglesias-Páramo et al., 2006). G2 displays a substantially redder color, with =16.800.03 AB mag, =17.360.04 AB mag, and mNUV=22.000.52 AB mag. This suggests a larger stellar mass, log(M/M⊙)9.0 (Wen et al., 2013),
and a lower star formation rate, log(SFR/M⊙ yr -0.35 (Iglesias-Páramo et al., 2006). Considered the heterogeneous environment of short GRBs, both these galaxies are plausible host.
This burst occurred between LIGO S5 and S6 runs, and no constraints on its distance are available.
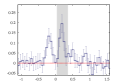
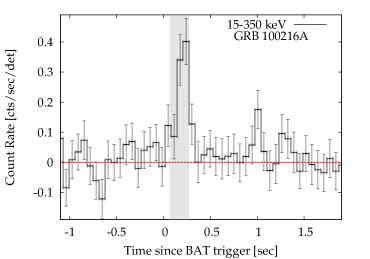
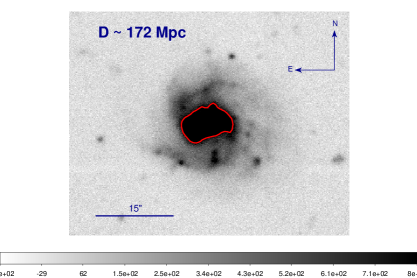
3.2.4 GRB100216A
GRB 100216A was discovered through the ground-based analysis of Swift/BAT data (Cummings et al., 2010), and consists of a single pulse of duration 0.2 s (Figure 7). The signal significance in BAT is marginal (Lien et al., 2016), however the same event was detected by the Fermi Gamma-Ray Burst Monitor, which confirms it as a real burst. XRT and UVOT observations started 2.5 days after the GRB and found no credible counterpart (Rowlinson et al., 2010).
A bright SDSS galaxy at redshift =0.038 (172 Mpc) lies within the BAT error region. The maximum projected offset from the galaxy is 220, corresponding to 180 kpc.
At this distance the GRB isotropic-equivalent energy release would be erg (15-150 keV). The putative host galaxy, SDSS J101700.25+353118.9 (LEDA 86918), appears as a face-on barred spiral, its IR luminosity from WISE (W1=18.030.04 AB mag, W2=18.570.09 AB mag) suggests a stellar mass of 8.3 (Wen et al., 2013). From its UV luminosity (mFUV=18.890.11 AB mag, mNUV=18.690.08 AB mag) we derive an unobscured star formation rate of log(SFR/M⊙ yr -0.12 (Iglesias-Páramo et al., 2006).
This burst happened during LIGO’s sixth science run. Analysis of the GW data excludes that the merger happened within 23 Mpc for a NS-NS merger, and 40 Mpc for a NS-BH merger (90% confidence level, Abadie et al. 2012).
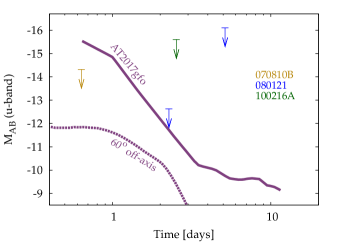
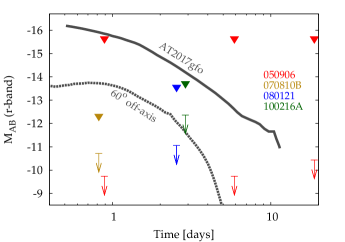
3.2.5 Optical Limits
In Figure 8 we compare the optical limits for the four candidate nearby bursts with the kilonova AT2017gfo. In no case an optical counterpart was detected within or close to the putative host galaxy. Limits from Swift/UVOT and ground-based optical imaging are reported in Figure 8, and compared with the light curve of AT2017gfo.
At distances larger than 100 Mpc, the UVOT sensitivity is comparable to or shallower than the predicted emission, and the presence of a kilonova cannot be meaningfully constrained (Figure 8; left panel). Deep ground-based imaging yields much tighter limits (Figure 8; right panel), although the sensitivity of the search is affected by the galaxy’s light. For this reason, in Figure 8 (right panel) we report two sets of upper limits, derived within the galaxy (downward triangles) and outside it (downward arrows). The internal limits are derived using image subtraction technique and simulating point-like sources close to the center of the galaxy. All the limits are reported in an online table (supplementary material). For GRB 100216A only a single epoch of observations is available, and upper limits were derived by using reference images from PanSTARRs (Chambers et al., 2016). The higher background level and image subtraction artifacts in the central regions of the galaxy might prevent a reliable source detection. The contours of these regions are shown in Figures 5, 6, and 7. Fake sources were simulated immediately out of these regions to derive the internal limits. Based on the offset distributions of sGRBs (e.g. Berger, 2014), the probability to find a sGRB at similar or smaller offsets from the galaxy’s center is 18%, 13% and 35% for GRB 070810B, GRB 080121 and GRB 100216A, respectively.
For events outside the red contours (Figures 5, 6, and 7), the presence of a kilonova similar to AT2017gfo can be ruled out in the optical. It’s worth to note that infrared observations are available only for GRB 050906 (see Levan et al., 2008) and the derived upper limits are 2.5 times higher than the magnitude expected for AT2017gfo.
We explored the consistency of a kilonova non-detection with these optical limits in terms of the key physical parameters and , which are the ejecta mass and velocity respectively. We applied the simple analytic model outlined in Hotokezaka et al. (2018) for the bolometric lightcurve, and set an opacity of cm2/g for the blue (lanthanide-poor) kilonova component and cm2/g for the red (lanthanide-rich) component (e.g. Roberts, et al., 2011; Grossman et al., 2014). We convert the bolometric lightcurve as a function of time to an r-band magnitude assuming a blackbody spectrum with the temperature evolution outlined in Hotokezaka et al. (2018). Field upper limits place the tightest constraints and, for a velocity c, imply an ejecta mass for events viewed towards their polar regions. This value is smaller than the one derived for GW170817A/AT2017gfo (Hotokezaka et al., 2018) and other candidate kilonovae (Troja et al., 2018a; Lamb et al., 2019; Troja, et al., 2019).
The typical parameters for ejecta mass and velocity in compact mergers is found to be , with typical velocities of c (Bauswein, Goriely, & Janka, 2013; Hotokezaka et al., 2013; Perego et al., 2014, e.g.). Thus, our field limits are quite restrictive on the typical parameter space for r-process ejecta, and lead us to conclude that a lanthanide-poor kilonova viewed towards the polar regions would likely have been detected. For events closer to the galaxy’s center the limits are shallower, and ejecta masses could be compatible with the observations.
For an off-axis observer, the emission is suppressed by the lanthanide-rich ejecta and can be more than two magnitudes lower than AT2017gfo. In Figure 8, we show the predicted kilonova emission for an observer located 60∘ off-axis (dashed lines) as presented by Troja et al. (2017) and derived using the model of Wollaeger et al. (2018). In this case only the optical limits from GRB 070810B and the field limits from GRB 050906 remain constraining.
The lack of an optical counterpart can also constrain the presence of a lanthanide-rich kilonova. Our limits imply a low mass of neutron-rich ejecta, , for any event in the galaxy’s outskirts. However, if we consider the shallower upper limits derived in the inner galaxy’s regions, then a lanthanide-rich kilonova similar to AT2017gfo could be consistent with our lack of detection.
3.3 Comparison with previous works
Our results present some differences with the works of Mandhai et al. (2018) and Bartos et al. (2019), which addressed a similar topic. Mandhai et al. (2018) considered a sample of 150 Swift GRBs with <4 s, longer than the duration threshold used in this work, and included both GRBs with a detected afterglow and those without any counterpart. They adopted a different galaxy catalogue (2MASS Redshift Survey; Huchra et al., 2012) and a visual examination of DSS II images. Their matching radius for nearby galaxy extended to a distance of 200 kpc from the GRB position. This value is much larger than the typical projected offset of short GRBs (Troja, et al., 2008; Fong & Berger, 2013; Tunnicliffe, et al., 2014) and, whereas it does not significantly increase the chance of finding a real association, it more than doubles the probability of chance alignments, from 3% of our sample to 8%. Using this approach the authors find an upper limit on the all-sky rate of local short GRB detectable by Swift of < yr-1.
We conclude that differences in the adopted catalogues of galaxies as well as in the selected GRB sample result in a different list of candidates and a different estimate for all-sky rate. Looser constraints on the burst duration and maximum GRB/galaxy offset increased the probability of spurious associations.
Our selection criteria and search strategy are more similar to those presented in Bartos et al. (2019). Their work focuses on late-time radio monitoring of sGRBs, and thus excludes all the sources with declination below -40∘ and between -5∘ and 15∘ due to satellites interference. They also use optical upper limits from the literature to constrain any kilonova signal, and conclude that of sGRBs in their sample can not be associated with a AT2017gfo-like kilonova if located at 200 Mpc. However, they do not consider viewing angle effects nor the contamination from the nearby bright galaxy, and how it affects optical searches. Bartos et al. (2019) adopt a larger search radius for local galaxies and derive a higher chance probability for the galaxy association. While in our work we derive the chance probability from the the all sky distribution of galaxies, Bartos et al. (2019) derive it from the density of galaxies around the GRB position. Due to inhomogeneities in the local universe (e.g. Sylos Labini, 2011), a nearby galaxy may reside within an overdensity of galaxies, thus the chance probability as calculated by Bartos et al. (2019) could be high also in the case of a true local sGRB.
Another fundamental difference between our work and past searches is that we took into account the observing conditions, removing from our sample bursts affected by sub-optimal observations.
4 Discussion
4.1 Implications for the rate of NS mergers
Our search did not find any event closer than 40 Mpc, in agreement with previous limits derived from joint GW-GRB searches (Abadie et al., 2010, 2012). Since galaxy catalogues are complete within this distance range, we conclude that no GRB discovered by Swift was as close as GW170817. We also did not find any event in the range 40 - 100 Mpc, although the GLADE galaxy catalogue is not complete in this distance range (Dálya et al., 2018). Four plausible candidates were found in the range 100-200 Mpc, which, given the larger volume included, is consistent with the lack of detection at closer distances.
Two of the candidate bursts were discovered by a human-based analysis, which was neither systematic nor homogeneous. For this reason, we do not use them to calculate the rate of events. The other two bursts (GRB 050906 and GRB 070810B) were discovered by the standard trigger algorithm, which can be modeled in order to estimate the detectability of these objects (e.g. Lien et al., 2014). The corresponding all-sky (isotropic equivalent) rate of events (together with the corresponding 1 confidence levels) was derived assuming a local origin for this subsample of sGRBs:
| (3) |
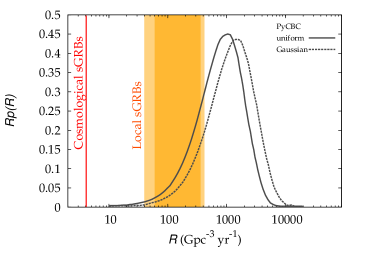
Assuming that all the binary NS mergers result in successful GRB jets, this rate implies a beaming factor (90% confidence interval) to be consistent with the NS merger rate derived by the LIGO-Virgo collaboration (Abbott et al., 2019). Vi,max in Equation (3) is the maximum volume of detectability for each event , calculated considering the variation of the observable solid angle with respect to the distance of the burst, Vi,max= V d. We used the sensitivity curves presented in Lien et al. (2014) to parameterize this effect. The maximum solid angle, sr, corresponds to a partial coding , and the control time yr was estimated for an average Swift duty cycle of 78%. The factor takes into account the completeness of the galaxy catalogue. Following that sGRBs preferentially occur in the brightest galaxies, the GLADE catalogue can be considered 90% complete up to 200 Mpc (Dálya et al., 2018), and 1.1. We caution that the result is mostly driven by the weakest event, GRB 050906, and the volumetric rate derived only from GRB 0708010B would be 30 Gpc-3 yr-1, a factor of five lower.
We can note from Figure 9 that this rate is significantly higher that the one reported from measurements derived using cosmological GRBs (e.g. 4 Gpc-3 yr-1 from Wanderman & Piran 2015). This discrepancy is likely due to the higher number of low-luminosity sGRBs detectable in the local Universe. Indeed, in their calculations Wanderman & Piran (2015) imposed a minimum isotropic-equivalent luminosity of erg s-1, whereas our results are driven by two under-luminous events. Extrapolating the results of Wanderman & Piran (2015) to lower values of minimum luminosity, , we found a rate consistent with the one presented in Equation (3).
Based on the above numbers and on the assumption that our candidates reside within 200 Mpc, the local all-sky rate of detectable sGRBs is yr-1 (68% confidence interval). By taking into account the instruments’ field of view and duty cycle, this corresponds to events yr-1 in the triggered Swift sample, and events yr-1 in the Fermi sample, due the larger field of view of the Gamma-Ray Burst Monitor. We also find that a systematic search of the untriggered Swift dataset could increase the rate of joint GRB/GW detections, and the chances of rapid and accurate localization of a GW source.
If the identified candidates reside instead at higher redshift, we derive an upper limit of 2 events yr-1 (90% confidence interval) to the rate of nearby detectable sGRBs. During the selection process we did not account for the subsample of sGRBs with extended emission, however this should not substantially affect our results. These bursts represent 15% of the Swift sGRB sample and, if included, they may increase the derived event rate by a comparable fraction.
Our results show that the number of detectable sGRBs within 200 Mpc could be substantially higher than pre-GW predictions (e.g. Clark, et al., 2015; Ghirlanda et al., 2016), and are consistent with independent estimates based on the Fermi dataset (e.g. Abbott et al., 2017a; Burgess et al., 2017; Zhang et al., 2018). Our value is, in all cases, smaller than the optimistic estimates by Gupte & Bartos (2018), and in line with the constraints derived by Mandhai et al. (2018).
| Jet Model | WP15 | G16 |
|---|---|---|
| Top-Hat () | 200 | 200 |
| Gaussian () | 33 | 27 |
| PL () | 26 | 4 |
| PL () | 54 | 14 |
| Cocoon-like () | 72 | 29 |
| Cocoon-like () | 5 | 1.5 |
4.2 Constraints on the jet structure
The conversion of the observed rate to the intrinsic rate typically involves a geometrical beaming fraction , which for a top-hat jet is , where is the jet half-opening angle. Interestingly the derived rate of visible sGRBs is already close to the NS merger rate, 1103840 Gpc-3 yr-1 (90% confidence interval), as estimated from GW data (Abbott et al., 2019). This suggests a low beaming factor (90% confidence interval), as well as an efficient production of sGRBs, i.e. most neutron stars mergers may result in successful GRB jets (see also Beniamini et al., 2019; Beniamini, et al., 2020). These results are consistent also with the most updated estimates of the NS rate obtained during the O3 run of Advanced LIGO and Advanced Virgo (The LIGO Scientific Collaboration et al., 2020).
In cosmological sGRBs the beaming factor is commonly estimated from the afterglow jet-breaks, and found to be of the order of 200 (e.g. Burrows et al., 2006; Troja et al., 2016; Jin et al., 2018).
However, recent observations of GW170817 and its afterglow revealed a complex structure of the relativistic outflow. In particular, whereas the common belief was that the gamma-ray emission is visible only to observers located within the narrow jet core, observations of GW170817 suggested that observers located at large angles from the jet-axis can still detect a faint gamma-ray signal. These effects are insignificant at cosmological distances (Beniamini & Nakar, 2019), but should be taken into account in the nearby Universe, where this faint prompt emission becomes detectable by current gamma-ray facilities. For GW170817, afterglow modeling finds that the ratio between the viewing angle and the jet core opening angle is 5-6, with 5 deg (e.g. Mooley et al., 2018; Troja et al., 2019; Lamb et al., 2019). The resulting beaming correction is only 10.
We performed a series of Monte Carlo simulations to further explore the consistency of different angular and radial jet profiles with the rate of local sGRBs identified in this work. We explored a variety of jet structures in order to identify which structures have geometrical beaming fractions 80, so that the intrinsic local rate of sGRBs is consistent with the rate of NS mergers. The jet structures explored are (i) a power-law (PL) energy dependence beyond the core, (ii) a Gaussian function in angle from the core, and (iii) a ‘cocoon’-like model which involves a quasi-isotropic weak component surrounding the jet’s core (see e.g. Ryan et al. 2019 and Beniamini et al. 2019 for the details of these jet structures). For each burst in the simulation, we sampled a random orientation of the jet relative to the line of sight (), and a distance , according to the volume of the local universe. The energy of the jet’s core is simulated according to the luminosity function of sGRBs from Wanderman & Piran (2015) and Ghirlanda et al. (2016) (case ). We convert the gamma-ray luminosity to gamma-ray energy assuming a typical rest frame duration s, . The observed energy is then computed according to the jet’s profile, and converted into a fluence using average spectral parameters for sGRBs (Lien et al., 2016). We estimate the fraction of sGRBs detectable by Swift by applying an approximate minimum detection threshold on the observed fluence erg/cm2 in the 15-150 keV band (from Figure 8 in Lien et al., 2014), which allows us to roughly estimate the beaming factor for each model. For each jet structure, the effective beaming factor is calculated as the ratio between the number of detected bursts and the total number of simulations ().
The results are tabulated in Table 2. We find that there are a variety of structured jet models consistent with : both a Gaussian profile and a power-law profile with slope fit the observations. Cocoon-like models require an efficient break-out, , in order to reproduce the observed rates. These conclusions are not particularly sensitive to the choice of luminosity function.
5 Conclusion
We examined the Swift database searching for low-luminosity sGRBs in the local Universe, analogous to GW170817/GRB170817A. Despite their close distance these events were not discovered before the advent of GW astronomy. We found that only a small fraction (5%) of Swift short GRBs could potentially be located within 200 Mpc, and that follow-up observations were not sufficient to constrain their nature. A combination of low number statistics and sub-optimal observing strategy could explain the lack of identification.
Assuming a local origin for this subsample of sGRBs, we find an all-sky (isotropic equivalent) rate density of . If all the binary NS mergers result in successful GRB jets, this rate implies a beaming factor to be consistent with the NS merger rate derived by the LIGO-Virgo collaboration. This result allows us to disfavor top-hat jet models and cocoon-like models with inefficient breakout. Different configurations of structured jet models (such as Gaussian or power-law models) are consistent with the observational constraints.
By using the upper limits placed in the optical band, we also provide constraints on the possible kilonova emission, and the allowed mass and velocity of the merger ejecta. A lanthanide-poor kilonova viewed towards the polar regions would have likely been detected by ground-based optical observations, but no strong constraints can be placed for off-axis events or lanthanide-rich kilonovae.
We cannot exclude the possibility that none of the reported candidates occurred within 200 Mpc. For typical sGRBs parameters and cosmological distances, the lack of X-ray afterglow could be explained by a tenuous environment. In this case, the upper limit on the rate of local events would be (90% confidence level). Given the rate of binary NS mergers predicted by LIGO, a minimum beaming factor of 10 would be consistent with no detection of local sGRBs by Swift.
An optimization of the follow-up strategies and a systematic search for untriggered bursts could be crucial to increase the detection rate of local events.
Acknowledgements
We thank Brad Cenko and Antonio Galvan-Gamez for the help with data analysis and the useful discussions. This work was supported in part by the National Aeronautics and Space Administration through grant NNX10AF62G issued through the Astrophysics Data Analysis Program. This work was performed in part at Aspen Center for Physics, which is supported by National Science Foundation grant PHY-1607611. The research of PB was funded by the Gordon and Betty Moore Foundation through Grant GBMF5076. This research uses services or data provided by the Science Data Archive at NOAO. NOAO is operated by the Association of Universities for Research in Astronomy (AURA), Inc. under a cooperative agreement with the National Science Foundation. This publication made use of data products supplied by the UK Swift Science Data Centre at the University of Leicester, and from the Wide-field Infrared Survey Explorer, which is a joint project of the University of California, Los Angeles, and the Jet Propulsion Laboratory/California Institute of Technology, funded by the National Aeronautics and Space Administration.
References
- Abadie et al. (2010) Abadie, J., Abbott, B. P., Abbott, R., et al. 2010, ApJ, 715, 1453.
- Abadie et al. (2012) Abadie, J., Abbott, B. P., Abbott, R., et al. 2012, ApJ, 760, 12.
- Abbott et al. (2017a) Abbott, B. P., Abbott, R., Abbott, T. D., et al. 2017, ApJ, 848, L13
- Abbott et al. (2017b) Abbott, B. P., Abbott, R., Abbott, T. D., et al. 2017, ApJ, 848, L12.
- Abbott et al. (2019) Abbott, B. P., Abbott, R., Abbott, T. D., et al. 2019, Physical Review X, 9, 031040.
- Bartos et al. (2019) Bartos, I., Lee, K. H., Corsi, A., Márka, Z., & Márka, S. 2019, MNRAS, 485, 4150
- Bauswein, Goriely, & Janka (2013) Bauswein, A., Goriely, S., & Janka, H.-T. 2013, ApJ, 773, 78.
- Becker (2015) Becker, A. 2015, Astrophysics Source Code Library, ascl:1504.004.
- Beniamini et al. (2015) Beniamini P., Nava L., Duran R. B., Piran T., 2015, MNRAS, 454, 1073
- Beniamini & van der Horst (2017) Beniamini P., van der Horst A. J., 2017, MNRAS, 472, 3161
- Beniamini & Nakar (2019) Beniamini, P., & Nakar, E. 2019, MNRAS, 482, 5430
- Beniamini et al. (2019) Beniamini P., Petropoulou M., Barniol Duran R., Giannios D., 2019, MNRAS, 483, 840
- Beniamini, et al. (2020) Beniamini P., Barniol Duran R., Petropoulou M., Giannios D., 2020, arXiv, arXiv:2001.00950
- Berger (2014) Berger, E. 2014, ARA&A, 52, 43
- Bianchi et al. (2017) Bianchi, L., Shiao, B., & Thilker, D. 2017, ApJS, 230, 24
- Blanton et al. (2017) Blanton, M. R., Bershady, M. A., Abolfathi, B., et al. 2017, AJ, 154, 28
- Breeveld et al. (2010) Breeveld, A. A., Curran, P. A., Hoversten, E. A., et al. 2010, MNRAS, 406, 1687.
- Bromberg et al. (2013) Bromberg, O., Nakar, E., Piran, T., & Sari, R. 2013, ApJ, 764, 179
- Burgess et al. (2017) Burgess, J. M., Greiner, J., Begue, D., et al. 2017, arXiv e-prints, arXiv:1710.05823
- Burrows et al. (2006) Burrows, D. N., Grupe, D., Capalbi, M., et al. 2006, ApJ, 653, 468.
- Chambers et al. (2016) Chambers, K. C., Magnier, E. A., Metcalfe, N., et al. 2016, arXiv e-prints, arXiv:1612.05560.
- Clark, et al. (2015) Clark J., et al., 2015, ApJ, 809, 53
- Coulter, et al. (2017) Coulter, D. A., Foley, R. J., Kilpatrick, C. D., et al. 2017, Science, 358, 1556.
- Coward et al. (2012) Coward, D. M., Howell, E. J., Piran, T., et al. 2012, MNRAS, 425, 2668
- Cummings & Palmer (2008) Cummings, J. R., & Palmer, D. M. 2008, GRB Coordinates Network, 7209, 1.
- Cummings et al. (2010) Cummings, J. R., Barthelmy, S. D., Fox, D. B., et al. 2010, GRB Coordinates Network, Circular Service, No. 10428, #1 (2010), 10428, 1
- Cummings et al. (2010) Cummings, J. R., Palmer, D. M., Barthelmy, S. D., et al. 2010, GRB Coordinates Network, 11436, 1.
- Cutri et al. (2013) Cutri, R. M., Wright, E. L., Conrow, T., et al. 2013, Explanatory Supplement to the AllWISE Data Release Products, 1.
- Dálya et al. (2018) Dálya, G., Galgóczi, G., Dobos, L., et al. 2018, MNRAS, 479, 2374
- D’Avanzo et al. (2018) D’Avanzo, P., Campana, S., Salafia, O. S., et al. 2018, A&A, 613, L1.
- Eichler et al. (1989) Eichler, D., Livio, M., Piran, T., & Schramm, D. N. 1989, Nature, 340, 126
- Evans et al. (2009) Evans, P. A., Beardmore, A. P., Page, K. L., et al. 2009, MNRAS, 397, 1177
- Fong & Berger (2013) Fong W., Berger E., 2013, ApJ, 776, 18
- Faber et al. (2006) Faber, J. A., Baumgarte, T. W., Shapiro, S. L., & Taniguchi, K. 2006, ApJ, 641, L93.
- Gao et al. (2013) Gao, H., Ding, X., Wu, X.-F., Zhang, B., & Dai, Z.-G. 2013, ApJ, 771, 86.
- Gehrels (1986) Gehrels, N. 1986, ApJ, 303, 336.
- Gehrels et al. (2004) Gehrels, N., Chincarini, G., Giommi, P., et al. 2004, ApJ, 611, 1005
- Gehrels et al. (2005) Gehrels, N., Sarazin, C. L., O’Brien, P. T., et al. 2005, Nature, 437, 851
- Gehrels et al. (2016) Gehrels, N., Cannizzo, J. K., Kanner, J., et al. 2016, ApJ, 820, 136.
- Ghirlanda et al. (2016) Ghirlanda G., et al., 2016, A&A, 594, A84
- Ghirlanda, et al. (2018) Ghirlanda G., et al., 2018, A&A, 609, A112
- Giacomazzo et al. (2013) Giacomazzo, B., Perna, R., Rezzolla, L., Troja, E., & Lazzati, D. 2013, ApJ, 762, L18
- Gompertz et al. (2018) Gompertz, B. P., Levan, A. J., Tanvir, N. R., et al. 2018, ApJ, 860, 62
- Granot & Sari (2002) Granot J., Sari R., 2002, ApJ, 568, 820
- Grossman et al. (2014) Grossman D., Korobkin O., Rosswog S., Piran T., 2014, MNRAS, 439, 757
- Gupte & Bartos (2018) Gupte N., Bartos I., 2018, arXiv, arXiv:1808.06238
- Hallinan et al. (2017) Hallinan, G., Corsi, A., Mooley, K. P., et al. 2017, Science, 358, 1579.
- Hook et al. (2004) Hook, I. M., Jørgensen, I., Allington-Smith, J. R., et al. 2004, PASP, 116, 425.
- Hotokezaka et al. (2013) Hotokezaka, K., Kiuchi, K., Kyutoku, K., et al. 2013, Phys. Rev. D, 87, 024001.
- Hotokezaka et al. (2018) Hotokezaka K., Beniamini P., Piran T., 2018, IJMPD, 27, 1842005
- Huchra et al. (2012) Huchra, J. P., Macri, L. M., Masters, K. L., et al. 2012, ApJS, 199, 26.
- Iglesias-Páramo et al. (2006) Iglesias-Páramo, J., Buat, V., Takeuchi, T. T., et al. 2006, ApJS, 164, 38
- Im, et al. (2017) Im M., et al., 2017, ApJL, 849, L16
- Jin et al. (2015) Jin, Z.-P., Li, X., Cano, Z., et al. 2015, ApJ, 811, L22
- Jin et al. (2018) Jin, Z.-P., Li, X., Wang, H., et al. 2018, ApJ, 857, 128.
- Jin et al. (2019) Jin, Z.-P., Covino, S., Liao, N.-H., et al. 2019, Nature Astronomy, 461.
- Kawaguchi et al. (2016) Kawaguchi, K., Kyutoku, K., Shibata, M., & Tanaka, M. 2016, ApJ, 825, 52
- Kisaka & Nakamura (2015) Kisaka, S., Ioka, K., & Nakamura, T. 2015, ApJ, 809, L8.
- Kouveliotou et al. (1993) Kouveliotou, C., Meegan, C. A., Fishman, G. J., et al. 1993, ApJ, 413, L101
- Lamb et al. (2019) Lamb, G. P., Lyman, J. D., Levan, A. J., et al. 2019, ApJ, 870, L15.
- Lamb et al. (2019) Lamb, G. P., Tanvir, N. R., Levan, A. J., et al. 2019, ApJ, 883, 48.
- Lebrun, et al. (2003) Lebrun F., et al., 2003, Astronomy and Astrophysics, 411, L141
- Levan et al. (2008) Levan, A. J., Tanvir, N. R., Jakobsson, P., et al. 2008, MNRAS, 384, 541
- Lien et al. (2016) Lien, A., Sakamoto, T., Barthelmy, S. D., et al. 2016, ApJ, 829, 7
- Lien et al. (2014) Lien, A., Sakamoto, T., Gehrels, N., et al. 2014, ApJ, 783, 24.
- Mandhai et al. (2018) Mandhai, S., Tanvir, N., Lamb, G., Levan, A., & Tsang, D. 2018, Galaxies, 6, 130
- Margutti, et al. (2018) Margutti R., et al., 2018, ApJL, 856, L18
- Marshall, et al. (2007) Marshall, F. E., Barthelmy, S. D., Brown, P. J., et al. 2007, GCN Report, 81, 1.
- Mészáros & Rees (1997) Mészáros P., Rees M. J., 1997, ApJ, 476, 232
- Metzger & Piro (2014) Metzger, B. D., & Piro, A. L. 2014, MNRAS, 439, 3916.
- Mooley et al. (2018) Mooley, K. P., Deller, A. T., Gottlieb, O., et al. 2018, Nature, 561, 355.
- Norris & Bonnell (2006) Norris, J. P., & Bonnell, J. T. 2006, ApJ, 643, 266.
- Oke et al. (1995) Oke, J. B., Cohen, J. G., Carr, M., et al. 1995, PASP, 107, 375.
- Parsons et al. (2005) Parsons, A., Sarazin, C., Barbier, L., et al. 2005, GRB Coordinates Network, 3935, 1.
- Perego et al. (2014) Perego, A., Rosswog, S., Cabezón, R. M., et al. 2014, MNRAS, 443, 3134.
- Perley et al. (2010) Perley, D. A., Meyers, J., Hsiao, E., et al. 2010, GRB Coordinates Network, Circular Service, No. 10429, #1 (2010), 10429, 1
- Planck Collaboration et al. (2018) Planck Collaboration, Aghanim, N., Akrami, Y., Ashdown, et al. 2018, arXiv e-prints, arXiv:1807.06209.
- Resmi et al. (2018) Resmi, L., Schulze, S., Ishwara-Chandra, C. H., et al. 2018, ApJ, 867, 57.
- Rezzolla et al. (2011) Rezzolla, L., Giacomazzo, B., Baiotti, L., et al. 2011, ApJ, 732, L6
- Roberts, et al. (2011) Roberts L. F., Kasen D., Lee W. H., Ramirez-Ruiz E., 2011, ApJL, 736, L21
- Roming et al. (2005) Roming, P. W. A., Kennedy, T. E., Mason, K. O., et al. 2005, Space Sci. Rev., 120, 95.
- Rossi et al. (2019) Rossi, A., Stratta, G., Maiorano, E., et al. 2019, arXiv e-prints, arXiv:1901.05792.
- Rosswog et al. (2003) Rosswog, S., Ramirez-Ruiz, E., & Davies, M. B. 2003, MNRAS, 345, 1077
- Rosswog (2005) Rosswog, S. 2005, ApJ, 634, 1202.
- Rowlinson et al. (2010) Rowlinson, A., Page, K., & Lyons, N. 2010, GRB Coordinates Network, Circular Service, No. 10435, #1 (2010), 10435, 1
- Ruffert & Janka (1999) Ruffert, M., & Janka, H.-T. 1999, A&A, 344, 573
- Ryan et al. (2019) Ryan, G., van Eerten, H., Piro, L., & Troja, E. 2019, arXiv e-prints, arXiv:1909.11691.
- Sari, et al. (1998) Sari R., Piran T., Narayan R., 1998, ApJ, 497, L17
- Sari & Esin (2001) Sari R., Esin A. A., 2001, ApJ, 548, 787
- Shibata & Taniguchi (2011) Shibata, M., & Taniguchi, K. 2011, Living Reviews in Relativity, 14, 6.
- Siegel & Ciolfi (2016) Siegel, D. M., & Ciolfi, R. 2016, ApJ, 819, 15.
- Sylos Labini (2011) Sylos Labini, F. 2011, Classical and Quantum Gravity, 28, 164003.
- Tanaka et al. (2014) Tanaka, M., Hotokezaka, K., Kyutoku, K., et al. 2014, ApJ, 780, 31
- Tanvir et al. (2005) Tanvir, N. R., Chapman, R., Levan, A. J., & Priddey, R. S. 2005, Nature, 438, 991
- The LIGO Scientific Collaboration et al. (2020) The LIGO Scientific Collaboration, the Virgo Collaboration, Abbott, B. P., Abbott, R., et al. 2020, arXiv e-prints, arXiv:2001.01761.
- Thoene et al. (2007) Thoene, C. C., Bloom, J. S., Butler, N. R., & Nugent, P. 2007, GRB Coordinates Network, 6756, 1
- Troja, et al. (2008) Troja, E., Cummings, J. R., Palmer, D. M., et al. 2008, GCN Report, 118, 1.
- Troja, et al. (2008) Troja, E., King, A. R., O’Brien, P. T., Lyons, N., & Cusumano, G. 2008, MNRAS, 385, L10.
- Troja, et al. (2010) Troja, E., Rosswog, S., & Gehrels, N. 2010, ApJ, 723, 1711.
- Troja et al. (2016) Troja, E., Sakamoto, T., Cenko, S. B., et al. 2016, The Astrophysical Journal, 827, 102.
- Troja et al. (2017) Troja, E., Piro, L., van Eerten, H., et al. 2017, Nature, 551, 71
- Troja et al. (2018a) Troja, E., Ryan, G., Piro, L., et al. 2018, Nature Communications, 9, 4089.
- Troja et al. (2018b) Troja, E., Piro, L., Ryan, G., et al. 2018, MNRAS, 478, L18.
- Troja et al. (2019) Troja, E., van Eerten, H., Ryan, G., et al. 2019, MNRAS, 489, 1919.
- Troja, et al. (2019) Troja, E., Castro-Tirado, A. J., Becerra González, J., et al. 2019, MNRAS, 489, 2104.
- Tunnicliffe, et al. (2014) Tunnicliffe R. L., et al., 2014, MNRAS, 437, 1495
- Wanderman & Piran (2015) Wanderman, D., & Piran, T. 2015, MNRAS, 448, 3026
- Wen et al. (2013) Wen, X.-Q., Wu, H., Zhu, Y.-N., et al. 2013, MNRAS, 433, 2946.
- Wollaeger et al. (2018) Wollaeger, R. T., Korobkin, O., Fontes, C. J., et al. 2018, MNRAS, 478, 3298.
- Xie & MacFadyen (2018) Xie, X., Zrake, J., & MacFadyen, A. 2018, ApJ, 863, 58.
- Yue et al. (2018) Yue, C., Hu, Q., Zhang, F.-W., et al. 2018, ApJ, 853, L10
- Zhang et al. (2018) Zhang, B.-B., Zhang, B., Sun, H., et al. 2018, Nature Communications, 9, 447
- Zou et al. (2009) Zou Y.-C., Fan Y.-Z., Piran T., 2009, MNRAS, 396, 1163