STAR Collaboration
Underlying event measurements in + collisions at GeV at RHIC
Abstract
Particle production sensitive to non-factorizable and non-perturbative processes that contribute to the underlying event associated with a high transverse momentum () jet in proton+proton collisions at =200 GeV is studied with the STAR detector. Each event is divided into three regions based on the azimuthal angle with respect to the highest- jet direction: in the leading jet direction (“Toward”), opposite to the leading jet (“Away”), and perpendicular to the leading jet (“Transverse”). In the Transverse region, the average charged particle density is found to be between 0.4 and 0.6 and the mean transverse momentum, , between 0.5-0.7 GeV/ for particles with 0.2 GeV/ at mid-pseudorapidity (1) and jet 15 GeV/. Both average particle density and depend weakly on the leading jet . Closer inspection of the Transverse region hints that contributions to the underlying event from initial- and final-state radiation are significantly smaller in these collisions than at the higher energies, up to 13 TeV, recorded at the LHC. Underlying event measurements associated with a high- jet will contribute to our understanding of QCD processes at hard and soft scales at RHIC energies, as well as provide constraints to modeling of underlying event dynamics.
pacs:
25.75.-q,13.75.Cs,13.85.-t,13.87.-aI Introduction
Understanding the underlying physics of hadronic collisions requires detailed characterization of the particle production processes. Proton+proton (+) collisions include elastic and inelastic scatterings, with inelastic + scatterings consisting of single diffractive, double diffractive and non-diffractive processes. In non-diffractive events, when a hard scattering occurs with large momentum transfer (2 GeV/) from the longitudinal to the transverse plane, other processes could occur in addition to the production of a high energy dijet. These additional processes include softer secondary hard scatterings or multiple parton interactions (MPI), gluon radiation or quark-antiquark splittings from the initial- or final-state partons of the primary hard scattering (ISR/FSR), and color reconnections with the beam-remnant partons (BR). Cumulatively, these result in what is referred to, in experiments, as the underlying event. The partons produced in these processes reduce their virtuality and finally fragment mainly into low-energy particles. The properties of the dijet produced in the initial hard scattering can be calculated by perturbative QCD, with good agreement between experimental measurements and theoretical calculations after careful correction for the underlying event activity Khachatryan et al. (2016); Aad et al. (2011a); Adam et al. (2019). Modeling the soft physics, which dominates the underlying event activity, is challenging since it does not factorize and requires non-perturbative calculations Skands (2010a, b). Experimental studies of the underlying event activity, spanning non-perturbative and perturbative QCD and including sensitivities to multi-scale physics, can help us to improve theoretical modeling and understand the QCD processes. Underlying event activity is often experimentally accessed through topological structure observables, such as particle production away from the primary hard scattering reference direction. The CDF collaboration used the highest- charged particle, leading jet, or Drell-Yan pair in each proton+antiproton event to define the hard scattering reference Aaltonen et al. (2015, 2010). At LHC energies, the ALICE, ATLAS, and CMS collaborations have used the highest- charged particle, charged jet, jet with both charged and neutral particles, or boson as the hard scattering references Khachatryan et al. (2015); Aaboud et al. (2017); Aad et al. (2014a); Abelev et al. (2012); Chatrchyan et al. (2012). In this analysis, we use the highest- jet as our hard scattering reference.
At TeV collision energy scales, the average mid-pseudorapidity charged multiplicity density and mean transverse momentum, both sensitive to the underlying event activity, were observed to be positively correlated with observables sensitive to the hard scattering energy Aaltonen et al. (2010); Khachatryan et al. (2015); Aaboud et al. (2017); Aad et al. (2014a); Abelev et al. (2012); Chatrchyan et al. (2012). These positive correlations are understood as resulting from increasing contributions from wide angle ISR/FSR, as the transferred momentum scale, Q2, of the hard scattering increases. However, at forward rapidity, CMS found that the relationship between underlying event particle production and leading jet depends on collision energy Chatrchyan et al. (2013): at = 0.9 TeV, the underlying event particle production activity and leading jet were negatively correlated, while at 7 TeV they were mostly positively correlated for leading charged jets with 115 GeV/. The negative correlations reported at the lower collision energy could be due to energy conservation constraining the underlying event production. For these reasons, it is worth exploring the underlying event at RHIC with even lower energies to search for its relationship with the leading jet energy at mid-pseudorapidity.
II Experiment and Data Analysis
In this paper, we report measurements of underlying event activity in + collisions at = 200 GeV by the STAR experiment at RHIC. The data used in this analysis were collected in 2012 with an integrated luminosity of 23 pb-1. The major subsystems used for the analysis were the Time Projection Chamber (TPC) Anderson et al. (2003), and the Barrel Electromagnetic Calorimeter (BEMC) Beddo et al. (2003). The TPC provides charged particle tracking with good momentum resolution, while the 4800 isolated towers of the BEMC record the energy deposited by photons, electrons, , and mesons. Both cover mid-pseudorapidity (1) with full azimuthal angle () coverage.
This analysis used both a minimum bias and a calorimeter-triggered dataset. The minimum bias data required a coincidence of signals from the Vertex Position Detectors Llope et al. (2014), which measure photons from decays at forward and backward pseudorapidity, 4.25.1. The calorimeter jet-patch triggered data required a minimum transverse energy () in a region of of the BEMC. In this analysis, three trigger thresholds were used: 3.5, 5.4, and 7.3 GeV. Jets reconstructed from the calorimeter-triggered dataset are therefore biased towards higher neutral energy fractions Adamczyk et al. (2015). Corrections for this electromagnetic calorimeter-trigger bias are determined via a data-driven technique using the minimum bias data, and only the corrected calorimeter-triggered data are reported in the final results. Event-level and particle-level selections were applied to the recorded data. The events were required to have a reconstructed primary event vertex, , within 30 cm of the center of the TPC along the beam axis () in order to ensure nearly uniform detector acceptance. Events containing a charged particle with 20 GeV/ were discarded to avoid events with low tracking momentum reconstruction resolution. Events with deposited energy in a single BEMC tower of 20 GeV were also discarded for symmetry. The charged particle tracks reconstructed in the TPC were required to satisfy the following conditions: 0.220 GeV/ for high tracking efficiency; a distance of closest approach (dca) to the event vertex of 1 cm to ensure particles are from the primary collision vertex; a number of fit points along the track greater than 20 out of a maximum of 45; and a ratio of the number of fit points to the maximum number of possible fit points larger than 0.52 for good primary track reconstruction Anderson et al. (2003); Abelev et al. (2009). The neutral energy deposits in each BEMC tower were required to have 0.220 GeV. For the particles used in this paper, the pseudorapidity region was restricted to 1.
The simulation sample used for detector response and background correction in this analysis was generated using PYTHIA 6.4.28 Sjostrand et al. (2006) with the CTEQ6L1 PDF Pumplin et al. (2002) and the Perugia 2012 tune Skands (2010a) with the PARP(90) parameter changed to 0.213, which is, throughout this article, referred to as PYTHIA 6 (STAR) Adam et al. (2019). PYTHIA 6 (STAR) is tuned with STAR published minimum bias identified particle spectra Adams et al. (2005); Agakishiev et al. (2012) resulting in agreement with the inclusive identified charged pion cross-sections at the 10% level Adkins (2017). The PYTHIA parameter PARP(90) is related to the energy scaling of the minimum bias and underlying event phenomena Skands (2010a). PYTHIA 6 (STAR) generated events are processed through the STAR GEANT3 Brun et al. (1987) detector simulation with , , and decays and weak decays handled by GEANT and set as stable in PYTHIA . The simulated GEANT output events were further embedded into zero bias (randomly triggered) experimental data. This embedding procedure simulates a similar background, such as pile-up, beam-gas interactions and cosmic rays, as exists for the experimental measurements Adamczyk et al. (2015). The default PYTHIA 6.4.28 Perugia 2012 tune with the CTEQ6L1 PDF, and the default PYTHIA 8.215 Monash 2013 tune Skands et al. (2014) simulations were also used for comparison with corrected data, later referred to as PYTHIA 6 and PYTHIA 8, respectively.
All charged tracks with 0.2 GeV/ and all BEMC towers with deposited 0.2 GeV, within 1 were used to reconstruct jets. Jet reconstruction used the anti- algorithm Cacciari et al. (2008) with a resolution parameter =0.6 as implemented in the FastJet package Cacciari et al. (2012). The reconstructed jets were restricted to 0.4 to ensure that all tracks/neutral energy deposits of the jets were inside our detector acceptance. The jet neutral energy fraction Adamczyk et al. (2015) was required to be less than 90% to minimize non-collision backgrounds such as beam-gas interactions and cosmic rays. Jet axes were further required to be within =0.6 distance from the jet-patch center for calorimeter-triggered data Adamczyk et al. (2015). The reported jet energies include contributions from the underlying event and are corrected for detector effects including pile-up via the unfolding procedure described below.
The analysis followed the CDF topological structure method Aaltonen et al. (2015). For each collision event, the leading, highest , jet azimuthal angle () is defined as the reference angle. The reconstructed charged particles are then categorized into different regions by the relative difference of their azimuthal angle () to the jet’s reference angle, . The “Toward” region contains particles with 60∘, while the “Away” region, which is not required to contain a reconstructed jet, is defined as those particles with -18060∘. Finally, the “Transverse” region covers 60o. The activity in each region is integrated over 1, which is inside of the TPC acceptance. The underlying event activity is then accessed through the integrated Transverse region and reported for charged tracks only. The average charged particle multiplicity density, , and the mean transverse momentum, , are studied as a function of the leading jet .
Each event has two Transverse regions, 60∘120∘ and -120∘-60∘. For each event, the Transverse region with larger charged multiplicity density was defined as “TransMax”, and the other as “TransMin”. This binning procedure will cause the results to differ, even if the TransMax and TransMin distributions originate from the same parent distribution, due to region-to-region statistical fluctuations. Since the MPI and BR processes are potentially unrelated to the hard scattering jet angle, both processes make comparable contributions to both the TransMax and TransMin regions. However, ISR/FSR may produce a wide angle third jet, the fragmentation particles of which have a high probability of being recorded in only one of the Transverse regions. ISR/FSR can therefore also result in a significant difference in the two regions’ multiplicity densities. Comparisons of TransMax and TransMin regions may therefore reveal details of the various processes contributing to the underlying event. The TransMin region is sensitive to particle production from BR and MPI, while the TransMax region also contains signal from ISR/FSR.
The measured data were corrected for trigger bias, detector inefficiency, cosmic-ray background, and pile-up effects. The trigger bias was corrected for by weighting calorimeter-triggered data to have the same jet neutral fraction distribution as minimum bias data. The trigger bias corrections were dependent and were less than 15% for the multiplicity density results and less than 20% for .
The calorimeter-triggered data were then unfolded using a detailed simulation of the trigger to correct for inefficiencies as a function of jet . Differences to the previously mentioned bias-corrected result were accounted for as part of the systematic uncertainty estimate. The detector inefficiency, resolution effects, and background corrections were performed using 2-dimensional Bayesian unfolding Adye (2011). The response matrices were constructed from matched generator-level and detector-level observables Adamczyk et al. (2017). The generator-level is from PYTHIA 6 (STAR) and the detector-level is from the embedded sample to include the backgrounds to the signal, such as the pile-up contribution. A jet pair was considered matched if the distance of a leading jet at the detector-level to a leading or sub-leading jet at the generator-level was less than the jet resolution parameter, =0.6. When there was a match, the leading jet at the generator-level was used to create the response matrices. For the track level observable , a matched track pair was also required. The track pair is considered matched when more than ten hits are matched Abelev et al. (2009). The embedding sample had the same track and jet quality requirements applied as the experimental data which included requiring the particle 0.2 GeV/, 1 and leading jet 0.4.
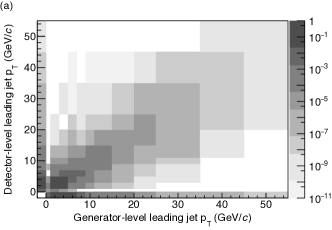
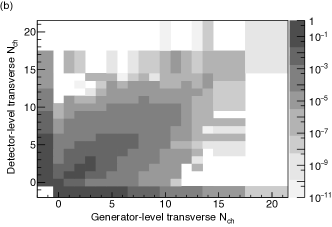
Figure 1 shows 2-dimensional projections of the 4-dimensional response matrix. Panel (a) is the projection onto the leading jet and panel (b) is the Transverse charged multiplicity integrated over the leading jet . The negative bins represent the probability for no match to be identified for the concerned variable. Although the two figures exhibit a fairly linear correlation between the detector-level and generator-level variables, their correlations are smeared. To ensure closure of the unfolding correction procedure, the simulation data were divided into two subsets, one was used for training and one for the unfolding closure test. This successful closure test also demonstrated that the uncertainty due to the response matrices is negligible. The unfolding method uncertainty was estimated by varying the Bayesian iterations (with 4 as the default), the unfolding prior, and the maximum tower energy cut of 20 GeV. The effects on the unfolded results due to the uncertainty on the TPC tracking efficiency of 4% and the BEMC tower energy calibration uncertainty of 4% were also estimated. For both cases the response matrices were recalculated after varying the simulations by the appropriate uncertainty and the data unfolded with the new matrix. The systematic errors obtained from these variations were added quadratically with the unfolding uncertainty to form the total systematic uncertainty. The total correction uncertainties were found to be less than 15%.
III Results and Discussion
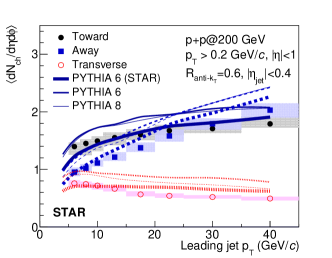
Figure 2 shows the fully corrected average charged particle multiplicity densities for particles with 0.2 GeV and 1 as a function of the leading jet . In this and the following figures, data points are placed at the center of each bin. The statistical uncertainties are shown as vertical bars, which are smaller than the data symbols. The box heights are systematic uncertainties, while their widths correspond to the bin sizes. The Toward and Away average multiplicity densities, , both show a rise with leading jet . For the Transverse region, tends to slightly decrease as the leading jet increases. In contrast, at LHC energies the mid-pseudorapidity transverse multiplicity was observed to quickly increase and then saturate or slightly increase with increasing leading jet/track Khachatryan et al. (2015); Aaboud et al. (2017). PYTHIA 6 (STAR), PYTHIA 6 default Perugia 2012 and PYTHIA 8 default Monash 2013 simulations are also shown as curves with widths from widest to thinnest, respectively. Deviations for all the simulations from data for jet 15 GeV are observed in the Transverse region, with PYTHIA 6 (STAR), which was tuned with STAR published minimum bias spectra, closest to the measured results. However, while the agreement between data and PYTHIA 6 (STAR) is reasonable, additional improvements to the tuning or modeling itself would still be appropriate at RHIC energies.

To allow comparison with results obtained at facilities with higher collision energies, analyses for particle 0.5 GeV/ were also performed. Figure 3 compares the fully corrected in the Transverse region as a function of the leading jet for particle 0.2 GeV/ and 0.5 GeV/. Similar trends are observed for these two cases, with mismatch between data and PYTHIA.
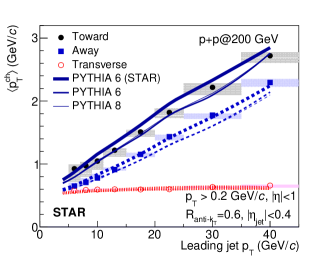
The was measured to further profile the characteristics of the underlying event. Figure 4 shows the fully corrected charged particle as a function of the leading jet for the three regions, with particle 0.2 GeV/. The Transverse region slightly increases as the leading jet increases. Both the Toward and Away regions show linearly increasing trends. PYTHIA simulations, shown as curves, provide a better description of the measurements than the average multiplicity density.
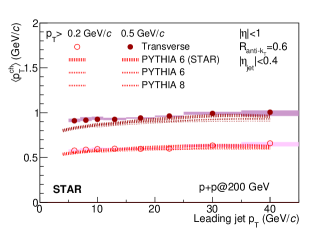
Figure 5 shows the fully corrected transverse region charged particle as a function of the leading jet for 0.2 GeV/ and 0.5 GeV/. Similar trends are observed for these two cases.
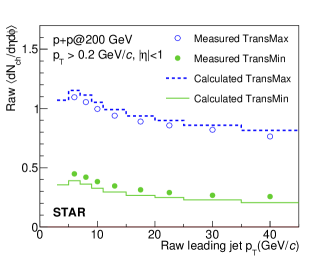
Figure 6 shows the uncorrected detector-level TransMax and TransMin average charged particle multiplicity densities as a function of the leading jet . At = 200 GeV, we observe that while the multiplicity densities in the TransMax and TransMin regions have different overall magnitudes, they both exhibit slightly decreasing trends with increasing leading jet pT with the difference in the densities staying roughly constant. Meanwhile, experiments at the LHC have reported an increasing difference in the charged particle multiplicities of these regions with increasing leading trigger Khachatryan et al. (2015); Aaboud et al. (2017). Increasing contributions to the TransMax region from wide angle third-jet production via ISR/FSR is understood as the main physical cause of the LHC results. To further investigate our results, we tested the hypothesis that the TransMax and TransMin charged particle density distributions are drawn, statistically independently, from the same parent probability distribution, . In such a case the probability distribution functions for the measured charged particle multiplicities in the TransMax and TransMin regions, and respectively, can be expressed as and , where is the cumulative distribution of .
The calculated averages of and as a function of leading jet pT are shown as curves in Fig. 6, when is taken as the average of the measured TransMax and TransMin distributions.
These calculated distributions account for most of the features of the measured data, suggesting any net contribution from additional physical sources is small. Detector-level variables were compared here to avoid the impact of additional fluctuations from the unfolding procedure, with the caveat that any detector response asymmetries could enlarge the TransMax and TransMin difference at the detector-level. This suggests that there are less ISR/FSR contributions to + events at RHIC energies than at LHC energies.
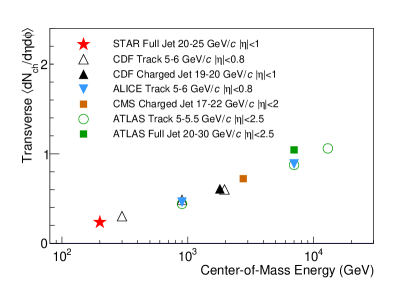
Besides the underlying event activity’s dependence on the hard scattering reference energy scale, studying the collision energy dependence also contributes to our understanding of how to model these low momentum processes. Detailed underlying event measurements have been reported at a variety of collision energies, which makes it possible to study the energy scaling of the underlying event phenomena, including a possible collision energy dependence of the transverse momentum cut-off between hard and soft scatterings De Roeck and Jung (2005). A world-data comparison with our RHIC measurements is done with jets or charged particles as the hard scattering reference to avoid any possible complexity that different hard references may introduce to the underlying event activity. Since the underlying event multiplicities at the Tevatron and LHC energies show the same general trend of a rapid rise with reference pT before reaching a plateau Khachatryan et al. (2015), comparison points were chosen from the region where the plateau is just reached. An exception is the ATLAS full jet measurement at 7 TeV, where the general trend of the underlying event is not observed due to limited kinematic reach at lower . In this case, the lowest data point was chosen for comparison Aad et al. (2014b). Figure 7 shows the collision energy dependence of the charged particle density extracted for these Transverse regions and Table 1 details the beam energy, trigger type and range, and Transverse region’s coverage for each experiment. Note all the reported results use charged particles with 0.5 GeV/ to measure the underlying event (UE) activity and that the LHC and STAR results are from + collisions while those of CDF are from + events.
A near-linear increase with the log of the collision energy is observed in Fig. 7, despite the different references and pseudorapidity coverage for the various measurements. It has been shown in Skands (2010a) (for example), that it remains unclear how to model correctly the collision energy scaling of the + data; a tension emerges when trying to simulate minimum bias and high multiplicity data with the same tune. This study of the collision energy dependence of the underlying event’s average charged particle density provides additional information that may aid in resolving this tension.
| Collab. | (GeV) | Trigger Type | Trigger Range (GeV/) | UE Range |
|---|---|---|---|---|
| STAR | 200 | Full Jet =0.6 | 2025 | 1 |
| CDF Aaltonen et al. (2015) | 300 | Charged particle | 56 | 0.8 |
| CDF Aaltonen et al. (2015) | 900 | Charged particle | 5 | 0.8 |
| CDF Aaltonen et al. (2015) | 1960 | Charged particle | 56 | 0.8 |
| CDF Affolder et al. (2002) | 1800 | Charged Jet =0.7 | 1920 | 1 |
| ATLAS Aad et al. (2011b) | 900 | Charged particle | 55.5 | 2.5 |
| ATLAS Aad et al. (2011b) | 7000 | Charged particle | 55.5 | 2.5 |
| ATLAS Aaboud et al. (2017) | 13000 | Charged particle | 55.5 | 2.5 |
| ATLAS Aad et al. (2014b) | 7000 | Full Jet =0.4 | 2030 | 2.5 |
| ALICE Abelev et al. (2012) | 900 | Charged particle | 56 | 0.8 |
| ALICE Abelev et al. (2012) | 7000 | Charged particle | 56 | 0.8 |
| CMS Khachatryan et al. (2015) | 2760 | Charged jet =0.5 | 1722 | 2 |
IV Summary
We have reported several observables sensitive to the underlying event activity in + collisions at = 200 GeV as recorded by the STAR experiment. The results used full jets reconstructed at mid-pseudorapidity 0.4 with =0.6 and 545 GeV/. The charged particles used for the underlying event measurements were required to have 1, 0.220 GeV/, and . The reported observables were corrected to the generator-level to enable direct comparison with theoretical calculations. The detector response corrections were performed via a data-driven trigger correction and embedded PYTHIA 6 (STAR)+GEANT simulations into zero-bias experimental data. The uncertainties from the detector response corrections are included in the systematic uncertainties.
The corrected observables were reported for three topological regions, Toward, Away, and Transverse, based on the azimuthal angle of the particles relative to that of the highest jet. The average charged particle multiplicity densities and their mean transverse momenta in these regions were studied as functions of the leading jet . These correlations characterize the relationship between the underlying event activity and a hard scattering in + collisions. The Transverse charged particle density was observed to slightly decrease with the leading jet , while the Transverse slightly increases with the leading jet . The slight negative correlation of is consistent with energy conservation restricting particle production in the Transverse region as the leading jet becomes more energetic.
The Transverse regions were further split into TransMax and TransMin areas. The observation of similar charged particle production in the TransMax and TransMin regions at RHIC, which is not observed at the LHC, suggests that ISR/FSR contributes less to the underlying event at = 200 GeV than at TeV collision energies. The results reported here are therefore predominantly sensitive to soft MPI and beam-remnant activity.
An energy dependence study of the Transverse region charged particle density shows a near-linear increase with the log of the collision energy, which contributes to the understanding of the energy scaling of the underlying event dynamics. These underlying event activity measurements, in combination with the previously reported minimum bias observables Adams et al. (2005); Agakishiev et al. (2012), provide valuable input and constraints to the predominantly phenomenological modeling in Monte Carlo event generators of the low-momentum QCD processes in + collisions.
We thank the RHIC Operations Group and RCF at BNL, the NERSC Center at LBNL, and the Open Science Grid consortium for providing resources and support. This work was supported in part by the Office of Nuclear Physics within the U.S. DOE Office of Science, the U.S. National Science Foundation, the Ministry of Education and Science of the Russian Federation, National Natural Science Foundation of China, Chinese Academy of Science, the Ministry of Science and Technology of China and the Chinese Ministry of Education, the National Research Foundation of Korea, Czech Science Foundation and Ministry of Education, Youth and Sports of the Czech Republic, Hungarian National Research, Development and Innovation Office, New National Excellency Programme of the Hungarian Ministry of Human Capacities, Department of Atomic Energy and Department of Science and Technology of the Government of India, the National Science Centre of Poland, the Ministry of Science, Education and Sports of the Republic of Croatia, RosAtom of Russia and German Bundesministerium fur Bildung, Wissenschaft, Forschung and Technologie (BMBF) and the Helmholtz Association.
References
- Khachatryan et al. (2016) V. Khachatryan et al. (CMS Collaboration), The European Physical Journal C 76, 265 (2016).
- Aad et al. (2011a) G. Aad et al. (ATLAS Collaboration), The European Physical Journal C 71, 1795 (2011a).
- Adam et al. (2019) J. Adam et al. (STAR Collaboration), Physical Review D 100, 052005 (2019), arXiv:1906.02740 [hep-ex] .
- Skands (2010a) P. Z. Skands, Phys. Rev. D82, 074018 (2010a), arXiv:1005.3457 [hep-ph] .
- Skands (2010b) P. Z. Skands, “Tuning Monte Carlo Generators: The Perugia Tunes,” (2010b), arXiv:1005.3457v5 [hep-ph] .
- Aaltonen et al. (2015) T. Aaltonen et al. (CDF Collaboration), Physical Review D 92, 092009 (2015).
- Aaltonen et al. (2010) T. Aaltonen et al. (CDF Collaboration), Physical Review D 82, 034001 (2010).
- Khachatryan et al. (2015) V. Khachatryan et al. (CMS Collaboration), Journal of High Energy Physics 09, 137 (2015).
- Aaboud et al. (2017) M. Aaboud et al. (ATLAS Collaboration), Journal of High Energy Physics 03, 157 (2017).
- Aad et al. (2014a) G. Aad et al. (ATLAS Collaboration), The European Physical Journal C 74, 3195 (2014a).
- Abelev et al. (2012) B. Abelev et al. (ALICE), JHEP 07, 116 (2012), arXiv:1112.2082 [hep-ex] .
- Chatrchyan et al. (2012) S. Chatrchyan et al. (CMS Collaboration), The European Physical Journal C 72, 2080 (2012).
- Chatrchyan et al. (2013) S. Chatrchyan et al. (CMS Collaboration), Journal of High Energy Physics 04, 072 (2013).
- Anderson et al. (2003) M. Anderson et al., Nuclear Instruments and Methods in Physics Research Section A 499, 659 (2003), arXiv:nucl-ex/0301015 [nucl-ex] .
- Beddo et al. (2003) M. Beddo et al., Nuclear Instruments and Methods in Physics Research Section A 499, 725 (2003).
- Llope et al. (2014) W. J. Llope et al., Nuclear Instruments and Methods in Physics Research Section A: Accelerators, Spectrometers, Detectors and Associated Equipment 759, 23 (2014), arXiv:1403.6855 [physics.ins-det] .
- Adamczyk et al. (2015) L. Adamczyk et al. (STAR Collaboration), Physical Review Letters 115, 092002 (2015).
- Abelev et al. (2009) B. Abelev et al. (STAR Collaboration), Physical Review C 79, 034909 (2009), arXiv:0808.2041 [nucl-ex] .
- Sjostrand et al. (2006) T. Sjostrand, S. Mrenna, and P. Z. Skands, Journal of High Energy Physics 05, 026 (2006), arXiv:hep-ph/0603175 [hep-ph] .
- Pumplin et al. (2002) J. Pumplin, D. R. Stump, J. Huston, H. L. Lai, P. M. Nadolsky, and W. K. Tung, Journal of High Energy Physics 07, 012 (2002), arXiv:hep-ph/0201195 [hep-ph] .
- Adams et al. (2005) J. Adams et al. (STAR Collaboration), Physics Letters B 616, 8 (2005).
- Agakishiev et al. (2012) G. Agakishiev et al. (STAR Collaboration), Physical Review Letters 108, 072302 (2012).
- Adkins (2017) J. K. Adkins, Studying Transverse Momentum Dependent Distributions in Polarized Proton Collisions Via Azimuthal Single Spin Asymmetries of Charged Pions in Jets, Ph.D. thesis, University of Kentucky (2017), arXiv:1907.11233 [hep-ex] .
- Brun et al. (1987) R. Brun, F. Bruyant, M. Maire, A. C. McPherson, and P. Zanarini, CERN-DD-EE-84-1 (1987).
- Skands et al. (2014) P. Skands, S. Carrazza, and J. Rojo, The European Physical Journal C 74, 3024 (2014).
- Cacciari et al. (2008) M. Cacciari, G. P. Salam, and G. Soyez, Journal of High Energy Physics 04, 063 (2008).
- Cacciari et al. (2012) M. Cacciari, G. P. Salam, and G. Soyez, The European Physical Journal C 72, 1896 (2012).
- Adye (2011) T. Adye, in Proceedings, PHYSTAT 2011 Workshop on Statistical Issues Related to Discovery Claims in Search Experiments and Unfolding, CERN,Geneva, Switzerland 17-20 January 2011, CERN (CERN, Geneva, 2011) pp. 313–318, arXiv:1105.1160 [physics.data-an] .
- Adamczyk et al. (2017) L. Adamczyk et al. (STAR Collaboration), Physical Review D 95, 071103 (2017), arXiv:1610.06616 [hep-ex] .
- De Roeck and Jung (2005) A. De Roeck and H. Jung, eds., HERA and the LHC: A Workshop on the implications of HERA for LHC physics: Proceedings Part A, CERN (CERN, Geneva, 2005) arXiv:hep-ph/0601012 [hep-ph] .
- Aad et al. (2014b) G. Aad et al. (ATLAS Collaboration), The European Physical Journal C 74, 2965 (2014b).
- Affolder et al. (2002) T. Affolder et al. (CDF Collaboration), Physical Review D 65, 092002 (2002).
- Aad et al. (2011b) G. Aad et al. (ATLAS Collaboration), Physical Review D 83, 112001 (2011b).