Efficient Identifying the Orientation of Single NV Centers in Diamond and Using them to Detect Near Field Microwave
Abstract
Arrays of NV centers in the diamond have the potential in the fields of chip-scale quantum information processing and nanoscale quantum sensing. However, determining their orientations one by one is resource intensive and time consuming. Here, in this paper, by combining scanning confocal fluorescence images and optical detected magnetic resonance, we realized a method of identifying single NV centers with the same orientation, which is practicable and high efficiency. In the proof of principle experiment, five single NV centers with the same orientation in a NV center array were identified. After that, using the five single NV centers, microwave near field generated by a -diameter Cu antenna was also measured by reading the fluourescence intensity change and Rabi frequency at different microwave source power. The gradient of near field microwave at sub-microscale can be resoluted by using arry of NV centers in our work. This work promotes the quantum sensing using arrays of NV centers.
Nitrogen-vacancy(NV) centers are paramagnetic defects within the diamond lattice, which consist of a substitutional N imputiry adjacent to a vacant lattice site. Owing to their outstanding optical and spin properties at room temperature, NV centers have attracted more and more attentions in the fields of nanoscale quantum sensing and quantum information processing.Degen, Reinhard, and Cappellaro (2017); Maze et al. (2008); Ariyaratne et al. (2018); Maurer et al. (2012); Bradley et al. (2019); Zaiser et al. (2016) Especially in the fields of quantum sensing, due to the fact that the NV center can be stablely located colse to the diamond surface at nanoscale or nanodiamonds,Osipov et al. (2019); Song et al. (2013); Maletinsky et al. (2012); Ofori-Okai et al. (2012) the spatial resolution of the sensors based on NV centers have down to nanoscale.Hall et al. (2009); Ariyaratne et al. (2018); Kucsko et al. (2013); Schmitt et al. (2017) This nanoscale property is quite important in the fields of condense matter physics and biology research.Casola, Sar, and Yacoby (2018); Wu et al. (2016); Shi et al. (2018); Lillie et al. (2019) Recently, some groups reported that the near field microwave(MW) sensing using NV centers in diamond have down to micro even nanoscale resolutions.Wang et al. (2015a); Appel et al. (2015); Shao et al. (2016); Dong et al. (2018); Horsley et al. (2018); Mariani et al. (2018); Chipaux et al. (2015)
Precise detecting of the spatial distribution of the MW near field is crucial for developing new types of MW devices, chip failure checking, electromagnetic compatibility analyzing and even solid state physics studying.Wallraff et al. (2004) Generally speaking, the spatial resolution of the traditional dipole probe is limited to about . Even worse, during the MW measuring process, the dipole probe will reconstruct the electromagnetic field, which can disturb the near field detection.Holloway et al. (2014) In recent years, new sensors based on alkali vapor cell, superconductor and spin-torque diode have been developed to detect the near field MW with high sensitivity.Fang et al. (2016); Couëdo et al. (2019); Fan et al. (2015) However, none of them obtained nanoscale spatial resolution. The development of near field MW sensors based on NV center will bring an ultimate solution to this problem.
As shown in the right section of Fig. 1, the ground state of electron spin of the NV center is a spin triplet with a zero field splitting of . The oscillation between and ground states can be driven by a resonant MW magnetic field as , where is a static magnetic field along the axis of NV center, is the gyromagnetic ratio of the electron spin. The MW magnetic field is written as , where is the MW frequency. By carrying out the optical detected magnetic resonant (ODMR), the resonant frequency of the MW field can be obtained. By adding static magnetic field , can be further splitted, which varies the resonant MW field frequency from kHz to sub-THz.Aslam et al. (2015) Additionally, the Rabi frequency of the spin state oscillation is proportional to the component of the MW field in a plane perpendicular to the NV axis as . At last, by using NV centres at the four different axes, the total amplitude and the orientation of the vector can be obtained by mearsuring different . By doing this, nonivasive detecting of near field MW magnetic field at nanoscale resolution obtained.Wang et al. (2015a); Appel et al. (2015)
Traditionally, to measure field at nanoscale resolution, scanning should be carried out by combining the NV sensors with AFM tip, which is highly requirement in practice.Appel et al. (2015); Maletinsky et al. (2012); Degen (2008) Alternatively, by measuring field using NV centers at different sites, NV center arrays in the diamond have the potential in the fields nanoscale quantum sensing.Momenzadeh et al. (2015); Wang et al. (2015b); Fukami et al. (2019) Howerer, determining their orientations one by one is resource intensive and time consuming. In this work, using shallow NV center arrays in diamond, a method by combining scanning confocal fluorescence image and optical detected magnetic resonance was developed to efficiently identify the NV centers with same orientation. The relative MW amplitude distribution is obtained by measuring the fluorescence intensity and the Rabi oscillation of the single NV center at different sites of the arrays. The spatial resolution of near field MW sensors based on array of NV centers in this work is hundreds of nanometers which consists with the optical microscope.

The sample used in this work was a high-quality electronic grade diamond with natural isotopic concentration of (1.1%) from Element Six. The NV center array was prepared by implanting molecules with a fluence of . The implantation angle is through diameter apertures which were patterned using electron beam lithography in a 300-nm-thick polymethyl methacrylate (PMMA) layer deposited on the diamond surface.Feng et al. (2016); Wang et al. (2015b); Toyli et al. (2010) After implantation, the sample was annealed at in a vacuum at to induce vacancy diffusion to form NV centers. According to SRIM simulation of the stopping of nitrogen ions in diamond chip, the most probable stopping position of the implanted nitrogen ions was below the diamond surface.Ziegler, Ziegler, and Biersack (2010) After paperation of the NV center arrays, the diamond sample was placed in the set-up shown in Fig.1. The scanning confocal fluorescence image of the NV center array with a region was shown in Fig. 2(a). The fluence of the molecules and the size of the apertures used during the implantation ensure that most of the bright pots in the arrays was single NV center, which consistents with the ODMR experiments. It should be noted that due to the low enengy of the implanting ions, creation of the NV centers were unsuccessful in some sites.
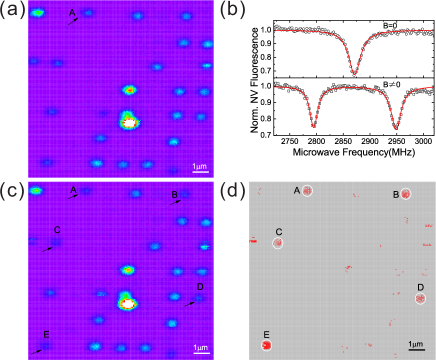
Then, by combining scanning confocal fluorescence image and optical detected magnetic resonance, we realized a method which can fast identify single NV centers with the same orientation, so called scanning optical detected magnetic resonance (SODMR) method. By sweeping the MW frequency using the -diameter Cu antenna under continuous green laser exciation, the ODMR of a single NV center that randomly selected ( pointed by an black arrow in Fig. 2(a)) under zero magnetic field was measured. The dip of the ODMR spectrum (Fig. 2(b)) located at corresponds to the transition between and states. After that, a static magnetic field generated by an electromagnet was applied to the NV center to further split the states. At this condition, as shown in lower spectrum of Fig. 2(b), the two dips located at and correspond to the transitons of and respectively. As the resonance frequency of the A-point is known, the NV centers with the same orientation can be identified immediately by our SODMR method introduced here. By applying continues MW exciation at (), the scanning confocal fluorescence image of the same region of Fig. 2(a) was recorded again. The dramatically decreased fluorescence intensity of the A-point in Fig. 2(c) confirmed that magnetic resonance occured during scanning counting of the fluorescence of A. As same as A, the fluorescence intensity of the other four single NV centers marked as B,C,D and E, which have the same orientation as A, also decreased. As a comparison, the fluorescence intensity of the other NV centers, which have different orientation with A, showed litte change. To further improve the efficiency of identifying of the NV centers with the same orientation, the contrast diagram of the fluorescence intensity was normalization as , where (Fig. 2(c)) was the fluorescence of NV centers under microwave radiation and (Fig. 2(a)) was that of without MW. As shown in Fig. 2(d), five of the single NV centers with the same orientation obviously displayed. The method of identifying of the single NV centers with the same orientation introduced here is more efficiency for arrays with a mass of NV centers.Toyli et al. (2010); Hausmann et al. (2011)
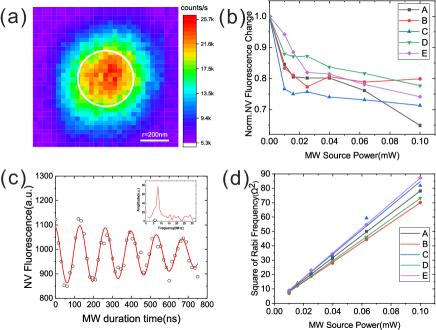
As has been reported, the MW power influences the contrast of the ODMR spectrum.Jensen et al. (2013); Dréau et al. (2011) Therefore, on the condition of resonance, the power of MW near field can be indirectly read out by measuring the fluorescence intensity change of the NV centers.Appel et al. (2015); Yang et al. (2019) Utilizing the five NV centers with the same orientation identified above, the relative component of the MW field amplitude in a plane perpendicular to the NV axis was studied by measuring the fluorescence intensity and Rabi oscillation frequency . Fig. 3(a) shows the scanning confocal fluorescence image of single NV center at MW power of . The corresponding fluorescence intensity was obtained by sum the total counts within a circle around the center of fluorescence spot with a radius of . Fig. 3(c) shows an example of the Rabi oscillation, and the Rabi frequency was obtained by carrying out the FFT of the data(insert in Fig. 3(c). The measured projected fluorescence intensity and square of Rabi frequency() versus MW source power were shown in Fig. 3(b) and Fig. 3(d) respectively. From Fig. 3(b) we can see that, with the increasing of the MW source power from to , the NV fluourescence intensity sharply decreased. From to , the fluourescence intensity drecreased steadly, indicating that a saturation effect exists under strong MW source power.Dréau et al. (2011) This result demonstrated that the method of measuring the relative MW intensity by reading the NV fluourescence intensity change is more faithful under weaker MW power excitation. Additionally, under strong MW excitation(e.g. ), the NV fluourescence intensity change of A,C,E is more obvious than B and D, which consistents with the fact that the later two NV centers are more far-away from the Cu MW antenna, as the configuration shown in Fig. 1 and Fig. 2(c). Fig. 3(d) shows the proportional relationship of the square of Rabi frequency () versus MW source power as . The reslut datas were fitted by linearity curves. The gradient of the MW was precisely reflected by the slopes of the linearity curves as , which is consistent with the configuration of the five NV centers shown in Fig. 2(c), except for the spot of B. The unusual of spot B was also shown in the Fig. 3(b) under strong MW power(e.g. ), which indicated the distribution of MW near field is not simply linearity with the distance of the antenna.Appel et al. (2015) The result indicated that the gradient of near field MW at sub-microscale can be resoluted by using arry of NV centers in our work. In this paper, only the relative MW amplitude component perpendicular to the quantum axis of the five NV centers with the same orientation was obtained. The MW amplitude vector can be reconstructed by further measuring the Rabi frequency or fluourescence intensity change by using the NV centers in other three axis.Wang et al. (2015a) In this work, near field MW was detected by reading the fluourescence intensity change and Rabi frequency. Compared with the method by reading the fluourescence intensity change, the method by detecting the Rabi frequency is more convincing to refelct the distribution of the near field MW at high power.
In conclusion, by combining scanning confocal fluorescence images and optical detected magnetic resonance, we realized a method which can fast identify single NV centers with the same orientation. By using an array of single NV center in diamond, five single NV centers with the same axis were identified in a region which demonstrated that the method is practicable and high efficiency. After that, the relative component of the MW field amplitude in a plane perpendicular to the NV axis was studied by measuring the fluorescence intensity and Rabi oscillation frequency. The gradient of near field MW at sub-microscale can be resoluted by using arry of NV centers in our work. The method of identifying the orientation of single NV centres in diamond introduced here can also be used to classify spins with different orientations in other solid crystals such as SiC.Wang et al. (2017) By designing the unique configuration, the near field MW sensor using the NV center array introduced here have the potential in the field of chip failure checking.
Acknowledgements.
This work was supported by the Natural Science Foundation of China (Grant No. 11505135 and No. 61501368) and the National Key Laboratory Foundation (Grant No. 6142411185307).References
- Degen, Reinhard, and Cappellaro (2017) C. L. Degen, F. Reinhard, and P. Cappellaro, Reviews of Modern Physics 89, 035002 (2017).
- Maze et al. (2008) J. R. Maze, P. L. Stanwix, J. S. Hodges, S. Hong, J. M. Taylor, P. Cappellaro, L. Jiang, M. V. G. Dutt, E. Togan, A. S. Zibrov, A. Yacoby, R. L. Walsworth, and M. D. Lukin, Nature 455, 644 (2008).
- Ariyaratne et al. (2018) A. Ariyaratne, D. Bluvstein, B. A. Myers, and A. C. B. Jayich, Nature Communications 9, 2406 (2018).
- Maurer et al. (2012) P. C. Maurer, G. Kucsko, C. Latta, L. Jiang, N. Y. Yao, S. D. Bennett, F. Pastawski, D. Hunger, N. Chisholm, M. Markham, D. J. Twitchen, J. I. Cirac, and M. D. Lukin, Science 336, 1283 (2012).
- Bradley et al. (2019) C. E. Bradley, J. Randall, M. H. Abobeih, R. C. Berrevoets, M. J. Degen, M. A. Bakker, M. Markham, D. J. Twitchen, and T. H. Taminiau, Physical Review X 9, 031045 (2019).
- Zaiser et al. (2016) S. Zaiser, T. Rendler, I. Jakobi, T. Wolf, S.-Y. Lee, S. Wagner, V. Bergholm, T. Schulte-Herbrüggen, P. Neumann, and J. Wrachtrup, Nature Communications 7, 1 (2016).
- Osipov et al. (2019) V. Y. Osipov, F. Treussart, S. A. Zargaleh, K. Takai, F. M. Shakhov, B. T. Hogan, and A. Baldycheva, Nanoscale Research Letters 14, 279 (2019).
- Song et al. (2013) X. Song, G. Wang, X. Liu, F. Feng, J. Wang, L. Lou, and W. Zhu, Applied Physics Letters 102, 133109 (2013).
- Maletinsky et al. (2012) P. Maletinsky, S. Hong, M. S. Grinolds, B. Hausmann, M. D. Lukin, R. L. Walsworth, M. Loncar, and A. Yacoby, Nature Nanotechnology 7, 320 (2012).
- Ofori-Okai et al. (2012) B. K. Ofori-Okai, S. Pezzagna, K. Chang, M. Loretz, R. Schirhagl, Y. Tao, B. A. Moores, K. Groot-Berning, J. Meijer, and C. L. Degen, Physical Review B 86, 081406 (2012).
- Hall et al. (2009) L. T. Hall, J. H. Cole, C. D. Hill, and L. C. L. Hollenberg, Physical Review Letters 103, 220802 (2009).
- Kucsko et al. (2013) G. Kucsko, P. C. Maurer, N. Y. Yao, M. Kubo, H. J. Noh, P. K. Lo, H. Park, and M. D. Lukin, Nature 500, 54 (2013).
- Schmitt et al. (2017) S. Schmitt, T. Gefen, F. M. Stürner, T. Unden, G. Wolff, C. Müller, J. Scheuer, B. Naydenov, M. Markham, and S. Pezzagna, Science 356, 832 (2017).
- Casola, Sar, and Yacoby (2018) F. Casola, T. v. d. Sar, and A. Yacoby, Nature Reviews Materials 3, 1 (2018).
- Wu et al. (2016) Y. Wu, F. Jelezko, M. B. Plenio, and T. Weil, Angewandte Chemie International Edition 55, 6586 (2016).
- Shi et al. (2018) F. Shi, F. Kong, P. Zhao, X. Zhang, M. Chen, S. Chen, Q. Zhang, M. Wang, X. Ye, Z. Wang, Z. Qin, X. Rong, J. Su, P. Wang, P. Z. Qin, and J. Du, Nature Methods 15, 697 (2018).
- Lillie et al. (2019) S. E. Lillie, N. Dontschuk, D. A. Broadway, D. L. Creedon, L. C. L. Hollenberg, and J.-P. Tetienne, arXiv:1905.12873 [cond-mat, physics:physics] (2019), arXiv: 1905.12873.
- Wang et al. (2015a) P. Wang, Z. Yuan, P. Huang, X. Rong, M. Wang, X. Xu, C. Duan, C. Ju, F. Shi, and J. Du, Nature Communications 6, 1 (2015a).
- Appel et al. (2015) P. Appel, M. Ganzhorn, E. Neu, and P. Maletinsky, New Journal of Physics 17, 112001 (2015).
- Shao et al. (2016) L. Shao, R. Liu, M. Zhang, A. V. Shneidman, X. Audier, M. Markham, H. Dhillon, D. J. Twitchen, Y.-F. Xiao, and M. Lončar, Advanced Optical Materials 4, 1075 (2016).
- Dong et al. (2018) M. M. Dong, Z. Z. Hu, Y. Liu, B. Yang, Y. J. Wang, and G. X. Du, Applied Physics Letters 113, 131105 (2018).
- Horsley et al. (2018) A. Horsley, P. Appel, J. Wolters, J. Achard, A. Tallaire, P. Maletinsky, and P. Treutlein, Physical Review Applied 10, 044039 (2018).
- Mariani et al. (2018) G. Mariani, S. Nomoto, S. Kashiwaya, and S. Nomura, arXiv:1812.02864 [cond-mat, physics:quant-ph] (2018), arXiv: 1812.02864.
- Chipaux et al. (2015) M. Chipaux, L. Toraille, C. Larat, L. Morvan, S. Pezzagna, J. Meijer, and T. Debuisschert, Applied Physics Letters 107, 233502 (2015).
- Wallraff et al. (2004) A. Wallraff, D. I. Schuster, A. Blais, L. Frunzio, R.-S. Huang, J. Majer, S. Kumar, S. M. Girvin, and R. J. Schoelkopf, Nature 431, 162 (2004).
- Holloway et al. (2014) C. L. Holloway, J. A. Gordon, S. Jefferts, A. Schwarzkopf, D. A. Anderson, S. A. Miller, N. Thaicharoen, and G. Raithel, IEEE Transactions on Antennas and Propagation 62, 6169 (2014).
- Fang et al. (2016) B. Fang, M. Carpentieri, X. Hao, H. Jiang, J. A. Katine, I. N. Krivorotov, B. Ocker, J. Langer, K. L. Wang, B. Zhang, B. Azzerboni, P. K. Amiri, G. Finocchio, and Z. Zeng, Nature Communications 7, 1 (2016).
- Couëdo et al. (2019) F. Couëdo, E. Recoba Pawlowski, J. Kermorvant, J. Trastoy, D. Crété, Y. Lemaître, B. Marcilhac, C. Ulysse, C. Feuillet-Palma, N. Bergeal, and J. Lesueur, Applied Physics Letters 114, 192602 (2019).
- Fan et al. (2015) H. Fan, S. Kumar, J. Sheng, J. P. Shaffer, C. L. Holloway, and J. A. Gordon, Physical Review Applied 4, 044015 (2015).
- Aslam et al. (2015) N. Aslam, M. Pfender, R. Stöhr, P. Neumann, M. Scheffler, H. Sumiya, H. Abe, S. Onoda, T. Ohshima, J. Isoya, and J. Wrachtrup, Review of Scientific Instruments 86, 064704 (2015).
- Degen (2008) C. L. Degen, Applied Physics Letters 92, 243111 (2008).
- Momenzadeh et al. (2015) S. A. Momenzadeh, R. J. Stöhr, F. F. de Oliveira, A. Brunner, A. Denisenko, S. Yang, F. Reinhard, and J. Wrachtrup, Nano Letters 15, 165 (2015).
- Wang et al. (2015b) J. Wang, F. Feng, J. Zhang, J. Chen, Z. Zheng, L. Guo, W. Zhang, X. Song, G. Guo, L. Fan, C. Zou, L. Lou, W. Zhu, and G. Wang, Physical Review B 91, 155404 (2015b).
- Fukami et al. (2019) M. Fukami, C. Yale, P. Andrich, X. Liu, F. Heremans, P. Nealey, and D. Awschalom, Physical Review Applied 12, 014042 (2019).
- Feng et al. (2016) F. Feng, J. Wang, W. Zhang, J. Zhang, L. Lou, W. Zhu, and G. Wang, Applied Physics A 122, 944 (2016).
- Toyli et al. (2010) D. M. Toyli, C. D. Weis, G. D. Fuchs, T. Schenkel, and D. D. Awschalom, Nano Letters 10, 3168 (2010).
- Ziegler, Ziegler, and Biersack (2010) J. F. Ziegler, M. D. Ziegler, and J. P. Biersack, Nuclear Instruments and Methods in Physics Research Section B: Beam Interactions with Materials and Atoms 19th International Conference on Ion Beam Analysis, 268, 1818 (2010).
- Hausmann et al. (2011) B. J. M. Hausmann, T. M. Babinec, J. T. Choy, J. S. Hodges, S. Hong, I. Bulu, A. Yacoby, M. D. Lukin, and M. Lončar, New Journal of Physics 13, 045004 (2011).
- Jensen et al. (2013) K. Jensen, V. M. Acosta, A. Jarmola, and D. Budker, Physical Review B 87, 014115 (2013).
- Dréau et al. (2011) A. Dréau, M. Lesik, L. Rondin, P. Spinicelli, O. Arcizet, J.-F. Roch, and V. Jacques, Physical Review B 84, 195204 (2011).
- Yang et al. (2019) B. Yang, M. Dong, W. He, Y. Liu, C. Feng, Y. Wang, and G. Du, IEEE Transactions on Microwave Theory and Techniques , 1 (2019).
- Wang et al. (2017) J. Wang, Y. Zhou, X. Zhang, F. Liu, Y. Li, K. Li, Z. Liu, G. Wang, and W. Gao, Physical Review Applied 7, 064021 (2017).