Stars and their variability observed from space
Osservatorio Astrofisico di Catania, Via S. Sofia 78, 95123 Catania, Italy
Gaia’s revolution in stellar variability
Abstract
Stellar variability studies are now reaching a completely new level thanks to ESA’s Gaia mission, which enables us to locate many variable stars in the Hertzsprung-Russell diagram and determine the various instability strips/bands. Furthermore, this mission also allows us to detect, characterise and classify many millions of new variable stars thanks to its very unique nearly simultaneous multi-epoch survey with different instruments (photometer, spectro-photometer, radial velocity spectrometer). An overview of what can be found in literature in terms of mostly data products by the Gaia consortium is given. This concerns the various catalogues of variable stars derived from the Gaia time series and also the location and motion of variable stars in the observational Hertzsprung-Russell diagram. In addition, we provide a list of a few thousands of variable white dwarf candidates derived from the DR2 published data, among them probably many hundreds of new pulsating white dwarfs. On a very different topic, we also show how Gaia allows us to reveal the 3D structures of and around the Milky Way thanks to the RR Lyrae stars.
keywords:
stars: general, stars: variables: general, stars: oscillations, stars: white dwarfs, Stars: distances, surveys, methods: data analysis1 Introduction
The Time-Domain revolution for “large” sky surveys from space keeps advancing strongly since the 1990s, with the Hipparcos mission (ESA 1997), CoRoT (Baglin 2003), and the Kepler/K2 survey (Koch et al. 2010; Howell et al. 2014). Today, we are experiencing a major advance in global space-based surveys thanks to Gaia (Gaia Collaboration et al. 2016) and TESS (Ricker et al. 2015). However, we are still at the stage where each space mission is unique, and we can claim that Gaia benefits from very unique features. One obvious feature is the exceptional astrometric precision, but this is not the only feature. Its (spectro)photometric survey with its G band photometry, integrated BP and RP photometry, and BP and RP low resolution spectra is very singular. Gaia remains unique even without its photometry and astrometry, thanks to its spectroscopic survey that covers more than one hundred million objects (Sartoretti et al. 2018). In addition, since the entire sky is measured with one set of instruments and measurements are nearly simultaneous, the physical interpretation of the data is facilitated. The uniqueness of Gaia is also revealed from its stunning numbers accumulated during 5 years: nearly 1.3 trillions of astrometric CCD measurements, close to 1.5 trillion G-band/BP/RP photometric CCD data and more than 25 billion spectroscopic measurements.
From all these data of different nature, we can perform large-scale statistical descriptions of the stellar populations of variable stars in the Milky Way and its neighbourhood.
2 A few examples of Gaia results
2.1 Science alerts
While scanning the entire sky, Gaia continuously reports alerts***http://gsaweb.ast.cam.ac.uk/alerts/home on astronomical events whose science could be missed if they were not followed up promptly by the community. As of mid-November 2019, the Gaia Photometric Science Alerts team have released more than 10,000 alerts, at a current rate of more than 10 alerts per day. About 25% of the alerts are classified, and out of these about two-thirds turn out to be Supernovae (e.g., Kangas et al. 2017). Gaia has also discovered almost 300 Cataclysmic Variables, and perhaps most excitingly the eclipsing AM CVn system Gaia14aae (Campbell et al. 2015). Thanks to significant community involvement, Gaia has also found in excess of 30 confirmed microlensing events (from 100 candidates, most of which await confirmation), located mostly outside of the Galactic bulge (e.g. Wyrzykowski et al. 2019).
2.2 Variable stars in the first Gaia Data Releases
Variable stars data were published in the first Gaia data release. The release was small since its main goal was to demonstrate Gaia’s photometric capabilities, and to expose the general approach/methodology to analyse the photometric time series of Gaia (Eyer et al. 2017). We released 3,194 G-band time series of Cepheids and RR Lyrae stars from the first 14 month solution and concentrated on stars sampled during the ecliptic pole scanning law (Clementini et al. 2016). There was also a science demonstration article on the Period Luminosity (PL) relations of Cepheids and infrared PL and optical luminosity-metallicity relations of RR Lyrae stars (Gaia Collaboration et al. 2017) calibrated on parallaxes of the Tycho-Gaia Astrometric Solution (TGAS, Lindegren et al. 2016).
2.3 Variable stars in the second Gaia Data Releases
As part of the second data release, “only” half a million stars with Gaia variability information were published (Holl et al. 2018). The resulting catalogues are among the largest catalogues of RR Lyrae stars (Clementini et al. 2019; Rimoldini et al. 2019), Scuti and SX Phoenicis stars (Rimoldini et al. 2019), Long Period variable stars (Mowlavi et al. 2018; Rimoldini et al. 2019), rotationally modulated variable stars (Lanzafame et al. 2018, 2019). We further published a catalogue of Cepheids in the Galaxy and the Magellanic Clouds (Clementini et al. 2019; Rimoldini et al. 2019; Ripepi et al. 2019) and of short-timescale ( day) variables (Roelens et al. 2018). For all these sources, more than 1.6 million photometric time series (G-band, integrated BP and RP bands) are published as well as statistical attributes and specific parameters for specific groups.
Another product is the science demonstration article (Gaia Collaboration et al. 2019), where we show where stars of certain variability types are located and how they move in the observational Hertzsprung-Russell diagram. This description is totally unprecedented. This was done for pulsating stars, cataclysmic stars, eruptive, eclipsing binaries/exo-planet transit hosts, and rotational-induced variable stars. For cataclysmic variable stars, the samples have been cleaned and sub-classified in Pala et al. (2019) and Abril et al. (2019). We also showed how the stars are moving in the Hertzsprung-Russell diagram in several movies, e.g. on YouTube†††https://www.youtube.com/watch?v=Pcy4U5uvL8I.
We also derived the fraction of variable star as detected with the Gaia precision of DR2 over the entire Hertzsprung-Russell diagram. It is quite striking that, in the instability strip at the location of Scuti stars, the fraction of variable stars is not so different than the one of Murphy et al. (2019) based on Kepler data.
We were also surprised to see the fraction of variables along the white dwarf sequence which prompted us to analyse further this region of the Hertzsprung-Russell diagram using the DR2 published data (see Section 3).
2.4 Images of the week
There are also examples which are published in the Gaia Image of the Week on the ESA webpage‡‡‡https://www.cosmos.esa.int/web/gaia/image-of-the-week, which demonstrate the capabilities of Gaia on many different topics, including features of time series of photometry/spectroscopy. In that way astronomers can get an early view of what Gaia is capable of. A few of them are mentioned below.
-
•
29/05/2019: the RVS spectra time series of X Per (a member of the Be/X-ray class of binaries) is visualised by an animation that shows clear variability of the emission lines of the Be star, following the accretion of the circumstellar matter around the Be star on the neutron star companion. The animation of spectra time series of other stars are shown, for example one related to the RS CVn system SZ Psc which shows strongly variable chromospheric activity in the Calcium lines.
-
•
24/05/2019: the period-amplitude diagram of rotational modulation variable candidates shows a multi-modal structure that is interpreted as different regimes in surface inhomogeneities as function of age, see Lanzafame et al. (2019).
-
•
18/12/2018: the outburst of a rare FU Orionis star showed the extreme changes in brightness and spectral type that are typical of this type of young stellar objects.
-
•
15/11/2018: the epoch spectra in RP were used to determine if the atmosphere of an evolved star is carbon or oxygen rich (as also described in Mowlavi et al. 2019).
-
•
24/03/2017: the median colour-magnitude diagram of fundamental mode RR Lyrae stars was shown to be able to identify the location of these variable stars, from the galactic halo to the direction to the bulge, from the Sagittarius dwarf spheroidal galaxy to its tidal streams, and from the Large to the Small Magellanic Cloud.
-
•
09/10/2015: the radial velocity of a spectroscopic double-lined binary (SB2) was derived for each binary component as a function of time from the epoch spectra of Gaia’s Radial Velocity Spectrometer (RVS).
2.5 Other results on variable stars
The Gaia data has been used for many purposes in relation to variable stars. Here, we highlight a few studies that developed a virtuous circle between Gaia and these topics. We have a stunning improvement of the RR Lyrae luminosity properties (Muraveva et al. 2018) thanks to the high relative precision of Gaia parallaxes for a large number of stars. There is an an interplay with other distance-determination methods based on asteroseimology (Zinn et al. 2019), Cepheids (Riess et al. 2018), and eclipsing binaries (Graczyk et al. 2019), although all of these studies have a larger parallax offset term than the one resulting from quasars (Lindegren et al. 2018; Arenou et al. 2018).
3 New pulsating white dwarf candidates
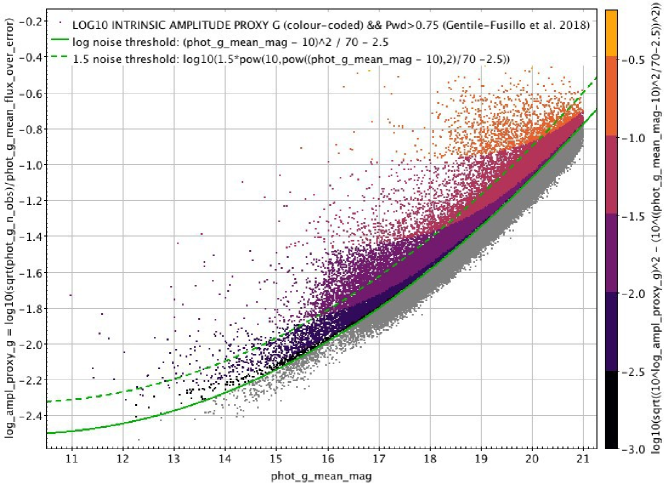
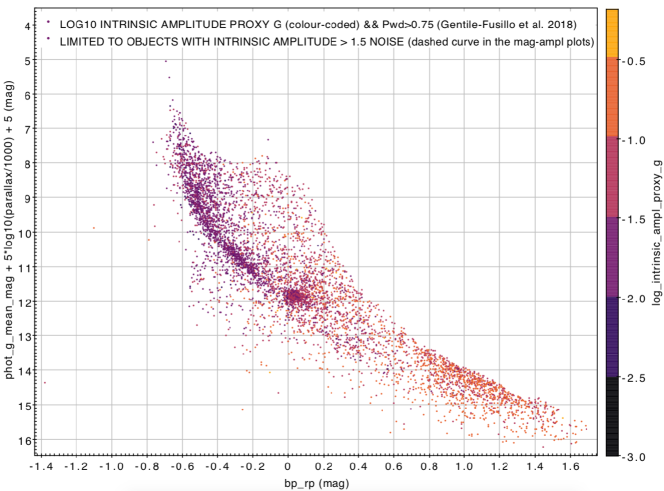
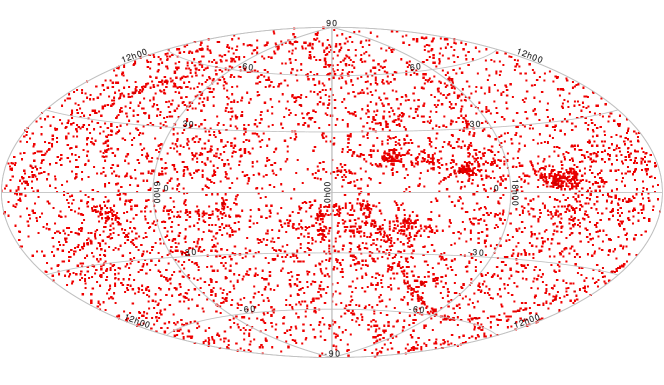
We detected a whole new set of variable white dwarf candidates from a Gaia DR2 based selection of white dwarfs by Gentile Fusillo et al. (2019). To this end, we used the published Gaia DR2 data (Gaia Collaboration et al. 2018), which contain averaged quantities for the photometry of all sources, with the exception of the released variable objects which include also time series, see Holl et al. (2018). We used the uncertainty on the mean and the number of per-CCD measurements to estimate the standard deviation of the (unpublished) photometric time series. This proxy of amplitude was then used to detect variable white dwarfs as a function of magnitude (e.g., Eyer 1998), as described in Fig. 1. A colour-absolute magnitude diagram of the variable white dwarf candidates is presented in Fig. 2 and the known locations of pulsating white dwarfs are clearly visible. We see the very distinctive clump of ZZ Ceti stars at BPRP and M, an elongated structure of V777 Her stars at BPRP and M and an even more elongated regions of GW Vir stars at BPRP and M. The low general background density of points, are very probably false detections. A sky map of these variable candidates is shown in Fig. 3 and it highlights problematic regions with likely contaminants (from the over-densities correlated in the sky). Such spurious features are well known to the consortium. Such problematic data has been also apparent in the quasars map of Bailer-Jones et al. (2019), and is probably coming from their indicator of variability. The list of sources is made available along with this publication and also in https://www.unige.ch/sciences/astro/variability/en/data/. This list is containing 5837 candidates among them many new true pulsating white dwarfs.
.
4 The Galaxy in 3D with RR Lyrae stars
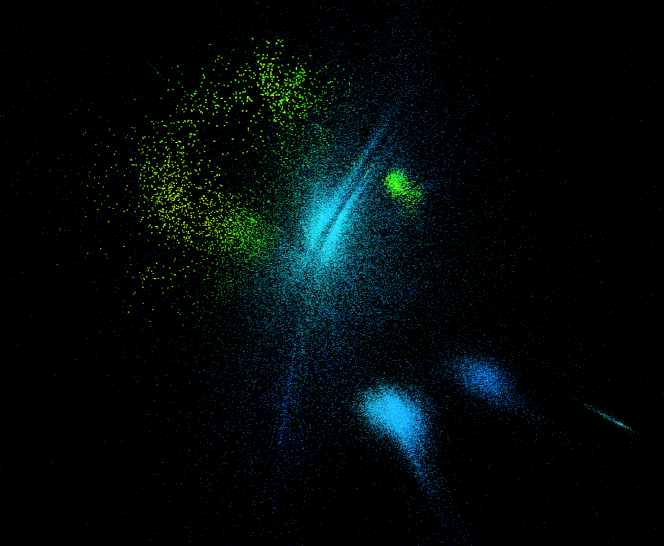
We can obtain a view of the structures in and around the Milky Way thanks to the RR Lyrae stars (from DR2, Clementini et al. 2019). We used the simplistic assumption that the RR Lyrae stars from this catalogue have an absolute magnitude of MG = 0.6 and derive their distance through the distance modulus, without taking into account the dependencies on extinction and metallicity. The 3-dimensional view in Fig. 4 shows the Large and Small Magellanic Clouds, the Sagittarius dwarf galaxy and the associated Sagittarius stream. We can also see small ‘streaks’ corresponding to globular clusters. The precision of the distances is reduced by the assumptions mentioned above and causes visible radial tails, though the location of the sources in the sky is very precise. This figure can be seen as an online animation using (only) Chrome browser at the following address: https://obswww.unige.ch/~eyer/lroro/presentation/. This animation can be also rolled back and stop at any time and can be interactively explored.
5 Future and other data releases
The Gaia first data release occurred in September 2016 and the second data release in April 2018. The work during these data releases was extremely intense and it became clear that an interval of 2 years between successive releases was too short. Currently, the next foreseen release is the third data release (DR3) based on 33/34 months of data. This data release will be split into:
-
•
an early data release (EDR3) in 2020, containing improved astrometry (positions, parallaxes, proper motions) and mean photometry (integrated G, GBP, GRP),
-
•
the full DR3 release in 2021, including 5-10 million variable stars, with a classification, and the associated photometric time series. This release will also include: object classification and astrophysical parameters, together with BP/RP spectra and/or RVS spectra on which they are based; mean radial velocities for stars with available atmospheric-parameter estimates; solar-system results with preliminary orbital solutions and individual epoch observations; non-single stars; quasars and results for extended objects. In addition, we proposed to release a pencil beam with epoch photometry for all sources (variable and non-variable), centered on the Andromeda Galaxy.
The latest updates and details on the Data Releases are available on the ESA webpage§§§ https://www.cosmos.esa.int/web/gaia/release.
The 4th data release is not fixed but may happen in 2024, the schedule is being currently discussed within the consortium. This release should contain the first 5 years of data (the nominal mission) and possibly a part of the data from the extended mission.
A final data release containing the nominal mission and the data from the extension (at most 5 years) will be released (though it is too early to specify a date).
6 Conclusion
By essence/design Gaia is a time domain space machine. Gaia time series analysis produces the parallaxes, proper motions, and various photometrically and spectroscopically variable signals. Their nature can be periodic, quasi-periodic, transient or stochastic. These signals with Gaia animates directly many diagrams as shown in this contribution, however they are just the shiny tip of the iceberg of Gaia’s contribution to astronomy — Gaia has and will have a staggering impact in nearly all domains of astrophysics, also thanks to its content of variable celestial objects.
Acknowledgements.
Acknowledgement: We would like to thank late Prof. Gilles Fontaine for the interactions and encouragements on the variable white dwarf candidates form Gaia. This work has made use of data from the European Space Agency (ESA) mission Gaia (https://www.cosmos.esa.int/gaia), processed by the Gaia Data Processing and Analysis Consortium (DPAC, https://www.cosmos.esa.int/web/gaia/dpac/consortium). Funding for the DPAC has been provided by national institutions, in particular the institutions participating in the Gaia Multilateral Agreement.References
- Abril et al. (2019) Abril, J., Schmidtobreick, L., Ederoclite, A. r., & López-Sanjuan, C. 2019, arXiv e-prints, arXiv:1912.01531
- Arenou et al. (2018) Arenou, F., Luri, X., Babusiaux, C., et al. 2018, A&A, 616, A17
- Baglin (2003) Baglin, A. 2003, Advances in Space Research, 31, 345
- Bailer-Jones et al. (2019) Bailer-Jones, C. A. L., Fouesneau, M., & Andrae, R. 2019, MNRAS, 490, 5615
- Campbell et al. (2015) Campbell, H. C., Marsh, T. R., Fraser, M., et al. 2015, MNRAS, 452, 1060
- Clementini et al. (2016) Clementini, G., Ripepi, V., Leccia, S., et al. 2016, A&A, 595, A133
- Clementini et al. (2019) Clementini, G., Ripepi, V., Molinaro, R., et al. 2019, A&A, 622, A60
- ESA (1997) ESA. 1997, The Hipparcos and Tycho Catalogues (ESA), ESA SP-1200
- Eyer (1998) Eyer, L. 1998, PhD thesis, University of Geneva, Switzerland
- Eyer et al. (2017) Eyer, L., Mowlavi, N., Evans, D. W., et al. 2017, arXiv e-prints, arXiv:1702.03295
- Gaia Collaboration et al. (2018) Gaia Collaboration, Brown, A. G. A., Vallenari, A., et al. 2018, A&A, 616, A1
- Gaia Collaboration et al. (2017) Gaia Collaboration, Clementini, G., Eyer, L., et al. 2017, A&A, 605, A79
- Gaia Collaboration et al. (2019) Gaia Collaboration, Eyer, L., Rimoldini, L., et al. 2019, A&A, 623, A110
- Gaia Collaboration et al. (2016) Gaia Collaboration, Prusti, T., de Bruijne, J. H. J., et al. 2016, A&A, 595, A1
- Gentile Fusillo et al. (2019) Gentile Fusillo, N. P., Tremblay, P.-E., Gänsicke, B. T., et al. 2019, MNRAS, 482, 4570
- Graczyk et al. (2019) Graczyk, D., Pietrzyński, G., Gieren, W., et al. 2019, ApJ, 872, 85
- Holl et al. (2018) Holl, B., Audard, M., Nienartowicz, K., et al. 2018, A&A, 618, A30
- Howell et al. (2014) Howell, S. B., Sobeck, C., Haas, M., et al. 2014, PASP, 126, 398
- Kangas et al. (2017) Kangas, T., Blagorodnova, N., Mattila, S., et al. 2017, MNRAS, 469, 1246
- Koch et al. (2010) Koch, D. G., Borucki, W. J., Basri, G., et al. 2010, ApJ, 713, L79
- Lanzafame et al. (2019) Lanzafame, A. C., Distefano, E., Barnes, S. A., & Spada, F. 2019, ApJ, 877, 157
- Lanzafame et al. (2018) Lanzafame, A. C., Distefano, E., Messina, S., et al. 2018, A&A, 616, A16
- Lindegren et al. (2018) Lindegren, L., Hernández, J., Bombrun, A., et al. 2018, A&A, 616, A2
- Lindegren et al. (2016) Lindegren, L., Lammers, U., Bastian, U., et al. 2016, A&A, 595, A4
- Mowlavi et al. (2018) Mowlavi, N., Lecoeur-Taïbi, I., Lebzelter, T., et al. 2018, A&A, 618, A58
- Mowlavi et al. (2019) Mowlavi, N., Trabucchi, M., & Lebzelter, T. 2019, in The Gaia Universe, 62
- Muraveva et al. (2018) Muraveva, T., Delgado, H. E., Clementini, G., Sarro, L. M., & Garofalo, A. 2018, MNRAS, 481, 1195
- Murphy et al. (2019) Murphy, S. J., Hey, D., Van Reeth, T., & Bedding, T. R. 2019, MNRAS, 485, 2380
- Pala et al. (2019) Pala, A. F., Gänsicke, B. T., Breedt, E., et al. 2019, arXiv e-prints, arXiv:1907.13152
- Ricker et al. (2015) Ricker, G. R., Winn, J. N., Vanderspek, R., et al. 2015, Journal of Astronomical Telescopes, Instruments, and Systems, 1, 014003
- Riess et al. (2018) Riess, A. G., Casertano, S., Yuan, W., et al. 2018, ApJ, 861, 126
- Rimoldini et al. (2019) Rimoldini, L., Holl, B., Audard, M., et al. 2019, A&A, 625, A97
- Ripepi et al. (2019) Ripepi, V., Molinaro, R., Musella, I., et al. 2019, A&A, 625, A14
- Roelens et al. (2018) Roelens, M., Eyer, L., Mowlavi, N., et al. 2018, A&A, 620, A197
- Sartoretti et al. (2018) Sartoretti, P., Katz, D., Cropper, M., et al. 2018, A&A, 616, A6
- Wyrzykowski et al. (2019) Wyrzykowski, Ł., Mróz, P., Rybicki, K. A., et al. 2019, arXiv e-prints, arXiv:1901.07281
- Zinn et al. (2019) Zinn, J. C., Pinsonneault, M. H., Huber, D., & Stello, D. 2019, ApJ, 878, 136