Detection and characterisation of oscillating red giants: first results from the TESS satellite
Abstract
Since the onset of the ‘space revolution’ of high-precision high-cadence photometry, asteroseismology has been demonstrated as a powerful tool for informing Galactic archaeology investigations. The launch of the NASA TESS mission has enabled seismic-based inferences to go full sky – providing a clear advantage for large ensemble studies of the different Milky Way components. Here we demonstrate its potential for investigating the Galaxy by carrying out the first asteroseismic ensemble study of red giant stars observed by TESS. We use a sample of 25 stars for which we measure their global asteroseimic observables and estimate their fundamental stellar properties, such as radius, mass, and age. Significant improvements are seen in the uncertainties of our estimates when combining seismic observables from TESS with astrometric measurements from the Gaia mission compared to when the seismology and astrometry are applied separately. Specifically, when combined we show that stellar radii can be determined to a precision of a few percent, masses to 5-10% and ages to the 20% level. This is comparable to the precision typically obtained using end-of-mission Kepler data.
1 Introduction
Asteroseismology of red giant stars has been one of the major successes of the CoRoT and Kepler missions. The unambiguous detection of non-radial oscillations has fundamentally widened our understanding of the inner workings of red giants, including the conditions in their core (e.g., Bedding et al., 2011). The observed frequency spectra have allowed the determination of the physical properties of thousands of red giants to an unprecedented level of precision (e.g., Miglio et al., 2013), paving the way for the emergence of asteroseismology as a powerful tool for Milky Way studies and Galactic archaeology (e.g., Miglio et al., 2009; Casagrande et al., 2016; Anders et al., 2017; Silva Aguirre et al., 2018; Sharma et al., 2019). The Transiting Exoplanet Survey Satellite (TESS, Ricker et al., 2015) is on the path of continuing this legacy with its all-sky survey that is expected to increase the number of detected oscillating red giants by an order of magnitude compared to the tens of thousands reported by its predecessors CoRoT and Kepler.
In the nominal TESS mission, the ecliptic northern and southern hemispheres are each observed during thirteen 27-day-long sectors, and most (92%) of the surveyed sky will be monitored for just 1-2 sectors. Except for the 20,000 targets pre-selected in each sector for 2-min cadence observations, all stars are observed as part of the full frame images obtained in 30-min cadence, similar to the long cadence sampling of the Kepler satellite. The length of the observations sets the lower limit on the oscillation frequencies one can resolve, and the sampling sets the upper frequency limit. We know from previous Kepler observations that one month of 30-min cadence data should be well suited to detect oscillations in the low red-giant branch and sufficient to measure the global oscillation properties characterising the frequency spectrum, in particular, its frequency of maximum power, , and the frequency separation between overtone modes, (Bedding et al., 2010). These in turn can be used in combination with complementary data such as the effective temperature, , the relative iron abundance, [Fe/H], and parallax, to obtain precise stellar properties (including ages) when applying asteroseismic-based grid modelling approaches (see e.g., Rodrigues et al., 2017; Pinsonneault et al., 2018).
Due to the large sky coverage, approximately 97% of asteroseismic detections in red giants from the TESS nominal mission data are expected to come from stars observed for only one or two sectors111Based on a preliminary simulation of the full TESS sky (TESS GI Proposal No G011188).. Here we set out to explore the capability of TESS to detect the oscillations in giants ranging from the base of the red giant branch to the red clump, determine their stellar properties, and use that to assess the prospects for Galactic archaeology studies using one to two sectors of TESS data.
2 Target selection
Our goal is to have a representative sample of giants including the types of stars in which we can expect to detect oscillations from one sector 30-min cadence TESS data. We selected red-giant candidates observed during sectors 1 and/or 2 that were deemed viable for asteroseismic detections according to their predicted properties based on the Hipparcos catalogue (Van Leeuwen, 2007). We first estimated the stellar and luminosity using color, -band, and Hipparcos parallax, and the color-temperature and bolometric correction relations of Flower (1996). We then obtained a prediction of ( ; solar scaled, e.g. Yu et al. 2018) for each star assuming a mass of 1.2 M⊙, which is representative of a typical red giant as observed by Kepler (and unlikely to be more than a factor of two from the true value of each star, e.g. Yu et al., 2018). We note that one of our targets (TIC 129649472) is a known exoplanet host star recently analysed by Campante et al. (2019).
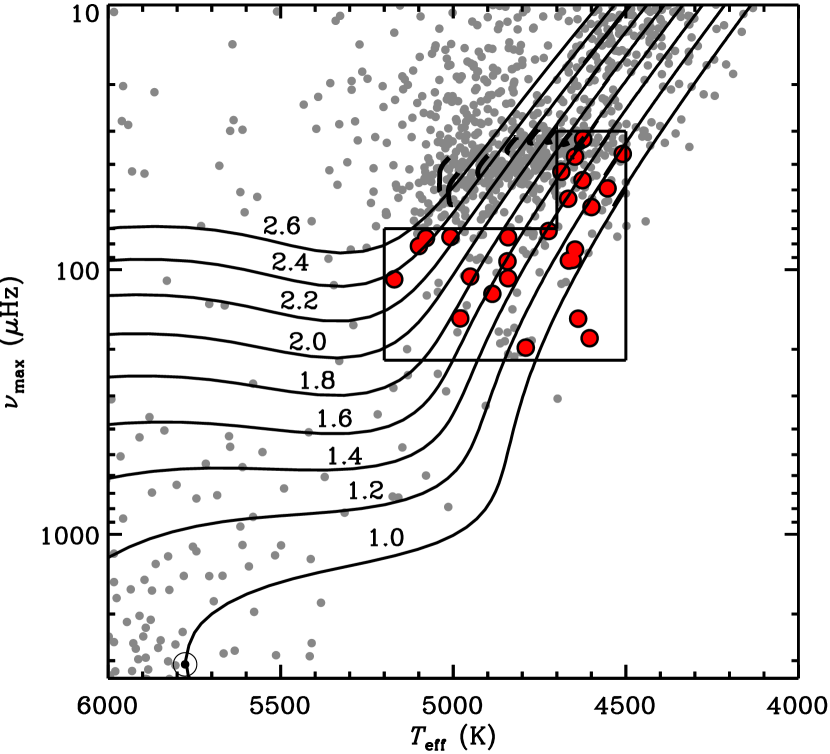
To ensure that the selected targets were amenable to asteroseismic detection from one sector of 30-min cadence data, we required that they would have an expected in the range 30-220Hz and in the typical range of red giants of 4500-5200 K. In addition, we applied a narrower range of 4500-4700 K for the stars with between 30Hz and 70Hz, to avoid having red clump stars dominating our sample. The resulting sample of stars span evolutionary phases from the base of the red giant branch to the red giant branch bump, as well as some clump stars.
From this sample, we selected the 25 brightest targets for light curve extraction and asteroseismic analysis. The faintest stars in our sample turned out to be 6-7th magnitude in band (see Table 1). Under the assumption that the photometric performance of TESS is similar to Kepler’s, apart from its smaller aperture, this magnitude limit is equivalent to 11-12th magnitude for Kepler. Because single-quarter observations from Kepler’s second life, K2, showed no oscillation detection bias for red giants brighter than around 12th magnitude (Stello et al., 2017) we would expect to detect oscillations in all 25 giants with TESS.
Figure 1 illustrates the location of the selected stars in the HR-diagram and the applied selection criteria. We confirmed that the stars were in sectors 1-2 using the Web TESS Viewing tool (WTV)222https://heasarc.gsfc.nasa.gov/cgi-bin/tess/webtess/wtv.py.
3 Data processing and asteroseismic analysis
The stars selected were included in an early release of processed data from the TASOC pipeline333T’DA Data Release Notes - Data Release 3 for TESS Sectors 12 (https://doi.org/10.5281/zenodo.2510028). The calibrated full frame images were produced by the TESS Science Processing Operations Center (SPOC) at NASA Ames Research Center (Jenkins et al., 2016), and processed by combining the methodology from the K2P2 pipeline (Lund et al., 2015) for extracting the flux from target pixel data with the KASOC filter for systematics correction (Handberg & Lund, 2014). The resulting TASOC light curves were high-pass filtered using a filter width of 4 days, corresponding to a cut-off frequency of approximately 3Hz , and outliers were removed. Finally, we used linear interpolation to fill gaps that lasted up to three consecutive cadences and derived the Fourier transforms (power frequency spectra) of each light curve.
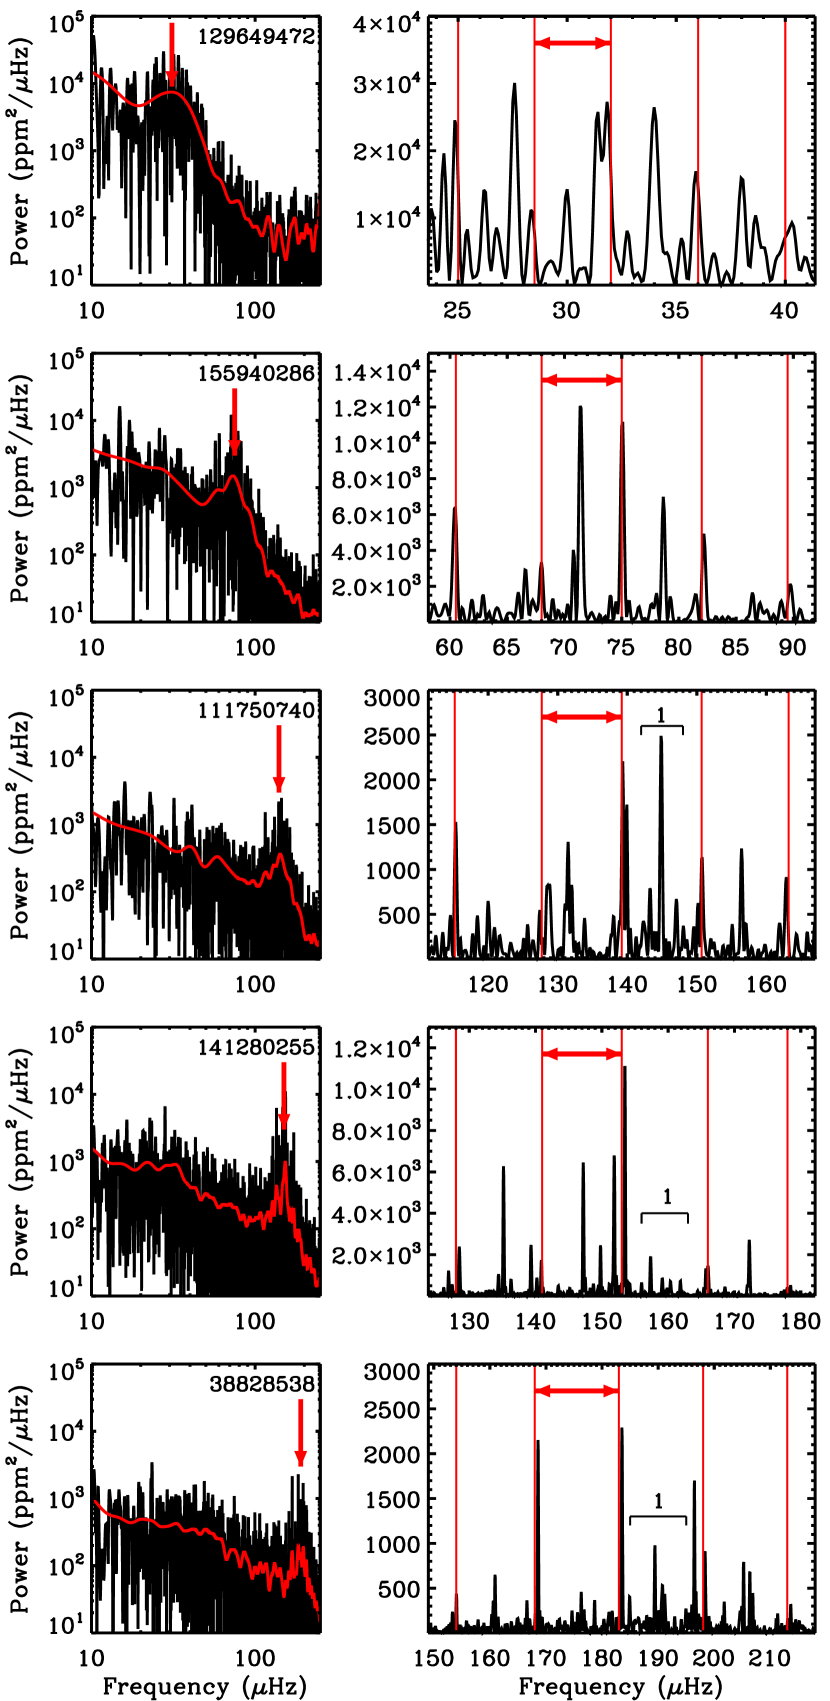
The light curves for the seven stars observed in both sectors were merged. To follow the approach anticipated for the millions of light curves from the TESS full frame images in the future, we first applied the neural network-based detection algorithm by Hon et al. (2018) resulting in detection of oscillations in the power spectra of all stars except one. The non-detection (TIC 204314449) is listed as an A2 dwarf and a ’Visual Double’ in the University of Michigan Catalogue of two-dimensional spectral types for the HD stars (Houk, 1994), and hence possibly too hot to show solar-like oscillations, or potentially contaminated. For the current test case, the number of stars was small enough that we visually checked the results, which confirmed all detections and the non-detection. The power spectra of a representative sample of the stars are shown in Figure 2 showing clear oscillation excess power and the frequency pattern required to measure both and .
The neural network also supplies a rough estimate for , which we provided as a prior to 13 independent groups analysing the power spectra to extract high-precision values of both , , and their respective uncertainties using their preferred method. These methods have been thoroughly tested and described in the literature (see e.g., Huber et al., 2009; Gaulme et al., 2009; Hekker et al., 2010; Mathur et al., 2010; Mosser et al., 2011; Kallinger et al., 2012; Corsaro & De Ridder, 2014; Davies et al., 2016; Campante et al., 2017; Zinn et al., 2019).
From the 13 independent determinations of the global asteroseismic parameters we adopted as central reference value for and the results from the pipeline by Gaulme et al. (2009), as this method was on average closest to the ensemble mean after applying a 2- outlier rejection. Uncertainties in the global asteroseismic parameters obtained by the selected pipeline are at the 1.9% and 2.4% level for and , respectively. These uncertainties are of comparable magnitude to those obtained from a single campaign with the K2 mission (see appendix in Stello et al., 2017) and about twice as large as those extracted from 50 days of Kepler observations (see Figs. 3 and 4 in Hekker et al., 2012). We report the central values and statistical uncertainties in and from the selected pipeline for all targets in Table 1.
For each star, we take into account the scatter across the different methods by adding in quadrature the standard deviation among the central values retained after the 2- outlier rejection procedure to the formal uncertainty reported by the selected reference method. This consolidation process yields median uncertainties of 3.9% in and 2.6% in , where the individual contribution arising from this systematic component to the total uncertainty is listed in Table 1. We note that we could decrease the level of uncertainties resulting from our ‘blind’ statistical consolidation approach by for example checking the and results against the power spectra and/or échelle diagrams (see Fig. 5 in Stello et al., 2011). However, we want to draw a realistic picture of the uncertainties one can expect when dealing with large ensembles of stars (as expected from TESS) where detailed ’boutique’ analysis/checking on a star-by-star basis is not practically feasible. Hence, our quoted uncertainties are conservative, but representative for analysis of TESS red giants where several pipelines are involved.
4 Derived stellar properties
We have determined stellar properties for a subsample of 17 stars that had spectroscopic measurements of effective temperature and chemical composition available in the literature. Since one of our goals is to follow the same analysis procedure expected for large ensembles of stars, we assumed fixed uncertainties in and [Fe/H] of 80 K and 0.08 dex, which are at the level of those provided by current large-scale spectroscopic surveys. To extract the physical properties of our sample, the atmospheric information was complemented with the asteroseismic scaling relations:
| (1) |
| (2) |
where we adopted (Hz) and (Hz) as obtained by our reference pipeline from the analysis of solar data.
Seven teams independently applied grid-based modelling pipelines based on stellar evolution models or isochrones to determine the main physical properties of the targets (see Basu et al., 2012; Silva Aguirre et al., 2015; Rodrigues et al., 2017; Mints & Hekker, 2018; Yıldız et al., 2019, and references therein). When matching the models to the atmospheric properties and the global asteroseismic parameters and the pipelines yielded median uncertainties of 6% in radius, 14% in mass, and 50% in age. These statistical uncertainties are of the same magnitude to those obtained with the K2 mission (Sharma et al., 2019), as expected from the similar resulting errors in the global seismic parameters described in Section 3, and about a factor of two larger than what can be achieved with the full duration of the Kepler observations (Pinsonneault et al., 2018).
In addition to the asteroseismic information, five of the pipelines can include parallaxes from Gaia DR2 (Gaia Collaboration et al., 2018) coupled with Tycho-2 (Høg et al., 2000) observed -magnitudes in their fitting algorithm to further constrain the stellar properties. As a consequence of having the additional constraint on stellar radius from the astrometry, the resulting uncertainties decrease to a level of 3% in radius, 6% in mass, and 20% in age. This level of precision resembles that obtained with the use of the full length of asteroseismic observations from the nominal Kepler mission, and emphasizes the potential of TESS for Galactic studies using red giants given its larger sky coverage, simple and reproducible selection function, and one order of magnitude higher expected yield of asteroseismic detections than any other previous mission.
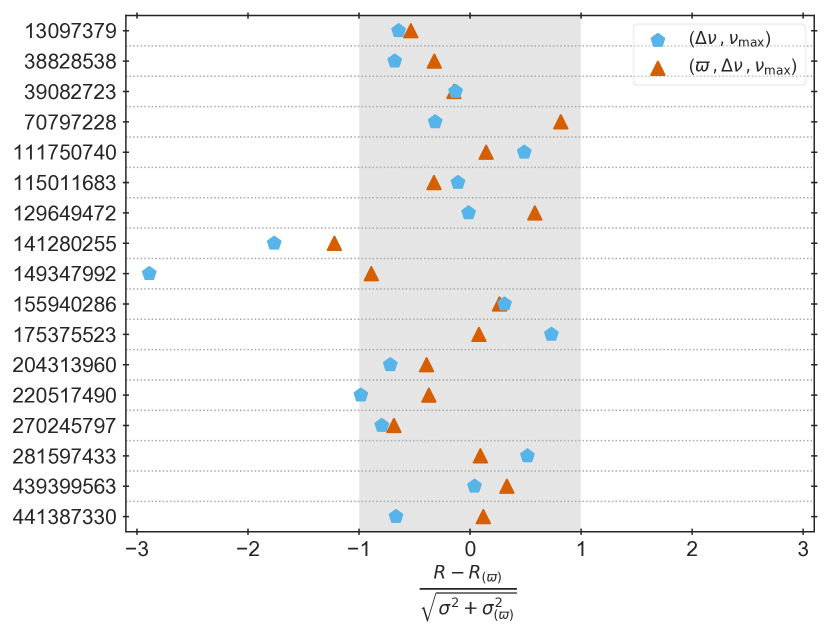
To illustrate the differences in the obtained stellar properties arising from the selection of fitted observables, Fig. 3 shows the stellar radius obtained with one of the pipelines (BASTA, Silva Aguirre et al., 2015) when fitting different combinations of input parameters. The figure uses as the reference value the case when, in addition to the atmospheric properties, only the Gaia DR2 parallax and observed -band magnitude are included in the fit. For the majority of the targets the results are consistent across the three sets within their formal statistical uncertainties. A summary of the measured and derived stellar properties for our targets can be found in Table 1, where we have listed the central values and statistical uncertainties obtained with the BASTA pipeline, and determined the systematic contribution as the standard deviation across the results reported by all pipelines.
Two targets (TIC 141280255 and TIC 149347992) present a larger disagreement between the radii obtained with parallax and the seismic set (, ). We investigated if these discrepancies were due to the quality of the astrometric data by computing the re-normalised unit weight error (RUWE444see Gaia technical note GAIA-C3-TN-LU-LL-124-01 (https://www.cosmos.esa.int/web/gaia/dr2-known-issues)) for our sample of stars. In the case of TIC 141280255 we obtained a RUWE=1.98, which is above the value recommended by the Gaia team as a criterion for a good astrometric solution (RUWE). Therefore, we adopt for this star the stellar properties obtained from fitting the asteroseismic input only (, ).
In the case of TIC 149347992 the discrepancy is the result of predicted evolutionary phases: while the parallax-only solution suggests that the star in the clump phase, the asteroseismic fit favours a star in the red-giant branch. The combined fit therefore presents a bimodal distribution that encompasses these two families of solutions. A similar situation occurs in the fit of TIC 175375523, which shows agreement in the radius determined from different sets of input but has a fractional age uncertainty above unity when only (, ) are included in the fit. Its resulting age distribution is bimodal in this set as both red-giant branch and clump models can reproduce the observations, but the inclusion of parallax information favours the red giant branch solution and accounts for the % statistical uncertainty reported in Table 1. The availability of evolutionary classifications from deep neural networks trained on short Kepler data (Hon et al., 2018) would further decrease the obtained uncertainties by clearly disentangling these two scenarios.
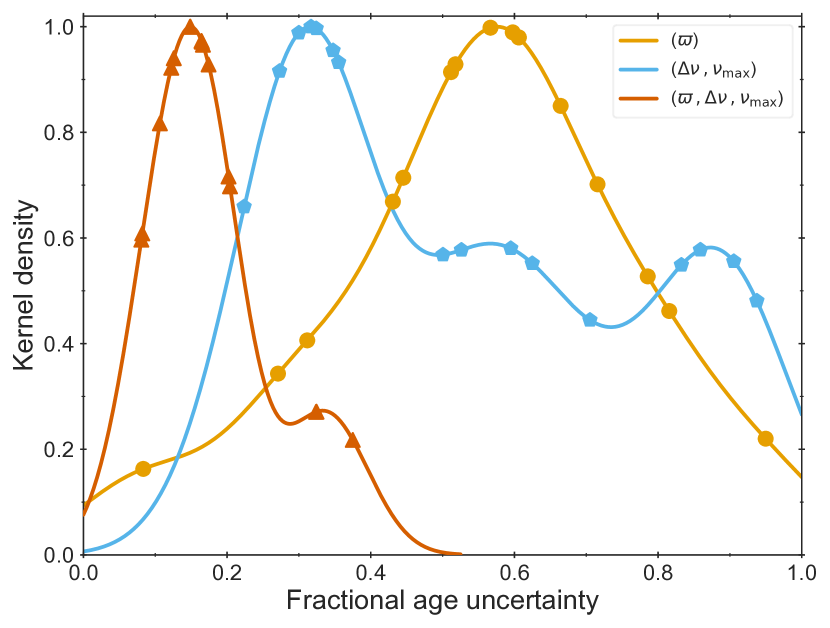
In Fig. 4 we plot the distribution of fractional age uncertainties obtained with BASTA for the three considered cases of input, showing the clear improvement in precision when asteroseismic information and parallax are simultaneously included in the fit. For visualization purposes we have excluded the target TIC 175375523 from the figure. Our stellar ages at the 20% level are significantly more precise than what is obtained by data-driven and neural-network methods trained using asteroseismic ages from Kepler (above the 30% level, see e.g., Mackereth et al., 2019). As a final remark, we note that asteroseismically derived properties of red giants are accurate to at least a similar level than our statistical uncertainties (below % and % for radii and masses, respectively. See discussion in e.g., Pinsonneault et al., 2018, and references therein). We have made emphasis on our achieved precision instead of accuracy as our results could still be affected by a systematic component arising from uncertainties in evolutionary calculations, although recent investigations quantifying these effects at solar metallicity suggest that they are smaller than our statistical uncertainties (Silva Aguirre et al., 2019).
5 Conclusions
We presented the first ensemble analysis of red giants stars observed with the TESS mission. We selected a sample of 25 stars where we expected to detect oscillations based on their magnitude and parallax value, and analysed the extracted light curves in search for asteroseismic signatures in the power spectra. Our main findings can be summarized as follows:
-
•
We detected oscillations in all the stars (except one that was likely incorrectly listed as a red giant). Despite the modest number of stars in our sample, our detection yield supports that the TESS photometric performance is similar to that of Kepler and K2 except shifted by about 5 magnitudes towards brighter stars due to its smaller aperture.
-
•
Individual pipelines retrieve the global asteroseismic parameters with uncertainties at the 2% level in and 2.5% in , which respectively increase to 4% and 3.5% when we take into account the scatter across results. We consider these uncertainties to be representative for the forthcoming ensemble analysis of TESS targets observed in 1-2 sectors, as individual validation of the results will not be feasible due to the large number of targets observed.
-
•
Grid-based modelling techniques applying asteroseismic scaling relations were used to retrieve stellar properties for the 17 targets with spectroscopic information. Radii, masses, and ages were obtained with uncertainties at the 6%, 14%, and 50% level, and decrease to 3%, 6%, and 20% when parallax information from Gaia DR2 is included.
The expected number of red giants with detected oscillations by TESS (500,000555Based on a preliminary simulation of the full TESS sky (TESS GI Proposal No G011188).) greatly surpasses the final yield of Kepler (20,000). In this respect, the combination of TESS observations, Gaia astrometry, and large scale spectroscopic surveys holds a great potential for studies of Galactic structure where precise stellar properties (particularly ages) are of key importance. We note that the recently approved extended TESS mission will change the 30-min cadence to 10 minutes, making it possible to detect oscillations of stars of smaller radii using the full frame images. This will enable more rigorous investigations of the asteroseismic mass scale for giants when anchored to empirical mass determinations (e.g., from eclipsing binaries) of turn-off and subgiant stars.
References
- Alves et al. (2015) Alves, S., Benamati, L., Santos, N. C., et al. 2015, Monthly Notices of the Royal Astronomical Society, 448, 2749
- Anders et al. (2017) Anders, F., Chiappini, C., Rodrigues, T. S., et al. 2017, A&A, 597, A30, doi: 10.1051/0004-6361/201527204
- Basu et al. (2012) Basu, S., Verner, G. A., Chaplin, W. J., & Elsworth, Y. 2012, ApJ, 746, 76
- Bedding et al. (2010) Bedding, T. R., Huber, D., Stello, D., et al. 2010, ApJL, 713, L176
- Bedding et al. (2011) Bedding, T. R., Mosser, B., Huber, D., et al. 2011, Nature, 471, 608
- Campante et al. (2017) Campante, T. L., Veras, D., North, T. S. H., et al. 2017, Monthly Notices of the Royal Astronomical Society, 469, 1360
- Campante et al. (2019) Campante, T. L., Corsaro, E., Lund, M. N., et al. 2019, arXiv e-prints, arXiv:1909.05961. https://arxiv.org/abs/1909.05961
- Casagrande et al. (2016) Casagrande, L., Silva Aguirre, V., Schlesinger, K. J., et al. 2016, Monthly Notices of the Royal Astronomical Society, 455, 987
- Corsaro & De Ridder (2014) Corsaro, E., & De Ridder, J. 2014, Astronomy and Astrophysics, 571, A71
- da Silva et al. (2015) da Silva, R., Milone, A. d. C., & Rocha-Pinto, H. J. 2015, Astronomy and Astrophysics, 580, A24
- Davies et al. (2016) Davies, G. R., Silva Aguirre, V., Bedding, T. R., et al. 2016, Monthly Notices of the Royal Astronomical Society, 456, 2183
- Flower (1996) Flower, P. J. 1996, ApJ, 469, 355
- Gaia Collaboration et al. (2018) Gaia Collaboration, Katz, D., Antoja, T., et al. 2018, Astronomy and Astrophysics, 616, A11
- Gaulme et al. (2009) Gaulme, P., Appourchaux, T., & Boumier, P. 2009, Astronomy and Astrophysics, 506, 7
- Handberg & Lund (2014) Handberg, R., & Lund, M. N. 2014, Monthly Notices of the Royal Astronomical Society, 445, 2698
- Hekker et al. (2010) Hekker, S., Broomhall, A.-M., Chaplin, W. J., et al. 2010, MNRAS, 402, 2049
- Hekker et al. (2012) Hekker, S., Elsworth, Y., Mosser, B., et al. 2012, A&A, 544, A90
- Høg et al. (2000) Høg, E., Fabricius, C., Makarov, V. V., et al. 2000, Astronomy and Astrophysics, 355, L27
- Hon et al. (2018) Hon, M., Stello, D., & Yu, J. 2018, Monthly Notices of the Royal Astronomical Society, 476, 3233
- Houk (1994) Houk, N. 1994, The MK process at 50 years. A powerful tool for astrophysical insight Astronomical Society of the Pacific Conference Series, 60, 285
- Huber et al. (2009) Huber, D., Stello, D., Bedding, T. R., et al. 2009, Communications in Asteroseismology, 160, 74
- Jenkins et al. (2016) Jenkins, J. M., Twicken, J. D., McCauliff, S., et al. 2016, in Proc. SPIE, Vol. 9913, Software and Cyberinfrastructure for Astronomy IV, 99133E, doi: 10.1117/12.2233418
- Jofré et al. (2015) Jofré, E., Petrucci, R., Saffe, C., et al. 2015, Astronomy and Astrophysics, 574, A50
- Jones et al. (2011) Jones, M. I., Jenkins, J. S., Rojo, P., & Melo, C. H. F. 2011, Astronomy and Astrophysics, 536, A71
- Kallinger et al. (2012) Kallinger, T., Hekker, S., Mosser, B., et al. 2012, A&A, 541, 51
- Luck (2015) Luck, R. E. 2015, The Astronomical Journal, 150, 88
- Lund et al. (2015) Lund, M. N., Handberg, R., Davies, G. R., Chaplin, W. J., & Jones, C. D. 2015, The Astrophysical Journal, 806, 30
- Mackereth et al. (2019) Mackereth, J. T., Bovy, J., Leung, H. W., et al. 2019, Monthly Notices of the Royal Astronomical Society, 489, 176
- Mathur et al. (2010) Mathur, S., García, R. A., Régulo, C., et al. 2010, A&A, 511, 46
- Meléndez et al. (2008) Meléndez, J., Asplund, M., Alves-Brito, A., et al. 2008, Astronomy and Astrophysics, 484, L21
- Miglio et al. (2009) Miglio, A., Montalbán, J., Baudin, F., et al. 2009, A&A, 503, L21, doi: 10.1051/0004-6361/200912822
- Miglio et al. (2013) Miglio, A., Chiappini, C., Morel, T., et al. 2013, Monthly Notices of the Royal Astronomical Society, 429, 423
- Mints & Hekker (2018) Mints, A., & Hekker, S. 2018, Astronomy and Astrophysics, 618, A54
- Mosser et al. (2011) Mosser, B., Elsworth, Y., Hekker, S., et al. 2011, Astronomy and Astrophysics, 537, A30
- Pinsonneault et al. (2018) Pinsonneault, M. H., Elsworth, Y. P., Tayar, J., et al. 2018, The Astrophysical Journal Supplement Series, 239, 32
- Randich et al. (1999) Randich, S., Gratton, R., Pallavicini, R., Pasquini, L., & Carretta, E. 1999, Astronomy and Astrophysics, 348, 487
- Ricker et al. (2015) Ricker, G. R., Winn, J. N., Vanderspek, R., et al. 2015, Journal of Astronomical Telescopes, 1, 014003
- Rodrigues et al. (2017) Rodrigues, T. S., Bossini, D., Miglio, A., et al. 2017, Monthly Notices of the Royal Astronomical Society, 467, 1433
- Sharma et al. (2019) Sharma, S., Stello, D., Bland-Hawthorn, J., et al. 2019, arXiv e-prints, arXiv:1904.12444. https://arxiv.org/abs/1904.12444
- Silva Aguirre et al. (2015) Silva Aguirre, V., Davies, G. R., Basu, S., et al. 2015, Monthly Notices of the Royal Astronomical Society, 452, 2127
- Silva Aguirre et al. (2018) Silva Aguirre, V., Bojsen-Hansen, M., Slumstrup, D., et al. 2018, Monthly Notices of the Royal Astronomical Society, 475, 5487
- Silva Aguirre et al. (2019) Silva Aguirre, V., Christensen-Dalsgaard, J., Cassisi, S., et al. 2019, arXiv e-prints, arXiv:1912.04909. https://arxiv.org/abs/1912.04909
- Stello et al. (2011) Stello, D., Meibom, S., Gilliland, R. L., et al. 2011, ApJ, 739, 13
- Stello et al. (2013) Stello, D., Huber, D., Bedding, T. R., et al. 2013, ApJ, 765, L41
- Stello et al. (2017) Stello, D., Zinn, J., Elsworth, Y., et al. 2017, The Astrophysical Journal, 835, 83
- Van Leeuwen (2007) Van Leeuwen, F. 2007, A&A, 474, 653
- Wittenmyer et al. (2016) Wittenmyer, R. A., Liu, F., Wang, L., et al. 2016, The Astronomical Journal, 152, 19
- Yıldız et al. (2019) Yıldız, M., Çelik Orhan, Z., & Kayhan, C. 2019, Monthly Notices of the Royal Astronomical Society, 489, 1753
- Yu et al. (2018) Yu, J., Huber, D., Bedding, T. R., et al. 2018, The Astrophysical Journal Supplement Series, 236, 42
- Zinn et al. (2019) Zinn, J. C., Stello, D., Huber, D., & Sharma, S. 2019, arXiv e-prints, arXiv:1909.11927. https://arxiv.org/abs/1909.11927
| TIC | HIP | [Fe/H] | TIC | R | M | Age | Atmospheric Properties | ||||
|---|---|---|---|---|---|---|---|---|---|---|---|
| (Hz) | (Hz) | (mag) | (K) | (dex) | (R☉) | (M☉) | (Gyr) | ||||
| 13097379 | 114842 | \textLuck (2015) | |||||||||
| 38574220 | 19805 | – | – | – | – | – | – | ||||
| 38828538 | 21253 | \textAlves et al. (2015) | |||||||||
| 39082723 | 4293 | \textAlves et al. (2015) | |||||||||
| 47424090 | 112612 | – | – | – | – | – | – | ||||
| 70797228 | 655 | \textJones et al. (2011) | |||||||||
| 77116701 | 103071 | – | – | – | – | – | – | ||||
| 111750740 | 113148 | \textWittenmyer et al. (2016) | |||||||||
| 115011683 | 103836 | \textWittenmyer et al. (2016) | |||||||||
| 129649472 | 105854 | \textJofré et al. (2015) | |||||||||
| 139756492 | 106566 | – | – | – | – | – | – | ||||
| 141280255 | 25918 | \textMeléndez et al. (2008) | |||||||||
| 144335025 | 117075 | – | – | – | – | – | – | ||||
| 149347992 | 26190 | \textRandich et al. (1999) | |||||||||
| 155940286 | 1766 | \textWittenmyer et al. (2016) | |||||||||
| 175375523 | 114775 | \textJones et al. (2011) | |||||||||
| 183537408 | 117659 | – | – | – | – | – | – | ||||
| 204313960 | 113801 | \textRandich et al. (1999) | |||||||||
| 220517490 | 12871 | \textAlves et al. (2015) | |||||||||
| 237914586 | 17440 | – | – | – | – | – | – | ||||
| 270245797 | 109584 | \textAlves et al. (2015) | |||||||||
| 281597433 | 2789 | \textRandich et al. (1999) | |||||||||
| 439399563 | 343 | \textda Silva et al. (2015) | |||||||||
| 441387330 | 102014 | \textJones et al. (2011) |
Note. — Last column gives the reference from which we retrieved the central values of and [Fe/H] used for the grid-based modelling. Their uncertainties have been homogenised to 80 K and 0.08 dex, respectively (see Section 4).