Implications for HIV elimination by 2030 of recent trends in undiagnosed infection in England: an evidence synthesis
Abstract
Background:
A target to eliminate Human Immuno-deficiency Virus (HIV) transmission in England by 2030 was set in early 2019. Estimates of recent trends in HIV prevalence, particularly the number of people living with undiagnosed HIV, by exposure group, ethnicity, gender, age group and region, are essential to monitor progress towards elimination.
Methods:
A Bayesian synthesis of evidence from multiple surveillance, demographic and survey datasets relevant to HIV in England is employed to estimate trends in: the number of people living with HIV (PLWH); the proportion of these people unaware of their HIV infection; and the corresponding prevalence of undiagnosed HIV. All estimates are stratified by exposure group, ethnicity, gender, age group (15-34, 35-44, 45-59, 60-74), region (London, outside London) and year (2012-2017).
Findings:
The total number of PLWH aged 15-74 in England increased from 82,400 (95% credible interval, CrI, 78,700 to 89,100) in 2012 to 89,500 (95% CrI 87,400 to 93,300) in 2017. The proportion diagnosed steadily increased from 84% (95% CrI 77 to 88%) to 92% (95% CrI 89 to 94%) over the same time period, corresponding to a halving in the number of undiagnosed infections from 13,500 (95% CrI 9,800 to 20,200) to 6,900 (95% CrI 4,900 to 10,700). This decrease is equivalent to a halving in prevalence of undiagnosed infection and is reflected in all sub-groups of gay, bisexual and other men who have sex with men and most sub-groups of black African heterosexuals. However, decreases were not detected for some sub-groups of other ethnicity heterosexuals, particularly outside London.
Interpretation:
In 2016, the Joint United Nations Programme on HIV/ AIDS target of diagnosing 90% of people living with HIV was reached in England. To achieve HIV elimination by 2030, current testing efforts should be enhanced to address the numbers of heterosexuals living with undiagnosed HIV, especially outside London.
1 Introduction
Early diagnosis of Human Immuno-deficiency Virus (HIV) infection and access to anti-retroviral therapy (ART) can prevent onward transmission 1. Regular assessment of the burden of HIV is essential for evaluation of public health policies aimed at reducing transmission, such as “ Treatment as Prevention (TasP)” 2; 3; 4 and pre-exposure prophylaxis (PrEP) 5. Knowledge of the number and proportion of HIV infections remaining undiagnosed is crucial for monitoring progress towards elimination of HIV transmission by 2030 3. Since undiagnosed cases are inherently unobservable, these quantities must be estimated.
Annual United Kingdom (UK) estimates of HIV prevalence, both diagnosed and undiagnosed, the number of people living with HIV (PLWH) and the proportions of infections that are diagnosed are published 6 for gay, bisexual and other men who have sex with men (MSM), people who inject drugs (PWID), and heterosexual individuals of both black African and other ethnicity (as self-reported to the UK Census of 2011 7). The estimates are the yardstick for measuring the UK’s progress towards the first Joint United Nations Programme on HIV/AIDS (UNAIDS) 90-90-90 target, i.e. 90% of HIV infections diagnosed, and for informing HIV testing guidelines 8; 9 and prevention campagins 10; 11. Since 2005, these estimates of HIV prevalence, seen as cross-sectional “snapshots” of the state of the epidemic, have been derived through a “ Multi-Parameter Evidence Synthesis (MPES)”, a statistical approach combining and triangulating multiple sources of surveillance and survey data 12; 13. Data on exposure group sizes, numbers diagnosed and in care, and HIV prevalence from prevalence surveys and testing data, are synthesised to estimate the undiagnosed fraction. As both the epidemic and the available data sources have changed over time 6, the MPES model has also evolved structurally since its creation, to make greater and more efficient use of the available data.
This paper presents a major extension to our MPES model that integrates sequential cross-sectional estimates to produce trends (with credible intervals) from 2012-2017 in HIV prevalence and the number undiagnosed, by route of probable exposure (exposure group), ethnicity, gender, age and region.
2 Methods
The adult population of England in the years 2012 to 2017 was stratified by exposure group and ethnicity (MSM; PWID; black African heterosexuals; other ethnicity heterosexuals); gender (men, women); age (15-34, 35-44, 45-59, 60-74); and region (London, England outside London). The MSM and heterosexual exposure groups are further sub-divided by whether or not they had attended a sexual health clinic in the last year for a sexually transmitted infection (STI)-related need (“recent clinic attendee”). PWID are stratified by whether or not they had injected drugs in the last year.
2.1 Multi-parameter evidence synthesis
To estimate HIV prevalence in each stratum, data are combined with prior assumptions, in a Bayesian model that encodes the relationships between the data from each source and the quantities to be estimated. The MPES approach 12; 13 consists of: defining the key quantities (‘basic parameters’) to be estimated, with any prior knowledge of these quantities summarised in a prior distribution; relating mathematically the quantities (‘functional parameters’) directly informed by each data source to the basic parameters, defining the likelihood of the data ; updating the prior distribution with our current knowledge, summarised by the likelihood, to obtain a posterior distribution of all basic and functional parameters, that summarises all uncertainty in both data and parameters. Any unobserved functional parameters of interest are also derived as functions of the basic parameters. This method ensures that resulting estimates are consistent with all included data and model assumptions. We use Markov chain Monte Carlo to draw samples from the posterior distribution, summarised by their median and a credible interval ( credible interval (CrI)) defined by the and percentiles. Posterior probabilities of either an increase or decrease over 2012-2017 in each outcome are also calculated, as the proportion of posterior samples that are greater/smaller in 2017 compared to 2012. All analyses were carried out in R version 3.4.4, rstan and Stan 14.
2.2 Model
We estimate three basic parameters for each stratum defined by age group , gender , region and year :
Given knowledge of these three basic parameters per stratum, any functional parameter can be derived by defining it in terms of the basic parameters. The key functional parameters are: the number of PLWH in each stratum, , where is the total population in stratum , obtained from Office for National Statistics (ONS) data; the number of undiagnosed infections, ; and the corresponding prevalence of undiagnosed infection, .
2.3 Data and model assumptions
A substantial range of evidence is available in England to inform both exposure group sizes and HIV prevalence, either directly or indirectly. Here we summarise the data and their relationships to the parameters, while full details and a schematic diagram of the model are given in the Appendix.
Group sizes
Estimates of the size of the total population of England, by age, gender and region strata , are available from the ONS, for each year 15. The 2011 Census 7 provides information on the proportions of the population self-reporting their ethnicity (black African or any other ethnicity). These proportions are applied to the heterosexual (non-MSM, non-PWID) group each year, to derive the annual distributions by ethnicity of the heterosexual groups.
Survey-weighted estimates of the proportion of men who are MSM, by age and region, are available from the National Survey of Sexual Attitudes and Lifestyles (NATSAL), a national stratified probability sample from 2011 16.
Information on PWID population sizes, both current and ex, is available from previous studies, based on data from 2005-2012 17; 18; 19. Group sizes are therefore estimated for 2012, and are assumed not to change over time.
The sizes of the sub-groups of MSM and heterosexuals by ethnicity who have attended a sexual health service (SHS) for a STI-related need in the last year, for each year 2012-2017, are directly available from the GUMCAD STI surveillance system, a disaggregated, pseudonymised data return submitted by all commissioned SHSs across England 20.
Table 2 of the Appendix gives details of the group size parameters, their prior distributions or functional forms, and which datasets inform them.
Prevalence in clinic-attending groups
The SHS data provide indirect evidence on HIV prevalence, both diagnosed and undiagnosed, in the clinic-attending groups for each year 2012-2017. Four components of HIV prevalence can be derived from the clinic data combined with model assumptions: previously diagnosed prevalence (); newly diagnosed prevalence (); prevalence of undiagnosed infection in those not offered a HIV test (); and prevalence of undiagnosed infection in those opting out of a HIV test () (Table 3 of the Appendix). The diagnosed components are directly observed, whereas the undiagnosed prevalences are estimated by relating them to newly diagnosed prevalence.
Undiagnosed prevalence in MSM
The Gay Men’s Sexual Health Survey (GMSHS) 21 samples MSM at community venues in London every 2-3 years. Participants are offered a HIV test and asked about recent sexual health service attendance and any previous HIV diagnosis. Since GMSHS participants may be higher risk than average MSM, this source provides over-estimates of HIV prevalence in all MSM. The data are therefore used indirectly, to inform the odds ratio of (previously) undiagnosed prevalence in recent clinic-attending vs non-clinic-attendingMSM (Table 3 of the Appendix).
Prevalence and proportion diagnosed in PWID
The Unlinked Anonymous Monitoring (UAM) 22 annual survey of PWID recruits attendees at needle exchanges, methadone treatment and other drug services and involves a (self-reported) questionnaire and dried blood spot, which is tested for HIV antibodies. The survey provides information on both HIV prevalence, , and the proportion of PWID who have ever had a HIV diagnosis, , for each year 2012-2017. The sampled population is assumed to represent current PWID.
Previously undiagnosed prevalence in women
The National Study of HIV in Pregnancy and Childhood (NSHPC) 23 is an annual register of all HIV diagnoses among pregnant women. The observed number of diagnoses occurring during current pregnancies are combined with data from ONS on the annual number of live births 24, to indirectly inform previously undiagnosed prevalence in non-PWID women under 45 years of age (Table 4 of the Appendix), stratified by ethnicity, age and region.
Proportion diagnosed in black African heterosexuals
The African Health and Sex Survey (AHSS) 25, carried out across England in 2014, provides information on the proportion of African PLWH who self-report ever having had a HIV test, . As this proportion does not directly inform proportions aware of their infection status, we instead use the data indirectly, to inform the male-to-female odds ratio of the proportion diagnosed (Table 4 of the Appendix).
Prevalence in the lowest risk group
The National Health Service Blood and Transplant (NHSBT) and Public Health England (PHE) carry out blood-borne virus testing among blood donors, a population considered at very low risk of HIV infection, by gender, region and age 26. The HIV prevalence in blood donors, , from the NHSBT data are therefore used indirectly, to inform the male-to-female odds ratio of prevalence in heterosexuals who are not recent clinic attendees (Table 4 of the Appendix).
Numbers diagnosed
The HIV/AIDS Reporting System (HARS) 27 is a comprehensive surveillance system recording all new HIV diagnoses, as well as regular follow-up reports on the clinical status of all diagnosed HIV-positive patients attending HIV outpatient services for clinical care. Due to the very high retention in care of HIV patients in the UK, the HARS data provide a complete yearly snapshot of the number of people living with diagnosed HIV in the UK, by ethnicity, age, gender, region and year; as well as the probable HIV exposure group distribution of these individuals (Table 5 of the Appendix).
Borrowing strength across strata
As the spread of available data across different strata is uneven, we “borrow strength” from exposure-ethnicity-gender-age-region-year strata with more data to smooth and increase precision in estimates of both HIV prevalence and the proportion diagnosed for strata with fewer data sources. This is achieved via a hierarchical random effects model that assumes that the log-odds ratios of prevalence and proportion diagnosed in non-clinic-attending groups versus clinic-attending groups might plausibly be thought similar, but not exactly equal, across strata. Smoothing of trends in the log-odds ratios across years is achieved by also linking years hierarchically.
3 Results
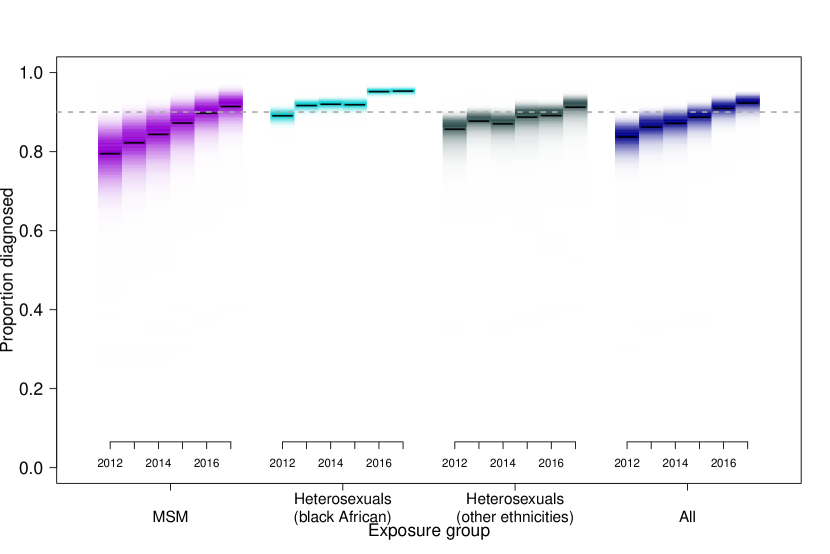
The estimated number of PLWH in England aged 15-74 who were unaware of their infection decreased from 13,500 (95% CrI 9,800 to 20,200) in 2012 to 6,900 (95% CrI 4,900 to 10,700) in 2017, posterior probability of a decrease , Table 1). This decrease corresponded to a halving in the prevalence of undiagnosed infection from 0.34 (95% CrI 0.25 to 0.51) to 0.17 (95% CrI 0.12 to 0.26) per 1,000 population over the five-year period. The decreases in numbers undiagnosed and undiagnosed prevalence are notably greater in London than outside London (Table 1), demonstrated by the consistently lower posterior probabilities of a decrease. An increase in the number of people living with diagnosed HIV resulted in the total number of PLWH increasing from 82,400 (95% CrI 78,700 to 89,100) to 89,500 (95% CrI 87,400 to 93,300, ) in 2012-2017. The percentage diagnosed in the overall population therefore steadily increased from 84% (95% CrI 77 to 88%) in 2012 to 92% (95% CrI 89 to 94%) in 2017, reaching the UNAIDS 90% diagnosed target in 2016, and even earlier in 2013 for black African heterosexuals (Figure 1).
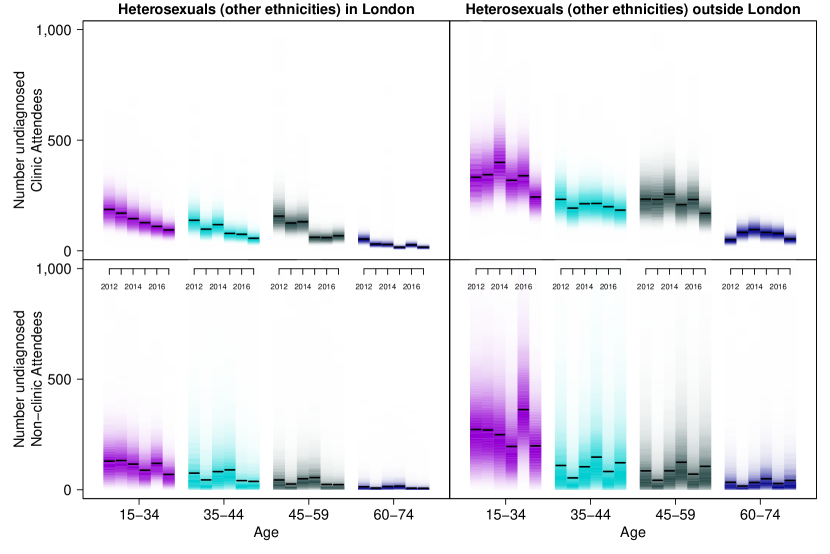
A closer look at each sub-group reveals considerable variability in the pace of reduction of undiagnosed infections (Table 1 and Figure 5 of the Appendix). While the 90% target was achieved for most sub-groups by 2017, including both black African and other ethnicity heterosexuals overall, the target has yet to be reached for other ethnicity heterosexuals outside London who were recent clinic attendees. Moreover, there is less evidence of an increase in the percentage diagnosed for this sub-group, as reflected by the uncertainty in the estimates of the number unaware of their HIV infection (Figure 2). In total the numbers of other ethnicity heterosexuals living with undiagnosed HIV reduced from 2,300 (95% CrI 1,700 to 4,000) to 1,600 (95% CrI 1,100 to 3,200, ) over 2012-2017 – with a corresponding drop in prevalence of undiagnosed infection from 0.059 (95% CrI 0.044 to 0.104) to 0.040 (95% CrI 0.027 to 0.082) per 1,000 population (Table 1). However, such a decrease was not discernible in the two older age groups outside London, particularly in those who were not clinic attendees (Table 2). Indeed, in general, posterior probabilities of a decrease were lower for those who had not recently attended a clinic than for those who had. Despite evidence for decreases in the numbers of undiagnosed PLWH among clinic-attending other ethnicity heterosexuals, in terms of undiagnosed prevalence (Table 2), the rates remained much larger for clinic-attendees than for non-attendees.
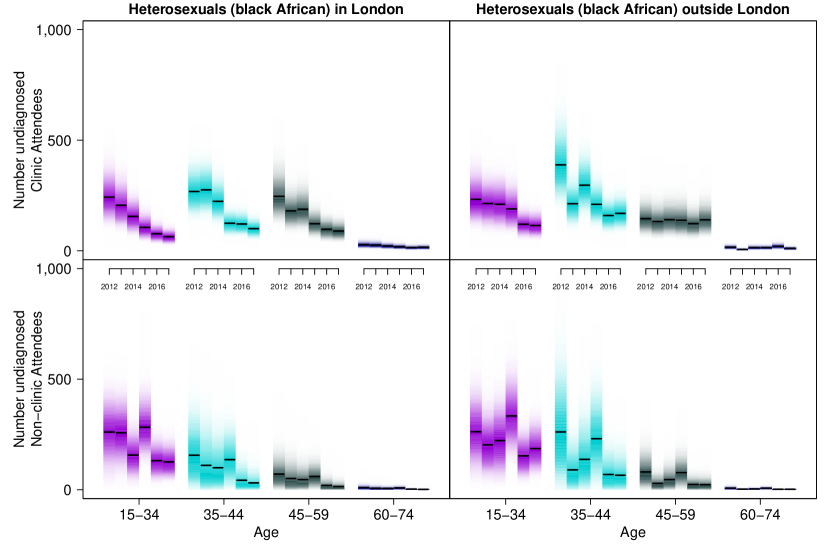
Progress in reducing the undiagnosed pool of infection among black African heterosexuals was more evident than for other heterosexuals (Figure 3), particularly in London. In total, the decrease in black African heterosexuals unaware of their HIV infection was pronounced over 2012-2017, from 2,700 (95% CrI 2,200 to 3,400) to 1,200 (95% CrI 1,000 to 1,500, ), corresponding to a halving in the prevalence of undiagnosed infection from 4.0 (95% CrI 3.3 to 4.9) to 1.7 (95% CrI 1.4 to 2.2) per 1,000 population (Table 1). However, for the sub-group of clinic-attending black African heterosexuals aged 45-59 outside London, there was little evidence of a decrease in numbers undiagnosed (Figure 3, ). In contrast, the size of this 45-59 sub-group increased over the same time period, from 3,200 (95% CrI 3,000 to 3,300) to 4,900 (95% CrI 4,800 to 5,000) attending a clinic for STI-related needs. Taking this change in denominator into account, the decrease in prevalence of undiagnosed infection in this group was estimated to be from 46 (95% CrI 27 to 76) to 29 (95% CrI 17 to 47) per 1,000 population over 2012-2017.
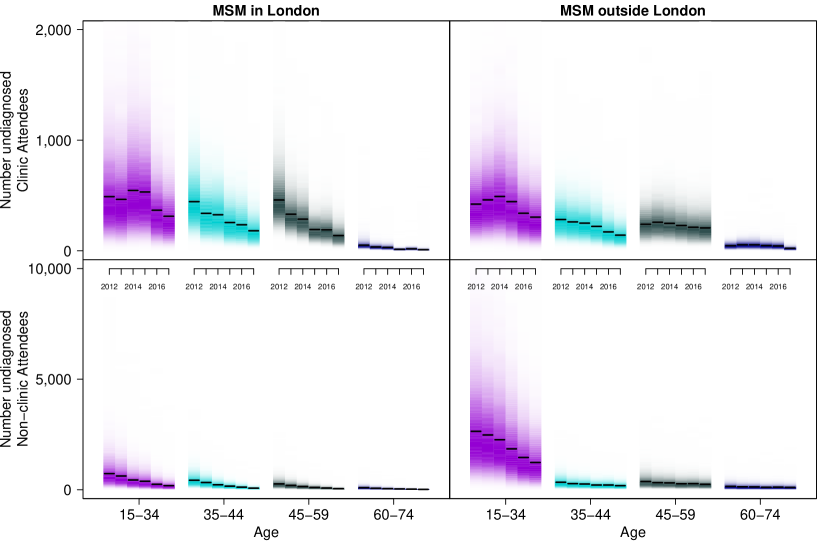
The decrease in numbers undiagnosed was notable in all sub-groups of MSM (Figure 4), with the total more than halving from 8,100 (95% CrI 4,700 to 14,800) in 2012 to 3,800 (95% CrI 2,100 to 7,300) in 2017 (, Table 1). The corresponding prevalence of undiagnosed infection dropped from 16.0 (95% CrI 9.3 to 28.8) to 7.2 (95% CrI 3.9 to 13.8) per 1,000 population. Also, the decrease was more pronounced for all MSM, in London () compared to outside London (, Figure 4). The numbers undiagnosed were largest, but also most uncertain, amongst the 15-34 age group, with posterior probabilities of a decrease lowest in the clinic-attending sub-group ( in London, outside London). The disparity in trends between areas was greatest among 45-59 year olds, with posterior probabilities of a decrease estimated to be in London, but only outside London.
Due to small sample sizes, estimates of the number of PWID living with undiagnosed HIV are uncertain, with low posterior probability () of any decrease over 2012-2017 (Table 1). For all heterosexuals, trends in the number of PLWH unaware of their infection were similar for men and women (Figures 6 and 7 in the Appendix). Overall, PLWH were an ageing population in 2012-2017, with the prevalent burden concentrated in the 45-59 age group (Figure 8 of the Appendix).
4 Discussion
MSM, PWID and black African heterosexuals remain disproportionately affected by undiagnosed HIV infection per population in 2017 (Table 1). However, we have demonstrated remarkable decreases from 2012 to 2017 in the prevalence of HIV in these groups and the first 90 of the UNAIDS 90-90-90 targets was met in 2016 among the population aged 15-74 in England. The number of PLWH unaware of their infection halved to 6,900 (95% CrI 4,900 to 10,700) over the study period, with comparable reductions estimated in all MSM and most black African heterosexual sub-groups. However, there are three less encouraging findings from our analysis. First, the number undiagnosed outside London is not decreasing as fast as in London. Second, trends in numbers undiagnosed were too uncertain in other ethnicity heterosexuals who were not recent sexual health clinic attendees to draw definitive conclusions. Finally, the numbers of recent clinic-attending other ethnicity heterosexuals living with undiagnosed HIV are of comparable absolute magnitude to those who had not recently attended a clinic. This implies many opportunities for testing are being missed in clinic attendees. Indeed, the latest PHE report on HIV testing 28 found that of eligible clinic attendees who were not either MSM, black African or born in a high prevalence country, the proportion who were declining a HIV test had increased over the previous five years, to 27% in 2016.
This analysis used the most recent available datasets to provide estimates of the latest trends in the HIV epidemic in England. A key strength of our MPES approach is the continued and improved ability to estimate the unobserved burden of HIV, and in particular, to quantify temporal changes, which are critical to prioritising policies and monitoring progress towards HIV elimination 8; 9; 10; 11. Our estimates rely on model assumptions necessary to identify unobservable quantities, including: relating undiagnosed prevalence to the proportion of HIV tests giving new diagnoses; and smoothing constraints to address data sparsity. These assumptions are judged plausible, particularly as robustness is ensured by appropriately allowing for uncertainty: an example is the modelling of the dynamic nature of prevalence estimated from the sexual health clinic data within each year, assumed to lie between start- and end-year prevalences.
A consequence of both the epidemic and available data sources evolving over time is the continuing adaptation of the MPES model. One outstanding issue is that the opiate-using population, including PWID, is thought to be an ageing population 29, so that the age-gender distribution assumed may be outdated. However, given the low and uncertain estimates of absolute numbers of PLWH among PWID, our estimates are relatively robust to this ageing. Changes in migration and other population patterns may also have occurred such that group sizes have changed since the ONS Census and the NATSAL survey were carried out in 2011. Newer data sources are therefore being sought to supplement the evidence base in more recent years, with accompanying model development to make better, more efficient use of existing and new data sources. This ongoing work includes: a new round of the NATSAL survey in 2020/21 (www.natsal.ac.uk/online-consultation/background-to-natsal-4.aspx); updating estimates of the PWID population size; incorportion of information from community and online surveys 30; 31; and extending the MPES model to datasets collected by the other UK nations.
Other approaches have been used to estimate trends in the number of undiagnosed HIV infections in the UK. First, the CD4-staged “back-calculation” approach 32; 33, also a Bayesian evidence synthesis, based on different data sources, is used annually to estimate and monitor HIV incidence in MSM 6. The corresponding estimates of the number undiagnosed are consistent with our MPES estimates and both approaches provide complementary pictures of the HIV epidemic in MSM in England. Another approach is transmission modelling 34; 35, aimed at forecasting both the epidemic and the effects of different possible interventions, particularly in the MSM population . Estimates of the number of PLWH resulting from these transmission models are broadly consistent with our estimates. The UNAIDS EPP/Spectrum software for estimating HIV prevalence, incidence and mortality curves 36 , are also based on modelling transmission and demographic dynamics, but in contrast to the MPES approach, do not provide estimates of undiagnosed HIV prevalence.
Our estimates have important implications for efforts to eliminate HIV transmission in England, especially the challenge of diagnosing HIV infections in other ethnicity heterosexuals. Compared to black African heterosexuals, there are now probably more undiagnosed HIV infections in other ethnicity heterosexuals, especially so outside of London. Moreover, the rate of decrease of undiagnosed HIV infections in other ethnicity heterosexuals who are not recent sexual health clinic attendees is the slowest of all. This might be expected, given members of this population sub-set may have no particular reason to consider themselves at HIV risk – if they did, then they could be expected to attend a clinic for a test. On the other hand, since undiagnosed HIV prevalence in other ethnicity heterosexuals who are recent clinic attendees is almost 40 times greater than in those who are not (Table 2), the priority must be to ensure all of these have an HIV test, rather than the 27% that currently do so 28. As all clinic attendees living with HIV become diagnosed, improved partner notification 37 is likely to accelerate reducing the undiagnosed fraction in the wider population, making the prospect of HIV elimination increasingly likely.
Acknowledgements
The authors thank Dr Stefano Conti (NHS England), Louise Logan, Dr Stephanie Migchelsen, Katy Davison, Sarika Desai, Cuong Chau, Zheng Yin, Martina Furegato, Sophie Nash, Dr Nicky Connor (PHE), Prof. Cath Mercer (UCL), Dr Ford Hickson (LSHTM, Sigma Research) and Prof. Claire Thorne (UCL ICH) for providing data and constructive discussion. Acknowledgements are also due to all participants of a stakeholder engagement event, whose contributions to the discussions informed model developments aimed at making greater and more efficient use of available data. The event, held at London School of Hygiene and Tropical Medicine in 2016, was co-ordinated by Catherine Dodds (LSHTM and Sigma Research), Deborah Gold (National AIDS Trust), Valerie Delpech (PHE) and Daniela De Angelis (MRC Biostatistics Unit).
Contributors
AMP, DDA, ONG and VD conceived and designed the study. PK, SC, AM, HM, EH and AB collated the data and undertook exploratory data analysis. AMP independently verified all collated data, undertook the primary analysis, and drafted the manuscript. AMP, RH and CJ contributed to model development and coding, in discussion and consultation with all other authors. All authors contributed to subsequent iterations of the manuscript, provided critical input on the manuscript and approved the final version for publication. AMP is guarantor. The corresponding author attests that all listed authors meet authorship criteria and that no others meeting the criteria have been omitted.
Funding
AMP, CJ and DDA were funded by the UK Medical Research Council programme MRC_MC_UU_00002/11. DDA was additionally funded by Public Health England. PK, AM, SC, RH, EH, HM, AB, VD and ONG were employed by Public Health England. Funders did not have any role in the study design; the collection, analysis, and interpretation of data; the writing of the report; or the decision to submit the article for publication. AMP and DDA had access to the Public Health England data under honorary contracts with Public Health England, and all authors had full access to all of the data in the study and can take responsibility for the integrity of the data and the accuracy of the data analysis.
Data sharing
Relevant data on which this analysis is based are available on request to Public Health England in accordance with Public Health England’s HIV/STI Data Sharing Policy at https://www.gov.uk/government/publications/hiv-and-sti-data-sharing-policy. All requests for data access will need to specify the planned use of data and will require approval from Public Health England before release.
| Number unaware of their HIV infection | Undiagnosed prevalence per 100,000 population | |||||||||||||
| 2012 | 2017 | 2012 | 2017 | |||||||||||
| Exposure group | Region | Median | 95% CrI | Median | 95% CrI | Median | 95% CrI | Median | 95% CrI | |||||
| MSM | London | 3,226 | ( 1,765 - | 6,216 ) | 1,062 | ( 532 - | 2,238 ) | 0.99 | 2,253 | ( 1,239 - | 4,304 ) | 695 | ( 352 - | 1,472 ) |
| Outside London | 4,726 | ( 2,192 - | 10,683 ) | 2,649 | ( 1,190 - | 5,909 ) | 0.85 | 1,301 | ( 607 - | 2,874 ) | 706 | ( 321 - | 1,564 ) | |
| England | 8,140 | ( 4,741 - | 14,812 ) | 3,784 | ( 2,075 - | 7,317 ) | 0.96 | 1,605 | ( 931 - | 2,880 ) | 717 | ( 394 - | 1,376 ) | |
| PWID | London | 50 | ( 17 - | 121 ) | 70 | ( 21 - | 176 ) | 0.32 | 353 | ( 121 - | 851 ) | 476 | ( 145 - | 1,201 ) |
| Outside London | 66 | ( 23 - | 155 ) | 107 | ( 34 - | 266 ) | 0.24 | 66 | ( 23 - | 157 ) | 106 | ( 33 - | 269 ) | |
| England | 117 | ( 42 - | 272 ) | 179 | ( 58 - | 425 ) | 0.26 | 103 | ( 37 - | 239 ) | 155 | ( 50 - | 373 ) | |
| heterosexuals (black African) | London | 1,305 | ( 1,035 - | 1,665 ) | 460 | ( 348 - | 623 ) | 1.00 | 327 | ( 259 - | 417 ) | 110 | ( 83 - | 149 ) |
| Outside London | 1,426 | ( 1,096 - | 1,857 ) | 735 | ( 566 - | 964 ) | 1.00 | 503 | ( 387 - | 654 ) | 258 | ( 199 - | 339 ) | |
| England | 2,738 | ( 2,232 - | 3,363 ) | 1,198 | ( 962 - | 1,520 ) | 1.00 | 401 | ( 327 - | 493 ) | 171 | ( 137 - | 217 ) | |
| heterosexuals (other ethnicities) | London | 841 | ( 595 - | 1,475 ) | 399 | ( 263 - | 832 ) | 0.97 | 15 | ( 10 - | 26 ) | 7 | ( 4 - | 14 ) |
| Outside London | 1,413 | ( 991 - | 2,681 ) | 1,170 | ( 768 - | 2,517 ) | 0.71 | 4 | ( 3 - | 8 ) | 3 | ( 2 - | 7 ) | |
| England | 2,257 | ( 1,680 - | 4,010 ) | 1,572 | ( 1,081 - | 3,247 ) | 0.86 | 6 | ( 4 - | 10 ) | 4 | ( 3 - | 8 ) | |
| all heterosexuals | London | 2,170 | ( 1,766 - | 2,869 ) | 871 | ( 673 - | 1,324 ) | 1.00 | 35 | ( 29 - | 47 ) | 13 | ( 10 - | 20 ) |
| Outside London | 2,866 | ( 2,282 - | 4,200 ) | 1,920 | ( 1,458 - | 3,267 ) | 0.93 | 9 | ( 7 - | 13 ) | 6 | ( 4 - | 10 ) | |
| England | 5,038 | ( 4,196 - | 6,854 ) | 2,795 | ( 2,199 - | 4,470 ) | 0.99 | 13 | ( 11 - | 17 ) | 7 | ( 5 - | 11 ) | |
| Total | London | 5,500 | ( 3,922 - | 8,525 ) | 2,046 | ( 1,434 - | 3,297 ) | 1.00 | 87 | ( 62 - | 135 ) | 31 | ( 22 - | 50 ) |
| Outside London | 7,760 | ( 5,062 - | 13,706 ) | 4,791 | ( 3,128 - | 8,213 ) | 0.92 | 23 | ( 15 - | 41 ) | 14 | ( 9 - | 24 ) | |
| England | 13,452 | ( 9,813 - | 20,184 ) | 6,913 | ( 4,921 - | 10,727 ) | 0.99 | 34 | ( 25 - | 51 ) | 17 | ( 12 - | 26 ) | |
| Number unaware of their HIV infection | Undiagnosed prevalence per 100,000 population | ||||||||||||||
| 2012 | 2017 | 2012 | 2017 | ||||||||||||
| Exposure group | Age | Region | Median | 95% CrI | Median | 95% CrI | Median | 95% CrI | Median | 95% CrI | |||||
| Recent clinic-attending heterosexuals (other ethnicities) | 15-34 | London | 187 | ( 113 - | 308 ) | 95 | ( 56 - | 156 ) | 0.97 | 80 | ( 48 - | 132 ) | 40 | ( 24 - | 66 ) |
| Outside London | 333 | ( 210 - | 523 ) | 244 | ( 162 - | 364 ) | 0.85 | 57 | ( 36 - | 90 ) | 34 | ( 23 - | 51 ) | ||
| England | 527 | ( 361 - | 759 ) | 341 | ( 243 - | 475 ) | 0.96 | 64 | ( 44 - | 93 ) | 36 | ( 26 - | 50 ) | ||
| 35-44 | London | 138 | ( 81 - | 242 ) | 57 | ( 31 - | 108 ) | 0.98 | 319 | ( 187 - | 558 ) | 117 | ( 64 - | 223 ) | |
| Outside London | 233 | ( 146 - | 376 ) | 184 | ( 116 - | 292 ) | 0.76 | 247 | ( 155 - | 398 ) | 144 | ( 91 - | 229 ) | ||
| England | 378 | ( 262 - | 548 ) | 244 | ( 167 - | 360 ) | 0.95 | 275 | ( 190 - | 398 ) | 139 | ( 95 - | 205 ) | ||
| 45-59 | London | 157 | ( 94 - | 283 ) | 68 | ( 39 - | 116 ) | 0.99 | 745 | ( 445 - | 1,340 ) | 320 | ( 186 - | 544 ) | |
| Outside London | 234 | ( 140 - | 394 ) | 169 | ( 101 - | 282 ) | 0.81 | 388 | ( 232 - | 653 ) | 212 | ( 127 - | 352 ) | ||
| England | 397 | ( 274 - | 591 ) | 240 | ( 163 - | 360 ) | 0.96 | 489 | ( 337 - | 727 ) | 237 | ( 161 - | 355 ) | ||
| 60-74 | London | 54 | ( 32 - | 91 ) | 17 | ( 8 - | 32 ) | 1.00 | 1,582 | ( 938 - | 2,685 ) | 461 | ( 229 - | 872 ) | |
| Outside London | 50 | ( 28 - | 86 ) | 54 | ( 31 - | 93 ) | 0.42 | 452 | ( 253 - | 783 ) | 375 | ( 216 - | 647 ) | ||
| England | 106 | ( 71 - | 155 ) | 72 | ( 46 - | 112 ) | 0.90 | 732 | ( 496 - | 1,073 ) | 399 | ( 257 - | 623 ) | ||
| Total | London | 550 | ( 415 - | 740 ) | 243 | ( 180 - | 331 ) | 1.00 | 182 | ( 138 - | 245 ) | 79 | ( 58 - | 107 ) | |
| Outside London | 868 | ( 663 - | 1,144 ) | 663 | ( 520 - | 850 ) | 0.93 | 116 | ( 88 - | 153 ) | 71 | ( 56 - | 91 ) | ||
| England | 1,424 | ( 1,159 - | 1,763 ) | 909 | ( 746 - | 1,112 ) | 1.00 | 135 | ( 110 - | 168 ) | 73 | ( 60 - | 89 ) | ||
| Non-clinic-attending heterosexuals (other ethnicities) | 15-34 | London | 129 | ( 33 - | 312 ) | 70 | ( 15 - | 185 ) | 0.78 | 6 | ( 1 - | 14 ) | 3 | ( 1 - | 8 ) |
| Outside London | 272 | ( 73 - | 656 ) | 198 | ( 43 - | 509 ) | 0.67 | 3 | ( 1 - | 6 ) | 2 | ( 0 - | 5 ) | ||
| England | 410 | ( 121 - | 900 ) | 275 | ( 63 - | 647 ) | 0.72 | 3 | ( 1 - | 7 ) | 2 | ( 1 - | 5 ) | ||
| 35-44 | London | 75 | ( 4 - | 411 ) | 38 | ( 3 - | 266 ) | 0.67 | 7 | ( 0 - | 37 ) | 3 | ( 0 - | 22 ) | |
| Outside London | 110 | ( 6 - | 634 ) | 122 | ( 8 - | 684 ) | 0.47 | 2 | ( 0 - | 11 ) | 2 | ( 0 - | 13 ) | ||
| England | 190 | ( 12 - | 1,005 ) | 165 | ( 12 - | 919 ) | 0.54 | 3 | ( 0 - | 15 ) | 2 | ( 0 - | 14 ) | ||
| 45-59 | London | 44 | ( 3 - | 249 ) | 23 | ( 2 - | 164 ) | 0.66 | 3 | ( 0 - | 19 ) | 2 | ( 0 - | 11 ) | |
| Outside London | 85 | ( 5 - | 529 ) | 106 | ( 7 - | 628 ) | 0.44 | 1 | ( 0 - | 6 ) | 1 | ( 0 - | 7 ) | ||
| England | 135 | ( 9 - | 736 ) | 132 | ( 9 - | 760 ) | 0.50 | 1 | ( 0 - | 7 ) | 1 | ( 0 - | 7 ) | ||
| 60-74 | London | 13 | ( 1 - | 79 ) | 7 | ( 0 - | 50 ) | 0.67 | 2 | ( 0 - | 10 ) | 1 | ( 0 - | 6 ) | |
| Outside London | 34 | ( 2 - | 211 ) | 42 | ( 3 - | 262 ) | 0.44 | 0 | ( 0 - | 3 ) | 1 | ( 0 - | 4 ) | ||
| England | 50 | ( 3 - | 274 ) | 51 | ( 4 - | 301 ) | 0.49 | 1 | ( 0 - | 4 ) | 1 | ( 0 - | 4 ) | ||
| Total | London | 277 | ( 82 - | 900 ) | 150 | ( 41 - | 578 ) | 0.76 | 5 | ( 2 - | 17 ) | 3 | ( 1 - | 10 ) | |
| Outside London | 531 | ( 164 - | 1,775 ) | 498 | ( 136 - | 1,827 ) | 0.54 | 2 | ( 1 - | 6 ) | 2 | ( 0 - | 6 ) | ||
| England | 817 | ( 264 - | 2,571 ) | 655 | ( 189 - | 2,313 ) | 0.61 | 2 | ( 1 - | 7 ) | 2 | ( 0 - | 6 ) | ||
References
- 1 Cohen MS, Chen YQ, McCauley M, Gamble T, Hosseinipour MC, Kumarasamy N, et al. Prevention of HIV-1 infection with early antiretroviral therapy. New England Journal of Medicine. 2011;365(6):493–505.
- 2 Granich RM, Gilks CF, Dye C, De Cock KM, Williams BG. Universal voluntary HIV testing with immediate antiretroviral therapy as a strategy for elimination of HIV transmission: a mathematical model. The Lancet. 2009;373(9657):48–57. Available from: http://dx.doi.org/10.1016/s0140-6736(08)61697-9.
- 3 UN Joint Programme on HIV/AIDS (UNAIDS). 90-90-90 An ambitious treatment target to help end the AIDS epidemic; 2014. Available from: https://www.unaids.org/sites/default/files/media{_}asset/90-90-90{_}en.pdf,accessed23rdSeptember2019.
- 4 Churchill D, Waters L, Ahmed N, Angus B, Boffito M, Bower M, et al. British HIV Association guidelines for the treatment of HIV-1-positive adults with antiretroviral therapy 2015. HIV Medicine. 2016;17:s2–s104.
- 5 McCormack S, Dunn DT, Desai M, Dolling DI, Gafos M, Gilson R, et al. Pre-exposure prophylaxis to prevent the acquisition of HIV-1 infection (PROUD): effectiveness results from the pilot phase of a pragmatic open-label randomised trial. The Lancet. 2016;387:53–60. Available from: http://dx.doi.org/10.1016/S0140-6736(15)00056-2.
- 6 Nash S, Desai S, Croxford S, Guerra L, Lowndes C, Connor N, et al. Progress towards ending the HIV epidemic in the United Kingdom 2018 report. Public Health England; 2018. December 2017.
- 7 Office for National Statistics. 2011 Census: population and household estimates for England and Wales. Office for National Statistics; 2012. Accessed 29th April 2019. Available from: https://www.ons.gov.uk/peoplepopulationandcommunity/populationandmigration/populationestimates/bulletins/2011censuspopulationandhouseholdestimatesforenglandandwales/2012-07-16/pdf.
- 8 British HIV Association, British Association of Sexual Health & HIV, British Infection Society. UK National Guidelines for HIV Testing 2008; 2008. September. Available from: https://www.bhiva.org/file/RHNUJgIseDaML/GlinesHIVTest08.pdf,accessed23rdSeptember2019.
- 9 National Institute for Health and Care Excellence. HIV testing: encouraging uptake; 2017. September. Available from: www.nice.org.uk/guidance/qs157,accessed23rdSeptember2019.
- 10 National AIDS Trust. A practical guide for Commissioners Commissioning HIV Testing Services In England; 2013. November. Available from: https://www.nat.org.uk/system/files{_}force/publications/Nov{_}2013{_}Toolkit.pdf,%****␣main.bbl␣Line␣75␣****accessed23rdSeptember2019.
- 11 HIV Prevention England. “It Starts With Me” and “National HIV Testing Week”. HIV Prevention England; 2019. Available from: https://www.hivpreventionengland.org.uk/campaigns/,accessed23rdSeptember2019.
- 12 Goubar A, Ades AE, De Angelis D, McGarrigle CA, Mercer CH, Tookey PA, et al. Estimates of human immunodeficiency virus prevalence and proportion diagnosed based on Bayesian multiparameter synthesis of surveillance data. Journal of the Royal Statistical Society Series A: Statistics in Society. 2008;171(3):541–580.
- 13 De Angelis D, Presanis AM, Conti S, Ades AE. Estimation of HIV burden through Bayesian evidence synthesis. Statistical Science. 2014;29(1):9–17.
- 14 Stan Development Team. RStan: the R interface to Stan; 2018. R package version 2.17.3. Available from: http://mc-stan.org/.
- 15 Office for National Statistics. Population Estimates for UK, England and Wales Scotland, and Northern Ireland Mid-2017 Population Estimates.; 2018. July. Accessed 29th April 2019. Available from: www.nomisweb.co.ukhttps://www.ons.gov.uk/peoplepopulationandcommunity/populationandmigration/populationestimates/bulletins/annualmidyearpopulationestimates/mid2017/pdf.
- 16 Mercer CH, Prah P, Field N, Tanton C, Macdowall W, Clifton S, et al. The health and well-being of men who have sex with men ( MSM ) in Britain : Evidence from the third National Survey of Sexual Attitudes and Lifestyles ( Natsal-3 ). BMC Public Health. 2016;p. 1–16.
- 17 Hay G, Gannon M, Casey J, Millar T. Estimates of the Prevalence of Opiate Use and/or Crack Cocaine Use, 2009/10: Sweep 6 report. Centre for Public Health, Liverpool John Moores University; 2011. 6. Accessed 29th April 2019. Available from: http://citeseerx.ist.psu.edu/viewdoc/download?doi=10.1.1.690.2170{&}rep=rep1{&}type=pdf.
- 18 King R, Bird SM, Hay G, Hutchingson SJ. Estimating Prevalence of Injecting Drug Users and Associated Death Rates in England Using Regional Data and Incorporating Prior Information. Journal of the Royal Statistical Society: Series A (Statistics in Society). 2014;177(1):209–236. Available from: https://rss.onlinelibrary.wiley.com/doi/pdf/10.1111/rssa.12011.
- 19 Sweeting MJ, De Angelis D, Ades AE, Hickman M. Estimating the prevalence of ex-injecting drug use in the population. Statistical Methods in Medical Research. 2009;18(4):381–395. Available from: http://dx.doi.org/10.1177/0962280208094704.
- 20 Savage EJ, Mohammed H, Leong G, Duffell S, Hughes G. Improving surveillance of sexually transmitted infections using mandatory electronic clinical reporting: The genitourinary medicine clinic activity dataset, England, 2009 to 2013. Eurosurveillance. 2014;19(48):1–9.
- 21 Aghaizu A, Wayal S, Nardone A, Parson V, Copas AJ, Mercey DE, et al. Understanding continuing high HIV incidence: trends in sexual behaviours, HIV testing and the proportion of men at risk of transmitting and acquiring HIV in London 2000-2013. A serial cross-sectional study. The Lancet HIV. 2016;3(9):e431–e440.
- 22 Public Health England. Shooting Up: Infections among people who inject drugs in the UK, 2017. Public Health England; 2018. Accessed 29th April 2019. Available from: https://assets.publishing.service.gov.uk/government/uploads/system/uploads/attachment_data/file/756502/Shooting_up_2018.pdf.
- 23 Peters H, Thorne C, Tookey PA, Byrne L. National audit of perinatal HIV infections in the UK, 2006–2013: what lessons can be learnt? HIV Medicine. 2018;19(4):280–289.
- 24 Office for National Statistics. Births in England and Wales by Parents’ Country of Birth. Office for National Statistics; 2018. Accessed 29th April 2019. Available from: https://www.ons.gov.uk/peoplepopulationandcommunity/birthsdeathsandmarriages/livebirths/bulletins/parentscountryofbirthenglandandwales/2017/pdf.
- 25 Bourne A, Reid D, Weatherburn P. African Health and Sex Survey 2013-2014: headline findings. London, England: Sigma Research, London School of Hygiene and Tropical Medicine; 2014. Accessed 29th April 2019. Available from: http://www.sigmaresearch.org.uk/files/report2014c.pdf.
- 26 National Health Service Blood and Transplant, Public Health England. Safe supplies 2017: data sources and methods. NHS Blood and Transplant, Public Health England; 2017. Accessed 29th April 2019. Available from: https://www.gov.uk/government/publications/safe-supplies-annual-review.
- 27 Rice BD, Yin Z, Brown AE, Croxford S, Conti S, De Angelis D, et al. Monitoring of the HIV Epidemic Using Routinely Collected Data: The Case of the United Kingdom. AIDS and Behavior. 2017;21(s1):83–90.
- 28 Nash S, Furegato M, Gill O, Connor N, contributors. HIV Testing in England: 2017; 2017. Available from: https://assets.publishing.service.gov.uk/government/uploads/system/uploads/attachment_data/file/759270/HIV_testing_in_England_2017_report.pdf.
- 29 Advisory Council on the Misuse of Drugs. ACMD Report 2019: Ageing cohort of drug users. Advisory Council on the Misuse of Drugs; 2019. Available from: https://www.gov.uk/government/uploads/system/uploads/attachment{_}data/file/237037/ACMD{_}advice{_}Z{_}drugs.pdf.
- 30 Weatherburn P, Schmidt AJ, Hickson F, Reid D, Berg RC, Hospers HJ, et al. The European men-who-have-sex-with-men internet survey (EMIS): Design and methods. Sexuality Research and Social Policy. 2013;10(4):243–257.
- 31 Logan L, Fakoya I, Howarth A, Murphy G, Johnson AM, Rodger AJ, et al. Combination prevention and HIV: a cross-sectional community survey of gay and bisexual men in London, October to December 2016. Euro surveillance : bulletin Europeen sur les maladies transmissibles = European communicable disease bulletin. 2019;24(25).
- 32 Birrell PJ, Gill ON, Delpech VC, Brown AE, Desai S, Chadborn TR, et al. HIV incidence in men who have sex with men in England and Wales 2001-10: A nationwide population study. The Lancet Infectious Diseases. 2013;13(4):313–318. Available from: http://dx.doi.org/10.1016/S1473-3099(12)70341-9.
- 33 Brizzi F, Birrell PJ, Plummer MT, Kirwan P, Brown AE, Delpech VC, et al. Extending Bayesian back-calculation to estimate age and time specific HIV incidence. Lifetime Data Analysis. 2019;Available from: https://doi.org/10.1007/s10985-019-09465-1.
- 34 Punyacharoensin N, Edmunds W, De Angelis D, Delpech V, Hart G, Elford J, et al. Effect of pre-exposure prophylaxis and combination HIV prevention for men who have sex with men in the UK: A mathematical modelling study. The Lancet HIV. 2016;3(2):e94–e104.
- 35 Cambiano V, Miners A, Dunn D, McCormack S, Ong KJ, Gill ON, et al. Cost-effectiveness of pre-exposure prophylaxis for HIV prevention in men who have sex with men in the UK: a modelling study and health economic evaluation. The Lancet Infectious Diseases. 2018;18(1):85–94. Available from: http://dx.doi.org/10.1016/S1473-3099(17)30540-6.
- 36 UNAIDS. Methods for deriving UNAIDS estimates 2018. Spectrum/EPP: Annex on Methods; 2018. Available from: https://www.unaids.org/en/resources/documents/2018/Methods{_}deriving{_}estimates{_}2018.
- 37 Rayment M, Curtis H, Carne C, McClean H, Bell G, Estcourt C, et al. An effective strategy to diagnose HIV infection: findings from a national audit of HIV partner notification outcomes in sexual health and infectious disease clinics in the UK. Sexually transmitted infections. 2017;93(2):94–99. Available from: https://doi.org/10.1136/sextrans-2015-052532.
List of Acronyms
- AHSS
- African Health and Sex Survey
- AIDS
- Acquired Immuno-Deficiency Syndrome
- ART
- anti-retroviral therapy
- BHIVA
- British HIV Association
- CrI
- credible interval
- EMIS
- European MSM Internet Survey
- GMSHS
- Gay Men’s Sexual Health Survey
- GUMCAD
- Genito-Urinary Medicine Clinic Activity Dataset
- HARS
- HIV/AIDS Reporting System
- HIV
- Human Immuno-deficiency Virus
- HO
- Home Office
- MPES
- Multi-Parameter Evidence Synthesis
- MSM
- gay, bisexual and other men who have sex with men
- NATSAL
- National Survey of Sexual Attitudes and Lifestyles
- NHSBT
- National Health Service Blood and Transplant
- NSHPC
- National Study of HIV in Pregnancy and Childhood
- ONS
- Office for National Statistics
- PHE
- Public Health England
- PLWH
- people living with HIV
- PrEP
- HIV pre-exposure prophylaxis
- PWID
- people who inject drugs
- SHC
- sexual health clinic
- SHS
- sexual health service
- SSA
- sub-Saharan Africa
- STI
- sexually transmitted infection
- TasP
- Treatment as Prevention
- UAM
- Unlinked Anonymous Monitoring
- UK
- United Kingdom
- UN
- United Nations
- UNAIDS
- Joint United Nations Programme on HIV/AIDS
- WHO
- World Health Organization