Gas Density Perturbations in Cool Cores of CLASH Galaxy Clusters
Abstract
We present a systematic study of gas density perturbations in cool cores of high-mass galaxy clusters. We select 12 relaxed clusters from the Cluster Lensing And Supernova survey with Hubble (CLASH) sample and analyze their cool core features observed with the Chandra X-ray Observatory. We focus on the X-ray residual image characteristics after subtracting their global profile of the X-ray surface brightness distribution. We find that all the galaxy clusters in our sample have, at least, both one positive and one negative excess regions in the X-ray residual image, indicating the presence of gas density perturbations. We identify and characterize the locally perturbed regions using our detection algorithm, and extract X-ray spectra of the intracluster medium (ICM). The ICM temperature in the positive excess region is lower than that in the negative excess region, whereas the ICM in both regions is in pressure equilibrium in a systematic manner. These results indicate that gas sloshing in cool cores takes place in more than of relaxed clusters (95 % CL). We confirm this physical picture by analyzing synthetic X-ray observations of a cool-core cluster from a hydrodynamic simulation, finding that our detection algorithm can accurately extract both the positive and negative excess regions and can reproduce the temperature difference between them. Our findings support the picture that the gas density perturbations are induced by gas sloshing, and a large fraction of cool-core clusters have undergone gas sloshing, indicating that gas sloshing may be capable of suppressing runaway cooling of the ICM.
1 Introduction
Galaxy clusters are still growing in mass through mergers and continuous accretion of material from their surrounding large-scale environments. Galaxy clusters contain a large amount of X-ray emitting gas, i.e., the intracluster medium (ICM), which is thermalized in the gravitational potential well dominated by dark matter. The thermal evolution of the ICM is thus coupled with the formation and evolution of galaxy clusters.
Most of galaxy clusters host cool cores in their center, in the form of the dense, relatively cool, and metal-enriched ICM. Since cool cores are considered to be formed by radiatively cooling gas, it is expected that runaway cooling occurs in the cool cores because of the fact that their cooling time estimated by electron density is much shorter than the age of galaxy clusters (e.g., Peterson & Fabian, 2006, for a review). This expectation is, however, inconsistent with observational evidence (e.g., Tamura et al., 2001; Peterson et al., 2001; O’Dea et al., 2008; McDonald et al., 2011, 2018), the temperature of the central part of the ICM remains hot (i.e. several keV). No evidence is found of clusters whose ICM temperature is lower than 1 keV. Such inconsistency indicates that a heating source is required to suppress runaway cooling. In addition, a balance between cooling and heating must be kept during a lifetime of galaxy clusters.
The origin of heating sources and heating mechanisms is a long-standing problem in cluster astrophysics. Feedback from active galactic nuclei (AGN) in the brightest cluster galaxies (BCG) is considered to be a plausible mechanism (e.g., Fabian, 2012; McNamara & Nulsen, 2012, for reviews). Mechanical feedback (e.g., jets and sound waves) from AGN interacts with the ICM and induces a characteristic feature in the X-ray surface brightness (e.g., McNamara et al., 2005; Hlavacek-Larrondo et al., 2012, 2013a, 2015; Shin et al., 2016). In fact, X-ray cavities are found in a large sample of relaxed galaxy clusters over a wide redshift range. Some of them are considered to be most likely due to AGN radio jets (e.g., McNamara & Nulsen, 2012, for a review). The mechanical power estimated by the size of X-ray cavities is almost sufficient to balance between the cooling and heating rates (e.g., McNamara & Nulsen, 2007, for a review). On the other hand, gas sloshing in the core of galaxy clusters has been proposed as an alternative heating source (e.g., Fujita et al., 2004; ZuHone et al., 2010). Gas sloshing is induced by (minor) mergers with a nonzero impact parameter (see Markevitch & Vikhlinin, 2007, for a review). Bulk motion in a cool core, generated by gas sloshing, was recently found (Hitomi Collaboration et al., 2018; Ueda et al., 2019) and its kinetic energy is considered to be converted into heat by dissipating turbulence produced by e.g., the Kelvin-Helmholtz instability (KHI; e.g., ZuHone et al., 2010; Roediger et al., 2012; ZuHone & Roediger, 2016). Evidence of gas sloshing is frequently found in cool cores (e.g., Churazov et al., 2003; Clarke et al., 2004; Blanton et al., 2011; Owers et al., 2011; O’Sullivan et al., 2012; Canning et al., 2013; Rossetti et al., 2013; Ghizzardi et al., 2014; Sanders et al., 2014; Ichinohe et al., 2015; Ueda et al., 2017; Su et al., 2017; Liu et al., 2018; Ueda et al., 2018; Calzadilla et al., 2019; Ueda et al., 2019). The well-known characteristic features of gas sloshing are that (1) the ICM in the cool core exhibits a characteristic pair of positive and negative density perturbations in the X-ray brightness distribution, (2) the temperature (abundance) of the ICM in the positive excess region is lower (higher) than that in the negative excess area, and (3) the ICM in both regions is in pressure equilibrium. We note that Khochfar & Ostriker (2008) have presented detailed studies of gas physics within semi-analytic models of galaxy formation by focusing on the role played by environmental effects. They have studied gravitational heating of the ICM by gravitational potential energy released from stripped gas from infalling substructures and pointed out that gravitational heating appears to be an efficient heating source able to prevent cooling in environments. The context of gravitational heating in Khochfar & Ostriker (2008) appears to be associated with gas sloshing.
In the context of cosmic structure formation, mergers play a key role in the formation and evolution of galaxy clusters. Cluster mergers have a large impact on the thermal properties of the ICM for a sufficiently long time scale (say, several Gyrs). Hence, revealing their influence on the ICM properties provides us with an important clue to understanding the role of structure formation on the evolution of galaxy clusters (e.g., Fujita et al., 2018). In principle, the thermodynamic properties of the ICM in cool cores can be perturbed and modified by gas sloshing motions associated with infalling substructures (e.g., Fujita et al., 2004; ZuHone et al., 2010). However, thus far, the population of sloshing cool cores has been poorly studied both observationally and theoretically. Therefore, systematic observational studies of sloshing features in cool-core clusters are critically important for understanding the role of gas sloshing in cluster evolution over cosmic time.
In this paper, we present a systematic study of gas sloshing features by analyzing thermodynamic properties of the ICM in cool cores of relaxed galaxy clusters. To this end, we develop a novel method to identify characteristic features of gas sloshing in X-ray residual images, with an aid of strong-lensing mass models. In addition, we test and validate our method by analyzing synthetic X-ray observations of a cool-core cluster with a merging substructure using a high-resolution hydrodynamic simulation.
Throughout the paper, we assume , , and the Hubble constant of km s-1 Mpc-1. Unless stated otherwise, quoted errors correspond to uncertainties.
2 Sample
In this study, we focus on a sample of high-mass galaxy clusters targeted by the Cluster Lensing And Supernova survey with Hubble (CLASH; Postman et al., 2012). The CLASH sample of 25 galaxy clusters has been studied extensively in multiwavelength observations (e.g., Biviano et al., 2013; Donahue et al., 2014; Meneghetti et al., 2014; Umetsu et al., 2014; Merten et al., 2015; Zitrin et al., 2015; Donahue et al., 2016; Umetsu et al., 2016; Molino et al., 2017; Umetsu & Diemer, 2017; Chiu et al., 2018; Sereno et al., 2018; Umetsu et al., 2018; Yu et al., 2018). Detailed X-ray studies of the CLASH sample were presented in Donahue et al. (2014) and Donahue et al. (2016), which focused on the global ICM properties of the CLASH sample using Chandra and XMM-Newton observations. In this paper, we used the data taken with Chandra X-ray observations.
Here, we select a subsample of 12 CLASH clusters that were identified as cool-core systems on the basis of their X-ray concentration (Donahue et al., 2016). For these selected clusters, a clear temperature drop towards the center is observed (Donahue et al., 2014), and the cooling time within 100 kpc is much shorter than 10 Gyrs in each case (Hlavacek-Larrondo et al., 2012). In addition, the central mass distribution from CLASH strong-lens (SL) modeling is publicly available for all of the clusters (Zitrin et al., 2015). Hence, these observational datasets allow us to systematically study and characterize gas density perturbations in the X-ray brightness distribution for a sample of 12 cool-core CLASH clusters. Our cluster sample is summarized in Table 1. We note that a detailed study of RXJ 1347.5-1145 was conducted by Ueda et al. (2018) from a combined analysis of X-ray, Sunyaev–Zel’dovich effect (SZE), and HST SL observations. Here we will analyze RXJ 1347.5-1145 using the same methodology developed in this work.
3 Observation and data reduction
We used archival X-ray data of each cluster taken with the Advanced CCD Imaging Spectrometer (ACIS; Garmire et al., 2003) on board the Chandra X-ray Observatory. The ObsID of all datasets analyzed is summarized in Table 1. Since some of the datasets were used in Donahue et al. (2016), the newly added data in this paper are highlighted in boldface in Table 1. We used the versions of 4.10 and 4.7.9 for Chandra Interactive Analysis of Observations (CIAO; Fruscione et al., 2006) and the calibration database (CALDB), respectively. We checked the light curve of each cluster using the lc_clean task in CIAO, filtering flare data. The blanksky data included in the CALDB were adopted as background data. We extracted X-ray spectra from each dataset with specexctract in CIAO and combined them after making individual spectrum, response, and ancillary response files for the spectral fitting. We used XSPEC version 12.10.0e (Arnaud, 1996) and the atomic database for plasma emission modeling version 3.0.9 in the X-ray spectral analysis, assuming that the ICM is in collisional ionization equilibrium (Smith et al., 2001). The abundance table of Lodders & Palme (2009) is used. The Galactic absorption (i.e., ) for each cluster was estimated using Kalberla et al. (2005) and fixed to the estimated value in the X-ray spectral analysis.
| Sample | RA | Dec | Redshift | Expo. time (ksec) | ObsIDaa The ObsID in boldface indicates newly added data, which are not included in Donahue et al. (2016). |
|---|---|---|---|---|---|
| A383 | 02:48:03.40 | -03:31:44.9 | 0.187 | 48.8 | 524, 2320, 2321 |
| MACSJ 0329.6-0211 | 03:29:41.56 | -02:11:46.1 | 0.450 | 76.5 | 3257, 3582, 6108, 7719 |
| MACSJ 0429.6-0253 | 04:29:36.05 | -02:53:06.1 | 0.399 | 23.2 | 3271 |
| MACSJ 1115.8+0129 | 11:15:51.90 | 01:29:55.1 | 0.352 | 55.5 | 3275, 9375 |
| MACSJ 1311.0-0310 | 13:11:01.80 | -03:10:39.8 | 0.494 | 114.9 | 3258, 6110, 7721, 9381 |
| RXJ 1347.5-1145 | 13:47:30.62 | -11:45:09.4 | 0.451 | 233.8 | 506, 507, 3592, 13516, 13999, 14407 |
| MACSJ 1423.8+2404 | 14:23:47.88 | 24:04:42.5 | 0.545 | 134.1 | 1657, 4195 |
| RXJ 1532.9+3021 | 15:32:53.78 | 30:20:59.4 | 0.363 | 108.2 | 1649, 1665, 14009 |
| MACS J1720.2+3536 | 17:20:16.78 | 35:36:26.5 | 0.391 | 63.7 | 3280, 6107, 7225, 7718 |
| MACS J1931.8-2634 | 19:31:49.62 | -26:34:32.9 | 0.352 | 112.5 | 3282, 9382 |
| RXJ 2129.6+0005 | 21:29:39.96 | 00:05:21.2 | 0.234 | 39.6 | 552, 9370 |
| MS 2137.3-2353 | 21:40:15.17 | -23:39:40.2 | 0.313 | 141.5 | 928, 4974, 5250 |
4 Analyses and Results
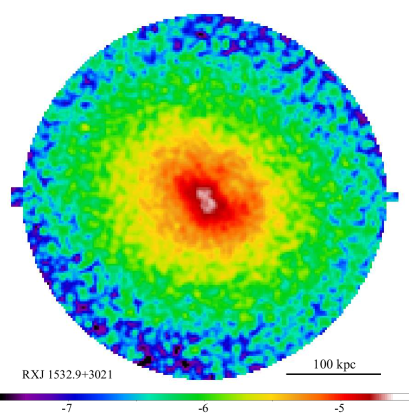
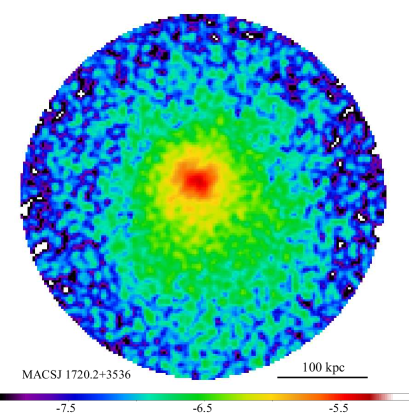
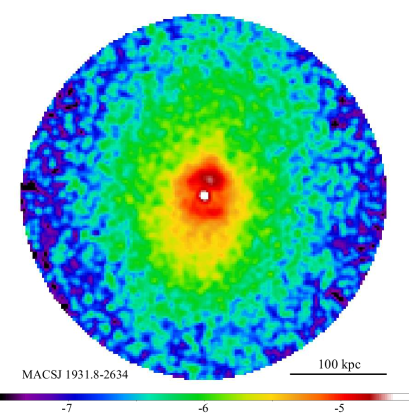
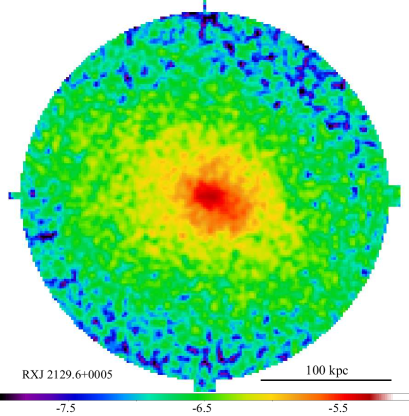
4.1 X-ray imaging analysis
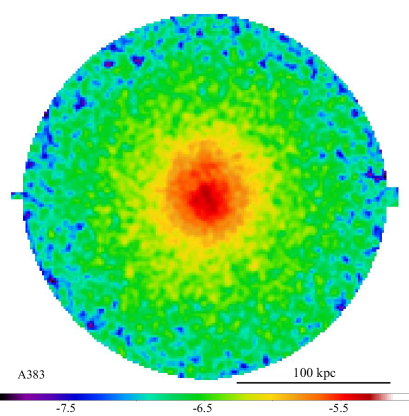
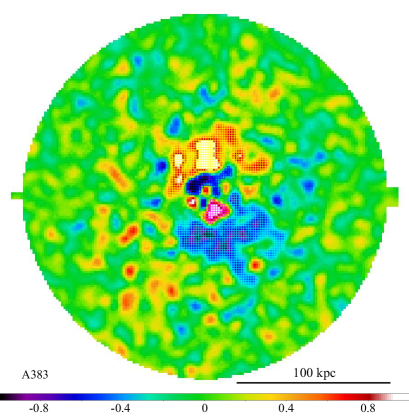
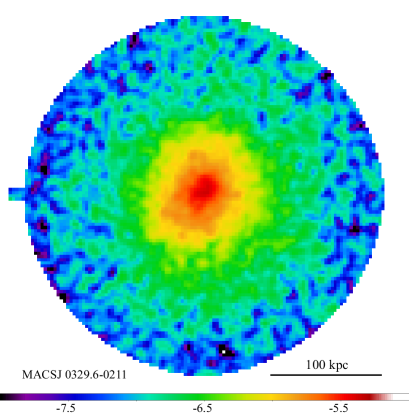
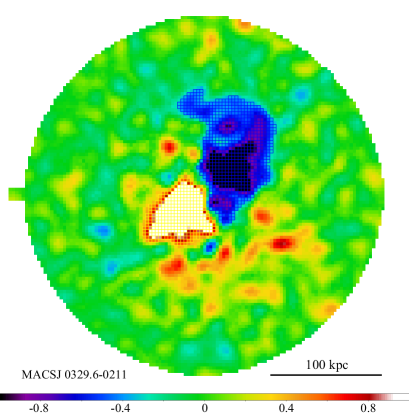
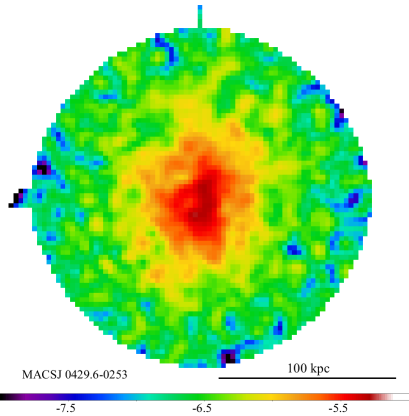
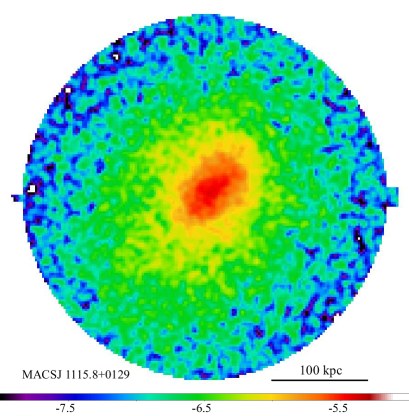
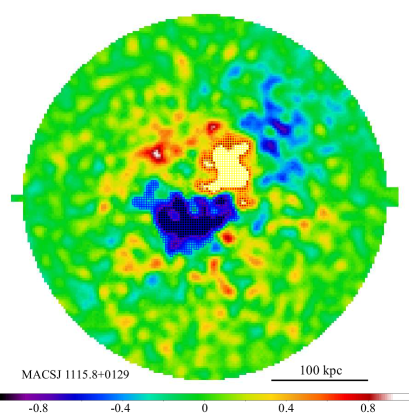
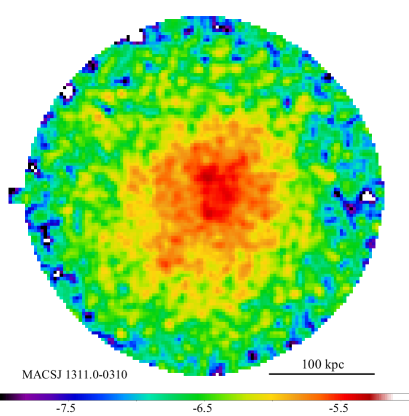
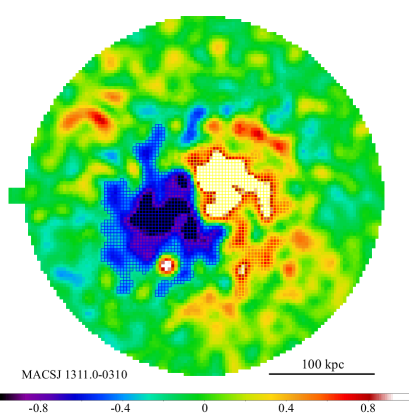
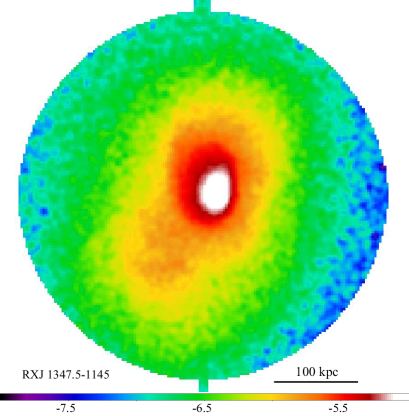
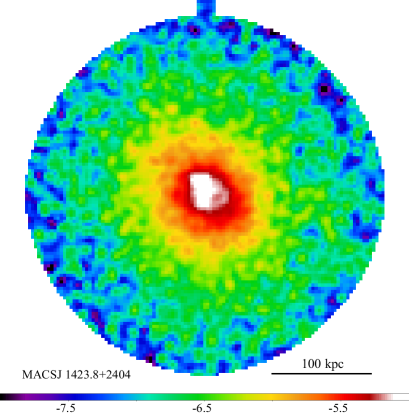
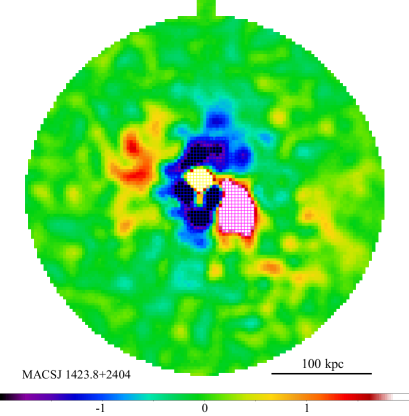
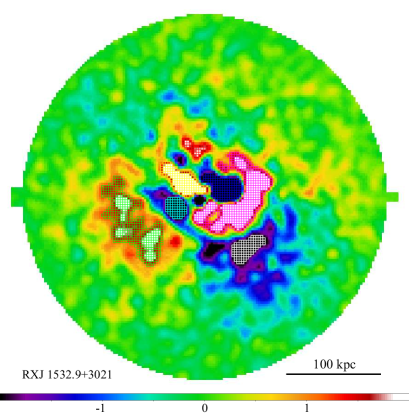
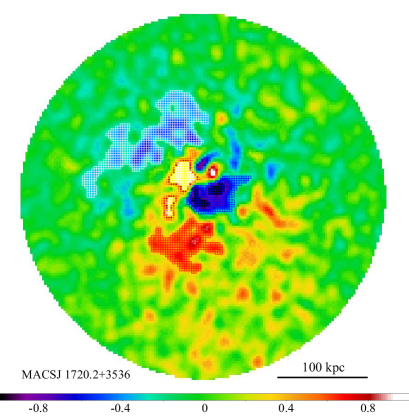
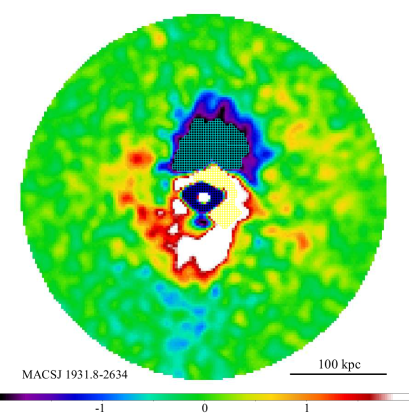
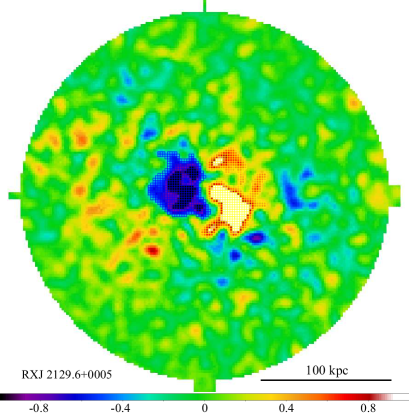
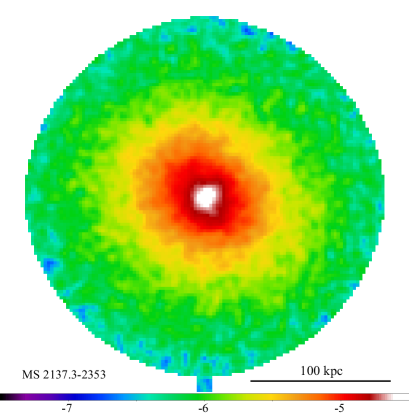
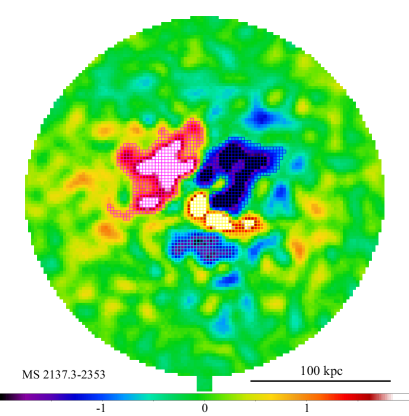
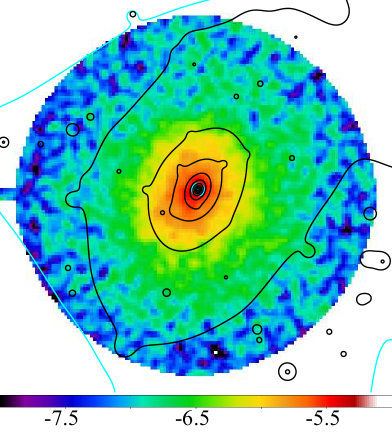
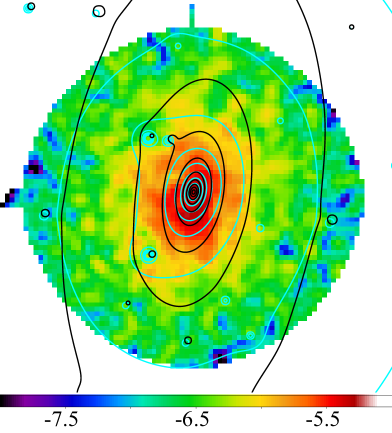
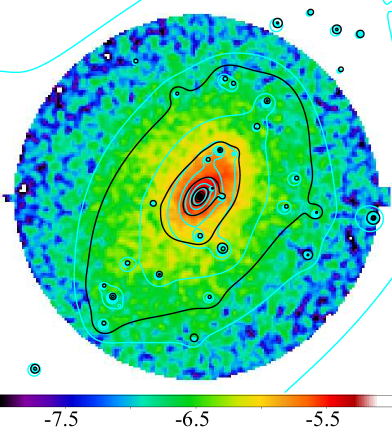
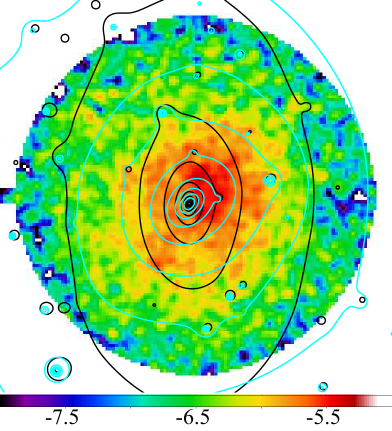
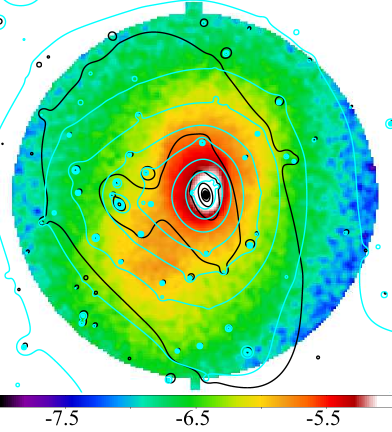
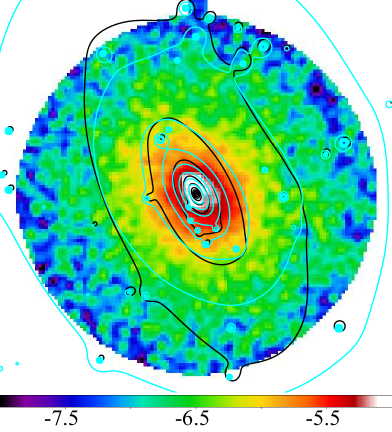
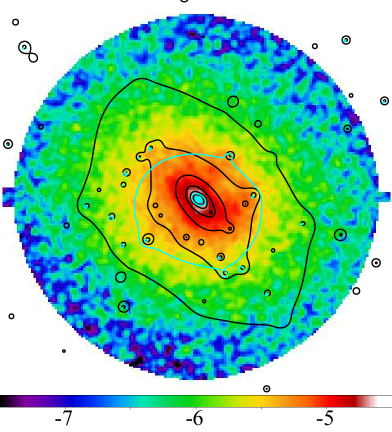
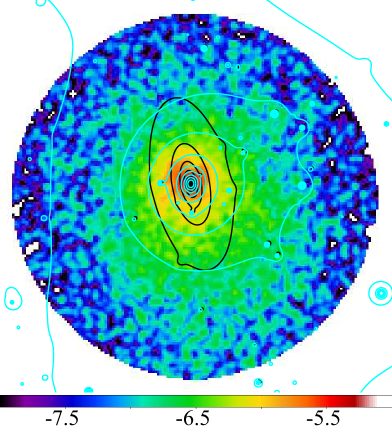
In order to detect gas density perturbations in the cool core of each cluster, we analyzed their X-ray surface brightness in the keV band. The left side of Figure 1 shows the X-ray surface brightness of our sample taken with Chandra. Following Ueda et al. (2017), we first modeled a mean surface brightness using the concentric ellipse fitting algorithm, by minimizing the variance of the X-ray surface brightness relative to the ellipse model. In this analysis, we fixed the center of the ellipse model to the peak position of the SL mass map111https://archive.stsci.edu/prepds/clash/ that assumed an elliptical Navarro-Frenk-White (NFW; Navarro et al., 1997) profile by Zitrin et al. (2015). The location of the center, position angle (PA)222The position angle is measured for the major axis of an ellipse from north () to east ()., and axis ratio (AR) of each cluster are listed in Table 2. After modeling, we subtracted the obtained model from the original X-ray surface brightness. The right side of Figure 1 shows the X-ray residual image of each cluster. For a comparison, we also listed the PA and AR of the dark matter halo in each cluster summarized in Donahue et al. (2016) in Table 2. As already reported by Donahue et al. (2016), the PA and AR of the X-ray surface brightness are in good agreement with those in the central mass distribution of the dark matter halo, respectively.
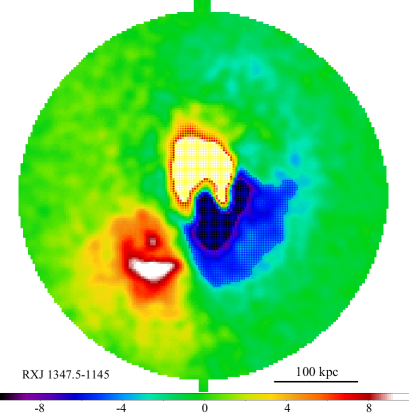
We found at least one positive and one negative excess regions in the X-ray residual images of all 12 galaxy clusters in our sample, which indicate the presence of gas density perturbations in their cool cores. Locally perturbed regions are defined as those where the amplitude of a fluctuation exceeds 20 % of the extreme values found in the X-ray residual images around the position of the peak. If another perturbed region is found (e.g., the cases of A383 and RXJ 1532.9+3021), we apply this procedure again after masking the previous region. In this case, the maximum value of the fluctuation is the same as the previous one but the peak position is shifted to the second local peak. This procedure is repeated until no additional fluctuations are found. For RXJ 1347.5-1145, the positive excess region is found in the southeast region. However, this excess has been recognized as a stripped gas originally in an infalling subcluster (Kreisch et al., 2016; Ueda et al., 2018). We, therefore, avoided defining this excess as a perturbed region in the cool core. In addition, a dipolar pattern in the X-ray residual image is found. The shape of this pattern is consistent with that found in Ueda et al. (2018). The number of the perturbed regions identified along with the net photon counts are summarized in Table 3. The perturbed regions are also shown in the right side of Figure 1.
We note here that if we define a threshold to identify perturbed regions to be 10 % of the extreme values in the X-ray residual images instead of 20 %, we find that most regions are so large that a large amount of ambient ICM is included in these regions. Hence, a threshold of 10 % is not suitable for studying thermodynamic properties of the ICM in cool cores. On the other hand, if we increase the threshold from 20% to 30 %, the area of perturbed regions is reduced considerably. Since the net photon counts in each region decrease significantly, such a high threshold also prevents us from accurately measuring thermodynamic properties of the ICM. Therefore, we define perturbed regions using a threshold of 20 %.
| Sample | RA | Dec | PA (X-ray) (∘)aa Uncertainty of this parameter is . | AR (X-ray)bb Uncertainty of this parameter is . | PA (lensing) (∘)cc These data are taken from Table 5 in Donahue et al. (2016). | AR (lensing)cc These data are taken from Table 5 in Donahue et al. (2016). |
|---|---|---|---|---|---|---|
| A383 | 42.014094 | -3.529372 | 16 | 0.89 | ||
| MACSJ 0329.6-0211 | 52.423220 | -2.196229 | 152 | 0.83 | ||
| MACSJ 0429.6-0253 | 67.400045 | -2.885190 | 162 | 0.73 | ||
| MACSJ 1115.8+0129 | 168.96625 | 1.4986388 | 140 | 0.64 | ||
| MACSJ 1311.0-0310 | 197.75751 | -3.177704 | 135 | 0.81 | ||
| RXJ 1347.5-1145 | 206.87754 | -11.752634 | 167 | 0.68 | ||
| MACSJ 1423.8+2404 | 215.94948 | 24.078454 | 19 | 0.85 | ||
| RXJ 1532.9+3021 | 233.22410 | 30.349815 | 52 | 0.73 | ||
| MACS J1720.2+3536 | 260.06980 | 35.607306 | 40 | 0.90 | ||
| MACS J1931.8-2634 | 292.95677 | -26.575715 | 173 | 0.62 | ||
| RXJ 2129.6+0005 | 322.41648 | 0.089240 | 64 | 0.64 | ||
| MS 2137.3-2353 | 325.06314 | -23.661148 | 48 | 0.90 |
| Sample | ID | Positive excess | Negative excess |
|---|---|---|---|
| A383 | 1 | 785 | 850 |
| 2 | 2637 | 2482 | |
| MACSJ 0329.6-0211 | 1 | 2243 | 2602 |
| MACSJ 0429.6-0253 | 1 | 539 | 514 |
| MACSJ 1115.8+0129 | 1 | 2693 | 2639 |
| MACSJ 1311.0-0310 | 1 | 2527 | 1921 |
| RXJ 1347.5-1145 | 1 | 41773 | 31393 |
| MACSJ 1423.8+2404 | 1 | 2038 | 5067 |
| 2 | 2657 | None | |
| RXJ 1532.9+3021 | 1 | 4272 | 2711 |
| 2 | 10807 | 1010 | |
| 3 | 2965 | 760 | |
| 4 | 693 | 352 | |
| MACS J1720.2+3536 | 1 | 1322 | 1148 |
| 2 | 616 | 407 | |
| MACS J1931.8-2634 | 1 | 5514 | 3162 |
| 2 | None | 3357 | |
| RXJ 2129.6+0005 | 1 | 2318 | 1473 |
| MS 2137.3-2353 | 1 | 8994 | 12065 |
| 2 | 10199 | 3193 |
4.2 X-ray spectral analysis
We extracted an X-ray spectrum of each perturbed region identified in Section 4.1. The X-ray spectra in the keV band are analyzed using the model of phabs * apec in XSPEC. The cluster redshift is fixed to the value in Table 1. The blanksky data provided by CALDB are adopted as the background data for the spectral analysis. For MACS J1931.8-2634, we excluded the luminous AGN (Ehlert et al., 2011) with to reduce contamination of the AGN emission. The best-fit parameters of the ICM temperature and abundance are shown in Table 4. Most of them in the perturbed regions were measured well, except several regions with poor statistics (net counts , see Table 3). Hence, we obtained the upper limits of the abundance in the region #2 of RXJ 1532.9+3021 and the regions #1 and #2 of MACS J1720.2+3536.
We focus here on the temperature and abundance differences between the positive and negative excess regions, respectively, to reveal the origin of gas density perturbations in the cool core. Gas sloshing is expected to create a positive excess with lower temperature and higher abundance, and a negative excess with higher temperature and lower abundance in the cool core. In Table 4, we list the properties of the gas sloshing regions, where a clear feature expected by gas sloshing is found, by taking the statistical uncertainty into account. We also include in the table additional cases that could potentially be identified as gas sloshing regions, but that cannot be confirmed due to the statistical uncertainty
We also calculated the ICM electron number density (), pressure (), and entropy (), assuming that a length of the line-of-sight is /1 Mpc. Table 5 shows these parameters in the positive and negative excess regions, respectively.
| Sample | ID | Positive excess | Negative excess | Sloshing?aa If a clear sloshing feature is found (i.e., the ICM temperature and abundance in the positive excess region are lower and higher than those in the negative excess region, respectively), a check mark (i.e., ✓) is assigned. In the case of a possible candidate, ? is entered. | ||
|---|---|---|---|---|---|---|
| (keV) | () | (keV) | () | |||
| A383 | 1 | ? | ||||
| 2 | ||||||
| MACSJ 0329.6-0211 | 1 | |||||
| MACSJ 0429.6-0253 | 1 | |||||
| MACSJ 1115.8+0129 | 1 | ? | ||||
| MACSJ 1311.0-0310 | 1 | ? | ||||
| RXJ 1347.5-1145 | 1 | ✓ | ||||
| MACSJ 1423.8+2404 | 1 | ? | ||||
| 2 | ||||||
| RXJ 1532.9+3021 | 1 | |||||
| 2 | ✓ | |||||
| 3 | ||||||
| 4 | ||||||
| MACS J1720.2+3536 | 1 | |||||
| 2 | ? | |||||
| MACS J1931.8-2634 | 1 | ✓ | ||||
| 2 | ||||||
| RXJ 2129.6+0005 | 1 | ? | ||||
| MS 2137.3-2353 | 1 | ? | ||||
| 2 | ||||||
| Sample | ID | Positive excess | Negative excess | ||||
|---|---|---|---|---|---|---|---|
| aa Electron number density in units of cm -3 (/1 Mpc)-1/2. | bb Electron pressure in units of keV cm-3 (/1 Mpc)-1/2. | cc Electron entropy in units of keV cm2 (/1 Mpc)1/3. | aa Electron number density in units of cm -3 (/1 Mpc)-1/2. | bb Electron pressure in units of keV cm-3 (/1 Mpc)-1/2. | cc Electron entropy in units of keV cm2 (/1 Mpc)1/3. | ||
| A383 | 1 | ||||||
| 2 | |||||||
| MACSJ 0329.6-0211 | 1 | ||||||
| MACSJ 0429.6-0253 | 1 | ||||||
| MACSJ 1115.8+0129 | 1 | ||||||
| MACSJ 1311.0-0310 | 1 | ||||||
| RXJ 1347.5-1145 | 1 | ||||||
| MACSJ 1423.8+2404 | 1 | ||||||
| 2 | |||||||
| RXJ 1532.9+3021 | 1 | ||||||
| 2 | |||||||
| 3 | |||||||
| 4 | |||||||
| MACS J1720.2+3536 | 1 | ||||||
| 2 | |||||||
| MACS J1931.8-2634 | 1 | ||||||
| 2 | |||||||
| RXJ 2129.6+0005 | 1 | ||||||
| MS 2137.3-2353 | 1 | ||||||
| 2 | |||||||
4.3 Quantification of the contrast of gas density perturbations
To quantify the density perturbations found in the X-ray residual images, we use the contrast, typically defined as , where is the mean X-ray surface brightness, following Ueda et al. (2018). We calculated for each cluster and summarized the quantified value in Table 6. Note that the contrast found in all cases stays well below unity, which means that the amplitude of the fluctuations in the cool core is modest regardless of mechanisms to create perturbations.
| Sample | |
|---|---|
| A383 | |
| MACSJ 0329.6-0211 | |
| MACSJ 0429.6-0253 | |
| MACSJ 1115.8+0129 | |
| MACSJ 1311.0-0310 | |
| RXJ 1347.5-1145 | |
| MACSJ 1423.8+2404 | |
| RXJ 1532.9+3021 | |
| MACS J1720.2+3536 | |
| MACS J1931.8-2634 | |
| RXJ 2129.6+0005 | |
| MS 2137.3-2353 |
5 Verification of our imaging analysis using simulation
In Section 4.1, we have defined and applied our detection algorithm into the X-ray residual images to identify perturbed regions. To verify our methodology described in this paper, we carried out a hydrodynamic simulation. We tested our algorithm using datasets taken from the simulation.
5.1 Configuration of simulation
We performed a hydrodynamic simulation of a cluster merger to produce gas sloshing in a cool core by using the adaptive mesh refinement (AMR; Berger & Oliger, 1984; Berger & Colella, 1989) code GAMER-2 (Schive et al., 2018). GAMER-2 implements GPU accelerations to speed up time consuming calculations. The box size of our simulation was 14.3 Mpc on a side. We reached a very high spatial resolution of 0.85 kpc using the GPU cluster at the National Center for High-Performance Computing (NCHC) in Taiwan (for technical details of this run, see Molnar & Schive 2019, in prep). This simulation was semi-adiabatic, which means that only shock heating but no additional heating and cooling processes were considered.
The initial conditions of this simulation are as follows.
-
1.
The masses of the primary cluster and the infalling subcluster are and , respectively.
-
2.
The dark matter halo follows an NFW profile. We assumed an isotropic distribution for the direction of the dark matter particle velocities, and their magnitudes were drawn from a velocity distribution function based on the Eddington formula (Eddington, 1916). The gas density and temperature profiles were calculated assuming a power law entropy distribution and hydrostatic equilibrium. We adopted a gas mass fraction of . For more details of our simulation setup, we refer to Schive et al. (2018) and ZuHone (2011).
-
3.
The impact parameter of a merger is 1 Mpc and the infall velocity is 1352 km s-1.
-
4.
The initial distance between the primary and the infalling subcluster is 2.6 Mpc.
-
5.
Both clusters host a cool core. The gas temperature of the primary cluster increases from 2.1 keV at the center to a maximum of 5.3 keV at 210 kpc, whereas that of the infalling subcluster increases from 1 keV at the center to 2.6 keV at 130 kpc.
5.2 Tests of our imaging analysis using simulated X-ray data
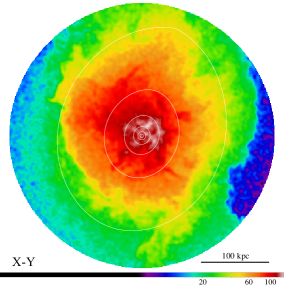
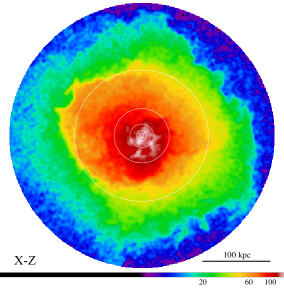
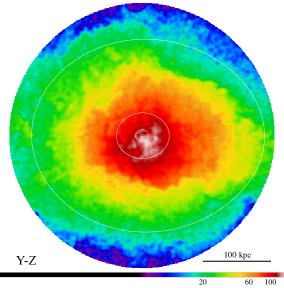
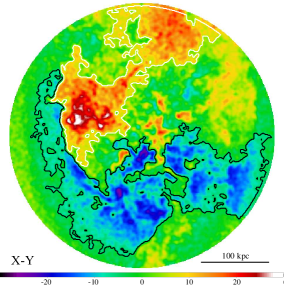
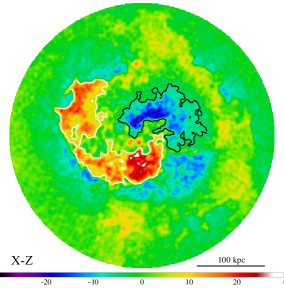
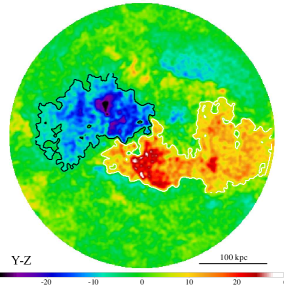
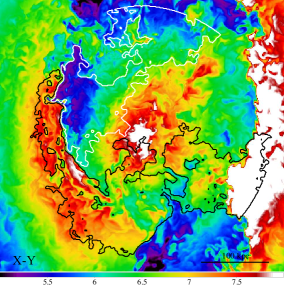
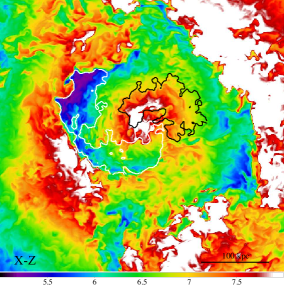
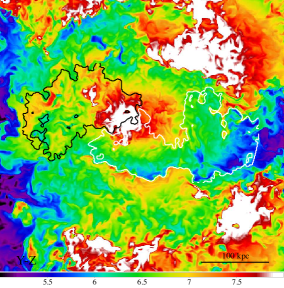
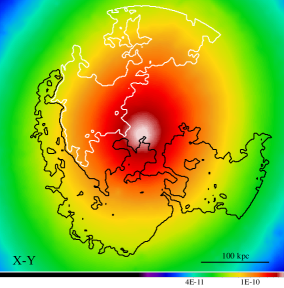
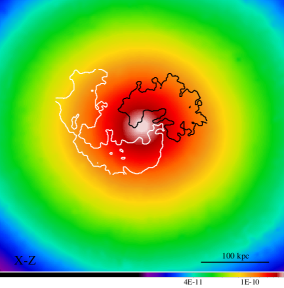
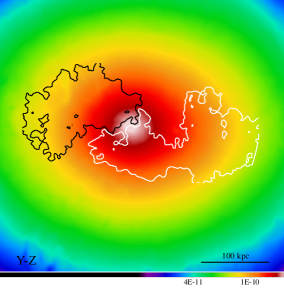
Figure 2 shows the results of our cluster merger simulation in different viewing directions, i.e., X-Y, X-Z, and Y-Z planes, respectively. The merger has taken place in the plane of the sky (i.e., the X-Y plane) so that the majority of the disturbed ICM is moving in the plane of the sky. We extract a region 2.3 Mpc 2.3 Mpc from the simulated data, and the pixel corresponds to 1 kpc squared. We extracted a region of the central 200 kpc to apply our detection algorithm.
The top panels of Figure 2 show simulated X-ray images of the central 200 kpc at three viewing angles. The centrally peaked feature in the X-ray surface brightness can be found in each simulated X-ray image so that this simulated cluster can be identified as a relaxed cluster regardless of the viewing angles. The white contours in the top panels of Figure 2 show the shape of the dark matter halo. Although the initial shape of the dark matter halo is circularly symmetric, its shape is slightly elongated due to this merger. The shape of the X-ray surface brightness is well-aligned with that of the dark matter halo. As described in Section 4.1, the observed shape of the X-ray surface brightness is in good agreement with that of the SL mass map. We confirmed this property by our simulations.
The second panels of Figure 2 show X-ray residual images of the three viewing angles after subtracting the mean surface profile using our method described in Section 4.1. Using the same definition to identify a perturbed region mentioned in Section 4.1, we found both positive and negative excess regions, indicating that they are a universal feature regardless of viewing angles. The white and black regions show the positive and negative excess regions, respectively. In this analysis, the center of an ellipse model is fixed to be that of the dark matter halo, which is comparable to the method that we used in Section 4.1. The measured PA and AR for each X-ray surface brightness image are and for the X-Y plane, and for the X-Z plane, and and for the Y-Z plane, respectively.
The third panels of Figure 2 show emission weighted temperature maps of the three viewing angles. The positive and negative excess regions are overlaid on each temperature map. To evaluate the ICM temperature, we calculated the mean and standard deviation of the temperature in each perturbed region. These results are summarized in Table 7. The positive and negative excess regions are associated with lower temperature gas and higher temperature gas, respectively. All the characteristic property is consistent with the observable of gas sloshing. This result, therefore, demonstrates that our detection algorithm can detect and distinguish the lower gas temperature region as a positive excess and higher gas temperature region as a negative excess.
| Viewing angle | Temperature (keV) | |||
|---|---|---|---|---|
| Mass peak | X-ray peak | |||
| Positive | Negative | Positive | Negative | |
| X-Y plane | ||||
| X-Z plane | ||||
| Y-Z plane | ||||
We checked pressure maps of the three viewing angles shown in the bottom panels of Figure 2. We found no pressure discontinuity in the perturbed region and in between, which are consistent with the picture that gas motions induced by gas sloshing are subsonic and consistent with pressure equilibrium.
We also investigated the ICM temperature in the perturbed region after ellipse modeling by choosing the peak position of the simulated X-ray image as the center of the ellipse model. This type of procedure is frequently used when only X-ray imaging data are available. We found that the X-ray peak in each viewing angle is located at 5.4 kpc for the X-Y plane, 10.8 kpc for the X-Z plane, and 16.6 kpc for the Y-Z plane away from the center of dark matter halo. Hence, the measured PA and AR are and , and , and and , respectively. We created an X-ray residual image of each viewing angle and measured the temperature in the positive and negative excess regions. The results are summarized in Table 7. The temperature difference is almost consistent with that shown in the above study, whereas the result of the Y-Z plane raises a caution that no temperature difference may be found in between the positive and negative excess regions. This result indicates that the ellipse model determined around the mass peak may be a better tracer for lower and higher temperature regions than that determined around the X-ray peak. However, a further study is needed to validate this hypothesis.
This sanity check using the hydrodynamic simulation indicates that (1) the positive and negative excess regions induced by a cluster merger can be identified as the perturbed regions using our imaging analysis, and (2) the ICM temperature in the positive excess region is systematically lower than that in the negative excess region. In addition, the ellipse model determined around the mass peak seems to be better than that determined around the X-ray peak.
On the other hand, we measured the contrast of gas density perturbations (i.e., ) in each X-ray residual image using both ellipse models. The estimated values in each viewing angle are summarized in Table 8. the contrast of gas density perturbations in the simulated X-ray image is comparable to the observed values shown in Table 6.
| Viewing angle | ||
|---|---|---|
| Mass peak | X-ray peak | |
| X-Y plane | ||
| X-Z plane | ||
| Y-Z plane | ||
6 Discussion
6.1 Thermodynamic properties of gas sloshing
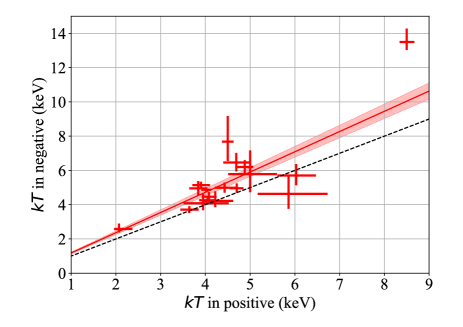
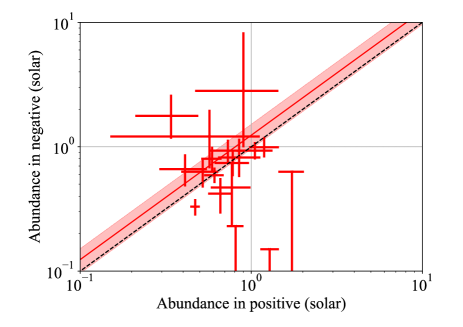
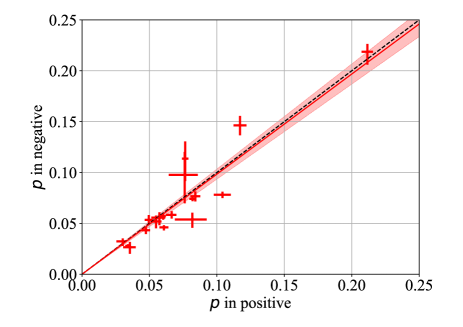
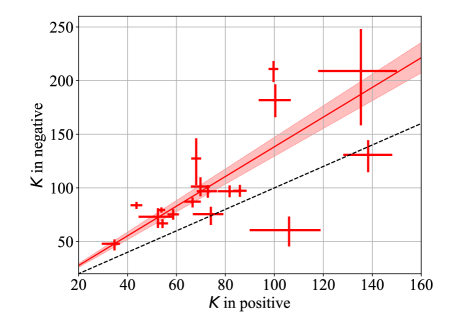
We have characterized the thermodynamic properties of the ICM in the perturbed regions found in the cool cores. To reveal their origin and characteristics from the systematic manner, we first compared the ICM properties in the positive excess regions with that in the negative excess region. Figure 3 shows their differences in terms of temperature, abundance, pressure, and entropy, respectively. Since the region #2 of MACSJ 1423.8+2404 and the region #2 of MACS J1931.8-2634 have no counterpart region, we excluded these two regions from the comparison.
We fitted each parameter using a linear model without an intercept, i.e., . This is because there is expected to be no difference if no gas density perturbations are found in a cool core. As shown in Figure 1, the positive and negative excess regions are located at similar distances from the center. If there is no gas density perturbations, the temperature and abundance of the ICM in a cool core are expected to be azimuthally symmetric, and, within errors, there would be no differences in physical quantities between the positive and negative excess regions. If there is no density and temperature perturbation, no differences in pressure and entropy can be found either.
The best-fit model of each parameter and its confidence level are shown in Figure 3. We also summarized the best-fit slope of the linear model in Table 9. We found that the ICM temperature in the negative excess regions is systematically higher than that in the positive excess regions, while the ICM abundance appears to be consistent between the positive and negative excess regions. In addition, we found that the best-fit model of the pressure is consistent with unity. In the case of the entropy, the best-fit model shows a deviation from unity clearly.
| ICM property | slope () |
|---|---|
| Temperature | |
| Abundance | |
| Pressure | |
| Entropy |
The temperature difference between the positive and negative excess regions is one of the well-known features of gas sloshing. As mentioned in Section 4.2, if we focused on individual clusters, we found that a few clusters have the clear feature of gas sloshing in their ICM property. However, we confirmed that the temperature difference is found in all the galaxy clusters in our sample, suggesting that a systematic study is powerful to reveal the origin of gas density perturbations. We showed that the ratio of temperature difference is . We need more data to confirm whether or not this ratio can be an indicator to identify gas sloshing.
As mentioned in Section 5.2, we have also measured the temperature difference in the simulated data. The ratio found by the simulations in each viewing angle is for the X-Y plane, for the X-Z plane, for the Y-Z plane. Their ratios are consistent with those measured by the observed trend (see the top left panel of Figure 3 or Table 9). This result supports that the observed temperature difference is generated by a merger, i.e., gas sloshing.
For the ICM abundance, we found no apparent offset between the positive and negative excess regions. The abundance gradient between them is reported in some cool cores (e.g., Ghizzardi et al., 2014). Such gradient is predicted by gas sloshing because an inflowing hot gas has a lower abundance than the gas originally in a cool core. Such feature is however not reported in some other cool-core clusters (e.g., Clarke et al., 2004; Sanders et al., 2014; Ueda et al., 2017). The observed trend in the ICM abundance is comparable to unity, i.e., no difference, implying that the inflow of a relatively hot gas comes from nearby a cool core so that the gradient could be relatively small.
The important result is evidence of pressure equilibrium among the perturbed regions. This result is consistent with the picture of gas sloshing, as shown in the bottom panels of Figure 2. Although Ueda et al. (2018) showed the direct evidence of pressure equilibrium of sloshing gas in RXJ 1347.5-1145 using the combined analysis of X-ray and SZE data, we extended this point to 12 cool cores. This result then indicates that the gas density perturbations generated by gas sloshing is isobaric, which is reported applying the effective equation of state (e.g., Churazov et al., 2016; Zhuravleva et al., 2018) and solving the equation of state for the gas density perturbations based on the X-ray and SZE images (Ueda et al., 2018). To confirm this property, we also applied a linear regression analysis into the data. We then found that the obtained confidence level is consistent with unity in the entire scale, i.e., no intercept is indicated. This result is in good agreement with that derived by the linear model fit without an intercept.
Based on the pressure equilibrium (see the bottom left panel of Figure 3) and the temperature difference (see the top left panel of Figure 3), a deviation from the mean density profile can be estimated. Following the slope for the temperature profile in Table 9, the number density in the positive excess region is a factor of 1.18 times larger than that in the negative excess region. This implies that the deviation from the mean density profile is considered to be %. According to Equation 4 in Ueda et al. (2018), the value of approximates , where is the mean square gas mass density. This means that if an amplitude of a density fluctuation is %, an amplitude of the surface brightness perturbation becomes %. This result is comparable to the observed value of the contrast of gas density perturbations (see Table 6). In addition to the observations, we found a similar amplitude in the simulated X-ray data. Using the same estimate as above, the density perturbation is inferred because of the pressure equilibrium. The average of temperature ratio in the simulations is , which indicates that the density difference is %. The inferred value is consistent with that estimated by the observations.
Owing to the observed temperature and density differences, the differences of the entropy are found to be significant, as shown in the bottom right panel of Figure 3. Through mixing of gas between the positive and negative excess regions induced by sloshing and/or turbulent gas motions, such an entropy difference can result in the increase of the gas temperature in the positive excess region.
We found that all the cool cores in our sample (i.e., 12 galaxy clusters) have feature suggesting gas sloshing. We then inferred a fraction of the sloshing cool cores to be % (95 % CL) at least in high mass, relaxed galaxy clusters like the CLASH sample.
AGN feedback can also induce gas density perturbations in the cool core. Hlavacek-Larrondo et al. (2013b) reported an X-ray cavity created by an extreme AGN feedback in RX J1532.9+3021. For other clusters in our sample, Hlavacek-Larrondo et al. (2012) searched for X-ray cavities in the X-ray surface brightness. However, Churazov et al. (2016) found in the Perseus cluster that the ICM in X-ray cavities where are identified as bubbles is isothermal, solving the effective equation of state for small-scale perturbation. Since the ICM density in the X-ray cavities is smaller than the surroundings, there is identified as the negative excess region in our definition. Combining both properties, the thermal ICM pressure in the X-ray cavities is expected to be smaller than that in the positive excess region, which is inconsistent with the observed trend of the ICM pressure. The observed result favors that an isobaric process is reasonable to explain no pressure difference between the positive and negative excess regions. Even though some gas density perturbations are associated with the AGN feedback, our results indicate that most of gas density perturbation is induced by gas sloshing from the systematic manner.
6.2 Contrast of gas density perturbations and its implications
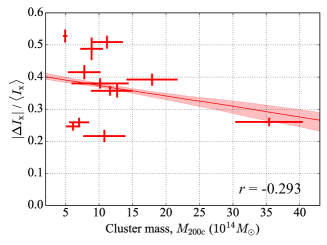
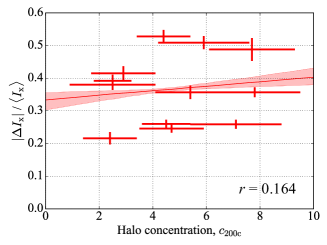
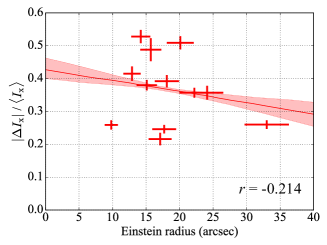
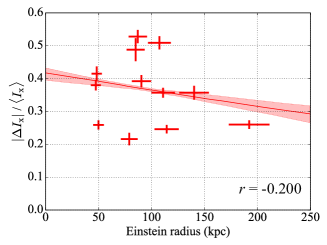
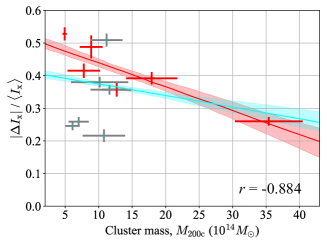
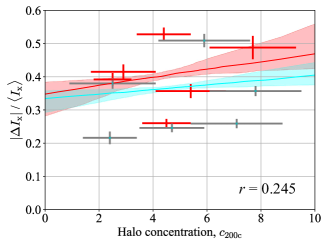
In Section 4.3, we have introduced as a proxy of the contrast of gas density perturbations, following Ueda et al. (2018). Here we compare this X-ray brightness contrast with cluster mass and structural parameters, namely the total cluster mass (), the concentration parameter (), and the Einstein radius obtained by previous CLASH lensing studies (Zitrin et al., 2015; Merten et al., 2015; Umetsu et al., 2016, 2018). We adopt and of each cluster from Umetsu et al. (2016). Since MACSJ 1311.0-0310 and MACSJ 1423.8+2404 (for which weak-lensing magnification data were not available; see Umetsu et al., 2014) were not included in the analysis of Umetsu et al. (2016), we adopt and of these two clusters from Merten et al. (2015). Since Merten et al. (2015) obtained lensing mass estimates that are, on average, 7 % smaller than those of Umetsu et al. (2016), we apply a correction factor of 7 % (i.e., to 1.07) to the lensing mass estimates from Merten et al. (2015).
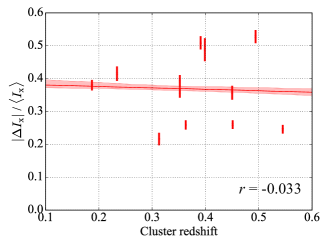
Figure 4 shows the contrast of gas density perturbations in terms of each lensing parameter. The best-fit model and its confidence level are also displayed in Figure 4. The sample correlation coefficients of each pair were calculated using the best-fit parameters. Their coefficients indicate that the contrast of gas density perturbations is not correlated strongly with the lensing parameters. For example, the correlation coefficient between and (see the top left panel of Figure 4) is , suggesting an anti-correlation. Although the current sample size is small, we discuss possible implications of these results below.
Cluster mergers with similar masses are expected to to produce larger gas density fluctuations in cool cores (Ricker & Sarazin, 2001). High-mass primary clusters tend to have frequent minor mergers with small mass ratios. In this context, if gas sloshing is the mechanism responsible for the observed gas density fluctuations, an anti-correlation is expected in the mass profile (the top left panel of Figure 4). In fact, their relation shows a slight anti-correlation even though the number of data points is limited. Other parameters such as the impact parameter can also affect the amplitude of gas density perturbations. A large scatter in the mass range of might reflect a variety of a mass of an infalling cluster and its impact parameter. In future work, we will investigate which merger parameters dominate the generation of gas density perturbations in cool cores of galaxy clusters.
On the other hand, the relation between the contrast of gas density perturbations and the concentration parameter implies that it has a slight positive correlation (see the top right panel of Figure 4). If a galaxy cluster has a large concentration parameter, then it has a large amount of matter in the cluster core compared to that with a small concentration parameter. The total amount of movable matter by gas sloshing is important to create gas density perturbations. In this sense, the observed trend is consistent with that expected by gas sloshing. This idea is also supported by an anti-correlation between the contrast of gas density perturbations and the Einstein radius. The clusters with centrally concentrated mass host larger gas density perturbations. However, it is hard to arrive at a firm conclusion regarding the origin of their correlations from the current dataset with a limited sample size. More observations and numerical simulations are needed to clearly understand the origin of the correlations.
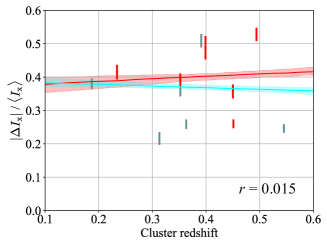
In the plot of the cluster redshift (the bottom panel of Figure 4), we found no strong correlation.
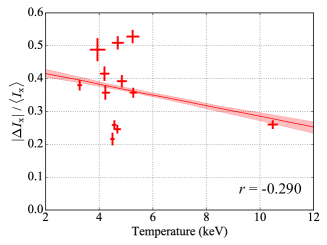
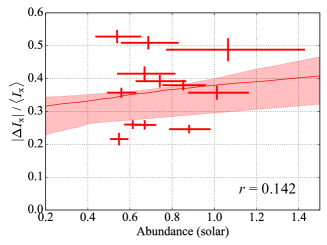
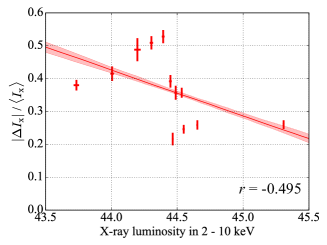
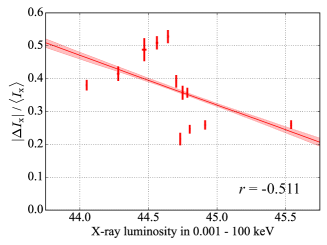
In addition to the lensing associated parameters, we showed the contrast of gas density perturbations against the ICM parameters such as the temperature, abundance and X-ray luminosity in the whole perturbed region in Figure 5. The sample correlation coefficients of each pair are also shown in Figure 5. The trends in the ICM temperature and X-ray luminosity are similar to those in the mass, i.e., an anti-correlation. Since a massive cluster is luminous and its ICM temperature is high, these results prefer the scenario that a massive cluster has a smaller gas density perturbations in the cool core, which is consistent with the result from the comparison with the lensing parameters. On the other hand, the ICM abundance seems to have a slightly positive correlation. No correlation is however acceptable. Since how the metal is concentrated toward the cluster center depends on the evolution of the BCG, it seems to be hard to characterize gas sloshing.
6.3 Sample of strong gas sloshing candidates
As mentioned in Section 6.1, the observed trend of each ICM property is consistent with the scenario that a majority of the gas density perturbations is created by gas sloshing. However, RXJ 1532.9+3021 and MACS J1931.8-2634, in fact, host an apparent X-ray substructure in their cool cores most likely due to the AGN feedback (e.g., Ehlert et al., 2011; Hlavacek-Larrondo et al., 2013b). To investigate the characteristics of gas sloshing, we selected strong gas sloshing candidates out of our sample that they have only one positive and one negative excess regions in their X-ray residual images and their morphology seems to be a spiral, which is a typical pattern of gas sloshing taking place in the plane of the sky shown by numerical simulations (e.g., Ascasibar & Markevitch, 2006; ZuHone et al., 2010; Roediger et al., 2011). That pattern is also shown in our simulations (see Figure 2).
We chose six out of 12 galaxy clusters, i.e., MACSJ 0329.6-0211, MACSJ 0429.6-0253, MACSJ 1115.8+0129, MACSJ 1311.0-0310, RXJ 1347.5-1145, and RXJ 2129.6+0005, based on the X-ray residual image and the thermal properties of the ICM listed in Table 4. Using this limited sample, we refitted the contrast of gas density perturbations with respect to the total cluster mass, concentration parameter, and cluster redshift, respectively. Figure 6 shows the new best-fit model. The trend in the total cluster mass has more explicit anti-correlation than that shown in the previous one. In addition, the trend in the concentration parameter is slightly steeper than that in the original one. These trends allow us to emphasize that the majority of gas density perturbations are associated with gas sloshing, implying that the contrast of gas density perturbations is a good tracer for gas sloshing. On the other hand, the trend in the cluster redshift is offset from the previous one, indicating that the distribution of this limited sample is the same as that of the original sample.
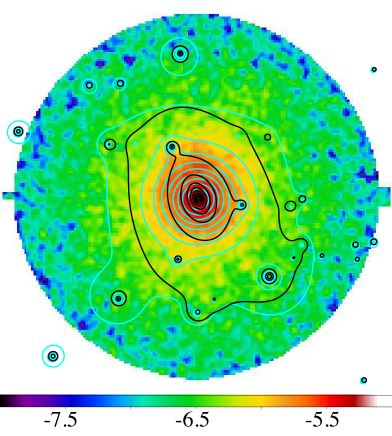
6.4 Comparison with the Strong-Lensing Mass Map
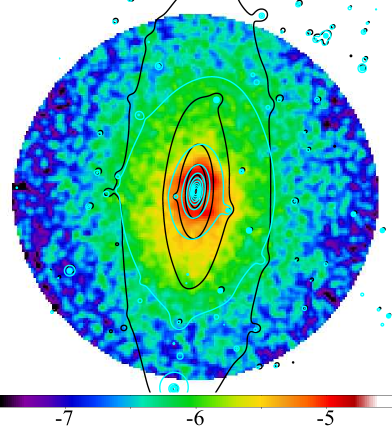
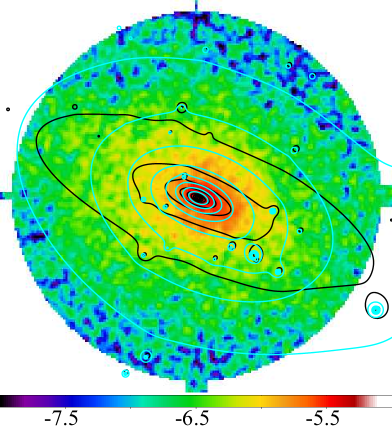
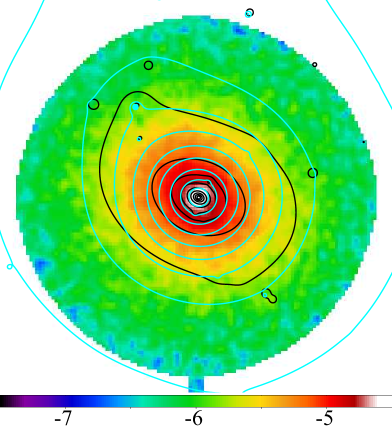
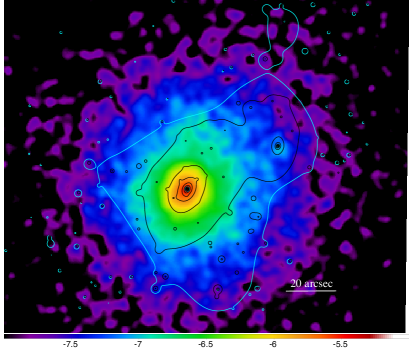
To search for substructures in the central mass distribution and to identify their origin, we compared the X-ray surface brightness with the central mass distribution from the CLASH SL modeling by Zitrin et al. (2015). We employed two mass maps, i.e., the NFW model and the light-traces-mass (LTM) model. Figure 7 shows the contours of both mass maps overlaid on the X-ray surface brightness. As mentioned in Section 4.1, the morphology of X-ray surface brightness is in good agreement with the dark matter distribution.
We found that MACSJ 0329.6-0211 has a substructure in the central mass distribution in the northwest direction. Figure 8 shows the zooming-out mass map of both the NFW and LTM models overlaid on its X-ray surface brightness. As shown in Figure 1, the spiral-like pattern is found in the X-ray residual image. The thermodynamic properties of the ICM in the positive and negative excess regions are compatible with the nature of gas sloshing. If this substructure in the mass map is associated with an infalling subcluster, gas sloshing in this cluster may be induced by this secondary component. On the other hand, we found no apparent feature of gas stripping around the secondary component, indicating that a merger is in the second passage or more. We will discuss this feature in detail in Section C.
For RXJ 1347.5-1145, Zitrin et al. (2015) found the secondary component in the central mass distribution in the southeast region. As already studied by e.g., Ueda et al. (2018), this substructure is considered to be in the first passage because of the presence of the stripped and shock-heated gas behind this secondary component. No association of the secondary component with the X-ray surface brightness in MACSJ 0329.6-0211 implies that the merger time scale in this cluster is longer than that RXJ 1347.5-1145.
No substructure in the central mass distribution is found in the other clusters. This indicates that the substructure in the cluster center is rare even though gas sloshing is taking place in their cool cores. An infalling subcluster is then considered to be located far away from the cluster center. The weak-lensing (WL) analysis thus enables us to search for such substructures, while it is hard to identify which substructure is responsible for gas sloshing (e.g., Figure 1 of Umetsu et al., 2014, for the CLASH sample). On the other hand, the presence of several substructures in the WL mass map indicates that gas sloshing can take place continuously in different time scale. Namely, each substructure allows to induce gas sloshing until its kinetic energy is lost. In addition, numerical simulations indicate that sloshing gas motions are long-lived structures and they can persist for several to many Gyrs after the subclusters merged with the primary cluster. This can be another reason for the absence of substructures in the core.
6.5 Gas sloshing as a possible mechanism to suppress runaway cooling
As indicated by previous studies of numerical simulations (e.g., Fujita et al., 2004; ZuHone et al., 2010) and recent observations (e.g., Su et al., 2017), gas sloshing can be a possible candidate to suppress runaway cooling. It is still under debate whether or not all of cool-core clusters experiences gas sloshing, while our results indicate that gas sloshing occurs in most of cool cores. Our results, therefore, support this hypothesis.
The redshift range of our sample is . The time scale in this redshift range then corresponds to over Gyr, which indicates that gas sloshing can be effective in more than 3 Gyr. On the other hand, we inferred the fraction of the sloshing cool core to be 80 % (95 % CL). Since the cool core fraction in the CLASH clusters is 48 % (i.e., 12/25), which is consistent with that measured by X-ray-selected samples (e.g., Andrade-Santos et al., 2017). The time scale inferred from the fraction is then 3.7 Gyr assuming that a cluster is formed since , i.e., 7.8 Gyrs ago. Both estimates are in agreement with each other. Since it can be considered that gas sloshing injects heat into the ICM in Gyr, gas sloshing is possible to suppress runaway cooling of the ICM, as suggested by numerical simulations. However, it is still unclear how an amount of energy can be deposited by a merger through gas sloshing. An energy injection rate is important to understand the capability of gas sloshing. We will investigate this subject using hydrodynamic simulation in future.
Gas sloshing is capable of inducing the KHI. The kinetic energy of gas sloshing can be dissipated through the KHI-induced turbulence. For the Perseus cluster, Ichinohe et al. (2019) estimated the KHI-induced turbulent heating rate per unit volume to be erg cm-3 s-1. If this heating rate is the case, the heating rate of gas sloshing, therefore, can be inferred to be kpc erg s-1, assuming that the volume of the sloshing region is spherical and its radius is 100 kpc. The inferred heating rate is larger than the observed cooling rate of the sample, i.e., the bolometric X-ray luminosity ( erg s-1; see the bottom right panel of Figure 5), except for RXJ 1347.5-1145. In spite of a rough estimate, this result is supportive of the capability of gas sloshing.
In addition, we estimated the total energy injected by gas sloshing using the time scale of sloshing (i.e., Gyr). The total energy is thus estimated as kpc erg. If the initial velocity of an infalling subcluster is 1000 km s-1, the required total mass is then , which is comparable to a massive galaxy if the efficiency is unity. In a realistic case, the efficiency would be smaller than unity. If the efficiency would be 10 %, the required mass becomes the group scale. Our estimate indicates that one minor merger induced by an infalling galaxy group per 3 Gyr enables to suppress runaway cooling of the ICM through gas sloshing. However, this estimate is too rough to propose that gas sloshing is responsible for the heating source for the entire cluster age.
On the other hand, numerical simulations suggest that gas sloshing can weaken a strong centrally-peaked X-ray surface brightness (e.g., ZuHone et al., 2010). This effect reduces the number density of the ICM in the center so that the effective cooling time is expected to be longer than the previous value. Since larger concentration parameters lead to larger contrast of gas density perturbations (see the top right panel of Figure 4), the centrally peaked X-ray surface brightness is expected to be reduced after gas sloshing. In addition, turbulent heat conduction (Cho et al., 2003; Kim & Narayan, 2003; Voigt & Fabian, 2004) induced by sloshing gas motions may work effectively to enhance mixing between hotter and cooler gas. If the viscosity of the ICM is low, this effect works well in cool cores except at the very center. Both dissipation of turbulent kinetic energy and heat transport by turbulent mixing and electron conduction play an important role in gas sloshing as a heating source.
We note here that some limitations of the capability of gas sloshing to stop runaway cooling have been reported. ZuHone et al. (2010) carried out one of the first numerical studies of gas sloshing and have pointed out that gas sloshing is unable to prevent a cooling catastrophe for more than 1-2 Gyrs under some merger conditions, suggesting that the capability of gas sloshing strongly depends on the cluster mass ratio and impact parameter of mergers. In addition, magnetic fields in the ICM may suppress not only mixing of gas but also perturbations induced by the KHI, as shown in e.g., ZuHone et al. (2011). Even though magnetic fields of the ICM and thermal conduction are taken into account, the capability of gas sloshing to stop runaway cooling is still not clear due to such complex uncertainties (e.g., ZuHone et al., 2013b). Further investigations using cosmological hydrodynamic simulations are needed to understand the effect of gas sloshing on gas cooling in cool-core clusters.
6.6 Gas sloshing and radio mini-halos
Some cool-core clusters host a diffuse radio emission feature, a so-called radio mini-halo, in their cores (Feretti et al., 2012; van Weeren et al., 2019, for reviews). Radio mini-haloes are extended on a scale of kpc. The morphology of radio mini-haloes appears to be associated with that of cool cores in X-rays. Mazzotta & Giacintucci (2008) found a spatial correlation between the substructure induced by gas sloshing and a radio mini-halo. Such correlation is also found in the Perseus cluster (Walker et al., 2017). ZuHone et al. (2013a) proposed using numerical simulations that sloshing motions generate turbulence and such turbulence is potentially enough to produce diffuse radio emission.
Our results indicate that most of the cool cores have experienced gas sloshing. If gas sloshing is responsible for creating a radio mini-halo, our results support this assumption. In fact, a diffuse radio emission has been detected in seven clusters out of our sample: MACSJ 0329.6-0211 (Giacintucci et al., 2014), MACSJ 1115.8+0129 (Pandey-Pommier et al., 2016), RXJ 1347.5-1145 (Gitti et al., 2007), RXJ 1532.9+3021 (Kale et al., 2013), MACS J1720.2+3536 (Giacintucci et al., 2017), MACS J1931.8-2634 (Giacintucci et al., 2014), and RXJ 2129.6+0005 (Kale et al., 2015). We note that MACS J1931.8-2634 is classified into an unclassified source (Giacintucci et al., 2014; van Weeren et al., 2019), and MACSJ 1115.8+0129 and MACS J1720.2+3536 are recognized as a candidate for radio mini-halo (Pandey-Pommier et al., 2016; Giacintucci et al., 2017; van Weeren et al., 2019). The four clusters out of the limited sample introduced in Section 6.3 are included in the above list. A deep radio observation of the remaining clusters will provide us with a good opportunity to test this assumption.
6.7 Importance of high-resolution, cosmological hydrodynamic simulations
High-resolution, cosmological hydrodynamic simulations provide a useful tool to understand gas dynamics and thermodynamics in galaxy clusters, and guide us to study the physical properties of X-ray substructures (e.g., Lyskova et al., 2019). Even though there have been numerous numerical studies to interpret multi-wavelength observations of galaxy clusters, there is a significant lack of understanding of how the thermodynamic properties of the ICM co-evolve with the dark-matter potential through merging processes. For example, if a secondary merger occurs while the cool core is still experiencing gas sloshing, what kind of gas density perturbations can we observe? In addition, how can gas sloshing impact on the AGN feedback and its remnant in the X-ray surface brightness? Gas sloshing probably coexists with the AGN feedback in the cool core, as shown in this paper. As demonstrated by the Hitomi observations of the Perseus cluster, a gas motion induced by gas sloshing and the AGN feedback coexists in the cool core (Hitomi Collaboration et al., 2016, 2018). In fact, Fujita et al. (2019) have proposed that ubiquitous turbulence induced by mass accretions and AGN feedback are both important to maintain the balance between cooling and heating in cool cores on a long time scale. High-resolution spectroscopy with high-resolution imaging allows us to measure the thermodynamics and dynamics of the ICM in the cool core in detail. The next generation X-ray observatory such as Athena (Nandra et al., 2013) and Lynx (The Lynx Team, 2018) will be capable of resolving such gas motion more accurately. The bridge between gas sloshing and the AGN feedback will help us to understand the thermal evolution of the ICM in terms of a cosmological point of view in future.
As discussed in Section 6.4, galaxy clusters host several substructures in their WL mass distributions, which are expected to induce gas sloshing features in their cool cores. Numerical simulations are needed to interpret multi-wavelength observations of such a complex system. The frequency of gas sloshing and the total kinetic energy of infalling subclusters are key factors to understand the role and importance of gas sloshing in suppressing runaway cooling of the ICM in the cool core. Further observational and theoretical studies are required to understand the nature of gas sloshing in context of the evolution of galaxy clusters.
We will investigate this subject in our future work using high-resolution cosmological hydrodynamic simulations. As demonstrated in Section 5, numerical simulations can be used to test and validate our methodology and analysis tools, and guide us to understand the ICM properties in sloshing cores. We will study the dependence of ICM parameters, such as the temperature difference and the contrast of gas density perturbations, as a function of the merger geometry and initial conditions of the primary cluster. In a future work, we will study key parameters related to gas sloshing, i.e., the heating rate, time scale, and efficiency converted into heat.
7 Conclusions
In this paper, we carried out a systematic study of gas density perturbations in cool cores of 12 high-mass relaxed clusters selected from the CLASH sample. Our analysis is based on archival X-ray data from the Chandra X-ray Observatory and the publicly available strong-lens mass models of Zitrin et al. (2015). The main conclusions of this paper are summarized as follows.
-
1.
All 12 relaxed clusters in our sample exhibit gas density perturbations in their cool cores. They have regions with, at least, one positive excess and one negative excess regions in their X-ray residual image after removing their mean X-ray surface brightness distribution. The observed position angle and axis ratio of the X-ray surface brightness are in good agreement with those of the central mass distribution obtained from the HST SL modeling.
-
2.
We identified locally perturbed regions on the basis of gas density fluctuations in the X-ray residual image. We extracted and analyzed X-ray spectra of the ICM in the perturbed regions, finding that the thermodynamic properties of the ICM are consistent with those perturbed by gas sloshing. In particular, the ICM in the perturbed regions is found to be in pressure equilibrium. Our results indicate that gas sloshing in cool cores takes place in more than 80 % of relaxed galaxy clusters (95 % CL).
-
3.
We carried out a hydrodynamic simulation of a cluster merger to produce the synthetic X-ray observations of cool-core clusters in gas sloshing. By analyzing the simulated X-ray images, we found that our detection algorithm can accurately extract both the positive and negative excess regions and can reproduce the temperature difference between them, which is consistent with that found in the observations.
-
4.
We quantified the contrast of gas density perturbations (i.e., ) and compared it with X-ray observables and lensing properties, such as the cluster mass () and the concentration parameter (). the contrast of gas density perturbations is found to anti-correlate with the total cluster mass, whereas it has a positive correlation with the concentration parameter. The observed trends indicate that the gas density perturbations are most likely induced by gas sloshing.
-
5.
We found no apparent secondary dark-matter component in the central mass distribution, except for the cases of MACSJ 0329.6-0211 and RXJ 1347.5-1145. This indicates that, for the majority of the sample, the original perturber of gas sloshing, i.e., infalling subcluster(s), is likely located in the outer regions. Another possible reason is that, as indicated by numerical simulations, sloshing gas motions are long-lived structures. They persist for several to many Gyrs, perhaps even after the subclusters merged with the primary cluster.
-
6.
Our results indicate that the majority of density perturbations in cool cores of our sample are induced by gas sloshing. On the other hand, some perturbations appear to arise from AGN feedback (e.g., X-ray cavities), as found in the X-ray residual image of RXJ 1532.9+3021. High-resolution hydrodynamic simulations including AGN feedback physics will allow us to quantify the relative impact of gas sloshing and feedback mechanisms on the thermodynamic properties of the ICM in cool cores.
-
7.
The heating rate inferred from KHI-induced turbulence due to gas sloshing is found to be larger than the bolometric X-ray luminosity in the perturbed region, except for RXJ 1347.5-1145, suggesting that gas sloshing is a possible heating source. The total energy injected by gas sloshing over 3 Gyr is estimated as erg. This indicates that a minor merger induced by a galaxy group could be enough to suppress runaway cooling of the ICM, if the efficiency is as high as 10 %.
-
8.
In agreement with previous studies, our results indicate that turbulence induced by gas sloshing provides a possible origin of radio mini-haloes. In fact, seven galaxy clusters in our sample show diffuse radio emission in their center. Deep radio observations are needed to test this hypothesis.
Appendix A Information of individual galaxy clusters
We summarized the brief information of individual galaxy cluster about previous X-ray observations and related results. Since Donahue et al. (2014) and Donahue et al. (2016) have studied all of the sample, we do not mention their results in this section.
A.1 A383
This cluster is analyzed in X-rays by Allen et al. (2008) and Newman et al. (2011), while no detailed study is reported thus far. This cluster seems to experience line-of-sight gas sloshing. The pattern in the X-ray residual image is similar to that found in Abell 907, which is identified as the system of line-of-sight sloshing (Ueda et al., 2019). In addition, the best-fit parameters of the ICM properties in both the positive and negative excess regions are consistent with those expected by line-of-sight gas sloshing.
A.2 MACSJ 0329.6-0211
Giacintucci et al. (2014) have studied this cluster using Chandra and VLA. This cluster appears to be relaxed and a candidate of radio mini-halo is found in the cluster center.
A.3 MACSJ 0429.6-0253
Hlavacek-Larrondo et al. (2012) have reported that two clear, small ( kpc) cavities are found in the cluster center. However, the power inferred from the size of the cavities is significantly smaller than the bolometric X-ray luminosity in the core.
A.4 MACSJ 1115.8+0129
A.5 MACSJ 1311.0-0310
Hlavacek-Larrondo et al. (2012) have reported that no cavity is found in this cluster.
A.6 RXJ 1347.5-1145
This cluster is one of the most luminous X-ray clusters and hosts a strong cool core. In addition, this cluster is recognized as a major merging cluster. A substructure exists in the southeast region in X-rays, SZE, and SL (e.g., Komatsu et al., 2001; Allen et al., 2002; Kitayama et al., 2004; Köhlinger & Schmidt, 2014; Kitayama et al., 2016; Ueda et al., 2018). The dipolar pattern in the X-ray residual image indicates that gas sloshing takes place in the core (Johnson et al., 2012; Kreisch et al., 2016; Ueda et al., 2018). The velocity of sloshing motion is inferred solving the equation of state for gas density perturbations using both X-ray and SZE data. Thus, the inferred velocity is smaller than the adiabatic sound speed, indicating that the gas motion is subsonic (Ueda et al., 2018). This result is also shown by Di Mascolo et al. (2019).
A.7 MACSJ 1423.8+2404
Hlavacek-Larrondo et al. (2012) have studied this cluster and reported the presence of cavities. The power stored in the cavities is estimated to be sufficient to suppress gas cooling within the cooling radius.
A.8 RXJ 1532.9+3021
Hlavacek-Larrondo et al. (2013b) have studied this cluster in detail. This cluster has an apparent X-ray cavity in the west and relatively weak X-ray cavity in the east. They estimated the total mechanical power of the cavities and indicated that it is sufficient to offset runaway cooling in the cluster core. Giacintucci et al. (2014) have confirmed the presence of a radio mini-halo in this cluster.
A.9 MACS J1720.2+3536
Hlavacek-Larrondo et al. (2012) have shown two cavities in the core. The inferred power in the cavities using the buoyancy time-scale does not meet the requirement to prevent cooling.
A.10 MACS J1931.8-2634
A luminous X-ray AGN exists in the center of this cluster. Ehlert et al. (2011) have studies this cluster deeply and have reported that an extended radio emission is observed and elongated in the east-west direction, which is spatially associated with the X-ray cavities. This cluster therefore has one of the most powerful AGN outbursts known. This cluster also hosts a strong cool core but the ICM temperature in the innermost region increases (Ehlert et al., 2011). This feature is also reported by Hlavacek-Larrondo et al. (2012). Ehlert et al. (2011) found a spiral-like feature composed of relatively cool, dense ICM in the core, which is likely to be associated with gas sloshing.
A.11 RXJ 2129.6+0005
Giles et al. (2017) have reported the radial profile of the ICM temperature. This cluster hosts a strong cool core.
A.12 MS 2137.3-2353
Hlavacek-Larrondo et al. (2012) have reported a cavity in the south direction from the center.
Appendix B Comparison of X-ray surface brightness to SL mass map
We summarized the comparison of the X-ray surface brightness to the SL mass map in each galaxy cluster in this section.
Appendix C Substructure in MACSJ 0329.6-0211
As mentioned in Section 6.4, we found the substructure in the central mass distribution in MACSJ 0329.6-0211 as shown in Figure 8. The secondary component is (or kpc) away from the primary peak toward the northwest direction. No apparent X-ray substructure is found around the secondary component.On the other hand, as shown in Figure 1, the X-ray residual image of this cluster shows a spiral-like feature. The positive excess region is located at the southeast region and the negative excess region is found in the northwest region. If the secondary component is associated with a past merger and the case to induce gas sloshing in its cool core, the morphology of this spiral pattern is consistent with this merger scenario. In addition, under this scenario, the trajectory of the secondary component is expected to be from the northeast to southwest direction.
If the secondary component is in the first passage, the stripped gas originally in a subcluster could be found along with its trajectory such as RXJ 1347.5-1145 (Ueda et al., 2018). However, no apparent feature of gas stripping is found. In this sense, it is attracted that the subcluster is in the second passage or more. To find clear evidence of the X-ray substructure, deep X-ray data are required.
References
- Allen et al. (2008) Allen, S. W., Rapetti, D. A., Schmidt, R. W., et al. 2008, MNRAS, 383, 879
- Allen et al. (2002) Allen, S. W., Schmidt, R. W., & Fabian, A. C. 2002, MNRAS, 335, 256
- Andrade-Santos et al. (2017) Andrade-Santos, F., Jones, C., Forman, W. R., et al. 2017, ApJ, 843, 76
- Arnaud (1996) Arnaud, K. A. 1996, in Astronomical Society of the Pacific Conference Series, Vol. 101, Astronomical Data Analysis Software and Systems V, ed. G. H. Jacoby & J. Barnes, 17
- Ascasibar & Markevitch (2006) Ascasibar, Y., & Markevitch, M. 2006, ApJ, 650, 102
- Berger & Colella (1989) Berger, M. J., & Colella, P. 1989, Journal of Computational Physics, 82, 64
- Berger & Oliger (1984) Berger, M. J., & Oliger, J. 1984, Journal of Computational Physics, 53, 484
- Biviano et al. (2013) Biviano, A., Rosati, P., Balestra, I., et al. 2013, A&A, 558, A1
- Blanton et al. (2011) Blanton, E. L., Randall, S. W., Clarke, T. E., et al. 2011, ApJ, 737, 99
- Calzadilla et al. (2019) Calzadilla, M. S., Russell, H. R., McDonald, M. A., et al. 2019, ApJ, 875, 65
- Canning et al. (2013) Canning, R. E. A., Sun, M., Sanders, J. S., et al. 2013, MNRAS, 435, 1108
- Chiu et al. (2018) Chiu, I. N., Umetsu, K., Sereno, M., et al. 2018, ApJ, 860, 126
- Cho et al. (2003) Cho, J., Lazarian, A., Honein, A., et al. 2003, ApJ, 589, L77
- Churazov et al. (2016) Churazov, E., Arevalo, P., Forman, W., et al. 2016, MNRAS, 463, 1057
- Churazov et al. (2003) Churazov, E., Forman, W., Jones, C., & Böhringer, H. 2003, ApJ, 590, 225
- Clarke et al. (2004) Clarke, T. E., Blanton, E. L., & Sarazin, C. L. 2004, ApJ, 616, 178
- Di Mascolo et al. (2019) Di Mascolo, L., Churazov, E., & Mroczkowski, T. 2019, MNRAS, 487, 4037
- Donahue et al. (2014) Donahue, M., Voit, G. M., Mahdavi, A., et al. 2014, ApJ, 794, 136
- Donahue et al. (2016) Donahue, M., Ettori, S., Rasia, E., et al. 2016, ApJ, 819, 36
- Eddington (1916) Eddington, A. S. 1916, MNRAS, 76, 572
- Ehlert et al. (2011) Ehlert, S., Allen, S. W., von der Linden, A., et al. 2011, MNRAS, 411, 1641
- Fabian (2012) Fabian, A. C. 2012, ARA&A, 50, 455
- Feretti et al. (2012) Feretti, L., Giovannini, G., Govoni, F., & Murgia, M. 2012, A&A Rev., 20, 54
- Fruscione et al. (2006) Fruscione, A., McDowell, J. C., Allen, G. E., et al. 2006, in Proc. SPIE, Vol. 6270, Society of Photo-Optical Instrumentation Engineers (SPIE) Conference Series, 62701V
- Fujita et al. (2019) Fujita, Y., Cen, R., & Zhuravleva, I. 2019, arXiv e-prints, arXiv:1912.01012
- Fujita et al. (2004) Fujita, Y., Matsumoto, T., & Wada, K. 2004, ApJ, 612, L9
- Fujita et al. (2018) Fujita, Y., Umetsu, K., Rasia, E., et al. 2018, ApJ, 857, 118
- Garmire et al. (2003) Garmire, G. P., Bautz, M. W., Ford, P. G., Nousek, J. A., & Ricker, Jr., G. R. 2003, in Society of Photo-Optical Instrumentation Engineers (SPIE) Conference Series, Vol. 4851, Society of Photo-Optical Instrumentation Engineers (SPIE) Conference Series, ed. J. E. Truemper & H. D. Tananbaum, 28–44
- Ghizzardi et al. (2014) Ghizzardi, S., De Grandi, S., & Molendi, S. 2014, A&A, 570, A117
- Giacintucci et al. (2017) Giacintucci, S., Markevitch, M., Cassano, R., et al. 2017, ApJ, 841, 71
- Giacintucci et al. (2014) Giacintucci, S., Markevitch, M., Venturi, T., et al. 2014, ApJ, 781, 9
- Giles et al. (2017) Giles, P. A., Maughan, B. J., Dahle, H., et al. 2017, MNRAS, 465, 858
- Gitti et al. (2007) Gitti, M., Ferrari, C., Domainko, W., Feretti, L., & Schindler, S. 2007, A&A, 470, L25
- Hitomi Collaboration et al. (2016) Hitomi Collaboration, Aharonian, F., Akamatsu, H., et al. 2016, Nature, 535, 117
- Hitomi Collaboration et al. (2018) —. 2018, PASJ, 70, 9
- Hlavacek-Larrondo et al. (2013a) Hlavacek-Larrondo, J., Fabian, A. C., Edge, A. C., et al. 2013a, MNRAS, 431, 1638
- Hlavacek-Larrondo et al. (2012) —. 2012, MNRAS, 421, 1360
- Hlavacek-Larrondo et al. (2013b) Hlavacek-Larrondo, J., Allen, S. W., Taylor, G. B., et al. 2013b, ApJ, 777, 163
- Hlavacek-Larrondo et al. (2015) Hlavacek-Larrondo, J., McDonald, M., Benson, B. A., et al. 2015, ApJ, 805, 35
- Ichinohe et al. (2019) Ichinohe, Y., Simionescu, A., Werner, N., Fabian, A. C., & Takahashi, T. 2019, MNRAS, 483, 1744
- Ichinohe et al. (2015) Ichinohe, Y., Werner, N., Simionescu, A., et al. 2015, MNRAS, 448, 2971
- Johnson et al. (2012) Johnson, R. E., Zuhone, J., Jones, C., Forman, W. R., & Markevitch, M. 2012, ApJ, 751, 95
- Kalberla et al. (2005) Kalberla, P. M. W., Burton, W. B., Hartmann, D., et al. 2005, A&A, 440, 775
- Kale et al. (2015) Kale, R., Venturi, T., Cassano, R., et al. 2015, A&A, 581, A23
- Kale et al. (2013) Kale, R., Venturi, T., Giacintucci, S., et al. 2013, A&A, 557, A99
- Khochfar & Ostriker (2008) Khochfar, S., & Ostriker, J. P. 2008, ApJ, 680, 54
- Kim & Narayan (2003) Kim, W.-T., & Narayan, R. 2003, ApJ, 596, L139
- Kitayama et al. (2004) Kitayama, T., Komatsu, E., Ota, N., et al. 2004, PASJ, 56, 17
- Kitayama et al. (2016) Kitayama, T., Ueda, S., Takakuwa, S., et al. 2016, PASJ, 68, 88
- Köhlinger & Schmidt (2014) Köhlinger, F., & Schmidt, R. W. 2014, MNRAS, 437, 1858
- Komatsu et al. (2001) Komatsu, E., Matsuo, H., Kitayama, T., et al. 2001, PASJ, 53, 57
- Kreisch et al. (2016) Kreisch, C. D., Machacek, M. E., Jones, C., & Randall, S. W. 2016, ApJ, 830, 39
- Liu et al. (2018) Liu, A., Yu, H., Diaferio, A., et al. 2018, ApJ, 863, 102
- Lodders & Palme (2009) Lodders, K., & Palme, H. 2009, Meteoritics and Planetary Science Supplement, 72, 5154
- Lyskova et al. (2019) Lyskova, N., Churazov, E., Zhang, C., et al. 2019, MNRAS, 485, 2922
- Markevitch & Vikhlinin (2007) Markevitch, M., & Vikhlinin, A. 2007, Phys. Rep., 443, 1
- Mazzotta & Giacintucci (2008) Mazzotta, P., & Giacintucci, S. 2008, ApJ, 675, L9
- McDonald et al. (2018) McDonald, M., Gaspari, M., McNamara, B. R., & Tremblay, G. R. 2018, ApJ, 858, 45
- McDonald et al. (2011) McDonald, M., Veilleux, S., Rupke, D. S. N., Mushotzky, R., & Reynolds, C. 2011, ApJ, 734, 95
- McNamara & Nulsen (2007) McNamara, B. R., & Nulsen, P. E. J. 2007, ARA&A, 45, 117
- McNamara & Nulsen (2012) —. 2012, New Journal of Physics, 14, 055023
- McNamara et al. (2005) McNamara, B. R., Nulsen, P. E. J., Wise, M. W., et al. 2005, Nature, 433, 45
- Meneghetti et al. (2014) Meneghetti, M., Rasia, E., Vega, J., et al. 2014, ApJ, 797, 34
- Merten et al. (2015) Merten, J., Meneghetti, M., Postman, M., et al. 2015, ApJ, 806, 4
- Molino et al. (2017) Molino, A., Benítez, N., Ascaso, B., et al. 2017, MNRAS, 470, 95
- Nandra et al. (2013) Nandra, K., Barret, D., Barcons, X., et al. 2013, arXiv e-prints, arXiv:1306.2307
- Navarro et al. (1997) Navarro, J. F., Frenk, C. S., & White, S. D. M. 1997, ApJ, 490, 493
- Newman et al. (2011) Newman, A. B., Treu, T., Ellis, R. S., & Sand , D. J. 2011, ApJ, 728, L39
- O’Dea et al. (2008) O’Dea, C. P., Baum, S. A., Privon, G., et al. 2008, ApJ, 681, 1035
- O’Sullivan et al. (2012) O’Sullivan, E., Giacintucci, S., Babul, A., et al. 2012, MNRAS, 424, 2971
- Owers et al. (2011) Owers, M. S., Nulsen, P. E. J., & Couch, W. J. 2011, ApJ, 741, 122
- Pandey-Pommier et al. (2016) Pandey-Pommier, M., Richard, J., Combes, F., et al. 2016, in SF2A-2016: Proceedings of the Annual meeting of the French Society of Astronomy and Astrophysics, 367–372
- Peterson & Fabian (2006) Peterson, J. R., & Fabian, A. C. 2006, Phys. Rep., 427, 1
- Peterson et al. (2001) Peterson, J. R., Paerels, F. B. S., Kaastra, J. S., et al. 2001, A&A, 365, L104
- Postman et al. (2012) Postman, M., Coe, D., Benítez, N., et al. 2012, ApJS, 199, 25
- Repp & Ebeling (2018) Repp, A., & Ebeling, H. 2018, MNRAS, 479, 844
- Ricker & Sarazin (2001) Ricker, P. M., & Sarazin, C. L. 2001, ApJ, 561, 621
- Roediger et al. (2011) Roediger, E., Brüggen, M., Simionescu, A., et al. 2011, MNRAS, 413, 2057
- Roediger et al. (2012) Roediger, E., Lovisari, L., Dupke, R., et al. 2012, MNRAS, 420, 3632
- Rossetti et al. (2013) Rossetti, M., Eckert, D., De Grandi, S., et al. 2013, A&A, 556, A44
- Sanders et al. (2014) Sanders, J. S., Fabian, A. C., Hlavacek-Larrondo, J., et al. 2014, MNRAS, 444, 1497
- Schive et al. (2018) Schive, H.-Y., ZuHone, J. A., Goldbaum, N. J., et al. 2018, MNRAS, 481, 4815
- Sereno et al. (2018) Sereno, M., Umetsu, K., Ettori, S., et al. 2018, ApJ, 860, L4
- Shin et al. (2016) Shin, J., Woo, J.-H., & Mulchaey, J. S. 2016, ApJS, 227, 31
- Smith et al. (2001) Smith, R. K., Brickhouse, N. S., Liedahl, D. A., & Raymond, J. C. 2001, ApJ, 556, L91
- Su et al. (2017) Su, Y., Nulsen, P. E. J., Kraft, R. P., et al. 2017, ApJ, 851, 69
- Tamura et al. (2001) Tamura, T., Kaastra, J. S., Peterson, J. R., et al. 2001, A&A, 365, L87
- The Lynx Team (2018) The Lynx Team. 2018, arXiv e-prints, arXiv:1809.09642
- Ueda et al. (2019) Ueda, S., Ichinohe, Y., Kitayama, T., & Umetsu, K. 2019, ApJ, 871, 207
- Ueda et al. (2017) Ueda, S., Kitayama, T., & Dotani, T. 2017, ApJ, 837, 34
- Ueda et al. (2018) Ueda, S., Kitayama, T., Oguri, M., et al. 2018, ApJ, 866, 48
- Umetsu & Diemer (2017) Umetsu, K., & Diemer, B. 2017, ApJ, 836, 231
- Umetsu et al. (2016) Umetsu, K., Zitrin, A., Gruen, D., et al. 2016, ApJ, 821, 116
- Umetsu et al. (2014) Umetsu, K., Medezinski, E., Nonino, M., et al. 2014, ApJ, 795, 163
- Umetsu et al. (2018) Umetsu, K., Sereno, M., Tam, S.-I., et al. 2018, ApJ, 860, 104
- van Weeren et al. (2019) van Weeren, R. J., de Gasperin, F., Akamatsu, H., et al. 2019, Space Sci. Rev., 215, 16
- Voigt & Fabian (2004) Voigt, L. M., & Fabian, A. C. 2004, MNRAS, 347, 1130
- Walker et al. (2017) Walker, S. A., Hlavacek-Larrondo, J., Gendron-Marsolais, M., et al. 2017, MNRAS, 468, 2506
- Yu et al. (2018) Yu, H., Tozzi, P., van Weeren, R., et al. 2018, ApJ, 853, 100
- Zhuravleva et al. (2018) Zhuravleva, I., Allen, S. W., Mantz, A., & Werner, N. 2018, ApJ, 865, 53
- Zitrin et al. (2015) Zitrin, A., Fabris, A., Merten, J., et al. 2015, ApJ, 801, 44
- ZuHone (2011) ZuHone, J. A. 2011, ApJ, 728, 54
- ZuHone et al. (2013a) ZuHone, J. A., Markevitch, M., Brunetti, G., & Giacintucci, S. 2013a, ApJ, 762, 78
- ZuHone et al. (2010) ZuHone, J. A., Markevitch, M., & Johnson, R. E. 2010, ApJ, 717, 908
- ZuHone et al. (2011) ZuHone, J. A., Markevitch, M., & Lee, D. 2011, ApJ, 743, 16
- ZuHone et al. (2013b) ZuHone, J. A., Markevitch, M., Ruszkowski, M., & Lee, D. 2013b, ApJ, 762, 69
- ZuHone & Roediger (2016) ZuHone, J. A., & Roediger, E. 2016, Journal of Plasma Physics, 82, 535820301