Measures of Scale Dependent Alfvénicity in the First PSP Solar Encounter
Abstract
The solar wind shows periods of highly Alfvénic activity, where velocity fluctuations and magnetic fluctuations are aligned or anti-aligned with each other. It is generally agreed that solar wind plasma velocity and magnetic field fluctuations observed by Parker Solar Probe (PSP) during the first encounter are mostly highly Alfvénic. However, quantitative measures of Alfvénicity are needed to understand how the characterization of these fluctuations compares with standard measures from prior missions in the inner and outer heliosphere, in fast wind and slow wind, and at high and low latitudes. To investigate this issue, we employ several measures to quantify the extent of Alfvénicity – the Alfvén ratio , normalized cross helicity , normalized residual energy , and the cosine of angle between velocity and magnetic fluctuations . We show that despite the overall impression that the Alfvénicity is large in the solar wind sampled by PSP during the first encounter, during some intervals the cross helicity starts decreasing at very large scales. These length-scales (often ) are well inside inertial range, and therefore, the suppression of cross helicity at these scales cannot be attributed to kinetic physics. This drop at large scales could potentially be explained by large-scale shears present in the inner heliosphere sampled by PSP. In some cases, despite the cross helicity being constant down to the noise floor, the residual energy decreases with scale in the inertial range. These results suggest that it is important to consider all these measures to quantify Alfvénicity.
1 Introduction
The low frequency, magnetofluid-scale turbulence observed in the solar wind is often described as “Alfvénic”, referring to the often-seen high degree of correlation between velocity and magnetic field fluctuations (Belcher & Davis, 1971). This significant Alfvénic correlation is often attributed more to high latitude wind (McComas et al., 2000) or to high speed low-latitude wind (Bruno et al., 2003), and generally more to distances closer to the Sun rather than farther. However, there are many exceptions, and high Alfvénicity intervals can sometimes be observed in slow low-latitude intervals, or at large heliocentric distances (Roberts et al., 1987b). Nevertheless the prevailing expectation for Parker Solar Probe (PSP), as it approached closer to the Sun than any previous spacecraft, was almost certainly that it would observe highly Alfvénic fluctuations. Indeed, most reports of the first two encounters (this volume) at least qualitatively describe the fluctuations, even the “jets” or “switchbacks,” as having an Alfvénic character (Bale & FIELDS, 2019). Here we will probe more deeply into the nature of the Alfvénic correlation in the first solar encounter of PSP (Fox et al., 2016), examining several independent measures of Alfvénicity, and resolving the associated correlations according to length scales. Recognizing that the first encounter may not be entirely typical (Kasper & SWEAP, 2019), we will argue that the departures from pure Alfvénicity recorded in the inner heliosphere by PSP may provide clues as to the dynamics at work in this turbulent plasma so close to the corona.
Alfvénicity is an important concept in plasma dynamics, but the precise meaning of this terminology is ambiguous without some clarification. In fact, it has been used to refer to different (although related) constructs by different authors. A first major issue is the existence of different quantitative measures of the “Alfvénic property” (Belcher & Davis, 1971). As commonly defined, these are the Alfvén ratio , the cross helicity , the residual energy , and the angle of alignment between velocity and magnetic field fluctuations . Each of these measures is associated with Alfvénicity and may further be defined locally, or by regional averages, or scale (filtered) averages, or a global/ensemble average. For purposes of definition we employ to denote an ensemble average.
The cross helicity , where are velocity and magnetic field fluctuations, is a rugged invariant of ideal incompressible magnetohydrodynamics (MHD). The physical significance of is revealed by comparing it with another ideal invariant, the incompressible fluctuation energy density per unit mass, . The dimensionless measure is the normalized cross helicity such that . Fluctuations with large are sometimes described as being Alfvénic. Note that for convenience, the magnetic fluctuation is usually measured in Alfvén speed units, i.e., with implied division by . An important property is that, by definition, Alfvén waves have and therefore such waves have by definition. One may also note that, in terms of the Elsässer variables , the normalized cross helicity may be written in the revealing form .
The “Alfvén ratio” is the ratio of flow kinetic energy to magnetic fluctuation energy, . Its physical significance is to measure the degree of energy equipartition of flow and magnetic fluctuations. A single Alfvén wave has , and a random phase mixture of small or large amplitude Alfvén waves will exhibit equipartition with . For this reason turbulence with energy equipartitioned in this sense is sometimes described as Alfvénic turbulence. Another related measure to quantify the relative energy in kinetic and magnetic fluctuations is the normalized residual energy . In the rest of the paper, for brevity, we will drop the “normalized” prefix from cross helicity and residual energy, with the understanding that these imply the normalized versions and .
Finally the alignment cosine of the angle between the fluctuations in and may be written as . The global alignment cosine is . Note that is not a ratio of ideal global invariants. Nevertheless it is a quantity often discussed in connection with Alfvénicity, and turbulence with large values of is sometimes referred to as Alfvénic turbulence.
The above measures of Alfvénicity are not independent. They are related by the well known identities, , and . Thus, for example, perfectly directionally-aligned fluctuations are necessarily of pure cross helicity only if they are in energy equipartition. A complete picture of Alfvénicity of an interval requires addressing as many of these measures together as possible.
Beyond these kinematic measures of Alfvénicity, there are at least three dynamical scenarios related to these physical properties: these are global dynamic alignment over time (Dobrowolny et al., 1980; Matthaeus & Montgomery, 1980), scale dependent dynamic alignment (Boldyrev, 2006; Mason et al., 2006; Boldyrev et al., 2009), and patchy alignment in real space (Milano et al., 2001; Matthaeus et al., 2008). All of these constructs have been studied in separate contexts over the last few decades. Each employs the measures , , , and , or equivalent measures, in various averages and measures, to characterize Alfvénic correlation and Alfvénic turbulence
Before turning to new results, it is important to establish the observational context. Alfvénic fluctuations have typically been seen as a prominent feature of MHD-scale fluctuations in the inner heliosphere, for example in Mariner (Belcher & Davis, 1971) and Helios (Bruno et al., 1985; Marsch & Tu, 1990) observations. Moving further outward, there is a general decrease in occurrence of very high cross helicity at low latitudes, although high Alfvénicity has been observed as far out as 9 au (Roberts et al., 1987a). However at the higher latitudes explored by Ulysses (Bavassano et al., 1998, 1999; Breech et al., 2008) the Alfvénicity persists to out to larger distances than typically seen at lower latitudes. A point of general consensus is that Alfvenicity decreases primarily due to shear (Roberts et al., 1987a, 1992; Zank et al., 1996) with persistent contributions also due to expansion (Zhou & Matthaeus, 1990; Oughton & Matthaeus, 1995). More recent studies have further examined effects of shear on Alfvenicity employing more complete theoretical formulations (Breech et al., 2008; Zank et al., 2012; Adhikari et al., 2015; Zank et al., 2017).
As far as spatial distribution is concerned, there have been a number of reports (Milano et al., 2001; Matthaeus et al., 2008) that cross helicity tends to be found in organized patches, an effect apparently related to local turbulent relaxation. This effect is also consistent with solar wind observations (Osman et al., 2011). A related concept is the scale dependence of cross helicity at MHD scales (Boldyrev, 2006). One interesting effect is related to the disparity of time scales in high cross helicity states: when the time scale for transfer of the “majority species” becomes large compared to the time scale for advection of the minority species . Consequently the initial transfer from a large scale Alfvénic spectrum to small scales tends to be dominated by the weaker Elsässer energy (Matthaeus et al., 1983). When present, this effect accelerates the overall amplification of dimensionless Alfvénicity , which is frequently, but not always seen in simulations of turbulent relaxation (Stribling & Matthaeus, 1991). The exceptional cases, when this dynamic alignment does not occur are often associated with turbulence in which a substantial amount of energy is found in velocity shears. The idea that shear destroys an initial spectrum of high cross helicity by injecting equal amounts of the two Elsässer energies has been investigated in both simulations and observations (Goldstein et al., 1989; Roberts et al., 1992). In these studies shear reduced cross helicity that initially was at the scale of the initial shear and over time the effect then spread across all scales. For quasi-steady cases, the alignment measured by has been conjectured to increase with decreasing scales, leading to a modification of the cascade theory (Boldyrev, 2006; Mason et al., 2006) on which alignment progressively increases with decreasing scale.
One may also ask what happens to the three measures of Alfvénicity in a kinetic plasma environment. This has been recently studied using MMS data and kinetic PIC simulation (Parashar et al., 2018). For sample intervals that are Alfvénic in the inertial range, MMS data show that starts at a non-zero value at inertial range scales and approaches zero at kinetic scales, indicating lack of alignment between and at kinetic scales. This result is confirmed by comparison of multi-spacecraft estimates and single-spacecraft estimates. Preliminary study of PSP data (Vech et al., 2019) has also examined cross helicity and related alignments at higher frequencies (smaller scales) approaching the kinetic range. Similar results to those of (Parashar et al., 2018) are found. These results show the diminishing importance of cross helicity and alignment at or near ion inertial scales, which is not entirely surprising since is not an ideal invariant for kinetic plasmas; in fact, even in Hall-MHD, one must consider a generalized helicity, and not the standard MHD cross helicity (Turner, 1986)
Prior studies provide ample evidence for a variety of different possible scenarios involving cross helicity, ranging from local amplification, scale dependent increase through the inertial range, and decrease due to shear, expansion and kinetic effects. Nevertheless, there appears to be a general tendency to assume that Alfvénic fluctuations at MHD scales are more prevalent and more purely outward in the inner heliosphere. For this reason, much of the early discussion of MHD fluctuations in the first PSP orbit has focused on relatively larger scale features that are Alfvénic. Here we examine this characterization in greater detail. In particular, in this study we are interested in behavior of , , and at relatively large inertial range scales in the inner heliosphere sampled by PSP. We show that in some cases, even when remains constant through the inertial range, , and change significantly in the inertial range. In some other intervals, decreases with scale in the inertial range () in the inner heliosphere. This decline at scales much larger than ion kinetic scales rules out an explanation in terms of the kinetic physics as explored in Parashar et al. (2018).
2 Data & Processing
PSP’s first perihelion occurred on 2018/11/06 with high time-cadence data collection occurring between 2018/10/31-2018/11/11. The initial and final days did not have full coverage of high time-cadence data, so we choose to perform the analysis on data obtained between 2018/11/01 and 2018/11/10. Level-two PSP/FIELDS and Level-three data from the PSP/SWEAP archives are used for the analysis. Specifically, data are from the FIELDS flux-gate magnetometer (MAG) (Bale et al., 2016) and Solar Probe Cup (SPC) (Kasper et al., 2016). The time cadence of SPC varied during the encounter between 1 NYHz and 4 NYHz, where 1 NYHz is the inverse of 1 NYs (=0.874 s). To create a uniform time series, we resampled all data (SPC and fields) to 1 NYHz cadence. Plasma data used are obtained by fitting Maxwellian distribution functions to SPC data. Some unphysical spikes in SPC data, which are remnants of bad fits, are removed using a modified Hampel filter in the time domain (Bandyopadhyay et al., 2018). The case studies presented in this analysis are from Nov 2 and Nov 4 in 2018, just before the first encounter.
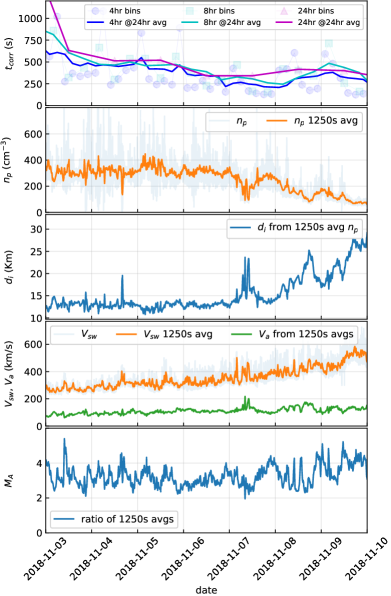
The resampled data are divided into subsets of various sizes (4 hr, 8 hr, and 24 hr) and the correlation time is computed for the magnetic field as the time when the autocorrelation function is reduced by . The correlation time is shown for each 4-, 8-, or 24-hr sub-interval as points in the top panel of Figure 1. The solid lines represent 24-hr running averages of these points. The correlation time typically depends on the averaging interval, and can be sensitive to larger scale fluctuations (Matthaeus & Goldstein, 1982; Isaacs et al., 2015; Jagarlamudi et al., 2019). The correlation times computed from intervals 4 hr or longer are all comparable to each other and fluctuate between 300s-600s. This number is consistent with the spectral break point between the range and the inertial range (Chen & Others, 2019).
The computation of Elsässer variables requires conversion of magnetic field fluctuations to Alfvénic velocity. This conversion is performed with some care. Large local variations of density do not imply a possibility of different point-wise Alfvén waves. An inertial range Alfvén wave and corresponding Alfvén speed should be defined over a reasonably large scale, one over which an MHD Alfvén wave can exist and propagate. Hence, we use density averaged over a few correlation times to convert magnetic field fluctuations into Alfvénic speeds. Here implies that a rolling average of 1250 s covers scales between 2 to 4 over the encounter. The second panel of Figure 1 shows instantaneous density in light gray and the 1250s rolling average. This rolling average is used to define the Alfvén speed and the proton inertial scale , and for conversion of magnetic fluctuations to velocity units.
A comparison of the solar wind speed to Alfvén speed computed this way gives an Alfvénic Mach number , marginally allowing us to use Taylor’s hypothesis. A detailed study of Taylor’s hypothesis for this encounter will be reported elsewhere.
3 Results
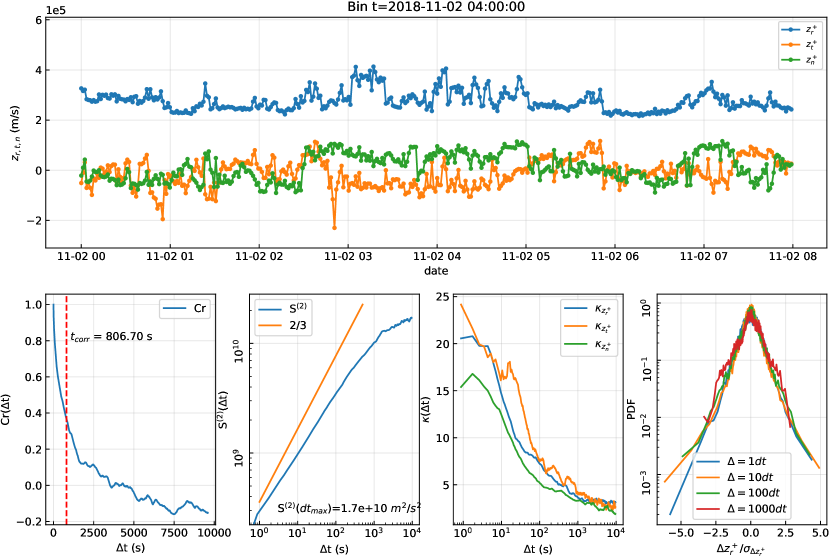
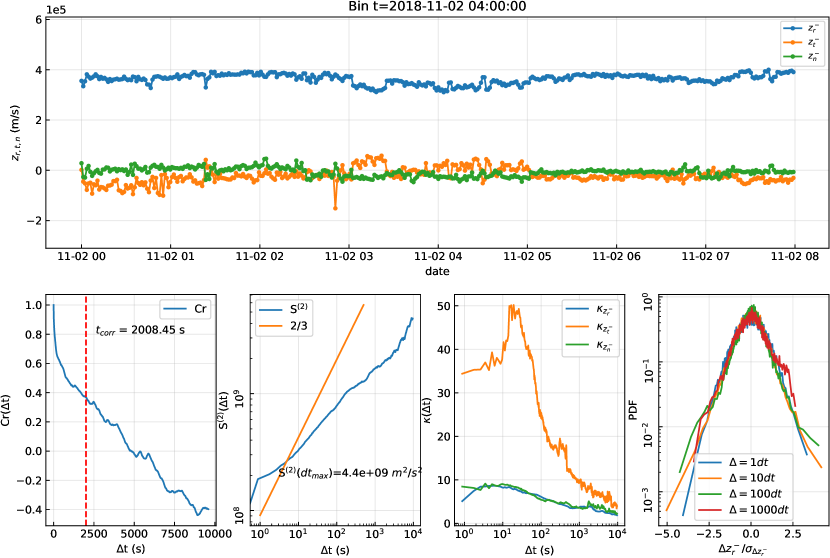
Using the reprocessed data we compute Elsässer variables and the relevant quantifiers of Alfvénicity – cross helicity , residual energy , Alfvén ratio , and the alignment cosine . Figures 2 and 3 show an overview of and fluctuations, respectively, for an 8-hr period centered at 2018/11/02-04:00:00. In each figure, the top panel shows the overview time series, and the four panels below it show the autocorrelation function , second-order structure function , scale-dependent kurtosis for individual components in the RTN coordinate system , and probability density functions (PDFs) of increments for four different increments of 1, 10, 100, and 1000 , where an increment is defined as , the time cadence is , and denotes averaging over .
In these Figures, shows strong turbulent fluctuations, with a well-developed power spectrum as indicated by the second-order structure function. Kolmogorov slope of , typically observed in (magneto)hydrodynamic turbulence (Biskamp, 2003), is shown for reference. In this particular interval the slope is slightly different from the Kolmogorov value but in a significant number of intervals analyzed (not shown) the slope was close to . The correlation time for is s, consistent with a roll over of the second order structure function at a few . The scale dependent kurtosis for keeps increasing down to very small scales, while for the peak of kurtosis occurs between 10-100s. The decrease in kurtosis for is likely because the signal is weaker for and hence the noise becomes significant at larger scales. The PDFs of increments show non-Gaussian features deep into the inertial range. The weaker Elsässer field , on the other hand, shows suppressed turbulent fluctuations, a smaller correlation time, and about an order of magnitude smaller energy compared to fluctuations. This behavior is consistent with outward-propagating Alfvénic fluctuations. We now discuss the individual measures of alignment both in time and as a function of scale.
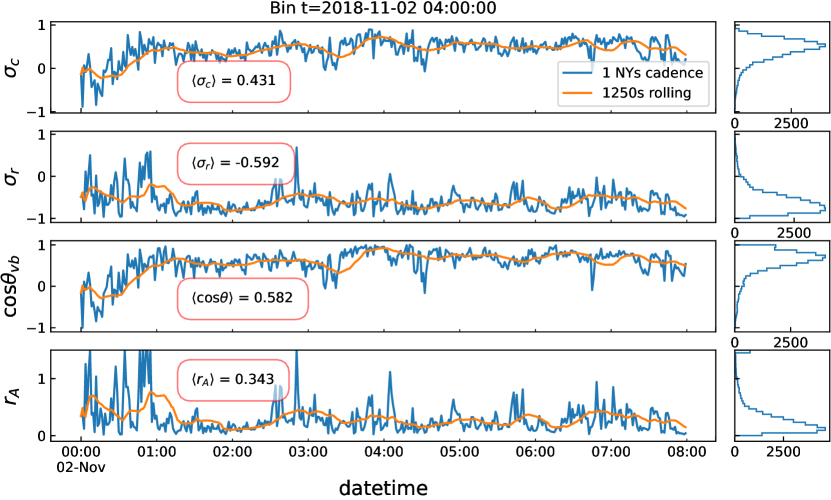
Figure 4 shows various measures of Alfvénicity for an 8-hr interval during the encounter. Blue lines show the actual time series, orange lines show a 1250-s running average of the quantities. Histograms on the right show the frequency of occurrence of certain values. The average values of these quantities (, , , and ) indicate a moderate or incomplete degree of alignment. Although most of the population has a fairly high , and , locally the cross helicity shows large deviations from the mean value at time scales of the order of a few minutes. This is consistent with locally patchy behavior of cross helicity as reported by Matthaeus et al. (2008) and Osman et al. (2011) where it was shown that the cross helicity can show large systematic departures from the global average in localized patches.
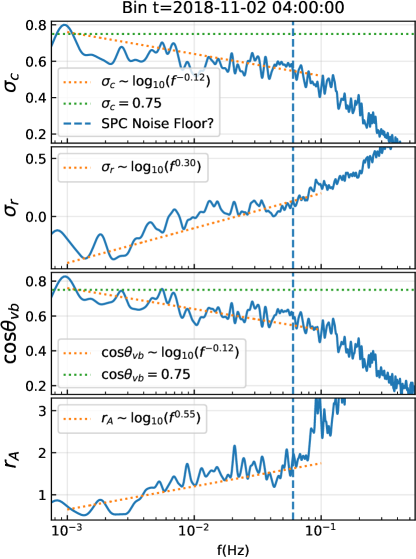
To get a more complete picture of Alfvénicity, we perform a scale decomposition of these alignment measures. Figure 5 shows the Fourier spectra of , , , and as a function of frequency. The vertical dashed line marks the frequency where noise becomes important, identified by flattening of velocity spectra (not shown). All measures of Alfvénicity show departures from large scale values in the inertial range. The decline is approximately logarithmic, as suggested by the orange dashed line in the top panel for . Similar logarithmic changes are seen for , , and . The apparent discrepancy in the scales where crosses zero and crosses one is purely an artifact of smoothing a noisy signal. Equivalent spectra (Chasapis et al., 2017; Chhiber et al., 2018b), not shown here, have less noise and show this transition at the same scale corresponding to .
In MHD, without shears, it is expected that and align increasingly as small scales are approached (Boldyrev, 2006; Mason et al., 2006; Podesta et al., 2008, 2009; Podesta & Bhattacharjee, 2010). The alignment breaks down when kinetic scales are approached (Parashar et al., 2018; Verdini et al., 2018). Cross helicity changing in the inertial range can be seen in some old Helios observations (Tu et al., 1990; Bruno et al., 1996). Goldstein et al. (1989); Roberts et al. (1992) showed that the presence of shears destroys cross helicity at the scales where shear is important. This destruction of measures of Alfvénicity deep in the inertial range could potentially be due to large scale or inertial range shear driving that is expected to be important close to the sun.
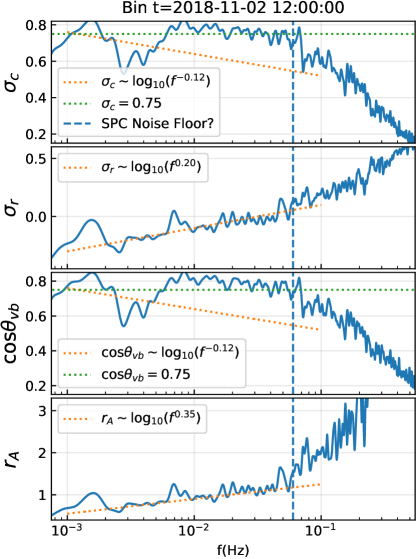
Even in cases where is fairly constant in the inertial range, other measures could show departures from expected behavior. In Figure 6 we show another example of spectra for these measures, in an 8 hour bin centered at 2018-11-02-12:00:00. remains fairly constant in the inertial range down to the noise floor in this particular case, as does . However, the residual energy and Alfvén ratio show a monotonic reduction in magnetic dominance, as evidenced by the overplotted logarithmic trends. Although in the interval centered at 2018-11-02 12:00:00 flow energy does not dominate for the intervals analyzed, the interval centered at 2018-11-02 4:00:00 transitions into flow energy dominated regime as clearly evidenced by . Hence this interval, although fairly Alfvénic at large scales, shows departures from Alfvénicity in the sense of energy partition between kinetic and magnetic energies.
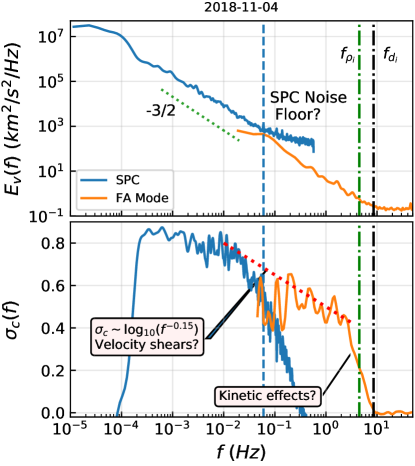
Finally, to ensure that the drop in the inertial range is not affected by noise, we extend the spectral coverage for one of the days by using the data from the flux angle (FA) mode. In this mode, the Faraday cups gather data in a single energy/charge window with 293 Hz cadence. For details of the mode and data processing see Vech et al. (2019). The FA mode data are for interval 1 studied in detail in that paper. In Figure 7 we show the power spectrum for velocity in the top panel and cross helicity spectra in the bottom panel for the full day of 2018-11-04. The two modes combined cover a spectral range of almost five decades, with FA mode catching up nicely when the noise from SPC becomes significant. The cross helicity at large scales is fairly constant but shows a decline starting about a decade before noise scales are reached. However, the cross helicity computed from the FA mode data nicely continues the logarithmic decay trend for more than a decade below the noise scale for SPC. Combined, the data from these two separate modes of the instrument show a consistent logarithmic decline in cross helicity in most of the inertial range spanned by the two modes. Just before kinetic scales are approached, the cross helicity shows a steep decrease, consistent with what has been observed at 1 au (e.g. Parashar et al., 2018). This is indicative of distinct mechanisms responsible for each phase of the decline of – the logarithmic decline in the inertial range, and the steep decline of close to kinetic scales. The former could potentially be because of velocity shears and the latter potentially due to kinetic effects.
4 Discussion
Parker Solar Probe (PSP) provides a unique opportunity to study the evolution of heliospheric plasmas close to their place of origin near the Sun. The first perihelion of PSP provides us with a preview into what exciting science lies ahead. Here we have used data from the first solar encounter of PSP to study the issue of Alfvénicity. The term Alfvénic fluctuations carries a wide variety of meanings. In this paper we have studied various possible measures such as cross helicity , residual energy , alignment cosine , and Alfvén ratio to quantify the Alfvénicity of solar wind near the sun. The fluctuations are Alfvénic but not Alfvén wave-like.
Scale decomposition of these quantities is revealing. In some intervals is fairly constant at large scales, indicating the highly Alfvénic nature of the interval. However, the scale variations of and show monotonic reduction in magnetic dominance at large scales, transitioning to flow energy dominated behavior at small scales in one of the intervals. This indicates a departure from Alfvénicity in the energetic sense. In some intervals, even the cross helicity and alignment angles decrease logarithmically deep in the inertial range, unlike what has been observed in the magnetosheath and solar wind at 1 au (Chen et al., 2013; Wicks et al., 2013; Parashar et al., 2018) for intervals classically designated as “Alfvénic” (Belcher & Davis, 1971). The individual case studies presented here provide motivation for a statistical analysis of Alfvenicity using multiple measures.
These case studies suggest that in such intervals a mechanism other than kinetic physics is acting to reduce the cross-helicity progressively at smaller scales, but still well-removed from kinetic plasma scales. One possibility is the presence of velocity shear driving at large scales that is expected to be significant in the inner heliosphere, and may be present in the outer sub-Alfvénic corona. This shear driving could possibly cause a nonlinear Kelvin-Helmholtz-like roll-up at large scales, reducing Alfvénicity, and driving a phenomenon that has been described as “flocculation” in imaging observations (DeForest et al., 2016; Chhiber et al., 2018a). This possible relation to flocculation will be examined in a separate study.
References
- Adhikari et al. (2015) Adhikari, L., Zank, G. P., Bruno, R., et al. 2015, The Astrophysical Journal, 805, 63, doi: 10.1088/0004-637x/805/1/63
- Bale & FIELDS (2019) Bale, S. D., & FIELDS. 2019, submitted to ApJ
- Bale et al. (2016) Bale, S. D., Goetz, K., Harvey, P. R., et al. 2016, Space Science Reviews, 204, 49, doi: 10.1007/s11214-016-0244-5
- Bandyopadhyay et al. (2018) Bandyopadhyay, R., Chasapis, A., Chhiber, R., et al. 2018, ApJ, 866, 81, doi: 10.3847/1538-4357/aade93
- Bavassano et al. (1998) Bavassano, B., Pietropaolo, E., & Bruno, R. 1998, Journal of Geophysical Research: Space Physics, 103, 6521
- Bavassano et al. (1999) Bavassano, B., Pietropaolo, E., & Bruno, R. 1999, in AIP Conference Proceedings, Vol. 471, AIP, 503–506
- Belcher & Davis (1971) Belcher, J., & Davis, Jr., L. 1971, Journal of Geophysical Research, 76, 3534
- Biskamp (2003) Biskamp, D. 2003, Magnetohydrodynamic turbulence (Cambridge University Press)
- Boldyrev (2006) Boldyrev, S. 2006, Physical review letters, 96, 115002
- Boldyrev et al. (2009) Boldyrev, S., Mason, J., & Cattaneo, F. 2009, The Astrophysical Journal Letters, 699, L39
- Breech et al. (2008) Breech, B., Matthaeus, W. H., Minnie, J., et al. 2008, Journal of Geophysical Research: Space Physics, 113
- Bruno et al. (1996) Bruno, R., Bavassano, B., & Pietropaolo, E. 1996in , AIP, 229–232
- Bruno et al. (1985) Bruno, R., Bavassano, B., & Villante, U. 1985, Journal of Geophysical Research, 90, 4373
- Bruno et al. (2003) Bruno, R., Carbone, V., Sorriso-Valvo, L., & Bavassano, B. 2003, Journal of Geophysical Research, 108, 1130, doi:10.1029/2002JA009615, doi: 10.1029/2002JA009615
- Chasapis et al. (2017) Chasapis, A., Matthaeus, W. H., Parashar, T. N., et al. 2017, The Astrophysical Journal Letters, 844, L9
- Chen et al. (2013) Chen, C. H. K., Bale, S. D., Salem, C. S., & Maruca, B. A. 2013, The Astrophysical Journal, 770, 125
- Chen & Others (2019) Chen, C. H. K., & Others. 2019, aubmitted to ApJ
- Chhiber et al. (2018a) Chhiber, R., Usmanov, A. V., DeForest, C. E., et al. 2018a, The Astrophysical Journal Letters, 856, L39
- Chhiber et al. (2018b) Chhiber, R., Chasapis, A., Bandyopadhyay, R., et al. 2018b, Journal of Geophysical Research: Space Physics, 0, doi: 10.1029/2018JA025768
- DeForest et al. (2016) DeForest, C., Matthaeus, W., Viall, N., & Cranmer, S. 2016, The Astrophysical Journal, 828, 66
- Dobrowolny et al. (1980) Dobrowolny, M., Mangeney, A., & Veltri, P. 1980, Astronomy & Astrophysics, 83, 26
- Fox et al. (2016) Fox, N., Velli, M., Bale, S., et al. 2016, Space Science Reviews, 204, 7
- Goldstein et al. (1989) Goldstein, M. L., Roberts, D. A., & Matthaeus, W. H. 1989, Solar System Plasma Physics, 54, 113
- Isaacs et al. (2015) Isaacs, J., Tessein, J., & Matthaeus, W. 2015, Journal of Geophysical Research: Space Physics, 120, 868
- Jagarlamudi et al. (2019) Jagarlamudi, V. K., de Wit, T. D., Krasnoselskikh, V., & Maksimovic, M. 2019, The Astrophysical Journal, 871, 68
- Kasper & SWEAP (2019) Kasper, J. C., & SWEAP. 2019, submitted to ApJ
- Kasper et al. (2016) Kasper, J. C., Abiad, R., Austin, G., et al. 2016, Space Science Reviews, 204, 131, doi: 10.1007/s11214-015-0206-3
- Marsch (1991) Marsch, E. 1991, in Physics of the inner heliosphere II (Springer), 159–241
- Marsch & Tu (1990) Marsch, E., & Tu, C.-Y. 1990, Journal of Geophysical Research: Space Physics, 95, 8211
- Mason et al. (2006) Mason, J., Cattaneo, F., & Boldyrev, S. 2006, Phys. Rev. Lett., 97, 255002, doi: 10.1103/PhysRevLett.97.255002
- Matthaeus et al. (2008) Matthaeus, W., Pouquet, A., Mininni, P. D., Dmitruk, P., & Breech, B. 2008, Physical review letters, 100, 085003
- Matthaeus & Goldstein (1982) Matthaeus, W. H., & Goldstein, M. L. 1982, Journal of Geophysical Research: Space Physics, 87, 10347
- Matthaeus et al. (1983) Matthaeus, W. H., Goldstein, M. L., & Montgomery, D. C. 1983, Phys. Rev. Lett., 51, 1484, doi: 10.1103/PhysRevLett.51.1484
- Matthaeus & Montgomery (1980) Matthaeus, W. H., & Montgomery, D. 1980, Annals of the New York Academy of Sciences, 357, 203
- McComas et al. (2000) McComas, D., Barraclough, B., Funsten, H., et al. 2000, Journal of Geophysical Research: Space Physics, 105, 10419
- Milano et al. (2001) Milano, L., Matthaeus, W., Dmitruk, P., & Montgomery, D. 2001, Physics of Plasmas, 8, 2673
- Osman et al. (2011) Osman, K. T., Wan, M., Matthaeus, W. H., Breech, B., & Oughton, S. 2011, The Astrophysical Journal, 741, 75
- Oughton & Matthaeus (1995) Oughton, S., & Matthaeus, W. H. 1995, Journal of Geophysical Research: Space Physics, 100, 14783
- Parashar et al. (2018) Parashar, T. N., Chasapis, A., Bandyopadhyay, R., et al. 2018, Phys. Rev. Lett., 121, 265101, doi: 10.1103/PhysRevLett.121.265101
- Podesta & Bhattacharjee (2010) Podesta, J., & Bhattacharjee, A. 2010, The Astrophysical Journal, 718, 1151
- Podesta et al. (2008) Podesta, J., Bhattacharjee, A., Chandran, B., Goldstein, M., & Roberts, D. 2008, in AIP Conference Proceedings, Vol. 1039, AIP, 81–86
- Podesta et al. (2009) Podesta, J., Chandran, B. D., Bhattacharjee, A., Roberts, D., & Goldstein, M. 2009, Journal of Geophysical Research: Space Physics, 114
- Roberts et al. (1987a) Roberts, D., Goldstein, M., Klein, L., & Matthaeus, W. 1987a, Journal of Geophysical Research: Space Physics, 92, 12023
- Roberts et al. (1987b) Roberts, D. A., Goldstein, M. L., Klein, L. W., & Matthaeus, W. H. 1987b, Journal of Geophysical Research, 92, 12023
- Roberts et al. (1992) Roberts, D. A., Goldstein, M. L., Matthaeus, W. H., & Ghosh, S. 1992, Journal of Geophysical Research: Space Physics, 97, 17115
- Stansby et al. (2018) Stansby, D., Horbury, T., & Matteini, L. 2018, Monthly Notices of the Royal Astronomical Society, 482, 1706
- Stribling & Matthaeus (1991) Stribling, T., & Matthaeus, W. H. 1991, Physics of Fluids B, 3, 1848, doi: 10.1063/1.859654
- Tu et al. (1990) Tu, C.-Y., Marsch, E., & Rosenbauer, H. 1990, Geophysical research letters, 17, 283
- Turner (1986) Turner, L. 1986, IEEE transactions on plasma science, 14, 849
- Vech et al. (2019) Vech, D., SWEAP, & FIELDS. 2019, submitted to ApJ
- Verdini et al. (2018) Verdini, A., Grappin, R., Alexandrova, O., & Lion, S. 2018, The Astrophysical Journal, 853, 85
- Wicks et al. (2013) Wicks, R. T., Mallet, A., Horbury, T. S., et al. 2013, Physical review letters, 110, 025003
- Zank et al. (2012) Zank, G., Jetha, N., Hu, Q., & Hunana, P. 2012, The Astrophysical Journal, 756, 21
- Zank et al. (1996) Zank, G., Matthaeus, W., & Smith, C. 1996, Journal of Geophysical Research: Space Physics, 101, 17093
- Zank et al. (2017) Zank, G. P., Adhikari, L., Hunana, P., et al. 2017, The Astrophysical Journal, 835, 147, doi: 10.3847/1538-4357/835/2/147
- Zhou & Matthaeus (1990) Zhou, Y., & Matthaeus, W. H. 1990, Journal of Geophysical Research: Space Physics, 95, 10291