Small RNA driven feed-forward loop: Fine-tuning of protein synthesis through sRNA mediated cross-talk

Swathi Tej1 and Sutapa Mukherji2 $^1$ swathi.rf0897@cftri.res.in
$^2$ sutapa@cftri.res.in
Protein Chemistry and Technology, Central Food Technological Research Institute, Mysore 570 020, Karnataka, India
Abstract

Often in bacterial regulatory networks, small non-coding RNAs (sRNA) interact with several mRNA species. The competition among mRNAs for binding to the common pool of sRNA might lead to an effective interaction (cross-talk) between the mRNAs. This is similar to the competing endogenous RNA (ceRNA) effect wherein the competition to bind to the same pool of micro-RNA in Eukaryotes leads to micro-RNA mediated cross-talk resulting in subtle and complex gene regulation with stabilised gene expression. Here, we study an sRNA-driven feed-forward loop (sFFL) where the top-tier regulator, an sRNA, binds with two species of mRNA for their translational up-regulation. In general, in a feed-forward loop, the top-tier regulator regulates the target protein synthesis through two path ways; while one involves a direct regulation of the target protein, the other involves an indirect regulation via up- or down-regulation of an intermediate regulator of the target protein. In the present sFFL, an sRNA (RprA) translationally activates the target protein (RicI) directly and also, indirectly, via up-regulation of its transcriptional activator (ΟƒssuperscriptπœŽπ‘ \sigma^{s}). We show that the sRNA-mediated cross-talk between the two mRNA species leads to maximum target protein synthesis for low synthesis rates of ΟƒssuperscriptπœŽπ‘ \sigma^{s}-mRNA. This indicates the possibility of an optimal target protein synthesis with an efficient utilisation of ΟƒssuperscriptπœŽπ‘ \sigma^{s}-mRNA which is typically associated with various other stress response activities inside the cell. Since gene expression is inherently stochastic due to the probabilistic nature of various molecular interactions associated with it, we next quantify the fluctuations in the target protein level using generating function based approach and stochastic simulations. The coefficient of variation that provides a measure of fluctuations in the concentration shows a minimum under conditions that also correspond to optimal target protein synthesis. This prompts us to conclude that, in sFFL, the cross-talk leads to optimal target protein synthesis with minimal noise and an efficient utilisation of ΟƒssuperscriptπœŽπ‘ \sigma^{s}-mRNA.

I Introduction

The gene expression is a complex process involving, for example, a number of genes, proteins and regulatory RNAs of different kinds. Different types of molecular mechanism at transcriptional and post-transcriptional levels regulate the gene expression process to ensure that the proteins are synthesized to the desired level with the required efficiency. Among various regulatory molecules, small noncoding RNAs (sRNAs) have drawn significant attention in the recent past for their diverse regulatory properties storz ; gottesman2 . sRNAs are approximately 50βˆ’3005030050-300 nucleotides long and they often regulate the protein synthesis by base-pairing with the target mRNAs leading to mRNA degradation or translational inhibition gottesman2 ; papenfort3 . Although sRNA mediated interactions are found to be mostly repressing in nature, there are recent reports of activating interactions by sRNAs where sRNAs enhance the stability of mRNAs by sequestering the RNase E recognition site or facilitate translation initiation by opening the sequestered ribosome binding site of the secondary structure mRNAs gottesman1 ; papenfort3 . Since sRNAs do not code for proteins, it is generally believed that sRNAs lead to fast and energy-efficient gene regulation.

A number of interesting properties are found in the case of sRNA mediated gene regulation. For instance, in the case of only sRNA mediated regulation, the target protein concentration shows a threshold linear response hwa . In the case of combined transcriptional and translational regulation by proteins and sRNAs, respectively, one, however, finds both monostable (with threshold linear response) and bistable regions in the target protein concentration bose . In addition, sRNAs (or micro-RNAs (miRNA) in case of Eukaryotes) also have the ability to filter gene expression noise; a property that might be particularly beneficial for reliable functioning of the cell. The gene expression is inherently stochastic due to the probabilistic nature of various molecular interactions associated with gene expression raj ; madanbabu . The stochasticity leads to random fluctuations in the protein levels although it is known that many biological functions of the cell require fine-tuning of necessary protein levels. In this regard, it has been found that sRNA mediated repression of gene expression leads to reduced fluctuations in the protein level as compared to transcription factor mediated repression hwa . Further, optimal noise buffering has also been seen in more complex genetic circuits such as incoherent sRNA mediated feed-forward loops (FFL) shimoni ; osella , sRNA-driven feed-forward loop swathi etc., where dual strategies i.e. regulation at both transcriptional and translational levels are employed.

Recent studies have revealed a particularly subtle and complex strategy of miRNA mediated gene regulation wherein a given species of miRNA interacts with a number of different mRNA targets bosia1 ; bossi ; marinari ; martinoplos ; marinari1 . The primary goal of such miRNA-mRNA network is to give rise to regulation through competition in which different mRNA targets compete for binding to the same miRNA species (also known as competing endogenous RNA or ceRNA effect). In other words, the miRNAs may function as a channel through which the change in concentration level in one type of target mRNA can be conveyed to another. It has been shown that such indirect miRNA mediated cross-talk may outperform direct regulation under certain circumstances martinoplos . Additionally, it has been found that such miRNA mediated cross-talk between mRNAs results in a broad impact on the protein level such as enhancing the stability of highly expressed proteins, altering the correlation patterns of coregulated interacting proteins apart from, in general, fine-tuning the protein levels marinari1 .

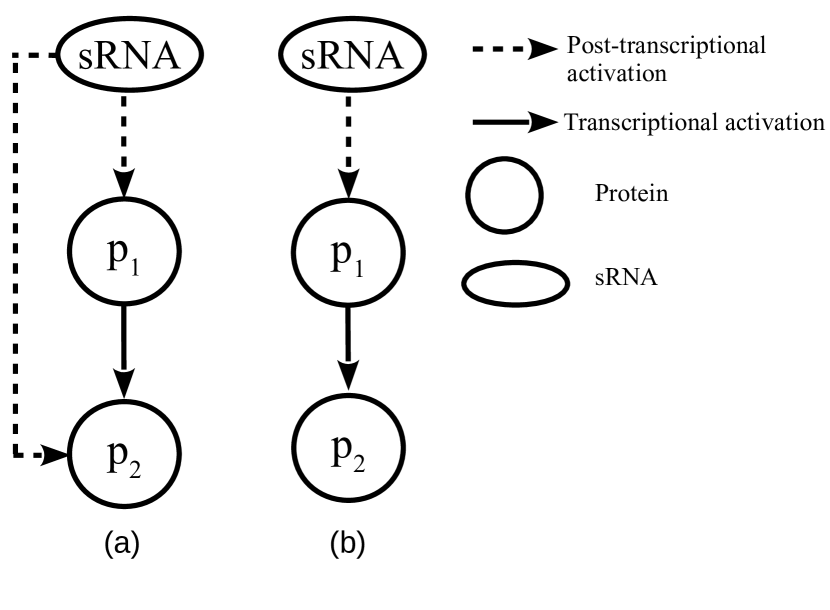
In the present paper, our attention is on a network motif where the sRNA mediated cross-talk between mRNAs seems to play an important role in regulating the target protein synthesis. Network motifs are specific sub-networks that have frequent recurrences in large regulatory networks as some of their major building blocks alon . Such motifs usually have distinct functionalities and it is believed that such motifs are chosen evolutionarily due to distinct advantages they provide to the cell. The network motif of our interest is a feed-forward loop (FFL) which is driven by an sRNA (see figure 1(a)) unlike the commonly found FFLs driven by transcription factors papenfort2 .

[Uncaptioned image] Figure 1: (a) An sRNA-driven coherent feed-forward loop (sFFL) found in the Salmonella enterica. The top-tier regulator is an sRNA, RprA, which leads to translational up-regulation of two proteins i.e., ΟƒssuperscriptπœŽπ‘ \sigma^{s} and RicI. (b) A diagram with the details of all the processes such as synthesis, degradation of all the components as well as the complex formation between sRNA and mRNAs. c1subscript𝑐1c_{1} and c2subscript𝑐2c_{2} denote the complexes RprA-ΟƒssuperscriptπœŽπ‘ \sigma^{s} mRNA and RprA-RicI mRNA, respectively.

We refer to this sRNA-driven FFL as sFFL in the following. In general, the top-tier regulator in FFL drives the target protein synthesis along two pathways; one pathway involves a direct regulation of the target protein synthesis and the other involves an indirect regulation via up- or down-regulation of an intermediate regulator of the target protein. For a purely transcriptional FFL, all the interactions are at the transcription level and the top-tier as well as the intermediate regulators are transcription factors. The sFFL introduced here is different from another kind of transcription factor driven FFLs which involve sRNA as an intermediate regulator of the target protein osella ; caselle ; caselle2 . The feature that remains common in all these FFLs is that the top-tier regulator regulates expression of two distinct genes. In the case of sFFL, an sRNA being the top-tier regulator, regulates the translational activities of two different mRNAs along two regulatory pathways of FFL and thus gives rise to distinct regulatory features through sRNA induced cross-talk between mRNAs.

The existence of such sFFL has been found experimentally very recently in the context of stress response of Salmonella enterica subjected to stress due to a bactericidal agent, bile salt papenfort2 . In this sFFL, an sRNA, RprA, activates the synthesis of the target protein, RicI, directly through translational activation of RicI mRNA and indirectly via translational activation in the synthesis of the alternative sigma-factor, ΟƒssuperscriptπœŽπ‘ \sigma^{s}, which transcriptionally activates RicI gene (see figure 1(a) and 1(b)). By base-pairing with the ΟƒssuperscriptπœŽπ‘ \sigma^{s} mRNA, RprA opens up the translation inhibitory loop in the 5β€² untranslated region (UTR) of ΟƒssuperscriptπœŽπ‘ \sigma^{s}-mRNA and facilitates ribosome binding to initiate translation leading to the synthesis of ΟƒssuperscriptπœŽπ‘ \sigma^{s} protein gottesman3 . ΟƒssuperscriptπœŽπ‘ \sigma^{s} protein being a transcriptional activator of RicI gene leads to an enhanced synthesis of RicI-mRNA which are, then, translationally activated by sRNA, RprA, resulting in an up-regulation in RicI protein synthesis. Here again, RprA facilitates ribosome binding by opening up the translation inhibitory loop of RicI-mRNA. Such an FFL with activating regulation along both the paths is known as coherent FFL while an FFL involving opposing kind of regulation along the two paths is known as incoherent FFL. An up-regulation of RicI protein happens in response to the membrane damaging activity of the bile salt. As a response to the stress, the bacterial cell prefers to shut down the energy-expensive processes associated with horizontal gene transfer although horizontal gene transfer plays a significant role in bacteria’s survival under normal conditions. By interfering with the formation of the pilus that is necessary for bacterial conjugation during horizontal gene transfer, RicI protein down-regulates the process of horizontal gene transfer and protects the bacteria from additional energy loss associated with this process papenfort2 . For the rest of the paper, we follow general notations for various regulatory molecules as listed in table 1.

Table 1: Mathematical notations for concentrations of various components of sFFL
Notations Biological sFFL
s𝑠sΒ Β Β (sRNA) RprA sRNA
m1subscriptπ‘š1m_{1} (mRNA1mRNA1{\rm mRNA1}) ΟƒssuperscriptπœŽπ‘ \sigma^{s}-mRNA
c1subscript𝑐1c_{1}Β Β (complex​-​1complex-1{\rm complex}\mbox{-}{\rm 1}) RprA​-​σsRprA-superscriptπœŽπ‘ {\rm RprA}\mbox{-}\sigma^{s}-mRNA complex
p1subscript𝑝1p_{1}Β Β (protein​-​1protein-1{\rm protein}\mbox{-}{\rm 1} ) ΟƒssuperscriptπœŽπ‘ \sigma^{s} protein
m2subscriptπ‘š2m_{2}Β (mRNA2mRNA2{\rm mRNA2} ) RicI-mRNA
c2subscript𝑐2c_{2}Β Β (complex​-​2complex-2{\rm complex}\mbox{-}{\rm 2}) RprA​-​RicIRprA-RicI{\rm RprA}\mbox{-}{\rm RicI}-mRNA complex
p2subscript𝑝2p_{2}Β Β (protein​-​2protein-2{\rm protein}\mbox{-}{\rm 2}) RicI protein

The miRNA mediated cross-talk between different mRNAs is a subject of extensive investigations currently. Some of the earlier studies were based on simplified models involving different species of mRNA molecules that were co-repressed by a single miRNA species marinari . The effect of miRNA mediated cross-talk on the protein products of these mRNA targets and on the protein-protein interaction were also studied later starting with this basic framework marinari1 . In view of the earlier studies, sFFL considered here is somewhat special for the following reasons. Instead of sRNA mediated repression, which is the most common form of regulation by sRNAs, here the sRNA leads to translational activation of two different mRNAs. Further, the FFL not only involves sRNA mediated interactions between the mRNAs, but it also involves a direct interaction between the mRNAs. The latter is due to the fact that an up-regulation of one species of mRNA (m1subscriptπ‘š1m_{1} i.e. ΟƒssuperscriptπœŽπ‘ \sigma^{s}-mRNA) gives rise to enhanced transcription of the other species of mRNA (m2subscriptπ‘š2m_{2} i.e. RicI-mRNA) via up-regulation of the protein product of m1subscriptπ‘š1m_{1} (i.e. ΟƒssuperscriptπœŽπ‘ \sigma^{s} protein) papenfort2 . Thus, the sFFL provides a unique platform to study how the combined effect of sRNA mediated cross-talk and a direct interaction between the mRNAs influence the target protein regulation.

Using various tools of mathematical modelling, we quantify the effect of sRNA mediated cross-talk on the target protein concentration. The cross-talk is seen by studying how the concentration of mRNA2 (m2subscriptπ‘š2m_{2}) and sRNA (s𝑠s) change as the synthesis rate of mRNA1 (m1subscriptπ‘š1m_{1}) is changed. Following the table, we refer the mRNAs as well as their concentrations as m1subscriptπ‘š1m_{1} and m2subscriptπ‘š2m_{2}. The same convention is followed for the two species of proteins. As the concentration of m1subscriptπ‘š1m_{1} increases, there is a reduction in the free sRNA concentration since m1subscriptπ‘š1m_{1} molecules tend to form complexes with available free sRNAs and this, consequently, leads to an increase in the concentration of free m2subscriptπ‘š2m_{2} molecules since sRNAs are largely bound to m1subscriptπ‘š1m_{1}. Interestingly, the change in the concentrations shows a sensitive (or susceptible) region over a narrow range of m1subscriptπ‘š1m_{1} synthesis rate (rm1subscriptπ‘Ÿsubscriptπ‘š1r_{m_{1}}) where, with a small increase in rm1subscriptπ‘Ÿsubscriptπ‘š1r_{m_{1}}, there is an abrupt change in various concentrations. The major findings of this study are as follows. (1) The sRNA mediated cross-talk leads to an initial increase in the target protein concentration with the synthesis rate, rm1subscriptπ‘Ÿsubscriptπ‘š1r_{m_{1}}. With further increase in rm1subscriptπ‘Ÿsubscriptπ‘š1r_{m_{1}}, the target protein concentration reaches a peak and then undergoes a sharp decrease. Hence, it appears that the network motif is designed to perform most efficiently when the supply of m1subscriptπ‘š1m_{1} (i.e. ΟƒssuperscriptπœŽπ‘ \sigma^{s}-mRNA for this sFFL) is low. Since ΟƒssuperscriptπœŽπ‘ \sigma^{s} is a key stress response regulator responsible for various other regulatory activities, this might be an efficient method for maximum utilisation of available ΟƒssuperscriptπœŽπ‘ \sigma^{s}-mRNA. (2) The sRNA mediated cross-talk plays a more important role in regulating the target protein concentration compared to the direct interaction between m1subscriptπ‘š1m_{1} and m2subscriptπ‘š2m_{2}. (3) We show that the range of rm1subscriptπ‘Ÿsubscriptπ‘š1r_{m_{1}} over which the maximum synthesis of the target protein takes place also corresponds to the range where the noise in the target protein concentration is minimal. This result is further supported by stochastic simulations based on Gillespie algorithm. Overall, the present work suggests that the sRNA mediated cross-talk not only ensures maximum target protein synthesis with an efficient use of ΟƒssuperscriptπœŽπ‘ \sigma^{s}-mRNA, it also contributes to maximal noise attenuation in the target protein concentration during its synthesis.

II Results

II.1 Model and steady-state results

In the following, we present a model for the sFFL describing how the concentrations of various regulatory components change with time. The equations that we use for our calculations are

s˙˙𝑠\displaystyle\dot{s} =\displaystyle= rsβˆ’Ξ³s​sβˆ’k1+​s​m1βˆ’k2+​s​m2+subscriptπ‘Ÿπ‘ subscript𝛾𝑠𝑠superscriptsubscriptπ‘˜1𝑠subscriptπ‘š1limit-fromsuperscriptsubscriptπ‘˜2𝑠subscriptπ‘š2\displaystyle r_{s}-\gamma_{s}s-k_{1}^{+}s\ m_{1}-k_{2}^{+}s\ m_{2}+ (1)
(k1βˆ’+ΞΊ1)​c1+(k2βˆ’+ΞΊ2)​c2,superscriptsubscriptπ‘˜1subscriptπœ…1subscript𝑐1superscriptsubscriptπ‘˜2subscriptπœ…2subscript𝑐2\displaystyle(k_{1}^{-}+\kappa_{1})c_{1}+(k_{2}^{-}+\kappa_{2})c_{2},
mΛ™1subscriptΛ™π‘š1\displaystyle\dot{m}_{1} =\displaystyle= rm1βˆ’Ξ³m1​m1βˆ’k1+​s​m1+k1βˆ’β€‹c1,subscriptπ‘Ÿsubscriptπ‘š1subscript𝛾subscriptπ‘š1subscriptπ‘š1superscriptsubscriptπ‘˜1𝑠subscriptπ‘š1superscriptsubscriptπ‘˜1subscript𝑐1\displaystyle r_{m_{1}}-\gamma_{m_{1}}m_{1}-k_{1}^{+}s\ m_{1}+k_{1}^{-}c_{1}, (2)
cΛ™1subscript˙𝑐1\displaystyle\dot{c}_{1} =\displaystyle= k1+​s​m1βˆ’(k1βˆ’+Οƒ1+ΞΊ1)​c1,superscriptsubscriptπ‘˜1𝑠subscriptπ‘š1superscriptsubscriptπ‘˜1subscript𝜎1subscriptπœ…1subscript𝑐1\displaystyle k_{1}^{+}s\ m_{1}-(k_{1}^{-}+\sigma_{1}+\kappa_{1})c_{1}, (3)
pΛ™1subscript˙𝑝1\displaystyle\dot{p}_{1} =\displaystyle= rp1​c1βˆ’Ξ³p1​p1,subscriptπ‘Ÿsubscript𝑝1subscript𝑐1subscript𝛾subscript𝑝1subscript𝑝1\displaystyle r_{p_{1}}c_{1}-\gamma_{p_{1}}p_{1}, (4)
mΛ™2subscriptΛ™π‘š2\displaystyle\dot{m}_{2} =\displaystyle= rm2​kc​p11+kc​p1βˆ’Ξ³m2​m2βˆ’k2+​s​m2+k2βˆ’β€‹c2,subscriptπ‘Ÿsubscriptπ‘š2subscriptπ‘˜π‘subscript𝑝11subscriptπ‘˜π‘subscript𝑝1subscript𝛾subscriptπ‘š2subscriptπ‘š2superscriptsubscriptπ‘˜2𝑠subscriptπ‘š2superscriptsubscriptπ‘˜2subscript𝑐2\displaystyle\frac{r_{m_{2}}k_{c}\ p_{1}}{1+k_{c}p_{1}}-\gamma_{m_{2}}m_{2}-k_{2}^{+}s\ m_{2}+k_{2}^{-}c_{2}, (5)
cΛ™2subscript˙𝑐2\displaystyle\dot{c}_{2} =\displaystyle= k2+​s​m2βˆ’(k2βˆ’+Οƒ2+ΞΊ2)​c2,superscriptsubscriptπ‘˜2𝑠subscriptπ‘š2superscriptsubscriptπ‘˜2subscript𝜎2subscriptπœ…2subscript𝑐2\displaystyle k_{2}^{+}s\ m_{2}-(k_{2}^{-}+\sigma_{2}+\kappa_{2})c_{2}, (6)
pΛ™2subscript˙𝑝2\displaystyle\dot{p}_{2} =\displaystyle= rp2​c2βˆ’Ξ³p2​p2,subscriptπ‘Ÿsubscript𝑝2subscript𝑐2subscript𝛾subscript𝑝2subscript𝑝2\displaystyle r_{p_{2}}c_{2}-\gamma_{p_{2}}p_{2}, (7)

where, in general, xΛ™=dd​t​xΛ™π‘₯𝑑𝑑𝑑π‘₯\dot{x}=\frac{d}{dt}x. Here, we have used general notations for various concentrations as listed in table 1. The rate parameters rπ‘Ÿr and γ𝛾\gamma represent synthesis and degradation rates in general. c1subscript𝑐1c_{1} and c2subscript𝑐2c_{2} represent sRNA-mRNA complexes of two different kinds. k+superscriptπ‘˜k^{+} and kβˆ’superscriptπ‘˜k^{-} represent the association and dissociation rates of these complexes. ΞΊπœ…\kappa and ΟƒπœŽ\sigma represent catalytic and stoichiometric degradation rates of the complexes, respectively. While sRNAs are reused upon catalytic degradation, in the case of stoichiometric degradation the complex is degraded completely.

In the steady-state, the solutions for m1subscriptπ‘š1m_{1}, m2subscriptπ‘š2m_{2} and s𝑠s are

m1=m1βˆ—β€‹F1​(s),m2=m2βˆ—β€‹kc​a​s​F1​(s)​F2​(s)1+kc​a​s​F1​(s),whereformulae-sequencesubscriptπ‘š1superscriptsubscriptπ‘š1subscript𝐹1𝑠subscriptπ‘š2superscriptsubscriptπ‘š2subscriptπ‘˜π‘π‘Žπ‘ subscript𝐹1𝑠subscript𝐹2𝑠1subscriptπ‘˜π‘π‘Žπ‘ subscript𝐹1𝑠where\displaystyle m_{1}=m_{1}^{*}F_{1}(s),\ m_{2}=\frac{m_{2}^{*}\,k_{c}a\,s\,F_{1}(s)\,F_{2}(s)}{1+k_{c}\,a\,s\,F_{1}(s)},\ {\rm where} (8)
F1​(s)=11+s/s01​with​s01=Ξ³m1k1+​k1βˆ’+Οƒ1+ΞΊ1Οƒ1+ΞΊ1,subscript𝐹1𝑠11𝑠subscript𝑠01withsubscript𝑠01subscript𝛾subscriptπ‘š1superscriptsubscriptπ‘˜1superscriptsubscriptπ‘˜1subscript𝜎1subscriptπœ…1subscript𝜎1subscriptπœ…1\displaystyle F_{1}(s)=\frac{1}{1+s/s_{01}}\ {\rm with}\ s_{01}=\frac{\gamma_{m_{1}}}{k_{1}^{+}}\frac{k_{1}^{-}+\sigma_{1}+\kappa_{1}}{\sigma_{1}+\kappa_{1}}, (9)
F2​(s)=11+s/s02​with​s02=Ξ³m2k2+​k2βˆ’+Οƒ2+ΞΊ2Οƒ2+ΞΊ2,subscript𝐹2𝑠11𝑠subscript𝑠02withsubscript𝑠02subscript𝛾subscriptπ‘š2superscriptsubscriptπ‘˜2superscriptsubscriptπ‘˜2subscript𝜎2subscriptπœ…2subscript𝜎2subscriptπœ…2\displaystyle F_{2}(s)=\frac{1}{1+s/s_{02}}\ {\rm with}\ s_{02}=\frac{\gamma_{m_{2}}}{k_{2}^{+}}\frac{k_{2}^{-}+\sigma_{2}+\kappa_{2}}{\sigma_{2}+\kappa_{2}}, (10)
m1βˆ—=rm1Ξ³m1,m2βˆ—=rm2Ξ³m2,a=rp1Ξ³p1​k1+​m1βˆ—(k1βˆ’+Οƒ1+ΞΊ1).formulae-sequencesuperscriptsubscriptπ‘š1subscriptπ‘Ÿsubscriptπ‘š1subscript𝛾subscriptπ‘š1formulae-sequencesuperscriptsubscriptπ‘š2subscriptπ‘Ÿsubscriptπ‘š2subscript𝛾subscriptπ‘š2π‘Žsubscriptπ‘Ÿsubscript𝑝1subscript𝛾subscript𝑝1superscriptsubscriptπ‘˜1superscriptsubscriptπ‘š1superscriptsubscriptπ‘˜1subscript𝜎1subscriptπœ…1\displaystyle m_{1}^{*}=\frac{r_{m_{1}}}{\gamma_{m_{1}}},\ m_{2}^{*}=\frac{r_{m_{2}}}{\gamma_{m_{2}}},\ a=\frac{r_{p_{1}}}{\gamma_{p_{1}}}\frac{k_{1}^{+}m_{1}^{*}}{(k_{1}^{-}+\sigma_{1}+\kappa_{1})}. (11)

The steady-state concentration of sRNA can be found upon solving the following algebraic equation for s𝑠s

rsβˆ’Ξ³s​sβˆ’rm1​΢1​s​F1​(s)βˆ’rm2​΢2​kc​a​s2​F1​(s)​F2​(s)1+kc​a​s​F1​(s)=0,subscriptπ‘Ÿπ‘ subscript𝛾𝑠𝑠subscriptπ‘Ÿsubscriptπ‘š1subscript𝜁1𝑠subscript𝐹1𝑠subscriptπ‘Ÿsubscriptπ‘š2subscript𝜁2subscriptπ‘˜π‘π‘Žsuperscript𝑠2subscript𝐹1𝑠subscript𝐹2𝑠1subscriptπ‘˜π‘π‘Žπ‘ subscript𝐹1𝑠0\displaystyle r_{s}-\gamma_{s}s-r_{m_{1}}\,\zeta_{1}\,s\,F_{1}(s)-r_{m_{2}}\,\zeta_{2}\frac{k_{c}a\,s^{2}F_{1}(s)F_{2}(s)}{1+k_{c}asF_{1}(s)}=0, (12)
with​΢1=k1+​σ1Ξ³m1​(k1βˆ’+Οƒ1+ΞΊ1),ΞΆ2=k2+​σ2Ξ³m2​(k2βˆ’+Οƒ2+ΞΊ2).formulae-sequencewithsubscript𝜁1superscriptsubscriptπ‘˜1subscript𝜎1subscript𝛾subscriptπ‘š1superscriptsubscriptπ‘˜1subscript𝜎1subscriptπœ…1subscript𝜁2superscriptsubscriptπ‘˜2subscript𝜎2subscript𝛾subscriptπ‘š2superscriptsubscriptπ‘˜2subscript𝜎2subscriptπœ…2\displaystyle{\rm with}\ \zeta_{1}=\frac{k_{1}^{+}\sigma_{1}}{\gamma_{m_{1}}(k_{1}^{-}+\sigma_{1}+\kappa_{1})},\ \zeta_{2}=\frac{k_{2}^{+}\sigma_{2}}{\gamma_{m_{2}}(k_{2}^{-}+\sigma_{2}+\kappa_{2})}.\ \ (13)

Figure 2 shows how sRNA and mRNA concentrations change as rm1subscriptπ‘Ÿsubscriptπ‘š1r_{m_{1}}, the transcription rate of m1subscriptπ‘š1m_{1}, is changed.

Refer to caption
Figure 2: Changes in various concentrations with rm1subscriptπ‘Ÿsubscriptπ‘š1r_{m_{1}}. The parameter values used for these plots are: rs=rm2=1subscriptπ‘Ÿπ‘ subscriptπ‘Ÿsubscriptπ‘š21r_{s}=r_{m_{2}}=1, k1+=k2+=0.1superscriptsubscriptπ‘˜1superscriptsubscriptπ‘˜20.1k_{1}^{+}=k_{2}^{+}=0.1, k1βˆ’=k2βˆ’=0.05superscriptsubscriptπ‘˜1superscriptsubscriptπ‘˜20.05k_{1}^{-}=k_{2}^{-}=0.05, Οƒ1=Οƒ2=ΞΊ1=ΞΊ2=0.01subscript𝜎1subscript𝜎2subscriptπœ…1subscriptπœ…20.01\sigma_{1}=\sigma_{2}=\kappa_{1}=\kappa_{2}=0.01 and kc=0.1subscriptπ‘˜π‘0.1k_{c}=0.1. Degradation rates of sRNA, mRNA m1subscriptπ‘š1m_{1} and m2subscriptπ‘š2m_{2}, proteins p1subscript𝑝1p_{1} and p2subscript𝑝2p_{2} are 0.0010.0010.001 and the synthesis rates of p1subscript𝑝1p_{1} and p2subscript𝑝2p_{2} are 0.010.010.01.

The presence of sRNA induced effective interaction between m1subscriptπ‘š1m_{1} and m2subscriptπ‘š2m_{2} is apparent here since a change in the transcription rate of m1subscriptπ‘š1m_{1} affects the equilibrium concentrations of the sRNA and m2subscriptπ‘š2m_{2}. Intuitively, as the concentration of m1subscriptπ‘š1m_{1} increases, these mRNAs bind the sRNAs causing a reduction in the concentration of free sRNAs and, as a consequence, an increase in the concentration of free m2subscriptπ‘š2m_{2}. Interestingly, figure 2 shows that, over a narrow range of rm1subscriptπ‘Ÿsubscriptπ‘š1r_{m_{1}}, there exists a sensitive region where the concentrations of s, m1subscriptπ‘š1m_{1} and m2subscriptπ‘š2m_{2} change sharply as rm1subscriptπ‘Ÿsubscriptπ‘š1r_{m_{1}} is changed. We shall show in the following that over this region, the sFFL attenuates the fluctuations (noise) in the target protein concentration maximally. In sFFL, there is a direct interaction between mRNAs, m1subscriptπ‘š1m_{1}, and m2subscriptπ‘š2m_{2}, since the protein product of m1subscriptπ‘š1m_{1} is a transcriptional activator of p2subscript𝑝2p_{2}. The change in the concentration of m2subscriptπ‘š2m_{2} with rm1subscriptπ‘Ÿsubscriptπ‘š1r_{m_{1}} is, thus, expected. However, as we show below, a large contribution in the increase of m2subscriptπ‘š2m_{2} concentration comes from the sRNA induced cross-talk between mRNAs.

II.2 Response functions

In order to quantify the interactions among various regulatory molecules, we introduce the following response functions

Ο‡i​j=βˆ‚miβˆ‚rmj,wherei,j=1, 2withiβ‰ jformulae-sequencesubscriptπœ’π‘–π‘—subscriptπ‘šπ‘–subscriptπ‘Ÿsubscriptπ‘šπ‘—where𝑖formulae-sequence𝑗12with𝑖𝑗\displaystyle\chi_{ij}=\frac{\partial m_{i}}{\partial r_{m_{j}}},\ \ {\rm where}\ \ i,\ j=1,\ 2\ \ {\rm with}\ \ i\neq j (14)
Ο‡s​i=βˆ‚sβˆ‚rmi,wherei=1, 2.formulae-sequencesubscriptπœ’π‘ π‘–π‘ subscriptπ‘Ÿsubscriptπ‘šπ‘–where𝑖12\displaystyle\chi_{si}=\frac{\partial s}{\partial r_{m_{i}}},\ \ {\rm where}\ \ i=1,\ 2. (15)

Here Ο‡i​jsubscriptπœ’π‘–π‘—\chi_{ij} represents the response in terms of a change in the concentration of a specific kind of mRNA (m1subscriptπ‘š1m_{1} or m2subscriptπ‘š2m_{2}) as the transcription rate of the other mRNA is changed. In similar way, Ο‡s​isubscriptπœ’π‘ π‘–\chi_{si} represents the change in sRNA concentration as the transcription rates of the i𝑖ith mRNA, i.e. rm1subscriptπ‘Ÿsubscriptπ‘š1r_{m_{1}} or rm2subscriptπ‘Ÿsubscriptπ‘š2r_{m_{2}} is changed.

Using (8) and (12) we find the response functions as

Ο‡12subscriptπœ’12\displaystyle\chi_{12} =\displaystyle= m1βˆ—β€‹F1′​χs​2,Ο‡21=m2βˆ—β€‹kc​a(1+kc​a​s​F1)2​{Ο‡s​1​[F1​F2+s​(F1′​F2+F1​F2β€²)+kc​a​s2​F12​F2β€²]+s​F2​F1rm1}​withsuperscriptsubscriptπ‘š1superscriptsubscript𝐹1β€²subscriptπœ’π‘ 2subscriptπœ’21superscriptsubscriptπ‘š2subscriptπ‘˜π‘π‘Žsuperscript1subscriptπ‘˜π‘π‘Žπ‘ subscript𝐹12subscriptπœ’π‘ 1delimited-[]subscript𝐹1subscript𝐹2𝑠superscriptsubscript𝐹1β€²subscript𝐹2subscript𝐹1superscriptsubscript𝐹2β€²subscriptπ‘˜π‘π‘Žsuperscript𝑠2superscriptsubscript𝐹12superscriptsubscript𝐹2′𝑠subscript𝐹2subscript𝐹1subscriptπ‘Ÿsubscriptπ‘š1with\displaystyle m_{1}^{*}F_{1}^{\prime}\ \chi_{s2},\qquad\chi_{21}=\frac{m_{2}^{*}\,k_{c}a}{{(1+k_{c}asF_{1})}^{2}}\left\{\chi_{s1}\left[F_{1}\,F_{2}\,+s(F_{1}^{\prime}F_{2}+F_{1}F_{2}^{\prime})+k_{c}\,a\,s^{2}\,F_{1}^{2}\,F_{2}^{\prime}\right]+\frac{sF_{2}F_{1}}{r_{m_{1}}}\right\}\ {\rm with} (16)
Ο‡s​1subscriptπœ’π‘ 1\displaystyle\chi_{s1} =\displaystyle= βˆ’ΞΆ1​s​F1βˆ’ΞΆ2​rm2​kc​a​s2​F2​F1​[rm1​(1+kc​a​s​F1)2]βˆ’1Ξ³s+rm1​΢1​[F1+s​F1β€²]+rm2​΢2​kc​a​s(1+kc​a​s​F1)2​[2​F1​F2+s​(F1′​F2+F1​F2β€²)+kc​a​s​F12​(F2+s​F2β€²)]​andsubscript𝜁1𝑠subscript𝐹1subscript𝜁2subscriptπ‘Ÿsubscriptπ‘š2subscriptπ‘˜π‘π‘Žsuperscript𝑠2subscript𝐹2subscript𝐹1superscriptdelimited-[]subscriptπ‘Ÿsubscriptπ‘š1superscript1subscriptπ‘˜π‘π‘Žπ‘ subscript𝐹121subscript𝛾𝑠subscriptπ‘Ÿsubscriptπ‘š1subscript𝜁1delimited-[]subscript𝐹1𝑠superscriptsubscript𝐹1β€²subscriptπ‘Ÿsubscriptπ‘š2subscript𝜁2subscriptπ‘˜π‘π‘Žπ‘ superscript1subscriptπ‘˜π‘π‘Žπ‘ subscript𝐹12delimited-[]2subscript𝐹1subscript𝐹2𝑠superscriptsubscript𝐹1β€²subscript𝐹2subscript𝐹1superscriptsubscript𝐹2β€²subscriptπ‘˜π‘π‘Žπ‘ superscriptsubscript𝐹12subscript𝐹2𝑠superscriptsubscript𝐹2β€²and\displaystyle\frac{-\,\zeta_{1}\,s\,F_{1}-\zeta_{2}\ r_{m_{2}}k_{c}\,a\,s^{2}\,F_{2}\,F_{1}\left[r_{m_{1}}(1+k_{c}\,a\,s\,F_{1})^{2}\right]^{-1}}{\gamma_{s}+r_{m_{1}}\zeta_{1}[F_{1}+s\,F_{1}^{\prime}]+\frac{r_{m_{2}}\zeta_{2}\,k_{c}a\,s}{(1+k_{c}\,a\,s\,F_{1})^{2}}\left[{2\,F_{1}\,F_{2}\,+s(F_{1}^{\prime}F_{2}+F_{1}F_{2}^{\prime})+k_{c}\,a\,s\,F_{1}^{2}(F_{2}+sF_{2}^{\prime})}\right]}\ {\rm and} (17)
Ο‡s​2subscriptπœ’π‘ 2\displaystyle\chi_{s2} =\displaystyle= βˆ’ΞΆ2​kc​a​s2​F2​F1​[(1+kc​a​s​F1)]βˆ’1Ξ³s+rm1​΢1​[F1+s​F1β€²]+rm2​΢2​kc​a​s(1+kc​a​s​F1)2​[2​F1​F2+s​(F1′​F2+F1​F2β€²)+kc​a​s​F12​(F2+s​F2β€²)].subscript𝜁2subscriptπ‘˜π‘π‘Žsuperscript𝑠2subscript𝐹2subscript𝐹1superscriptdelimited-[]1subscriptπ‘˜π‘π‘Žπ‘ subscript𝐹11subscript𝛾𝑠subscriptπ‘Ÿsubscriptπ‘š1subscript𝜁1delimited-[]subscript𝐹1𝑠superscriptsubscript𝐹1β€²subscriptπ‘Ÿsubscriptπ‘š2subscript𝜁2subscriptπ‘˜π‘π‘Žπ‘ superscript1subscriptπ‘˜π‘π‘Žπ‘ subscript𝐹12delimited-[]2subscript𝐹1subscript𝐹2𝑠superscriptsubscript𝐹1β€²subscript𝐹2subscript𝐹1superscriptsubscript𝐹2β€²subscriptπ‘˜π‘π‘Žπ‘ superscriptsubscript𝐹12subscript𝐹2𝑠superscriptsubscript𝐹2β€²\displaystyle\frac{-\zeta_{2}\,k_{c}a\,s^{2}\,F_{2}\,F_{1}\left[(1+k_{c}\,a\,s\,F_{1})\right]^{-1}}{\gamma_{s}+r_{m_{1}}\zeta_{1}[F_{1}+s\,F_{1}^{\prime}]+\frac{r_{m_{2}}\zeta_{2}\,k_{c}a\,s}{{(1+k_{c}\,a\,s\,F_{1})}^{2}}\left[{2\,F_{1}\,F_{2}\,+s(F_{1}^{\prime}F_{2}+F_{1}F_{2}^{\prime})+k_{c}\,a\,s\,F_{1}^{2}(F_{2}+sF_{2}^{\prime})}\right]}. (18)

where F1β€²=βˆ‚βˆ‚s​F1superscriptsubscript𝐹1′𝑠subscript𝐹1F_{1}^{\prime}=\frac{\partial}{\partial s}F_{1} and F2β€²=βˆ‚βˆ‚s​F2superscriptsubscript𝐹2′𝑠subscript𝐹2F_{2}^{\prime}=\frac{\partial}{\partial s}F_{2}. The response in the sRNA concentration is always negative (βˆ‚sβˆ‚rm1<0𝑠subscriptπ‘Ÿsubscriptπ‘š10\frac{\partial s}{\partial r_{m_{1}}}<0, βˆ‚sβˆ‚rm2<0𝑠subscriptπ‘Ÿsubscriptπ‘š20\frac{\partial s}{\partial r_{m_{2}}}<0 ) indicating that the concentration of free sRNA decreases with enhanced synthesis of mRNAs, m1subscriptπ‘š1m_{1} and m2subscriptπ‘š2m_{2}. Such reduction in free sRNA happens due to the sRNA-mRNA complex formation. The response function Ο‡21subscriptπœ’21\chi_{21} has two parts. The first term indicates a change in m2subscriptπ‘š2m_{2} as a result of the change in free sRNA concentration. This happens due to an enhanced sRNA-mRNA1 complex (c1subscript𝑐1c_{1}) formation as the transcription rate of mRNA m1subscriptπ‘š1m_{1} is increased. This indirect influence of the transcription rate of m1subscriptπ‘š1m_{1} on m2subscriptπ‘š2m_{2} concentration via sRNA is a signature of sRNA induced cross-talk between the mRNAs. The second term in the equation for Ο‡21subscriptπœ’21\chi_{21} ( see equation 16) originates from the direct interaction between m1subscriptπ‘š1m_{1} and m2subscriptπ‘š2m_{2} because of the transcriptional activation of m2subscriptπ‘š2m_{2} by the protein product of m1subscriptπ‘š1m_{1}. From the equation for Ο‡12subscriptπœ’12\chi_{12} it is clear that the synthesis rate of m2subscriptπ‘š2m_{2} affects the concentration of m1subscriptπ‘š1m_{1} only through an indirect interaction mediated by sRNA. Further, as observed earlier marinari , in the absence of stoichiometric complex decay (i.e. for Οƒ1=Οƒ2=0subscript𝜎1subscript𝜎20\sigma_{1}=\sigma_{2}=0), the indirect interaction term disappears since, in this case, βˆ‚sβˆ‚rm1=0𝑠subscriptπ‘Ÿsubscriptπ‘š10\frac{\partial s}{\partial r_{m_{1}}}=0 and βˆ‚sβˆ‚rm2=0𝑠subscriptπ‘Ÿsubscriptπ‘š20\frac{\partial s}{\partial r_{m_{2}}}=0. The response functions can be compared with sRNA-driven cascade network (sCN) where sRNA post-transcriptionally up-regulates p1subscript𝑝1p_{1} synthesis and p1subscript𝑝1p_{1} transcriptionally up-regulates p2subscript𝑝2p_{2} synthesis. (see appendix A for details). Thus unlike sFFL, in sCN, there is no competition for sRNA sharing. Consequently, the response functions, in this case, are (see appendix A for details)

Ο‡12=0,Ο‡21=kc​m2βˆ—β€‹a(1+kc​a​s​F1)2​{Ο‡s​1​[F1+s​F1β€²]+s​F1rm1}formulae-sequencesubscriptπœ’120subscriptπœ’21subscriptπ‘˜π‘superscriptsubscriptπ‘š2π‘Žsuperscript1subscriptπ‘˜π‘π‘Žπ‘ subscript𝐹12subscriptπœ’π‘ 1delimited-[]subscript𝐹1𝑠superscriptsubscript𝐹1′𝑠subscript𝐹1subscriptπ‘Ÿsubscriptπ‘š1\displaystyle\chi_{12}=0,\ \chi_{21}=\frac{k_{c}m_{2}^{*}\,a}{{(1+k_{c}asF_{1})}^{2}}\left\{\chi_{s1}\left[F_{1}+sF_{1}^{\prime}\right]+\frac{sF_{1}}{r_{m_{1}}}\right\} (19)
withΟ‡s​1=βˆ’ΞΆ1​s​F1Ξ³s+rm1​΢1​[F1+s​F1β€²]andΟ‡s​2=0formulae-sequencewithsubscriptπœ’π‘ 1subscript𝜁1𝑠subscript𝐹1subscript𝛾𝑠subscriptπ‘Ÿsubscriptπ‘š1subscript𝜁1delimited-[]subscript𝐹1𝑠superscriptsubscript𝐹1β€²andsubscriptπœ’π‘ 20\displaystyle{\rm with}\ \ \chi_{s1}=\frac{-\,\zeta_{1}\,s\,F_{1}}{\gamma_{s}+r_{m_{1}}\zeta_{1}[F_{1}+s\,F_{1}^{\prime}]}\ \ \ {\rm and}\ \ \ \chi_{s2}=0 (20)

The vanishing of Ο‡12subscriptπœ’12\chi_{12} is expected as, in contrary to sFFL, here the increase in m2subscriptπ‘š2m_{2} synthesis does not affect the sRNA concentration.

Refer to caption

(a)
Refer to caption (b)

Figure 3: (a) The response function, Ο‡21subscriptπœ’21\chi_{21} for sFFL plotted with rm1subscriptπ‘Ÿsubscriptπ‘š1r_{m_{1}}, the transcription rate of mRNA, m1subscriptπ‘š1m_{1}. (b) The response due to the transcriptional interaction between p1subscript𝑝1p_{1} (the protein product of m1subscriptπ‘š1m_{1}) and m2subscriptπ‘š2m_{2}. Same parameter values as in figure 2 are used here.

In order to see how the response function Ο‡21subscriptπœ’21\chi_{21} changes with rm1subscriptπ‘Ÿsubscriptπ‘š1r_{m_{1}}, we have obtained Ο‡21subscriptπœ’21\chi_{21} numerically using equations (8) and (12). For an estimate of the contribution from the direct interaction part (the second term in Ο‡21subscriptπœ’21\chi_{21} of equation (16)), Ο‡21​dsubscriptπœ’21𝑑\chi_{21d}, we have plotted Ο‡21​d=m2βˆ—β€‹kc​a​s​F1​F2rm1​(1+kc​a​s​F1)2subscriptπœ’21𝑑superscriptsubscriptπ‘š2subscriptπ‘˜π‘π‘Žπ‘ subscript𝐹1subscript𝐹2subscriptπ‘Ÿsubscriptπ‘š1superscript1subscriptπ‘˜π‘π‘Žπ‘ subscript𝐹12\chi_{21d}=m_{2}^{*}\frac{k_{c}asF_{1}F_{2}}{r_{m_{1}}(1+k_{c}asF_{1})^{2}} after substituting the solution for s𝑠s as a function of rm1subscriptπ‘Ÿsubscriptπ‘š1r_{m_{1}}. Figure 3(a) shows the rate of change of concentration of m2subscriptπ‘š2m_{2} with respect to rm1subscriptπ‘Ÿsubscriptπ‘š1r_{m_{1}} (i.e. Ο‡21subscriptπœ’21\chi_{21}) for different values of rm1subscriptπ‘Ÿsubscriptπ‘š1r_{m_{1}}. The presence of the sensitive region, as discussed before, appears very prominently in these figures. As figures 3(a) and 3(b) indicate, the contribution of the direct interaction part to Ο‡21subscriptπœ’21\chi_{21}, in general, is quite small compared to the sRNA-mediated part.

II.3 Effect of sRNA mediated cross-talk on the target protein concentration

Refer to caption

(a)
Refer to caption(b)

Figure 4: Variation of target protein expression with the transcription rate (rm1subscriptπ‘Ÿsubscriptπ‘š1r_{m_{1}}) of mRNA, m1subscriptπ‘š1m_{1} for (a) sFFL with and without cross-talk ( Οƒ1=Οƒ2=0subscript𝜎1subscript𝜎20\sigma_{1}=\sigma_{2}\,=0) and for (b) sRNA-driven cascade network (sCN). Parameter values are as same as those chosen for figure 2.

In this section, we focus on the influence of sRNA mediated cross-talk between mRNAs on the target protein concentration. When there is complete recycling of sRNA (i.e. Οƒ1=Οƒ2=0subscript𝜎1subscript𝜎20\sigma_{1}=\sigma_{2}=0), there is no sRNA mediated cross-talk between the mRNAs since Ο‡s​1=Ο‡s​2=0subscriptπœ’π‘ 1subscriptπœ’π‘ 20\chi_{s1}=\chi_{s2}=0. Under such conditions, the target protein concentration increases initially with the transcription rate, rm1subscriptπ‘Ÿsubscriptπ‘š1r_{m_{1}}, and saturates eventually as a consequence of the saturation kinetics associated with transcriptional activation in m2subscriptπ‘š2m_{2} synthesis by p1subscript𝑝1p_{1} (see figure 4(a)). In the presence of sRNA induced cross-talk (i.e. Οƒ1,Οƒ2β‰ 0subscript𝜎1subscript𝜎20\sigma_{1},\sigma_{2}\neq 0), with the increase in rm1subscriptπ‘Ÿsubscriptπ‘š1r_{m_{1}}, the target protein concentration goes through a peak followed by a sharp decrease. This happens near the sensitive region where the concentration of free sRNA available for translational activation of p2subscript𝑝2p_{2} drops down drastically. In the case of sCN (see figure 4(b)), the protein concentration reaches a saturation value which persists over the entire range. Thus it appears that as far as the target protein concentration is concerned, the network performs most efficiently for low concentration of ΟƒssuperscriptπœŽπ‘ \sigma^{s} mRNA. This feature may be beneficial for the cell since ΟƒssuperscriptπœŽπ‘ \sigma^{s} is a key regulator associated with different types of stress-response of the cell.

II.4 Noise Analysis

Refer to caption
Figure 5: The coefficient of variation for the target protein in sFFL as a function of rm1subscriptπ‘Ÿsubscriptπ‘š1r_{m_{1}}, the synthesis rate of the intermediate mRNA, m1subscriptπ‘š1m_{1}, for different values of sRNA synthesis rate, rssubscriptπ‘Ÿπ‘ r_{s}. The coefficient of variation is obtained by finding numerical solutions for necessary moments using Mathematica (lines without markers). The parameter values used for this are Ξ³s=Ξ³m1=Ξ³m2=Ξ³p1=Ξ³p2=0.001subscript𝛾𝑠subscript𝛾subscriptπ‘š1subscript𝛾subscriptπ‘š2subscript𝛾subscript𝑝1subscript𝛾subscript𝑝20.001\gamma_{s}=\gamma_{m_{1}}=\gamma_{m_{2}}=\gamma_{p_{1}}=\gamma_{p_{2}}=0.001, rm2=rp1=rp2=0.01,k1+=k2+=0.1formulae-sequencesubscriptπ‘Ÿsubscriptπ‘š2subscriptπ‘Ÿsubscript𝑝1subscriptπ‘Ÿsubscript𝑝20.01superscriptsubscriptπ‘˜1superscriptsubscriptπ‘˜20.1r_{m_{2}}=r_{p_{1}}=r_{p_{2}}=0.01,\ k_{1}^{+}=k_{2}^{+}=0.1, k1βˆ’=k2βˆ’=0.05,kc=0.1formulae-sequencesuperscriptsubscriptπ‘˜1superscriptsubscriptπ‘˜20.05subscriptπ‘˜π‘0.1k_{1}^{-}=k_{2}^{-}=0.05,k_{c}=0.1 and ΞΊ1=ΞΊ2=Οƒ1=Οƒ2=0.005subscriptπœ…1subscriptπœ…2subscript𝜎1subscript𝜎20.005\kappa_{1}=\kappa_{2}=\sigma_{1}=\sigma_{2}=0.005. The lines with markers represent the same found from stochastic simulations based on the Gillespie algorithm. The details regarding the reactions and the reaction rates are presented in appendix D.

The aim of the present section is to find how the sRNA induced cross-talk influences the noise buffering characteristics of sFFL. We begin with the master equation that describes how the probability of a given state changes with time vankampen . A state of this system is described by the numbers of sRNA, two different mRNAs and two different protein molecules. The state of the system changes as the numbers of various molecules change due to possible reactions taking place at given rates. We introduce Ps,m1,p1,m2,p2​(t)subscript𝑃𝑠subscriptπ‘š1subscript𝑝1subscriptπ‘š2subscript𝑝2𝑑P_{s,m_{1},p_{1},m_{2},p_{2}}(t) as the probability at time t𝑑t that the system is in a state in which the number of sRNA, mRNA and protein molecules are s𝑠s, m1subscriptπ‘š1m_{1}, m2subscriptπ‘š2m_{2}, p1subscript𝑝1p_{1} and p2subscript𝑝2p_{2}, respectively. The master equation describing the rate of change of the probability function with time can be written as

βˆ‚tPs,m1,p1,m2,p2​(t)=rs​(Psβˆ’1,m1,p1,m2,p2βˆ’Ps,m1,p1,m2,p2)+Ξ³s​((s+1)​Ps+1,m1,p1,m2,p2βˆ’s​Ps,m1,p1,m2,p2)subscript𝑑subscript𝑃𝑠subscriptπ‘š1subscript𝑝1subscriptπ‘š2subscript𝑝2𝑑subscriptπ‘Ÿπ‘ subscript𝑃𝑠1subscriptπ‘š1subscript𝑝1subscriptπ‘š2subscript𝑝2subscript𝑃𝑠subscriptπ‘š1subscript𝑝1subscriptπ‘š2subscript𝑝2subscript𝛾𝑠𝑠1subscript𝑃𝑠1subscriptπ‘š1subscript𝑝1subscriptπ‘š2subscript𝑝2𝑠subscript𝑃𝑠subscriptπ‘š1subscript𝑝1subscriptπ‘š2subscript𝑝2\displaystyle{\partial_{t}}P_{s,m_{1},p_{1},m_{2},p_{2}}(t)=r_{s}(P_{{s-1},m_{1},p_{1},{m_{2}},p_{2}}-P_{s,m_{1},p_{1},{m_{2}},p_{2}})+\gamma_{s}((s+1)P_{s+1,m_{1},p_{1},{m_{2}},p_{2}}-sP_{s,m_{1},p_{1},{m_{2}},p_{2}})
+rm1​(Ps,m1βˆ’1,p1,m2,p2βˆ’Ps,m1,p1,m2,p2)+Ξ³m1​((m1+1)​Ps,m1+1,p1,m2,p2βˆ’m1​Ps,m1,p1,m2,p2)subscriptπ‘Ÿsubscriptπ‘š1subscript𝑃𝑠subscriptπ‘š11subscript𝑝1subscriptπ‘š2subscript𝑝2subscript𝑃𝑠subscriptπ‘š1subscript𝑝1subscriptπ‘š2subscript𝑝2subscript𝛾subscriptπ‘š1subscriptπ‘š11subscript𝑃𝑠subscriptπ‘š11subscript𝑝1subscriptπ‘š2subscript𝑝2subscriptπ‘š1subscript𝑃𝑠subscriptπ‘š1subscript𝑝1subscriptπ‘š2subscript𝑝2\displaystyle\ \qquad+r_{m_{1}}(P_{s,m_{1}-1,p_{1},{m_{2}},p_{2}}-P_{s,m_{1},p_{1},{m_{2}},p_{2}})+\gamma_{m_{1}}((m_{1}+1)P_{s,m_{1}+1,p_{1},{m_{2}},p_{2}}-m_{1}P_{s,m_{1},p_{1},{m_{2}},p_{2}})
+rp1′​s​m1​(Ps,m1,p1βˆ’1,m2,p2βˆ’Ps,m1,p1,m2,p2)+Ξ³p1​((p1+1)​Ps,m1,p1+1,m2,p2βˆ’p1​Ps,m1,p1,m2,p2)superscriptsubscriptπ‘Ÿsubscript𝑝1′𝑠subscriptπ‘š1subscript𝑃𝑠subscriptπ‘š1subscript𝑝11subscriptπ‘š2subscript𝑝2subscript𝑃𝑠subscriptπ‘š1subscript𝑝1subscriptπ‘š2subscript𝑝2subscript𝛾subscript𝑝1subscript𝑝11subscript𝑃𝑠subscriptπ‘š1subscript𝑝11subscriptπ‘š2subscript𝑝2subscript𝑝1subscript𝑃𝑠subscriptπ‘š1subscript𝑝1subscriptπ‘š2subscript𝑝2\displaystyle\ \qquad+r_{p_{1}}^{\prime}\ s\ m_{1}(P_{s,m_{1},p_{1}-1,{m_{2}},p_{2}}-P_{s,m_{1},p_{1},{m_{2}},p_{2}})+\gamma_{p_{1}}((p_{1}+1)P_{s,m_{1},p_{1}+1,{m_{2}},p_{2}}-p_{1}P_{s,m_{1},p_{1},{m_{2}},p_{2}})
+rm2​(p1)​(Ps,m1,p1,m2βˆ’1,p2βˆ’Ps,m1,p1,m2,p2)+Ξ³m2​((m2+1)​Ps,m1,p1,m2+1,p2βˆ’m2​Ps,m1,p1,m2,p2)subscriptπ‘Ÿsubscriptπ‘š2subscript𝑝1subscript𝑃𝑠subscriptπ‘š1subscript𝑝1subscriptπ‘š21subscript𝑝2subscript𝑃𝑠subscriptπ‘š1subscript𝑝1subscriptπ‘š2subscript𝑝2subscript𝛾subscriptπ‘š2subscriptπ‘š21subscript𝑃𝑠subscriptπ‘š1subscript𝑝1subscriptπ‘š21subscript𝑝2subscriptπ‘š2subscript𝑃𝑠subscriptπ‘š1subscript𝑝1subscriptπ‘š2subscript𝑝2\displaystyle\ \qquad+r_{m_{2}}(p_{1})(P_{s,m_{1},p_{1},{m_{2}}-1,p_{2}}-P_{s,m_{1},p_{1},{m_{2}},p_{2}})+\gamma_{m_{2}}(({m_{2}}+1)P_{s,m_{1},p_{1},{m_{2}}+1,p_{2}}-{m_{2}}P_{s,m_{1},p_{1},{m_{2}},p_{2}})
+rp2′​s​m2​(Ps,m1,p1,m2,p2βˆ’1βˆ’Ps,m1,p1,m2,p2)+Ξ³p2​((p2+1)​Ps,m1,p1,m2,p2+1βˆ’p2​Ps,m1,p1,m2,p2)superscriptsubscriptπ‘Ÿsubscript𝑝2′𝑠subscriptπ‘š2subscript𝑃𝑠subscriptπ‘š1subscript𝑝1subscriptπ‘š2subscript𝑝21subscript𝑃𝑠subscriptπ‘š1subscript𝑝1subscriptπ‘š2subscript𝑝2subscript𝛾subscript𝑝2subscript𝑝21subscript𝑃𝑠subscriptπ‘š1subscript𝑝1subscriptπ‘š2subscript𝑝21subscript𝑝2subscript𝑃𝑠subscriptπ‘š1subscript𝑝1subscriptπ‘š2subscript𝑝2\displaystyle\ \qquad+r_{p_{2}}^{\prime}\ s\ {m_{2}}\ (P_{s,m_{1},p_{1},{m_{2}},{p_{2}-1}}-P_{s,m_{1},p_{1},{m_{2}},p_{2}})+\gamma_{p_{2}}((p_{2}+1)P_{s,m_{1},p_{1},{m_{2}},p_{2}+1}-p_{2}P_{s,m_{1},p_{1},{m_{2}},p_{2}})
+g1​((s+1)​(m1+1)​Ps+1,m1+1,p1,m2,p2βˆ’s​m1​Ps,m1,p1,m2,p2)+d1​s​((m1+1)​Ps,m1+1,p1,m2,p2βˆ’m1​Ps,m1,p1,m2,p2)subscript𝑔1𝑠1subscriptπ‘š11subscript𝑃𝑠1subscriptπ‘š11subscript𝑝1subscriptπ‘š2subscript𝑝2𝑠subscriptπ‘š1subscript𝑃𝑠subscriptπ‘š1subscript𝑝1subscriptπ‘š2subscript𝑝2subscript𝑑1𝑠subscriptπ‘š11subscript𝑃𝑠subscriptπ‘š11subscript𝑝1subscriptπ‘š2subscript𝑝2subscriptπ‘š1subscript𝑃𝑠subscriptπ‘š1subscript𝑝1subscriptπ‘š2subscript𝑝2\displaystyle\ \qquad+g_{1}((s+1)(m_{1}+1)P_{s+1,m_{1}+1,p_{1},{m_{2}},p_{2}}-s\,m_{1}\,P_{s,m_{1},p_{1},{m_{2}},p_{2}})+d_{1}\,s\,((m_{1}+1)P_{s,m_{1}+1,p_{1},{m_{2}},p_{2}}-m_{1}\,P_{s,m_{1},p_{1},{m_{2}},p_{2}})
+g2​((s+1)​(m2+1)​Ps+1,m1,p1,m2+1,p2βˆ’s​m2​Ps,m1,p1,m2,p2)+d2​s​((m2+1)​Ps,m1,p1,m2+1,p2βˆ’m2​Ps,m1,p1,m2,p2).subscript𝑔2𝑠1subscriptπ‘š21subscript𝑃𝑠1subscriptπ‘š1subscript𝑝1subscriptπ‘š21subscript𝑝2𝑠subscriptπ‘š2subscript𝑃𝑠subscriptπ‘š1subscript𝑝1subscriptπ‘š2subscript𝑝2subscript𝑑2𝑠subscriptπ‘š21subscript𝑃𝑠subscriptπ‘š1subscript𝑝1subscriptπ‘š21subscript𝑝2subscriptπ‘š2subscript𝑃𝑠subscriptπ‘š1subscript𝑝1subscriptπ‘š2subscript𝑝2\displaystyle\ \qquad+g_{2}((s+1)(m_{2}+1)P_{s+1,m_{1},p_{1},{m_{2}+1},p_{2}}-\ s\,m_{2}\,P_{s,m_{1},p_{1},{m_{2}},p_{2}})+d_{2}\,s\,((m_{2}+1)P_{s,m_{1},p_{1},{m_{2}+1},p_{2}}-m_{2}\,P_{s,m_{1},p_{1},{m_{2}},p_{2}}).

Here βˆ‚tPs,m1,p1,m2,p2​(t)=βˆ‚βˆ‚t​Ps,m1,p1,m2,p2​(t)subscript𝑑subscript𝑃𝑠subscriptπ‘š1subscript𝑝1subscriptπ‘š2subscript𝑝2𝑑𝑑subscript𝑃𝑠subscriptπ‘š1subscript𝑝1subscriptπ‘š2subscript𝑝2𝑑{\partial_{t}}P_{s,m_{1},p_{1},m_{2},p_{2}}(t)=\frac{\partial}{\partial t}P_{s,m_{1},p_{1},m_{2},p_{2}}(t). Various terms on the right hand side of the equation account for different reactions representing synthesis and degradation of various molecules (see appendix B for details). Here

rp1β€²=rp1​k1+k1βˆ’+Οƒ1+ΞΊ1,rp2β€²=rp2​k2+k2βˆ’+Οƒ2+ΞΊ2,g1=k1+​σ1k1βˆ’+Οƒ1+ΞΊ1,g2=k2+​σ2k2βˆ’+Οƒ2+ΞΊ2d1=k1+​κ1k1βˆ’+Οƒ1+ΞΊ1,formulae-sequencesuperscriptsubscriptπ‘Ÿsubscript𝑝1β€²subscriptπ‘Ÿsubscript𝑝1superscriptsubscriptπ‘˜1superscriptsubscriptπ‘˜1subscript𝜎1subscriptπœ…1formulae-sequencesuperscriptsubscriptπ‘Ÿsubscript𝑝2β€²subscriptπ‘Ÿsubscript𝑝2superscriptsubscriptπ‘˜2superscriptsubscriptπ‘˜2subscript𝜎2subscriptπœ…2formulae-sequencesubscript𝑔1superscriptsubscriptπ‘˜1subscript𝜎1superscriptsubscriptπ‘˜1subscript𝜎1subscriptπœ…1formulae-sequencesubscript𝑔2superscriptsubscriptπ‘˜2subscript𝜎2superscriptsubscriptπ‘˜2subscript𝜎2subscriptπœ…2subscript𝑑1superscriptsubscriptπ‘˜1subscriptπœ…1superscriptsubscriptπ‘˜1subscript𝜎1subscriptπœ…1\displaystyle r_{p_{1}}^{\prime}=\frac{r_{p_{1}}k_{1}^{+}}{k_{1}^{-}+\sigma_{1}+\kappa_{1}},\ r_{p_{2}}^{\prime}=\frac{r_{p_{2}}k_{2}^{+}}{k_{2}^{-}+\sigma_{2}+\kappa_{2}},\ g_{1}=\frac{k_{1}^{+}\,\sigma_{1}}{k_{1}^{-}+\sigma_{1}+\kappa_{1}},\ g_{2}=\frac{k_{2}^{+}\,\sigma_{2}}{k_{2}^{-}+\sigma_{2}+\kappa_{2}}\ \ \ d_{1}=\frac{k_{1}^{+}\,\kappa_{1}}{k_{1}^{-}+\sigma_{1}+\kappa_{1}},
and​d2=k2+​κ2k2βˆ’+Οƒ2+ΞΊ2.andsubscript𝑑2superscriptsubscriptπ‘˜2subscriptπœ…2superscriptsubscriptπ‘˜2subscript𝜎2subscriptπœ…2\displaystyle{\rm and}\ d_{2}=\frac{k_{2}^{+}\,\kappa_{2}}{k_{2}^{-}+\sigma_{2}+\kappa_{2}}. (22)

The transcriptional activation of p2subscript𝑝2p_{2} by p1subscript𝑝1p_{1} is taken into account by the Hill function, rm2​(p1)=rm2​kc​p11+kc​p1subscriptπ‘Ÿsubscriptπ‘š2subscript𝑝1subscriptπ‘Ÿsubscriptπ‘š2subscriptπ‘˜π‘subscript𝑝11subscriptπ‘˜π‘subscript𝑝1r_{m_{2}}(p_{1})=\frac{r_{m_{2}}k_{c}\,p_{1}}{1+k_{c}\,p_{1}}. For the present calculation, the Hill function is approximated about the average steady-state density ⟨p1⟩delimited-⟨⟩subscript𝑝1\langle p_{1}\rangle as

rm2​(p1)=rm20+rm21​p1​whererm20=rm2​kc2β€‹βŸ¨p1⟩2(1+kcβ€‹βŸ¨p1⟩)2​and​rm21=rm2​kc(1+kcβ€‹βŸ¨p1⟩)2.formulae-sequencesubscriptπ‘Ÿsubscriptπ‘š2subscript𝑝1superscriptsubscriptπ‘Ÿsubscriptπ‘š20superscriptsubscriptπ‘Ÿsubscriptπ‘š21subscript𝑝1wheresuperscriptsubscriptπ‘Ÿsubscriptπ‘š20subscriptπ‘Ÿsubscriptπ‘š2superscriptsubscriptπ‘˜π‘2superscriptdelimited-⟨⟩subscript𝑝12superscript1subscriptπ‘˜π‘delimited-⟨⟩subscript𝑝12andsuperscriptsubscriptπ‘Ÿsubscriptπ‘š21subscriptπ‘Ÿsubscriptπ‘š2subscriptπ‘˜π‘superscript1subscriptπ‘˜π‘delimited-⟨⟩subscript𝑝12\displaystyle r_{m_{2}}(p_{1})=r_{m_{2}}^{0}+r_{m_{2}}^{1}p_{1}\ {\rm where}\ \ \ r_{m_{2}}^{0}=\frac{r_{m_{2}}k_{c}^{2}\left\langle p_{1}\right\rangle^{2}}{{(1+k_{c}\left\langle p_{1}\right\rangle)}^{2}}\ {\rm and}\ r_{m_{2}}^{1}=\frac{r_{m_{2}}k_{c}}{{(1+k_{c}\left\langle p_{1}\right\rangle)}^{2}}. (23)

Next, we consider the moment generating function

G​(z1,z2,z3,z4,z5)=βˆ‘s,m1,p1,m2,p2z1s​z2m1​z3p1​z4m2​z5p2​Ps,m1,p1,m2,p2𝐺subscript𝑧1subscript𝑧2subscript𝑧3subscript𝑧4subscript𝑧5subscript𝑠subscriptπ‘š1subscript𝑝1subscriptπ‘š2subscript𝑝2subscriptsuperscript𝑧𝑠1subscriptsuperscript𝑧subscriptπ‘š12subscriptsuperscript𝑧subscript𝑝13subscriptsuperscript𝑧subscriptπ‘š24subscriptsuperscript𝑧subscript𝑝25subscript𝑃𝑠subscriptπ‘š1subscript𝑝1subscriptπ‘š2subscript𝑝2\displaystyle G(z_{1},z_{2},z_{3},z_{4},z_{5})=\sum\limits_{s,m_{1},p_{1},{m_{2}},p_{2}}z^{s}_{1}\ z^{m_{1}}_{2}\ z^{p_{1}}_{3}\ z^{m_{2}}_{4}\ z^{p_{2}}_{5}\ P_{s,m_{1},p_{1},{m_{2}},p_{2}} (24)

whose time evolution is described as

βˆ‚tG=subscript𝑑𝐺absent\displaystyle\partial_{t}G= rs​(z1βˆ’1)​G+Ξ³s​(1βˆ’z1)β€‹βˆ‚z1G+rm1​(z2βˆ’1)​G+Ξ³m1​(1βˆ’z2)β€‹βˆ‚z2G+rp1′​z1​z2​(z3βˆ’1)β€‹βˆ‚z1​z22G+Ξ³p1​(1βˆ’z3)β€‹βˆ‚z3Gsubscriptπ‘Ÿπ‘ subscript𝑧11𝐺subscript𝛾𝑠1subscript𝑧1subscriptsubscript𝑧1𝐺subscriptπ‘Ÿsubscriptπ‘š1subscript𝑧21𝐺subscript𝛾subscriptπ‘š11subscript𝑧2subscriptsubscript𝑧2𝐺superscriptsubscriptπ‘Ÿsubscript𝑝1β€²subscript𝑧1subscript𝑧2subscript𝑧31subscriptsuperscript2subscript𝑧1subscript𝑧2𝐺subscript𝛾subscript𝑝11subscript𝑧3subscriptsubscript𝑧3𝐺\displaystyle r_{s}(z_{1}-1)G+\gamma_{s}(1-z_{1})\partial_{z_{1}}G+r_{m_{1}}(z_{2}-1)G+\gamma_{m_{1}}(1-z_{2})\partial_{z_{2}}G+r_{p_{1}}^{\prime}z_{1}z_{2}(z_{3}-1)\partial^{2}_{z_{1}z_{2}}G+\gamma_{p_{1}}(1-z_{3})\partial_{z_{3}}G
+rm20​(z4βˆ’1)​G+rm21​z3​(z4βˆ’1)β€‹βˆ‚z3G+Ξ³m2​(1βˆ’z4)β€‹βˆ‚z4G+rp2′​z1​z4​(z5βˆ’1)β€‹βˆ‚z1​z42G+Ξ³p2​(1βˆ’z5)β€‹βˆ‚z5Gsuperscriptsubscriptπ‘Ÿsubscriptπ‘š20subscript𝑧41𝐺superscriptsubscriptπ‘Ÿsubscriptπ‘š21subscript𝑧3subscript𝑧41subscriptsubscript𝑧3𝐺subscript𝛾subscriptπ‘š21subscript𝑧4subscriptsubscript𝑧4𝐺superscriptsubscriptπ‘Ÿsubscript𝑝2β€²subscript𝑧1subscript𝑧4subscript𝑧51subscriptsuperscript2subscript𝑧1subscript𝑧4𝐺subscript𝛾subscript𝑝21subscript𝑧5subscriptsubscript𝑧5𝐺\displaystyle+\ r_{m_{2}}^{0}(z_{4}-1)G+r_{m_{2}}^{1}z_{3}(z_{4}-1)\partial_{z_{3}}G+\gamma_{m_{2}}(1-z_{4})\partial_{z_{4}}G+r_{p_{2}}^{\prime}z_{1}z_{4}(z_{5}-1)\partial^{2}_{z_{1}z_{4}}G+\gamma_{p_{2}}(1-z_{5})\partial_{z_{5}}G
+g1​(1βˆ’z1​z2)β€‹βˆ‚z1​z22G+g2​(1βˆ’z1​z4)β€‹βˆ‚z1​z42G+d1​z1​(1βˆ’z2)β€‹βˆ‚z1​z22G+d2​z1​(1βˆ’z4)β€‹βˆ‚z1​z42G,subscript𝑔11subscript𝑧1subscript𝑧2subscriptsuperscript2subscript𝑧1subscript𝑧2𝐺subscript𝑔21subscript𝑧1subscript𝑧4subscriptsuperscript2subscript𝑧1subscript𝑧4𝐺subscript𝑑1subscript𝑧11subscript𝑧2subscriptsuperscript2subscript𝑧1subscript𝑧2𝐺subscript𝑑2subscript𝑧11subscript𝑧4subscriptsuperscript2subscript𝑧1subscript𝑧4𝐺\displaystyle+g_{1}(1-z_{1}z_{2})\partial^{2}_{z_{1}z_{2}}G+g_{2}(1-z_{1}z_{4})\partial^{2}_{z_{1}z_{4}}G+d_{1}z_{1}(1-z_{2})\partial^{2}_{z_{1}z_{2}}G+d_{2}z_{1}(1-z_{4})\partial^{2}_{z_{1}z_{4}}G,

where βˆ‚ziG=βˆ‚βˆ‚zi​Gsubscriptsubscript𝑧𝑖𝐺subscript𝑧𝑖𝐺\partial_{z_{i}}G=\frac{\partial}{\partial z_{i}}G and βˆ‚zi​zj2G=βˆ‚2βˆ‚ziβ€‹βˆ‚zj​Gsubscriptsuperscript2subscript𝑧𝑖subscript𝑧𝑗𝐺superscript2subscript𝑧𝑖subscript𝑧𝑗𝐺\partial^{2}_{z_{i}z_{j}}G=\frac{\partial^{2}}{\partial z_{i}\partial z_{j}}G.

In the steady state (βˆ‚tG=0subscript𝑑𝐺0{\partial_{t}}G=0), the right hand side of equation (LABEL:diff-generating) is equated to zero. Various average quantities (moments) can be calculated by differentiating the resulting steady-state equation with respect to appropriate zisubscript𝑧𝑖z_{i} and then considering zi=1subscript𝑧𝑖1z_{i}=1 for all i𝑖i. The first moments follow from G𝐺G as G1=⟨s⟩subscript𝐺1delimited-βŸ¨βŸ©π‘ G_{1}=\langle s\rangle, G2=⟨m1⟩subscript𝐺2delimited-⟨⟩subscriptπ‘š1G_{2}=\langle m_{1}\rangle, G3=⟨p1⟩subscript𝐺3delimited-⟨⟩subscript𝑝1G_{3}=\langle p_{1}\rangle etc. where Gi=βˆ‚ziG∣{zi}=1subscript𝐺𝑖evaluated-atsubscriptsubscript𝑧𝑖𝐺subscript𝑧𝑖1G_{i}=\partial_{z_{i}}G\mid_{\{z_{i}\}=1} with {zi}=1subscript𝑧𝑖1\{z_{i}\}=1 indicating zi=1subscript𝑧𝑖1z_{i}=1 for all i𝑖i. The second moments similarly can be determined from Gi​jsubscript𝐺𝑖𝑗G_{ij} where Gi​j=βˆ‚zi​zj2G∣{zi}=1subscript𝐺𝑖𝑗evaluated-atsubscriptsuperscript2subscript𝑧𝑖subscript𝑧𝑗𝐺subscript𝑧𝑖1G_{ij}=\partial^{2}_{z_{i}z_{j}}G\mid_{\{z_{i}\}=1}. We are in particular interested in the target protein fluctuation which can be measured through the coefficient of variation, C​Vp2=(G55+G5βˆ’G52)1/2/G5𝐢subscript𝑉subscript𝑝2superscriptsubscript𝐺55subscript𝐺5superscriptsubscript𝐺5212subscript𝐺5CV_{p_{2}}=(G_{55}+G_{5}-G_{5}^{2})^{1/2}/G_{5}. The derivation of the moments G5subscript𝐺5G_{5} and G55subscript𝐺55G_{55} appears to be complex since the evaluation of a moment of a given order involves evaluation of various higher order moments. In order to simplify the derivation, we restrict ourselves up to second moments and express the third moments necessary for this derivation in terms of lower order moments using Gaussian approximation lafuerza . The results for moments up to second order and the approximate forms of the required third order moments are presented in appendix B.2.

Moments required for the evaluation of the coefficient of variation are found numerically using Mathematica. The coefficient of variation as a function of rm1subscriptπ‘Ÿsubscriptπ‘š1r_{m_{1}} for different values of, rssubscriptπ‘Ÿπ‘ r_{s}, the sRNA synthesis rate, is shown in figure 5. It is clear that the fluctuations in the target protein concentration are minimum over a range of rm1subscriptπ‘Ÿsubscriptπ‘š1r_{m_{1}}. Interestingly, this minimum region overlaps with the sensitive region shown in figure 2. As rssubscriptπ‘Ÿπ‘ r_{s} increases, the sensitive region extends towards larger rm1subscriptπ‘Ÿsubscriptπ‘š1r_{m_{1}}. Figure 5 shows that the minimum fluctuation region also changes accordingly and there is a systematic increase in the fluctuation beyond this region. In order to see the role of cross-talk in noise processing characteristics, we have also obtained the coefficient of variation for the target protein number for sFFL with Οƒ1=Οƒ2=0subscript𝜎1subscript𝜎20\sigma_{1}=\sigma_{2}=0 (no cross-talk) and sCN (see appendix B and C). The coefficients of variation plotted with rm1subscriptπ‘Ÿsubscriptπ‘š1r_{m_{1}} indicate the absence of optimal noise attenuation.

In order to verify the above observations, we obtain exact results for the coefficient of variation of the target protein number from stochastic simulations based on Gillespie algorithm gillespie ; gillespie1 . In simulations, we begin with an initial number of various molecular species. The key reactions in our simulation include synthesis, degradation, complex association/dissociation and transcriptional interactions between the DNA and the transcription factor. In stochastic simulations, an event or a reaction and the interval between two successive reactions are chosen probabilistically. Based on the reaction that takes place, at each simulation step, the number of molecular species is updated accordingly. We allow the system to evolve for 5Γ—1075superscript1075\times 10^{7} steps and record the target protein number after every 500500500 steps leaving about initial 2Γ—1052superscript1052\times 10^{5} steps. The coefficient of variation averaged over 100100100 samples has been presented in figure 5. A remarkable agreement between results from simulations and from generating function method further confirms that maximum noise attenuation in the target protein level happens over the sensitive region.

Our conclusions on how the target protein concentration as well as its fluctuations around the mean value change with rm1subscriptπ‘Ÿsubscriptπ‘š1r_{m_{1}} can be summarized through a single plot shown in figure 6. This plot clearly shows that the range of rm1subscriptπ‘Ÿsubscriptπ‘š1r_{m_{1}} over which the target protein concentration reaches its maximum also corresponds to the range of maximum noise attenuation in the target protein level. Thus it appears that sRNA-mediated cross-talk plays a subtle role in ensuring that maximal target protein synthesis happens with the least noise in the target protein level.

Refer to caption
Figure 6: Target protein concentration (dashed line) (normalized with respect to its peak value) and the coefficient of variation (solid line) plotted with rm1subscriptπ‘Ÿsubscriptπ‘š1r_{m_{1}}. The coefficient of variation is obtained from the analysis based on generating functions. The parameter values are same as those used for figure 5. For this figure rs=1subscriptπ‘Ÿπ‘ 1r_{s}=1.

III Discussion

Small noncoding RNAs in bacterial cells are major regulators driving a number of biological processes such as stress response, biofilm formation, quorum sensing etc. under different kinds of environmental signals. It is commonly found that one species of sRNA can regulate translation of several species of mRNAs and also a species of mRNA can be targeted by more than one species of sRNAs. The complex network formed thereby is believed to be able to integrate different types of environmental signals in a unified manner. The regulation here primarily happens through sharing of sRNAs by several co-regulated mRNA targets. If the concentration of one species of mRNA, say m1subscriptπ‘š1m_{1} increases, the sRNAs are expected to bind to m1subscriptπ‘š1m_{1} predominantly due to its increased concentration. This leads to an increase in sRNA-mRNA1 complex (c1subscript𝑐1c_{1}) concentration and consequently a lowering of available free sRNAs and an increase in the concentration of other mRNA targets. The sharing of sRNA thus provides a link between its target mRNAs leading to an sRNA mediated effective interaction (cross-talk) between the mRNAs. Mostly this link extends over mRNAs from different networks and the regulation through sRNA sharing may give rise to the possibility of integrating biological processes governed by different networks. In the present work, we are interested in understanding the effect of sRNA mediated cross-talk between two species of mRNAs in a network motif comprised of feed-forward loop driven by an sRNA. Thus unlike earlier work, our focus is on the effect of sRNA sharing on the target protein synthesis in a network motif.

In the feed-forward loop of our interest, the top-tier regulator is an sRNA (RprA) that regulates the target protein (RicI) synthesis along two pathways. While one pathway involves a direct translational activation of RicI protein by RprA, the other pathway involves an indirect activation of RicI expression via translational activation of its transcriptional activator (ΟƒssuperscriptπœŽπ‘ \sigma^{s}) by RprA. The sRNA thus translationally activates its two target mRNAs, RicI mRNA and ΟƒssuperscriptπœŽπ‘ \sigma^{s} mRNA. Such an sRNA-driven feed-forward loop(sFFL) is found to play a significant role in regulating horizontal gene transfer in Salmonella enterica when the bacteria is subjected to stress due to membrane damaging activities of a bactericidal agent, bile salt. Since horizontal gene transfer is an energy-expensive process, inhibiting such processes during stress conditions might be a preferred strategy for additional protection of the bacteria. RicI protein participates in the stress-response activity by interfering with pilus formation which is necessary for bacterial conjugation during the process of horizontal gene transfer.

The ΟƒssuperscriptπœŽπ‘ \sigma^{s} protein which is a transcriptional activator of RicI is known to be a key stress-response regulator that responds to various other environmental stress conditions too. The up-regulation of ΟƒssuperscriptπœŽπ‘ \sigma^{s} protein, however, does not necessarily imply an up-regulation of RicI protein. The design of sFFL ensures that RicI is up-regulated by combined action along both the paths of sFFL. The present analysis further shows that as a result of sRNA-mediated cross-talk, the network also performs most efficiently when the ΟƒssuperscriptπœŽπ‘ \sigma^{s} mRNA concentration is low. This result is concluded from the following observations. If the synthesis rate of ΟƒssuperscriptπœŽπ‘ \sigma^{s} mRNA is increased, the concentration of free sRNA decreases as a consequence of sRNA-mRNA1 complex formation. Due to reduced availability of free sRNA molecules for binding, the level of free m2subscriptπ‘š2m_{2} increases. This effect of cross-talk linking the two species of mRNAs is more abrupt over a narrow range of m1subscriptπ‘š1m_{1} synthesis rate which we refer as a sensitive region. In this region, a small increase in the synthesis rate gives rise to a sharp drop in the sRNA concentration along with a steep rise in the concentrations of the two mRNAs. As far as the target protein is concerned, it is found that with the increase in m1subscriptπ‘š1m_{1} synthesis rate, the target protein concentration reaches a maximum and then decreases sharply as a consequence of a sharp drop in free sRNA in the sensitive region. Although a large number of m2subscriptπ‘š2m_{2} are synthesized, the translation is less probable due to less availability of free sRNA molecules near the centre of the sensitive region. Such variation in the target protein concentration indicates that the motif performs most efficiently for low ΟƒssuperscriptπœŽπ‘ \sigma^{s} synthesis rate. Since ΟƒssuperscriptπœŽπ‘ \sigma^{s} is a major stress-response regulator associated with different kinds of environmental stress, such optimal utilization of ΟƒssuperscriptπœŽπ‘ \sigma^{s} mRNA might be a beneficial regulation strategy for the cell.

The gene expression is intrinsically noisy with noise originating from the randomness associated with various molecular interactions. This raises a fundamental question as to how cells perform in a robust manner despite significant variations in the gene expression levels. Recent evidences suggest that the architecture of the regulatory network determines the effect of gene expression noise on the target protein level, with some architecture leading to noise filtering, some leading to noise amplification etc. It is believed that the network motifs are evolutionarily selected based on the network architecture that may lead to such distinct noise processing characteristics. In view of this knowledge, we attempt to find the interplay of cross-talk and gene-expression noise in sFFL and its implications on fluctuations in the target protein level. To this end, we use a generating function based method to obtain the coefficient of variation in the target protein level. Plotting the coefficient of variation with ΟƒssuperscriptπœŽπ‘ \sigma^{s} mRNA synthesis rate, we find that the noise in the target protein level is minimized over the sensitive region. In particular, the range over which maximum noise buffering happens also coincides with the range over which maximum target protein synthesis can be achieved. These results are verified through stochastic simulations based on Gillespie algorithm. Thus, it appears that the network architecture not only leads to maximum target protein synthesis under limited ΟƒssuperscriptπœŽπ‘ \sigma^{s} mRNA concentration, it also leads to maximal noise buffering while synthesizing the target protein to its maximum level. All these features resulting primarily from the sRNA mediated cross-talk between mRNAs indicate a complex and precise level of gene regulation through sRNA.


Conflict of interest: Authors declare no conflict of interest.


Acknowledgment: ST and SM thank DBT, India for financial support through grant no. BT/PR16861/BRB/10/1475/2016. ST thanks University Grants Commission (UGC), India for financial support under CSIR-UCG NET-JRF.

APPENDIX

Appendix A sRNA-driven Cascade Network (sCN)

In this section, we consider the sRNA-driven cascade network (sCN) where sRNA translationally activates protein p1subscript𝑝1p_{1} which then transcriptionally activates protein p2subscript𝑝2p_{2} (see figure 7(b)). Thus, it is a cascade network where no sharing of free sRNA takes place. The variation in concentrations of various components of sCN with time is as follows,

s˙˙𝑠\displaystyle\dot{s} =rsβˆ’Ξ³s​sβˆ’k1+​s​m1+(k1βˆ’+ΞΊ1)​c1,absentsubscriptπ‘Ÿπ‘ subscript𝛾𝑠𝑠superscriptsubscriptπ‘˜1𝑠subscriptπ‘š1superscriptsubscriptπ‘˜1subscriptπœ…1subscript𝑐1\displaystyle=r_{s}-\gamma_{s}\,s-k_{1}^{+}\,s\,m_{1}+(k_{1}^{-}+\kappa_{1})c_{1}, (26)
mΛ™1subscriptΛ™π‘š1\displaystyle\dot{m}_{1} =rm1βˆ’Ξ³m1​m1βˆ’k1+​s​m1+k1βˆ’β€‹c1,absentsubscriptπ‘Ÿsubscriptπ‘š1subscript𝛾subscriptπ‘š1subscriptπ‘š1superscriptsubscriptπ‘˜1𝑠subscriptπ‘š1superscriptsubscriptπ‘˜1subscript𝑐1\displaystyle=r_{m_{1}}-\gamma_{m_{1}}\,m_{1}-k_{1}^{+}\,s\,m_{1}+k_{1}^{-}\,c_{1}, (27)
cΛ™1subscript˙𝑐1\displaystyle\dot{c}_{1} =k1+​m1​sβˆ’(k1βˆ’+Οƒ1+ΞΊ1)​c1,absentsuperscriptsubscriptπ‘˜1subscriptπ‘š1𝑠superscriptsubscriptπ‘˜1subscript𝜎1subscriptπœ…1subscript𝑐1\displaystyle=k_{1}^{+}\,m_{1}\,s-(k_{1}^{-}+\sigma_{1}+\kappa_{1})c_{1}, (28)
pΛ™1subscript˙𝑝1\displaystyle\dot{p}_{1} =rp1​c1βˆ’Ξ³p1​p1,absentsubscriptπ‘Ÿsubscript𝑝1subscript𝑐1subscript𝛾subscript𝑝1subscript𝑝1\displaystyle=r_{p_{1}}\,c_{1}-\gamma_{p_{1}}\,p_{1}, (29)
mΛ™2subscriptΛ™π‘š2\displaystyle\dot{m}_{2} =rm2​kc​p11+kc​p1βˆ’Ξ³m2​m2,andabsentsubscriptπ‘Ÿsubscriptπ‘š2subscriptπ‘˜π‘subscript𝑝11subscriptπ‘˜π‘subscript𝑝1subscript𝛾subscriptπ‘š2subscriptπ‘š2and\displaystyle=\frac{r_{m_{2}}\,{k_{c}}\,p_{1}}{1+k_{c}\,p_{1}}-\gamma_{m_{2}}\,m_{2},\ \ {\rm and} (30)
pΛ™2subscript˙𝑝2\displaystyle\dot{p}_{2} =rp2​m2βˆ’Ξ³p2​p2.absentsubscriptπ‘Ÿsubscript𝑝2subscriptπ‘š2subscript𝛾subscript𝑝2subscript𝑝2\displaystyle=r_{p_{2}}\,m_{2}-\gamma_{p_{2}}\,p_{2}. (31)
Refer to caption
Figure 7: Schematic diagrams for (a) sFFL and (b) sCN

The steady-state concentrations of mRNAs m1subscriptπ‘š1m_{1} and m2subscriptπ‘š2m_{2} in terms of functions F1​(s)subscript𝐹1𝑠F_{1}(s) and F2​(s)subscript𝐹2𝑠F_{2}(s) are

m1subscriptπ‘š1\displaystyle m_{1} =\displaystyle= m1βˆ—β€‹F1​(s),superscriptsubscriptπ‘š1subscript𝐹1𝑠\displaystyle m_{1}^{*}\,F_{1}(s), (32)
m2subscriptπ‘š2\displaystyle m_{2} =\displaystyle= m2βˆ—β€‹kc​a​s​F1​(s)1+kc​a​s​F1​(s)wheresuperscriptsubscriptπ‘š2subscriptπ‘˜π‘π‘Žπ‘ subscript𝐹1𝑠1subscriptπ‘˜π‘π‘Žπ‘ subscript𝐹1𝑠where\displaystyle\frac{m_{2}^{*}\,k_{c}\,a\,s\,F_{1}(s)}{1+k_{c}\,a\,s\,F_{1}(s)}\ \ {\rm where} (33)

m1βˆ—=rm1Ξ³m1,m2βˆ—=rm2Ξ³m2,a=rp1​k1+​m1βˆ—Ξ³p1​(k1βˆ’+Οƒ1+ΞΊ1),formulae-sequencesuperscriptsubscriptπ‘š1subscriptπ‘Ÿsubscriptπ‘š1subscript𝛾subscriptπ‘š1formulae-sequencesuperscriptsubscriptπ‘š2subscriptπ‘Ÿsubscriptπ‘š2subscript𝛾subscriptπ‘š2π‘Žsubscriptπ‘Ÿsubscript𝑝1superscriptsubscriptπ‘˜1superscriptsubscriptπ‘š1subscript𝛾subscript𝑝1superscriptsubscriptπ‘˜1subscript𝜎1subscriptπœ…1m_{1}^{*}=\frac{r_{m_{1}}}{\gamma_{m_{1}}},\quad m_{2}^{*}=\frac{r_{m_{2}}}{\gamma_{m_{2}}},\ \ \quad a=\frac{r_{p_{1}}\,k_{1}^{+}\,m_{1}^{*}}{\gamma_{p_{1}}(k_{1}^{-}+\sigma_{1}+\kappa_{1})}, F1​(s)=11+s/s01subscript𝐹1𝑠11𝑠subscript𝑠01F_{1}(s)=\frac{1}{1+s/s_{01}} and s01=Ξ³m1k1+​k1βˆ’+Οƒ1+ΞΊ1Οƒ1+ΞΊ1subscript𝑠01subscript𝛾subscriptπ‘š1superscriptsubscriptπ‘˜1superscriptsubscriptπ‘˜1subscript𝜎1subscriptπœ…1subscript𝜎1subscriptπœ…1s_{01}=\frac{\gamma_{m_{1}}}{k_{1}^{+}}\frac{k_{1}^{-}+\sigma_{1}+\kappa_{1}}{\sigma_{1}+\kappa_{1}}. In the steady-state, the concentration of sRNA, can be found by solving rsβˆ’Ξ³s​sβˆ’rm1​΢1​s​F1​(s)=0subscriptπ‘Ÿπ‘ subscript𝛾𝑠𝑠subscriptπ‘Ÿsubscriptπ‘š1subscript𝜁1𝑠subscript𝐹1𝑠0r_{s}-\gamma_{s}\,s-r_{m_{1}}\,\zeta_{1}\,s\,F_{1}(s)=0, where ΞΆ1=k1+​σ1Ξ³m1​(k1βˆ’+Οƒ1+ΞΊ1)subscript𝜁1superscriptsubscriptπ‘˜1subscript𝜎1subscript𝛾subscriptπ‘š1superscriptsubscriptπ‘˜1subscript𝜎1subscriptπœ…1\zeta_{1}=\frac{k_{1}^{+}\sigma_{1}}{\gamma_{m_{1}}(k_{1}^{-}+\sigma_{1}+\kappa_{1})}. The target protein concentration for sCN is p2=rp2Ξ³p2​m2subscript𝑝2subscriptπ‘Ÿsubscript𝑝2subscript𝛾subscript𝑝2subscriptπ‘š2p_{2}=\frac{r_{p_{2}}}{\gamma_{p_{2}}}m_{2} where m2subscriptπ‘š2m_{2} is as shown in equation (33).

Appendix B Noise analysis for sFFL

B.1 Equations and notations

The reactions incorporated into the master equation, equation (LABEL:mastereqn), are based on the following effective equations.

sΛ™=rsβˆ’Ξ³s​sβˆ’g1​s​m1βˆ’g2​s​m2,˙𝑠subscriptπ‘Ÿπ‘ subscript𝛾𝑠𝑠subscript𝑔1𝑠subscriptπ‘š1subscript𝑔2𝑠subscriptπ‘š2\displaystyle\dot{s}=r_{s}-\gamma_{s}\,s-g_{1}\,s\,m_{1}-g_{2}\,s\,m_{2}, (34)
m1Λ™=rm1βˆ’Ξ³m1​m1βˆ’d1​s​m1βˆ’g1​s​m1,Λ™subscriptπ‘š1subscriptπ‘Ÿsubscriptπ‘š1subscript𝛾subscriptπ‘š1subscriptπ‘š1subscript𝑑1𝑠subscriptπ‘š1subscript𝑔1𝑠subscriptπ‘š1\displaystyle\dot{m_{1}}=r_{m_{1}}-\gamma_{m_{1}}\,m_{1}-d_{1}\,s\,m_{1}-g_{1}\,s\,m_{1}, (35)
p1Λ™=rp1′​s​m1βˆ’Ξ³p1​p1,Λ™subscript𝑝1superscriptsubscriptπ‘Ÿsubscript𝑝1′𝑠subscriptπ‘š1subscript𝛾subscript𝑝1subscript𝑝1\displaystyle\dot{p_{1}}=r_{p_{1}}^{\prime}s\,m_{1}-\gamma_{p_{1}}\,p_{1}, (36)
m2Λ™=rm2​kc​p11+kc​p1βˆ’Ξ³m2​m2βˆ’d2​s​m2βˆ’g2​s​m2,Λ™subscriptπ‘š2subscriptπ‘Ÿsubscriptπ‘š2subscriptπ‘˜π‘subscript𝑝11subscriptπ‘˜π‘subscript𝑝1subscript𝛾subscriptπ‘š2subscriptπ‘š2subscript𝑑2𝑠subscriptπ‘š2subscript𝑔2𝑠subscriptπ‘š2\displaystyle\dot{m_{2}}=\frac{r_{m_{2}}\,k_{c}\,p_{1}}{1+k_{c}\,p_{1}}-\gamma_{m_{2}}m_{2}-d_{2}\,s\,m_{2}-g_{2}\,s\,m_{2}, (37)
andp2Λ™=rp2′​s​m2βˆ’Ξ³p2​p2.andΛ™subscript𝑝2superscriptsubscriptπ‘Ÿsubscript𝑝2′𝑠subscriptπ‘š2subscript𝛾subscript𝑝2subscript𝑝2\displaystyle{\rm and}\ \ \ \dot{p_{2}}=r_{p_{2}}^{\prime}s\,m_{2}-\gamma_{p_{2}}\,p_{2}. (38)

These equations are derived from (2)-(7) by substituting c1=k1+​s​m1k1βˆ’+Οƒ1+ΞΊ1subscript𝑐1superscriptsubscriptπ‘˜1𝑠subscriptπ‘š1superscriptsubscriptπ‘˜1subscript𝜎1subscriptπœ…1c_{1}=\frac{k_{1}^{+}\,s\,m_{1}}{k_{1}^{-}+\sigma_{1}+\kappa_{1}} and c2=k2+​s​m1k2βˆ’+Οƒ2+ΞΊ2subscript𝑐2superscriptsubscriptπ‘˜2𝑠subscriptπ‘š1superscriptsubscriptπ‘˜2subscript𝜎2subscriptπœ…2c_{2}=\frac{k_{2}^{+}\,s\,m_{1}}{k_{2}^{-}+\sigma_{2}+\kappa_{2}}. While g1=k1+​σ1k1βˆ’+Οƒ1+ΞΊ1andg2=k2+​σ2k2βˆ’+Οƒ2+ΞΊ2formulae-sequencesubscript𝑔1superscriptsubscriptπ‘˜1subscript𝜎1superscriptsubscriptπ‘˜1subscript𝜎1subscriptπœ…1andsubscript𝑔2superscriptsubscriptπ‘˜2subscript𝜎2superscriptsubscriptπ‘˜2subscript𝜎2subscriptπœ…2g_{1}=\frac{k_{1}^{+}\,\sigma_{1}}{k_{1}^{-}+\sigma_{1}+\kappa_{1}}\qquad{\rm and}\qquad g_{2}=\frac{k_{2}^{+}\,\sigma_{2}}{k_{2}^{-}+\sigma_{2}+\kappa_{2}} correspond to combined degradation of sRNA and mRNA, d1=k1+​κ1k1βˆ’+Οƒ1+ΞΊ1andd2=k2+​κ2k2βˆ’+Οƒ2+ΞΊ2formulae-sequencesubscript𝑑1superscriptsubscriptπ‘˜1subscriptπœ…1superscriptsubscriptπ‘˜1subscript𝜎1subscriptπœ…1andsubscript𝑑2superscriptsubscriptπ‘˜2subscriptπœ…2superscriptsubscriptπ‘˜2subscript𝜎2subscriptπœ…2d_{1}=\frac{k_{1}^{+}\,\kappa_{1}}{k_{1}^{-}+\sigma_{1}+\kappa_{1}}\qquad{\rm and}\qquad d_{2}=\frac{k_{2}^{+}\,\kappa_{2}}{k_{2}^{-}+\sigma_{2}+\kappa_{2}} indicate degradation of mRNA alone while sRNAs are recycled back. Further, here rp1β€²=rp1​k1+k1βˆ’+Οƒ1+ΞΊ1andrp2β€²=rp2​k2+k2βˆ’+Οƒ2+ΞΊ2formulae-sequencesuperscriptsubscriptπ‘Ÿsubscript𝑝1β€²subscriptπ‘Ÿsubscript𝑝1superscriptsubscriptπ‘˜1superscriptsubscriptπ‘˜1subscript𝜎1subscriptπœ…1andsuperscriptsubscriptπ‘Ÿsubscript𝑝2β€²subscriptπ‘Ÿsubscript𝑝2superscriptsubscriptπ‘˜2superscriptsubscriptπ‘˜2subscript𝜎2subscriptπœ…2r_{p_{1}}^{\prime}=\frac{r_{p_{1}}k_{1}^{+}}{k_{1}^{-}+\sigma_{1}+\kappa_{1}}\qquad{\rm and}\qquad r_{p_{2}}^{\prime}=\frac{r_{p_{2}}k_{2}^{+}}{k_{2}^{-}+\sigma_{2}+\kappa_{2}}.

B.2 Moments

In this section, we list the results for first and second order moments obtained from the generating function approach. The results show that moments of a given order involve higher order moments. In order to simplify our calculations, we consider moments up to second order and express the third order moments in terms of lower order moments using Gaussian approximation.

G1=rsβˆ’g1​G12βˆ’g2​G14Ξ³ssubscript𝐺1subscriptπ‘Ÿπ‘ subscript𝑔1subscript𝐺12subscript𝑔2subscript𝐺14subscript𝛾𝑠\displaystyle G_{1}=\frac{r_{s}-g_{1}\,G_{12}-g_{2}\,G_{14}}{\gamma_{s}} (39)
G2=rm1βˆ’(g1+d1)​G12Ξ³m1subscript𝐺2subscriptπ‘Ÿsubscriptπ‘š1subscript𝑔1subscript𝑑1subscript𝐺12subscript𝛾subscriptπ‘š1\displaystyle G_{2}=\frac{r_{m_{1}}-(g_{1}+d_{1})G_{12}}{\gamma_{m_{1}}} (40)
G3=rp1′​G12Ξ³p1subscript𝐺3superscriptsubscriptπ‘Ÿsubscript𝑝1β€²subscript𝐺12subscript𝛾subscript𝑝1\displaystyle G_{3}=\frac{r_{p_{1}}^{\prime}G_{12}}{\gamma_{p_{1}}} (41)
G4=rm20+rm21​G3βˆ’(g2+d2)​G14Ξ³m2subscript𝐺4superscriptsubscriptπ‘Ÿsubscriptπ‘š20superscriptsubscriptπ‘Ÿsubscriptπ‘š21subscript𝐺3subscript𝑔2subscript𝑑2subscript𝐺14subscript𝛾subscriptπ‘š2\displaystyle G_{4}=\frac{r_{m_{2}}^{0}+r_{m_{2}}^{1}\,G_{3}-(g_{2}+d_{2})G_{14}}{\gamma_{m_{2}}} (42)
G5=rp2′​G14Ξ³p2subscript𝐺5superscriptsubscriptπ‘Ÿsubscript𝑝2β€²subscript𝐺14subscript𝛾subscript𝑝2\displaystyle G_{5}=\frac{r_{p_{2}}^{\prime}G_{14}}{\gamma_{p_{2}}} (43)
G11=rs​G1βˆ’g1​G112βˆ’g2​G114Ξ³ssubscript𝐺11subscriptπ‘Ÿπ‘ subscript𝐺1subscript𝑔1subscript𝐺112subscript𝑔2subscript𝐺114subscript𝛾𝑠\displaystyle G_{11}=\frac{r_{s}\,G_{1}-g_{1}\,G_{112}-g_{2}\,G_{114}}{\gamma_{s}} (44)
G22=rm1​G2βˆ’(g1+d1)​G122Ξ³m1subscript𝐺22subscriptπ‘Ÿsubscriptπ‘š1subscript𝐺2subscript𝑔1subscript𝑑1subscript𝐺122subscript𝛾subscriptπ‘š1\displaystyle G_{22}=\frac{r_{m_{1}}G_{2}-(g_{1}+d_{1})G_{122}}{\gamma_{m_{1}}} (45)
G33=rp1′​G123Ξ³p1subscript𝐺33superscriptsubscriptπ‘Ÿsubscript𝑝1β€²subscript𝐺123subscript𝛾subscript𝑝1\displaystyle G_{33}=\frac{r_{p_{1}}^{\prime}G_{123}}{\gamma_{p_{1}}} (46)
G44=rm20​G4+rm21​G34βˆ’(g2+d2)​G144Ξ³m2subscript𝐺44superscriptsubscriptπ‘Ÿsubscriptπ‘š20subscript𝐺4superscriptsubscriptπ‘Ÿsubscriptπ‘š21subscript𝐺34subscript𝑔2subscript𝑑2subscript𝐺144subscript𝛾subscriptπ‘š2\displaystyle G_{44}=\frac{r_{m_{2}}^{0}G_{4}+r_{m_{2}}^{1}G_{34}-(g_{2}+d_{2})G_{144}}{\gamma_{m_{2}}} (47)
G55=rp2′​G145Ξ³p2subscript𝐺55superscriptsubscriptπ‘Ÿsubscript𝑝2β€²subscript𝐺145subscript𝛾subscript𝑝2\displaystyle G_{55}=\frac{r_{p_{2}}^{\prime}G_{145}}{\gamma_{p_{2}}} (48)
(49)
(50)
(51)
(52)
(53)
(54)
(55)
(56)
(57)

Using Gaussian approximation, we express the third order moments in terms of the lower order moments as shown below.

G112=G11​G2+G1​G2+2​G1​G12βˆ’2​G12​G2βˆ’G12subscript𝐺112subscript𝐺11subscript𝐺2subscript𝐺1subscript𝐺22subscript𝐺1subscript𝐺122superscriptsubscript𝐺12subscript𝐺2subscript𝐺12\displaystyle G_{112}=G_{11}G_{2}+G_{1}G_{2}+2G_{1}G_{12}-2G_{1}^{2}G_{2}-G_{12} (58)
G113=G11​G3+G1​G3+2​G1​G13βˆ’2​G12​G3βˆ’G13subscript𝐺113subscript𝐺11subscript𝐺3subscript𝐺1subscript𝐺32subscript𝐺1subscript𝐺132superscriptsubscript𝐺12subscript𝐺3subscript𝐺13\displaystyle G_{113}=G_{11}G_{3}+G_{1}G_{3}+2G_{1}G_{13}-2G_{1}^{2}G_{3}-G_{13} (59)
G114=G11​G4+G1​G4+2​G1​G14βˆ’2​G12​G4βˆ’G14subscript𝐺114subscript𝐺11subscript𝐺4subscript𝐺1subscript𝐺42subscript𝐺1subscript𝐺142superscriptsubscript𝐺12subscript𝐺4subscript𝐺14\displaystyle G_{114}=G_{11}G_{4}+G_{1}G_{4}+2G_{1}G_{14}-2G_{1}^{2}G_{4}-G_{14} (60)
G122=G22​G1+G1​G2+2​G2​G12βˆ’2​G22​G1βˆ’G12subscript𝐺122subscript𝐺22subscript𝐺1subscript𝐺1subscript𝐺22subscript𝐺2subscript𝐺122superscriptsubscript𝐺22subscript𝐺1subscript𝐺12\displaystyle G_{122}=G_{22}G_{1}+G_{1}G_{2}+2G_{2}G_{12}-2G_{2}^{2}G_{1}-G_{12} (61)
G123=G12​G3+G13​G2+G23​G1βˆ’2​G1​G2​G3subscript𝐺123subscript𝐺12subscript𝐺3subscript𝐺13subscript𝐺2subscript𝐺23subscript𝐺12subscript𝐺1subscript𝐺2subscript𝐺3\displaystyle G_{123}=G_{12}G_{3}+G_{13}G_{2}+G_{23}G_{1}-2G_{1}G_{2}G_{3} (62)
G124=G12​G4+G14​G2+G24​G1βˆ’2​G1​G2​G4subscript𝐺124subscript𝐺12subscript𝐺4subscript𝐺14subscript𝐺2subscript𝐺24subscript𝐺12subscript𝐺1subscript𝐺2subscript𝐺4\displaystyle G_{124}=G_{12}G_{4}+G_{14}G_{2}+G_{24}G_{1}-2G_{1}G_{2}G_{4} (63)
G125=G12​G5+G15​G2+G25​G1βˆ’2​G1​G2​G5subscript𝐺125subscript𝐺12subscript𝐺5subscript𝐺15subscript𝐺2subscript𝐺25subscript𝐺12subscript𝐺1subscript𝐺2subscript𝐺5\displaystyle G_{125}=G_{12}G_{5}+G_{15}G_{2}+G_{25}G_{1}-2G_{1}G_{2}G_{5} (64)
G133=G33​G1+G1​G3+2​G3​G13βˆ’2​G32​G1βˆ’G13subscript𝐺133subscript𝐺33subscript𝐺1subscript𝐺1subscript𝐺32subscript𝐺3subscript𝐺132superscriptsubscript𝐺32subscript𝐺1subscript𝐺13\displaystyle G_{133}=G_{33}G_{1}+G_{1}G_{3}+2G_{3}G_{13}-2G_{3}^{2}G_{1}-G_{13} (65)
G134=G13​G4+G14​G3+G34​G1βˆ’2​G1​G3​G4subscript𝐺134subscript𝐺13subscript𝐺4subscript𝐺14subscript𝐺3subscript𝐺34subscript𝐺12subscript𝐺1subscript𝐺3subscript𝐺4\displaystyle G_{134}=G_{13}G_{4}+G_{14}G_{3}+G_{34}G_{1}-2G_{1}G_{3}G_{4} (66)
G135=G13​G5+G15​G3+G35​G1βˆ’2​G1​G3​G5subscript𝐺135subscript𝐺13subscript𝐺5subscript𝐺15subscript𝐺3subscript𝐺35subscript𝐺12subscript𝐺1subscript𝐺3subscript𝐺5\displaystyle G_{135}=G_{13}G_{5}+G_{15}G_{3}+G_{35}G_{1}-2G_{1}G_{3}G_{5} (67)
G144=G44​G1+G1​G4+2​G4​G14βˆ’2​G42​G1βˆ’G14subscript𝐺144subscript𝐺44subscript𝐺1subscript𝐺1subscript𝐺42subscript𝐺4subscript𝐺142superscriptsubscript𝐺42subscript𝐺1subscript𝐺14\displaystyle G_{144}=G_{44}G_{1}+G_{1}G_{4}+2G_{4}G_{14}-2G_{4}^{2}G_{1}-G_{14} (68)
G145=G14​G5+G15​G4+G45​G1βˆ’2​G1​G4​G5subscript𝐺145subscript𝐺14subscript𝐺5subscript𝐺15subscript𝐺4subscript𝐺45subscript𝐺12subscript𝐺1subscript𝐺4subscript𝐺5\displaystyle G_{145}=G_{14}G_{5}+G_{15}G_{4}+G_{45}G_{1}-2G_{1}G_{4}G_{5} (69)

In order to see the effect of cross-talk, we have plotted the coefficient of variation for the target protein with rm1subscriptπ‘Ÿsubscriptπ‘š1r_{m_{1}} in the main text. In the absence of cross-talk (i.e. for Οƒ1=Οƒ2=0subscript𝜎1subscript𝜎20\sigma_{1}=\sigma_{2}=0), the coefficient of variation is significantly different showing no indication of optimal noise attenuation (see figure 8).

Refer to caption
Figure 8: Coefficient of variation for the target protein in the case of sFFL with Οƒ1=Οƒ2=0subscript𝜎1subscript𝜎20\sigma_{1}=\sigma_{2}=0. rm1subscriptπ‘Ÿsubscriptπ‘š1r_{m_{1}} represents m1subscriptπ‘š1m_{1} synthesis rate. Here rs=1subscriptπ‘Ÿπ‘ 1r_{s}=1 and the other parameter values are same as those in figure 5.

Appendix C Noise analysis for sCN

In the case of sCN, we follow the same master equation approach as done for sFFL. The master equation for the probability of a given state is based on the following effective differential equations

sΛ™=rsβˆ’Ξ³s​sβˆ’g1​s​m1,˙𝑠subscriptπ‘Ÿπ‘ subscript𝛾𝑠𝑠subscript𝑔1𝑠subscriptπ‘š1\displaystyle\dot{s}=r_{s}-\gamma_{s}\,s-g_{1}\,s\,m_{1}, (70)
m1Λ™=rm1βˆ’Ξ³m1​m1βˆ’d1​s​m1βˆ’g1​s​m1,Λ™subscriptπ‘š1subscriptπ‘Ÿsubscriptπ‘š1subscript𝛾subscriptπ‘š1subscriptπ‘š1subscript𝑑1𝑠subscriptπ‘š1subscript𝑔1𝑠subscriptπ‘š1\displaystyle\dot{m_{1}}=r_{m_{1}}-\gamma_{m_{1}}\,m_{1}-d_{1}\,s\,m_{1}-g_{1}\,s\,m_{1}, (71)
p1Λ™=rp1′​s​m1βˆ’Ξ³p1​p1,Λ™subscript𝑝1superscriptsubscriptπ‘Ÿsubscript𝑝1′𝑠subscriptπ‘š1subscript𝛾subscript𝑝1subscript𝑝1\displaystyle\dot{p_{1}}=r_{p_{1}}^{\prime}s\,m_{1}-\gamma_{p_{1}}\,p_{1}, (72)
m2Λ™=rm2​kc​p11+kc​p1βˆ’Ξ³m2​m2,Λ™subscriptπ‘š2subscriptπ‘Ÿsubscriptπ‘š2subscriptπ‘˜π‘subscript𝑝11subscriptπ‘˜π‘subscript𝑝1subscript𝛾subscriptπ‘š2subscriptπ‘š2\displaystyle\dot{m_{2}}=\frac{r_{m_{2}}\,k_{c}\,p_{1}}{1+k_{c}\,p_{1}}-\gamma_{m_{2}}\,m_{2}, (73)
p2Λ™=rp2​m2βˆ’Ξ³p2​p2.Λ™subscript𝑝2subscriptπ‘Ÿsubscript𝑝2subscriptπ‘š2subscript𝛾subscript𝑝2subscript𝑝2\displaystyle\dot{p_{2}}=r_{p_{2}}\,m_{2}-\gamma_{p_{2}}\,p_{2}. (74)
Refer to caption
Figure 9: Coefficient of variation for the target protein plotted with rm1subscriptπ‘Ÿsubscriptπ‘š1r_{m_{1}} in sCN. Here rs=1subscriptπ‘Ÿπ‘ 1r_{s}=1 and all other parameter values are same as those in figure 5. Further, in the case of sCN, k2+=k2βˆ’=Οƒ2=ΞΊ2=0superscriptsubscriptπ‘˜2superscriptsubscriptπ‘˜2subscript𝜎2subscriptπœ…20k_{2}^{+}=k_{2}^{-}=\sigma_{2}=\kappa_{2}=0.

In figure 9, we plot the coefficient of variation C​Vp2=(G55+G5βˆ’G52)1/2/G5𝐢subscript𝑉subscript𝑝2superscriptsubscript𝐺55subscript𝐺5superscriptsubscript𝐺5212subscript𝐺5CV_{p_{2}}=(G_{55}+G_{5}-G_{5}^{2})^{1/2}/G_{5} with rm1subscriptπ‘Ÿsubscriptπ‘š1r_{m_{1}}. No minimum in the coefficient of variation is found in this case. Here rs=1subscriptπ‘Ÿπ‘ 1r_{s}=1 and all other parameter values are same as those in figure 5.

In the following, we present first and second moments necessary for obtaining the coefficient of variation for the sRNA-driven cascade network. As before, we use Gaussian approximation to express the third moments in terms of various first and second moments.

G1=rsβˆ’g1​G12Ξ³ssubscript𝐺1subscriptπ‘Ÿπ‘ subscript𝑔1subscript𝐺12subscript𝛾𝑠\displaystyle G_{1}=\frac{r_{s}-g_{1}\,G_{12}}{\gamma_{s}} (75)
G2=rm1βˆ’(g1+d1)​G12Ξ³m1subscript𝐺2subscriptπ‘Ÿsubscriptπ‘š1subscript𝑔1subscript𝑑1subscript𝐺12subscript𝛾subscriptπ‘š1\displaystyle G_{2}=\frac{r_{m_{1}}-(g_{1}+d_{1})G_{12}}{\gamma_{m_{1}}} (76)
G3=rp1′​G12Ξ³p1subscript𝐺3superscriptsubscriptπ‘Ÿsubscript𝑝1β€²subscript𝐺12subscript𝛾subscript𝑝1\displaystyle G_{3}=\frac{r_{p_{1}}^{\prime}G_{12}}{\gamma_{p_{1}}} (77)
G4=rm20+rm21​G3Ξ³m2subscript𝐺4superscriptsubscriptπ‘Ÿsubscriptπ‘š20superscriptsubscriptπ‘Ÿsubscriptπ‘š21subscript𝐺3subscript𝛾subscriptπ‘š2\displaystyle G_{4}=\frac{r_{m_{2}}^{0}+r_{m_{2}}^{1}\,G_{3}}{\gamma_{m_{2}}} (78)
G5=rp2​G4Ξ³p2subscript𝐺5subscriptπ‘Ÿsubscript𝑝2subscript𝐺4subscript𝛾subscript𝑝2\displaystyle G_{5}=\frac{r_{p_{2}}G_{4}}{\gamma_{p_{2}}} (79)
G11=rs​G1βˆ’g1​G112Ξ³ssubscript𝐺11subscriptπ‘Ÿπ‘ subscript𝐺1subscript𝑔1subscript𝐺112subscript𝛾𝑠\displaystyle G_{11}=\frac{r_{s}\,G_{1}-g_{1}\,G_{112}}{\gamma_{s}} (80)
G22=rm1​G2βˆ’(g1+d1)​G122Ξ³m1subscript𝐺22subscriptπ‘Ÿsubscriptπ‘š1subscript𝐺2subscript𝑔1subscript𝑑1subscript𝐺122subscript𝛾subscriptπ‘š1\displaystyle G_{22}=\frac{r_{m_{1}}G_{2}-(g_{1}+d_{1})G_{122}}{\gamma_{m_{1}}} (81)
G33=rp1′​G123Ξ³p1subscript𝐺33superscriptsubscriptπ‘Ÿsubscript𝑝1β€²subscript𝐺123subscript𝛾subscript𝑝1\displaystyle G_{33}=\frac{r_{p_{1}}^{\prime}G_{123}}{\gamma_{p_{1}}} (82)
G44=rm20​G4+rm21​G34Ξ³m2subscript𝐺44superscriptsubscriptπ‘Ÿsubscriptπ‘š20subscript𝐺4superscriptsubscriptπ‘Ÿsubscriptπ‘š21subscript𝐺34subscript𝛾subscriptπ‘š2\displaystyle G_{44}=\frac{r_{m_{2}}^{0}G_{4}+r_{m_{2}}^{1}G_{34}}{\gamma_{m_{2}}} (83)
G55=rp2​G45Ξ³p2subscript𝐺55subscriptπ‘Ÿsubscript𝑝2subscript𝐺45subscript𝛾subscript𝑝2\displaystyle G_{55}=\frac{r_{p_{2}}G_{45}}{\gamma_{p_{2}}} (84)
(85)
(86)
(87)
(88)
(89)
(90)
(91)
(92)
(93)
(94)

Appendix D Stochastic simulations

The reactions considered for the stochastic simulations and the corresponding rates are listed below.

(96)
(97)
(98)
(99)
(100)
(101)
(102)
(103)
(104)
(105)
(106)
(107)
(108)
(109)

References

  • (1) Storz G, Altuvia S and Wassarman K M 2005 An abundance of RNA regulators Annu. Rev. Biochem. 74 199-217 (DOI: 10.1146/annurev.biochem.74.082803.133136)
  • (2) Gottesman S 2005 Micros for microbes: non-coding regulatory RNAs in bacteria Trends Genet. 21 399-404 (DOI: 10.1016/j.tig.2005.05.008)
  • (3) Frohlich K S and Papenfort K 2016 Interplay of regulatory RNAs and mobile genetic elements in enteric pathogens Mol. Microbiol. 101 701-13 (DOI: 10.1111/mmi.13428)
  • (4) Soper T, Mandin P, Majdalani N, Gottesman S and Woodson S A 2010 Positive regulation by small RNAs and the role of Hfq Proc. Natl. Acad. Sci. USA 107 9602-07 (DOI: 10.1073/pnas.1004435107)
  • (5) Levine E, Zhang Z, Kuhlman T and Hwa T 2007 Quantitative characteristics of gene regulation by small RNA PLoS Biol. 5 e229 (DOI: 10.1371/journal.pbio.0050229)
  • (6) Pal M, Ghosh S and Bose I 2016 Functional characteristics of gene expression motifs with single and dual strategies of regulation Biomed. Phys. Eng. Express 2 025009 (DOI: 10.1088/2057-1976/2/2/025009)
  • (7) Raj A and van Oudenaarden A 2008 Nature, nurture, or chance: Stochastic gene expression and its consequences Cell 135 216-26 (DOI: 10.1016/j.cell.2008.09.050)
  • (8) Chalancon G, Ravarani C N J, Balaji S, Martinez-Arias A, Aravind L, Jothi R and Babu M M 2012 Interplay between gene expression noise and regulatory network architecture Trends Genet. 28 221-32 (DOI: 10.1016/j.tig.2012.01.006)
  • (9) Shimoni Y, Friedlander G, Hetzroni G, Niv G, Altuvia S, Biham O and Margalit H 2007 Regulation of gene expression by small non-coding RNAs: a quantitative view Mol. Syst. Biol. 3 1-9 (DOI: 10.1038/msb4100181)
  • (10) Osella M, Bosia C, Cora D and Caselle M 2011 The role of incoherent microRNA-mediated feed-forward loops in noise buffering PLoS Comput. Biol. 7 e1001101 (DOI: 10.1371/journal.pcbi.1001101)
  • (11) Tej S, Gaurav K and Mukherji S 2019 Small RNA driven feed-forward loop: critical role of sRNA in noise filtering Phys. Biol. 16 1-16 (DOI : 10.1088/1478-3975/ab1563)
  • (12) Bosia C, Pagnani A and Zecchina R 2013 Modelling competing endogenous RNA networks PLoS One 8 e66609 1-12 (DOI: 10.1371/journal.pone.0066609)
  • (13) Figliiuzzi M, Marinari E and De Martino A 2013 MicroRNAs as selective channel of communication between competing RNAs: steady state theory Biophys. J. 104 1203-13 (DOI: 10.1016/j.bpj.2013.01.012.)
  • (14) Bossi L and Figueroa-Bossi N 2016 Competimg endogenous RNAs: a target-centric view of small RNA regulation in bacteria Nat. Rev. Microbiol. 14 775-84 (DOI: 10.1038/nrmicro.2016.129)
  • (15) Martirosyan A, Figliuzzi M, Marinari E and De Martino A 2016 Probing the limits to microRNA-mediated control of gene expression PLoS Comput. Biol. 12 e1004715. (DOI:10.1371/journal.pcbi.1004715)
  • (16) Martirosyan A, De Martino A, Pagnani A and Marinari E 2017 ceRNA crosstalk stabilizes protein expression and affects the correlation pattern of interacting proteins Sci. Rep. 7 1-11 (DOI: 10.1038/srep43673)
  • (17) Alon U 2006 An introduction to systems biology: design principles of biological circuits (London, UK: Chapman and Hall/CRC)
  • (18) Papenfort K, Espinosa E, Casadesus J and Vogel J 2015 Small RNA-based feedforward loop with AND-gate logic regulates extrachromosomal DNA transfer in Salmonella Proc. Natl. Acad. Sci. USA 112 E4772-81 (DOI: 10.1073/pnas.1507825112)
  • (19) Riba A, Bosia C, El Baroudi M, Ollino L and Caselle M 2014 A combination of transcriptional and microRNA regulation improves the stability of the relative concentrations of target genes PLoS Comput. Biol. 10 e1003490 (DOI: 10.1371/journal.pcbi.1003490)
  • (20) Cora D, Re A, Caselle M and Bussolino F 2017 MicroRNA-mediated regulatory circuits: outlook and perspectives Phys. Biol. 14 045001-11 (DOI: 10.1088/1478-3975/aa6f21)
  • (21) Majdalani N, Hernandez D and Gottesman S 2002 Regulation and mode of action of the second small RNA activator of RpoS translation, RprA Mol. Microbiol. 46 813-26 (DOI: 10.1046/j.1365-2958.2002.03203.x)
  • (22) van Kampen N G 2007 Stochastic processes in physics and chemistry (Amsterdam: Elsevier)
  • (23) Lafuerza L F and Toral R 2010 On the Gaussian approximation for master equations J. Stat. Phys. 140 917-33 (DOI: 10.1007/s10955-010-0024-7)
  • (24) Gillespie D T 1976 A general method for numerically simulating the stochastic time evolution of coupled chemical reactions J. Comput. Phys. 22 403-34 (DOI: 10.1016/0021-9991(76)90041-3)
  • (25) Gillespie D T 1977 Exact stochastic simulation of coupled chemical reactions J. Phys. Chem. 81 2340-61 (DOI: 10.1021/j100540a008)