Thermonuclear Reaction Rate of 30Si(p,)31P
Abstract
Silicon synthesis in high-temperature hydrogen burning environments presents one possible avenue for the study of abundance anomalies in globular clusters. This was suggested in a previous study, which found that the large uncertainties associated with the 30Si(p,)31P reaction rate preclude a firm understanding of the stellar conditions that give rise to the Mg-K anti-correlation observed in the globular cluster NGC 2419. In an effort to improve the reaction rate, we present new strength measurements of the keV and keV resonances in 30Si(p,)31P. For the former, which was previously unobserved, we obtain a resonance strength of ) eV. For the latter, we obtain a value of eV, which has a smaller uncertainty compared to previously measured strengths. Based on these results, the thermonuclear reaction rate has been re-evaluated. The impact of the new measurements is to lower the reaction rate by a factor of 10 at temperatures important to the study of NGC 2419. The rate uncertainty at these temperatures has also been reduced significantly.
- Usage
-
Secondary publications and information retrieval purposes.
- PACS numbers
-
May be entered using the
\pacs{#1}command.
pacs:
Valid PACS appear hereI Introduction
Abundance correlations in globular clusters may provide much needed insight into the dynamical evolution of the clusters and their host galaxies. Of particular interest is NGC 2419, a globular cluster located in the outer halo of the Milky Way Mucciarelli et al. (2012); Cohen and Kirby (2012). A group of red giant stars in this cluster has recently been found to have an unprecedented enrichment in potassium, while simultaneously being depleted in magnesium, giving rise to a Mg-K anticorrelation among the observed stars. This observation is inexplicable within the “single stellar population” framework commonly invoked to explain cluster evolution, and therefore hints at the existence of multiple populations. Using a simple self-pollution model, Iliadis et al. Iliadis et al. (2016) and Dermigny & Iliadis Dermigny and Iliadis (2017) studied the stellar conditions necessary to create this puzzling signature using Monte Carlo reaction network calculations. They found that the observed abundance anomalies must have been produced at temperatures near 150 GK, for a very wide range of densities. However, the nature of the polluter stars could not be established unambiguously, in part because of large uncertainties in the thermonuclear rates of key reactions. For example, they could show that the paucity of low-energy 30Si(p,)31P reaction data leads to appreciable model uncertainties, making firm conclusions difficult. Therefore, we present thermonuclear rates for the 30Si(p,)31P reaction (Q = keV Wang et al. (2017)) based on new resonance strength measurements.
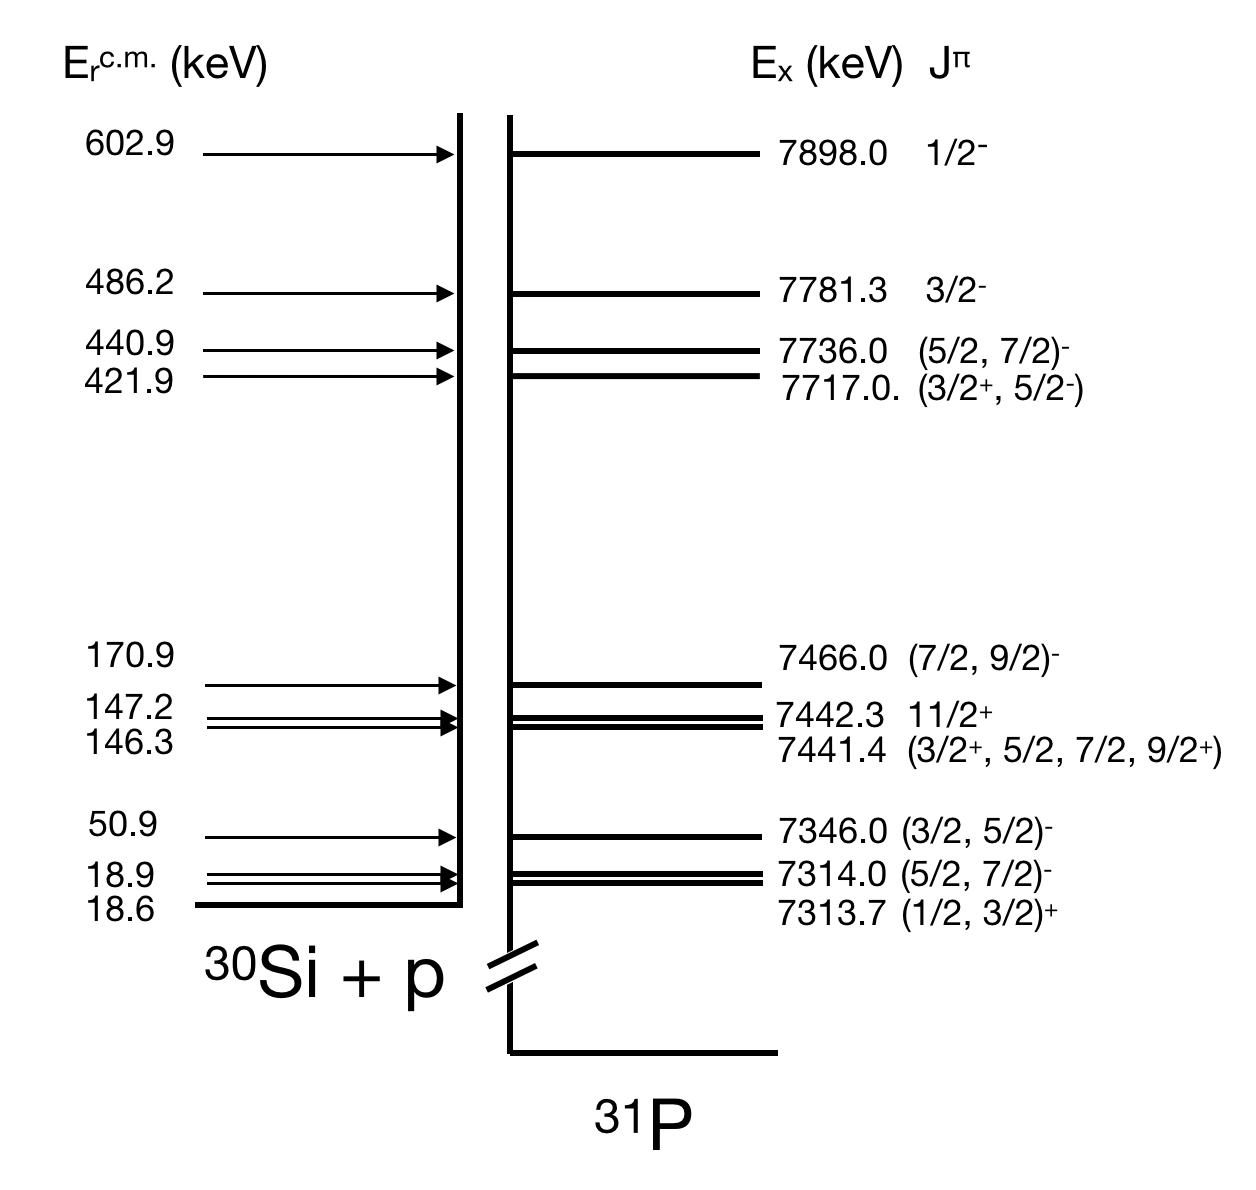
The level structure of 31P near the proton threshold is shown in Figure 1. The first modern reaction rate for 30Si(p,)31P, based on experimentally derived data, was published by Harris, Caughlan & Fowler Harris et al. (1983). However, no reaction rate uncertainty was provided. The rate was re-evaluated by Iliadis et al. Iliadis et al. (2001). Their work featured two major improvements over that of Ref. Harris et al. (1983). First, the effects of the unobserved threshold states between E keV keV were included in the calculation. Second, statistical and systematic uncertainties in the experimental data were propagated through to the final reaction rate, affording an estimation of the temperature region where the rates are most uncertain. Most recently, the rates were evaluated again by Iliadis et al. Iliadis et al. (2010a) using the Monte Carlo reaction rate formalism by Longland et al. Longland et al. (2010). This rate was used in the nucleosynthesis studies by Iliadis et al. Iliadis et al. (2016) and Dermigny & Iliadis Dermigny and Iliadis (2017).
The two latter works explored stellar temperatures between approximately 160 MK and 300 MK as a means of explaining the abundance anomalies observed in NGC 2419. At these temperatures, the 30Si(p,)31P reaction rate is determined by the resonances at keV ( keV) and keV ( keV). Little is known about the -keV resonance. The corresponding 31P compound nucleus level was populated by Vernotte et al. Vernotte et al. (1990) using the 30Si(3He,d)31P proton transfer reaction, but the resonance has not yet been measured directly. Consequently, the most recent rate evaluation had to rely on the upper-limit formalism of Ref. Longland et al. (2010). An additional complication is introduced by the unknown spin-parity assignment of this level.
The -keV resonance has been measured previously by Hoogenboom et al. Hoogenboom (1958) and Riihonen et al. Riihonen et al. (1979). However, their reported resonance strengths differ by approximately a factor of two. The uncertainties associated with both of these resonances give rise to a factor of three uncertainty in the reaction rate in the important stellar temperature range.
In the present work, we report on new measurements of the resonance strengths for the 435-keV and 501-keV resonances in 30Si(p,)31P. These measurements are critical to achieving the improved accuracy required for modern nucleosynthesis calculations and are of particular interest to the observations in NGC 2419. See Dermigny & Iliadis Dermigny and Iliadis (2017) for further detail.
In Section II we describe the experimental apparatus. In Section III we discuss the data analysis techniques. The results of the experiment are then given in Section IV. New thermonuclear rates for 30Si(p,)31P are derived in Section V. A summary and conclusion is given in Section VI.
II Equipment
II.1 Accelerators and targets
The experiment was carried out at the Laboratory for Experimental Nuclear Astrophysics (LENA), which is part of the Triangle Universities Nuclear Laboratory (TUNL) Cesaratto et al. (2010). LENA houses a JN Van de Graaff electrostatic accelerator. The JN Van de Graaff is capable of delivering up to 150 A of protons to target at energies between 200 keV and 900 keV 111The JN Van de Graaff accelerator is being decommissioned at the time of writing and will be replaced by a new machine.. Prior to the resonance experiments, the proton beam-energy was calibrated via a yield curve analysis of several well-known resonances in the 27Al(p,)28Si reaction. Several measurements were also made using the 12C(p,)13N direct-capture reaction. Using these two complementary techiques, a beam-energy uncertainty of keV was determined. The full width at half maximum of the beam-energy profile observed during these experiments was keV.
The proton beam from the JN accelerator entered the target chamber through a liquid-nitrogen-cooled copper tube. An electrode was mounted at the end of this tube and was biased to V to suppress the emission of secondary electrons from the target and the beam collimator. The target and chamber formed a Faraday cup for charge integration. The beam was focused and rastered into a circular profile of mm diameter on target. The target was directly water cooled using deionized water.
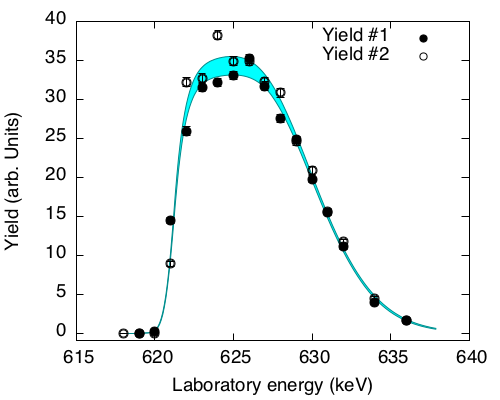
The target was fabricated at TUNL by implanting 30Si ions into a 0.5-mm-thick tantalum backing. A 55-keV 30Si beam was generated from isotopically enriched silicon powder () by a SNICS source Middleton (1984). The total dose incident on the backing was 360 mC. Prior to implantation, the tantalum backings were chemically etched and then outgassed in high vacuum by resistive heating to remove contaminants. The well-known resonance at keV Endt (1990) in 30Si(p,)31P was used to characterize the target. Yield curves are shown in Figure 2. The target thickness was found to be keV. Based on the maximum yield obtained and the resonance strength reported in Ref. Paine and Sargood (1979), the stoichiometry of the target layer was Ta:30Si = . Yield curves measured at the end of the experiment demonstrated that the maximum yield and thickness were unchanged after an accumulated proton charge of 5 C.
II.2 Spectrometer
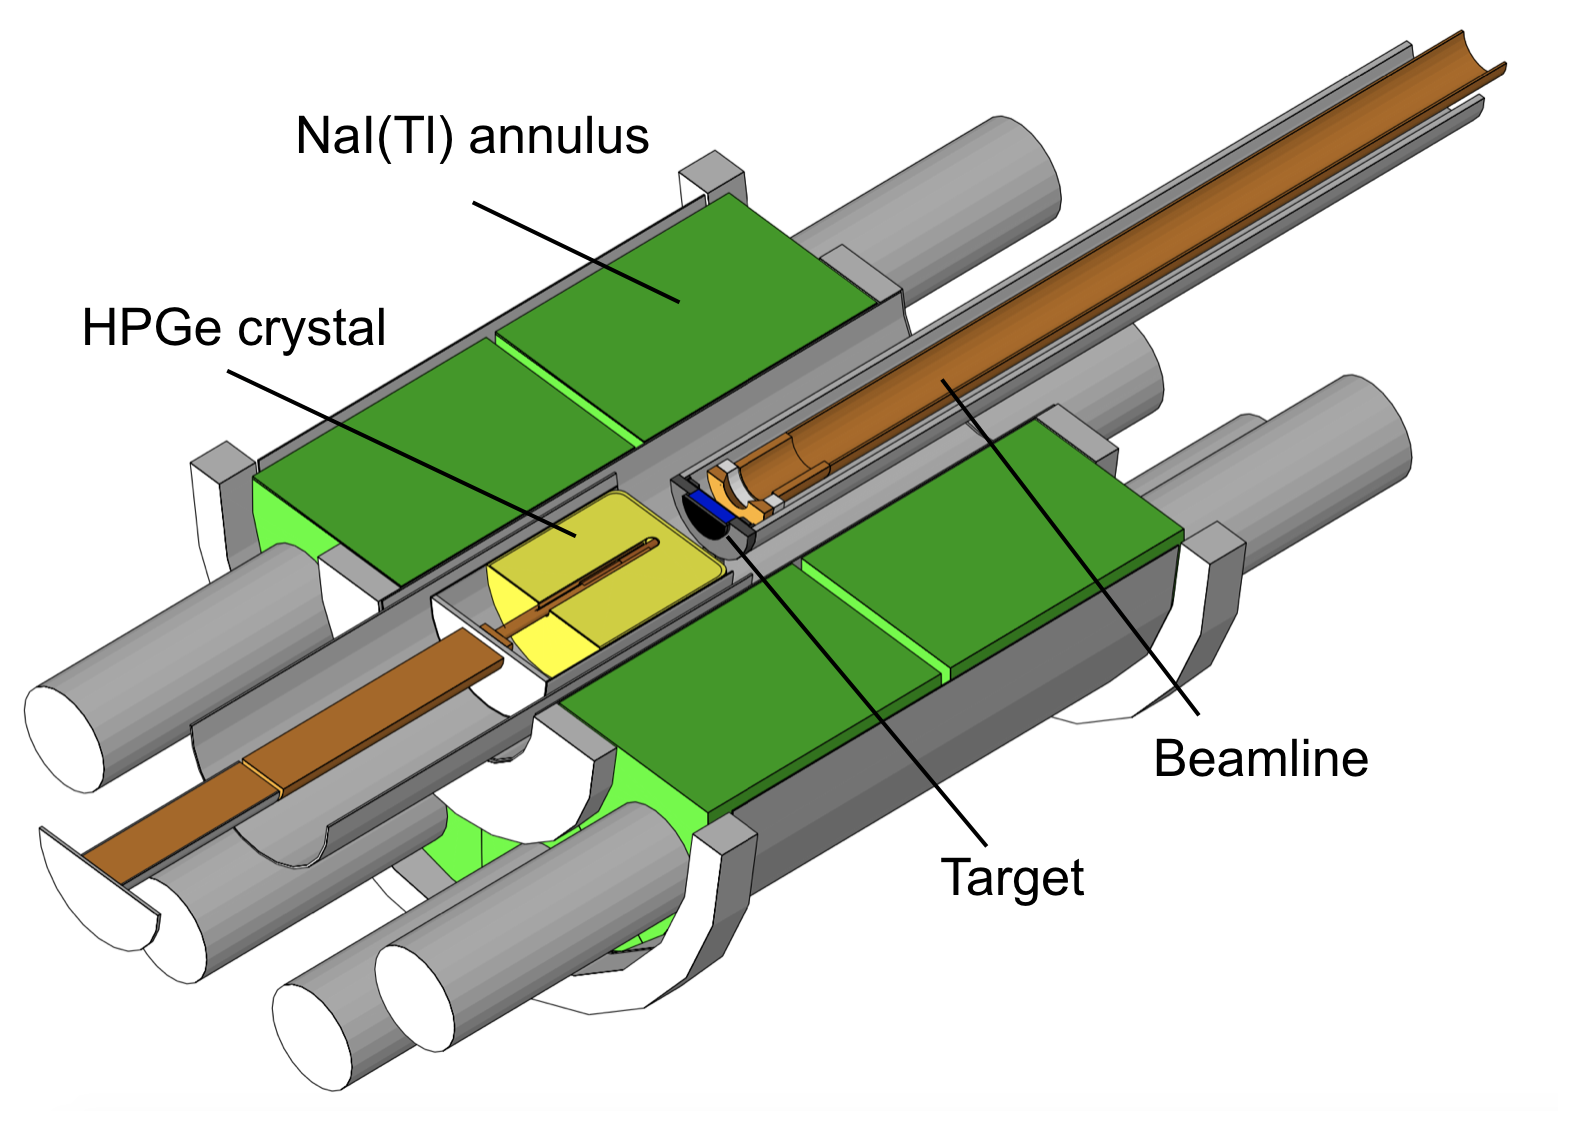
The 30Si(,)31P reaction gives rise to the emission of multiple, coincident -rays. The -coincidence spectrometer employed at LENA has been designed to exploit this property in order to improve detection sensitivity Longland et al. (2006). The setup is shown in Figure 3. It features a HPGe detector, oriented at with respect to the beam-axis, placed in close proximity to the target chamber. The HPGe detector is surrounded by a 16-segment NaI(Tl) annulus. Both counters are surrounded on five sides by 50-mm-thick plastic scintillator panels (not shown in the figure) to suppress cosmic-ray muon events.
Energy and timing information from each detector was processed using standard NIM and VME electronics. Events were sorted off-line using the acquisition software JAM Swartz et al. (2001). Coincidence conditions were then applied in software by constructing a two-dimensional NaI(Tl) versus HPGe detector energy spectrum and applying a trapezoidal gate with the following condition:
| (1) |
If an event satisfied this condition, the HPGe detector signal was included in the gated pulse-height spectrum. The upper threshold of MeV was chosen to exclude cosmic-ray induced background events with an energy exceeding the 31P excitation energy range of interest. The low-energy threshold of MeV significantly reduces environmental background (e.g., 40K, 208Tl), as well as beam-induced background from contaminant reactions with relatively small Q-values, e.g., 12C+p (Q = keV Wang et al. (2017)).
The spectrometer detector dead time was monitored throughout the experiment by feeding a pulser signal into the HPGe preamp. The number of pulses was recorded using a scalar counting module, and this was compared to the artificial pulser peak in the pulse-height spectrum to obtain the dead time of the system. The dead time was kept below 5% to avoid pulse pileup effects.
III Data Analysis Strategy
The extraction of accurate resonance strengths from singles and coincidence data requires careful calibrations and corrections for experimental artifacts, e.g., detection efficiencies, coincidence summing, angular correlations, and finite beam spot sizes. The most reliable way to correct for these effects is to employ Monte Carlo radiation transport codes, such as Geant4 Agostinelli et al. (2003). This requires that the detector geometry is precisely known Carson et al. (2010). A complete Geant4 model of our spectrometer, including the beam tube, target holder, and passive shielding, is presented in Howard et al. Howard et al. (2013). Furthermore, we recently developed a method to analyze not just the net intensity of isolated peaks in the pulse height spectra, but to fit large energy regions of measured singles and gated HPGe detector spectra using a binned-likelihood approach based on a Bayesian method Dermigny et al. (2016). This technique has already been successfully applied to the analysis of 17O(p,)18F Buckner et al. (2015) and 22Ne(p,)23Na Kelly et al. (2017) reaction data.
The main feature of this method is that the spectra are analyzed in a bin-by-bin fashion, where the fit is based on the simulated response of the detector system to all sources of radiation present during the experiment. The advantage over traditional analysis methods is that the simulated response implicitly includes the effects mentioned above, removing the need for cumbersome individual corrections.
The procedure for building a successful model is straightforward. For each experimental singles or coincidence spectrum, we prepared several component spectra (“templates”). For example, a spectrum measured on the plateau of a thick-target yield curve typically has contributions from several primary decays and a number of beam-induced and environmental background components. The response of the -spectrometer to each individual primary decay was simulated using Geant4, incorporating all subsequent secondary transitions. The required secondary -ray branching ratios were adopted from Ref. de Neijs et al. (1975). Angular correlation effects for the decaying states were also included in the simulations to the extent possible. If they have been measured previously for any of the primary decays, those results were used to simulate the -ray emission pattern. In cases where the spin-parity of the decaying states permitted the exact calculation of the angular correlation, those were incorporated into the simulation instead. A measured spectrum, obtained without beam on target, served as the room-background template. For the beam-induced background components, templates were generated using a Geant4 simulation of the contaminant reactions.
Once the templates have been generated, the experimental data were fit using a Bayesian binned-likelihood probability model Barlow and Beeston (1993). The fit provides the scaling parameter of each template. The scaling parameters are then used to determine the total number of 30Si(p,)31P reactions, including the primary branching ratios for 30Si(p,)31P.
In previous applications of fraction-fitting, for example, in Buckner et al. Buckner et al. (2015), Kelly et al. Kelly et al. (2017), and Dermigny et al. Dermigny et al. (2016), the experimental spectra were fit using a single, contiguous region spanning several MeV. In this work, a different approach was taken. Instead, the fits were limited to regions surrounding the primary transition full-energy peaks. Bins that fell outside of these boundaries did not enter into the resonance strength calculations. These regions were approximately 50-keV wide, with the primary peak located in the center. This was done in order to minimize the influence of the secondary transition -ray branching ratios that were adopted from the literature, since the primary transition -ray intensities are the most important to the resonance strength calculation.
IV Results
IV.1 Resonance at keV
The keV resonance has been measured several times Smith and Endt (1958); Hough et al. (1968); Lyons et al. (1969); Riihonen et al. (1979), but the early measurements were in mutual disagreement. For this reason, Paine & Sargood Paine and Sargood (1979) remeasured the resonance as part of a campaign to improve resonance strengths in the Z=11-20 region. They reported on several relative and absolute measurements of the 622-keV resonance strength. The precision and consistency of their work helped to make it a standard resonance Iliadis et al. (2001) for measuring the lower-energy resonances in the 30Si(p,)31P reaction. For this purpose, we adopted their recommended value, eV.
The -keV resonance corresponds to a 31P compound level at keV Ouellet and Singh (2013). The -ray decay of this level is well-known, and the branching ratios are presented in Ref. de Neijs et al. (1975). The spin-parity has been determined using proton transfer studies and angular correlation measurements, which support an assignment of Broude et al. (1958a); Vernotte et al. (1990). Since our incident proton beam is unpolarized, conservation of angular momentum dictates that the primary transition -rays are emitted isotropically. This further simplified the analysis by eliminating the need for angular correlation effects in our simulations.
The measured yield curve for the keV resonance is shown in Figure 2. The net intensity of the ground-state transition -ray in the singles spectrum was used to calculate the yield. To obtain high-statistics resonance data, a longer run was performed on the plateau maximum at an incident proton energy of keV. The total amount of charge accumulated for this measurement was 3781 C, with an average beam-intensity of 0.79 A on target.
We then fit the data using the fraction-fitting method. For the singles and coincidence spectra, the derived primary branching ratios as well as the total number of 30Si(p,)31P reactions are shown in agreement in Table 1. All transitions from the compound state that had been previously identified by de Neijs et al. de Neijs et al. (1975) were present in the acquired spectra. No new transitions were observed. The branching ratios measured are consistent with those reported by de Neijs et al. de Neijs et al. (1975), although a quantitative comparison is difficult since the latter work did not report uncertainties for their branching ratios.
From the measured primary -ray energies, we find an excitation energy of keV. Our result agrees with the previously reported value but has a smaller uncertainty Ouellet and Singh (2013). This excitation energy corresponds to a laboratory and center-of-mass resonance energy of keV and keV, respectively (see Table I).
| (keV)a | (keV)a | Number of 30Si+p Reactionsa | Branching Ratios () | ||||||
|---|---|---|---|---|---|---|---|---|---|
| singles | coincidence | Transition | singlesa | coincidencea | Ref. de Neijs et al. (1975) | ||||
| 621.70.3 | 7898.00.3 | b | R 0 | ||||||
| R 1266 | |||||||||
| R 3134 | |||||||||
| R 3506 | |||||||||
| R 5015 | |||||||||
| 501.10.2 | 7781.30.2 | b | R 0 | ||||||
| R 1266 | |||||||||
| R 2233 | |||||||||
| R 3134 | |||||||||
| R 3295 | |||||||||
| R 4260 | |||||||||
| R 4783 | |||||||||
| R 5014.9 | |||||||||
| R 5116 | — | ||||||||
| R 6496 | — | ||||||||
| R 6594 | — | ||||||||
| 434.60.3 | 7717.00.3 | (, )c | R 3295 | — | |||||
| R 4431 | — | ||||||||
| R 5014.9 | — | ||||||||
-
a
Present work. The Number of 30Si+p reactions was obtained from singles and coincidence spectra using the fraction-fitting method. For the keV resonance, the values listed in columns 4, 5, 7, and 8 do not include corrections for angular correlation results. These were applied ex post (see text).
-
b
From Ref. Ouellet and Singh (2013).
-
c
Including information from the present work (see text).
IV.2 Resonance at keV
The strength of the resonance at keV ( Broude et al. (1958b); Riihonen et al. (1979)) has been measured previously by Hoogenboom et al. ( eV, unpublished thesis, see Endt Endt and Van der Leun (1967)) and Riihonen et al. ( eV Riihonen et al. (1979)). These values are in conflict, differing by nearly a factor of two. Unfortunately, we can only speculate as to the cause of this discrepancy since virtually no information from the Hoogenboom et al. measurement or analysis is available today. With that in mind, it seems their value has had an out-sized impact on previous 30Si(p,)31P reaction rate calculations. For instance, the Iliadis et al. Iliadis et al. (2010a) evaluation adopted the weighted-average for the keV resonance strength suggested by Ref. Endt (1990). Because of the small uncertainty reported by Hoogenboom et al., neither the resonance strength nor the calculated reaction rate reflected the tension underlying these two measurements.
To improve this situation we remeasured the resonance strength. We first obtained a yield curve over the keV resonance using the net-intensity of the R1266 transition. At keV, corresponding to the plateau maximum, high-statistics resonance data were recorded. The total incident charge was mC, with an average beam intensity of A on target. In addition to the seven transitions reported by de Neijs et al. de Neijs et al. (1975), we identified three full-energy peaks in the pulse-height spectra that correspond to previously unobserved transitions. Based on their energies, we have identified them as primary transitions from the 31P compound state to the excited states at E keV, E keV, and E keV. The three full-energy peaks were found in a region of the pulse-height spectrum encumbered by both environmental and beam-induced background, and so it is likely that they had escaped detection in Ref. de Neijs et al. (1975).
The measured singles and coincidence data were then analyzed via fraction-fitting. The resulting reaction intensities and branching ratios are shown in Table 1. In general there is good agreement between the branching ratios obtained using the singles and the coincidence data, with the exception of the R primary transition. This state is part of a doublet ( keV and keV) and so it is conceivable that the secondary branching ratios reported in Ref. de Neijs et al. (1975) contain errors. Since this information is used to generate our templates, such an error would manifest itself in the coincidence results. With regard to the primary transition branching ratio values reported by de Neijs et al. de Neijs et al. (1975), the lack of uncertainties again makes a quantitative comparison difficult. This is further complicated by the present observation of the three new transitions.
From the measured primary -ray energies, we find an excitation energy of keV. Our result has a smaller uncertainty than the previously reported value of keV but disagrees at the one-sigma level Ouellet and Singh (2013). This excitation energy corresponds to a laboratory and center-of-mass resonance energy of keV and keV, respectively (see Table I).
The resonance strength was calculated using the relative measurement formula Iliadis (2015):
| (2) |
where is the resonance strength of our standard resonance, is the de Broglie wavelength of the incident proton, and is the area under the yield curve for resonance . The factors , , and , refer to the branching ratio, detection efficiency, and angular correlation coefficient, respectively, for the observed primary transition. The values were obtained using a fit to the resonance yield curves. The combined correction factor was calculated for each resonance and the respective transition, R Ex, using the ratio:
| (3) |
where is the total number of 30Si reactions and is the net-intensity of the primary transition full-energy peak. The latter quantity was measured directly from the singles pulse-height spectrum.
We determined a resonance strength of eV (Table 2). This is in conflict with the original measurement by Hoogenboom et al., while being consistent with the more recent Riihonen et al. value. The effect of this new measurement on the reaction rate will be considered in Section V.
IV.3 Resonance at keV
Unlike the -keV and -keV resonances, for which measured spin-parity and deexcitation branching ratios are available, little is known about the resonance at E keV. Previous measurements of this state are limited to a few indirect studies that were unable to determine either a spin-parity or a single-particle reduced width Betigeri et al. (1966); Moss (1969); Al-Jadir et al. (1980); Vernotte et al. (1990). Estimates of the resonance strength and its effect on the 30Si(p,)31P reaction rate have therefore been limited to experimental upper-limits and statistical arguments (see Iliadis et al. Iliadis et al. (2010a)).
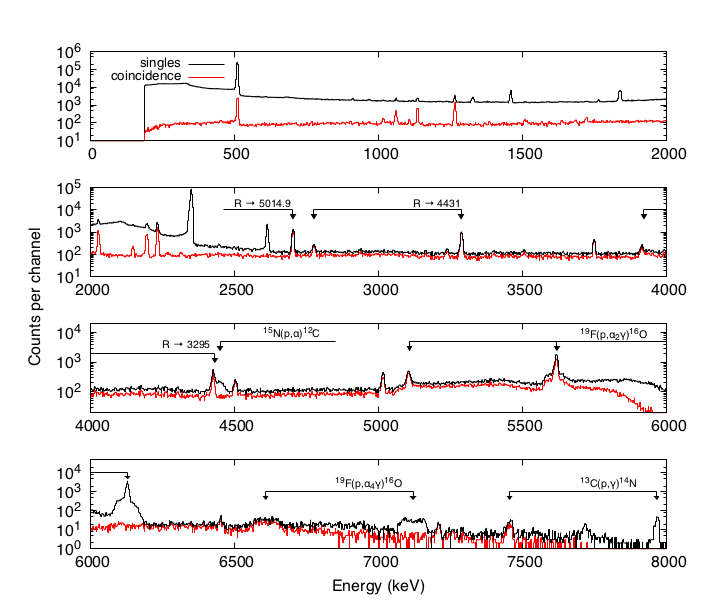
We obtained the first -ray spectra of the -keV resonance using a proton beam with keV, corresponding to the maximum of the yield curve. The average beam current on target was about A, with a total accumulated charge of C. The pulse-height spectra for the singles and coincidence data are shown in Figure 4. Three primary transition full-energy peaks are indicated. Based on their energies, we have identified them as transitions from the keV compound state to the states at E keV ( Ouellet and Singh (2013)), E keV ( Ouellet and Singh (2013)), and E keV ( () Ouellet and Singh (2013)). The last assignment was established based on the presence of the and secondary transitions. The relative intensity of these two full-energy peaks was found to be consistent with the branching ratios for the decay of the -keV state published by de Neijs et al. de Neijs et al. (1975).
From the measured primary -ray energies, we find an excitation energy of keV. Our result agrees with the previously reported value of keV but has a smaller uncertainty Ouellet and Singh (2013). This excitation energy corresponds to a laboratory and center-of-mass resonance energy of keV and keV, respectively (see Table I).
The spin-parity is not unambiguously known for this level, but can be restricted based on the -ray decay observed in the present work (Table I) and previous transfer-reaction measurements Al-Jadir et al. (1980). The primary decays proceed to levels with unambiguous assignments of and . Using Endt’s “Dipole or E2 rule” Endt (1990), we find (, , , ). The 29Si(3He,p)31P transfer-reaction measurement by Al-Jadir et al. Al-Jadir et al. (1980) suggests spin-parity values of (,, ). Combining these observations we find (, ) for the -keV resonance.
Angular correlation corrections were applied as follows. We introduced the factor , given by:
| (4) |
where is the total reaction intensity obtained using the approximation of isotropy and is the estimated true reaction intensity. This latter result was obtained using a Monte Carlo procedure. For each iteration, the spin-parity of the resonance was sampled from a set of plausible values. The sampled spin-parity is then used to calculate the possible decay channels for each transition (See Appendix D in Iliadis 2015 Iliadis (2015) for details). For the estimation of , we only considered contributions from E1, M1/E2, and E2 radiation. If a transition had a mixed radiation decay, we sampled the mixing ratio from a uniform distribution over the interval . Each iteration of our procedure then yielded a value of given by:
| (5) |
where for each primary transition , the angular correlation has been calculated based on randomly sampled reaction parameters and is used to correct the measured transition intensity, . The th percentile of the distribution for is then used to define and the uncertainty is given by the th and th percentiles. Using this procedure, we determined a correction factor of . The large uncertainty reflects the wide range of angular correlation effects possible within the narrow set of spin-parities values.
Finally, we calculated the resonance strength using the thick-target relative measurement formula Iliadis (2015):
| (6) |
where is the maximum yield and is the effective stopping power at resonance energy . The maximum yield is given by the ratio of the reaction intensity, , to the number of incident protons, , including the correction factor :
| (7) |
The effective stopping powers were calculated at the resonance energies using the relationship Iliadis (2015):
| (8) |
where and are the individual stopping powers for protons in silicon and tantalum. These were obtained using SRIM Ziegler et al. (2010). The stoichiometric ratio was determined using a yield curve analysis of the standard -keV resonance, as explained in Section II.
We determined a resonance strength of eV for the 435-keV resonance (Table 2). The primary sources of uncertainty in this measurement are the correction factor () and the ratio of stopping powers (). A future measurement of either the resonance spin-parity or the angular correlation factors for the three primary transition would improve the uncertainty considerably.
V Thermonuclear reaction rate of 30Si(,)31P
V.1 General procedure
The reaction rate for 30Si(,)31P depends on both resonant and non-resonant properties of the nuclear interaction. For the purposes of modeling astrophysical phenomena, an accurate description of both processes is paramount. In this section, we review the available nuclear data for the 30Si + reaction and detail the process of incorporating them into a modern reaction rate calculation.
Experimental thermonuclear rates of the 30Si(p,)31P reaction were calculated using the Monte Carlo procedure presented in Longland et al. Longland et al. (2010). The total thermonuclear rate (in units of cm3 mol-1 s-1) for a reaction involving two nuclei (0 and 1) in the entrance channel at a given temperature is given by
| (9) |
where the center-of-mass energy, , is in units of MeV, the temperature, , is in GK ( K), the atomic masses, , are in u, the cross section, , is in barn ( b cm2), and denotes Avogadro’s constant.
We will briefly review the nuclear physics input necessary for the Monte Carlo rate calculations. For resonances, the cross section takes the form of the Breit-Wigner curve. If all the resonance partial widths (, ) are known, the integral in Eq. (9) can be performed numerically. Frequently, resonances are so narrow that their cross section cannot be obtained experimentally. Instead, all that is measured is the resonance strength, , which is proportional to the resonance integral. For each resonance, we assumed a Gaussian probability density for the resonance energy and a lognormal probability density for the resonance strength. The variance for each distribution was determined by the experimental uncertainties in the measurements. For resonances that have only been observed indirectly, i.e., using (d,n) or (3He,d) reactions, we instead estimated an upper limit, , based on the available 31P structure information (excitation energies, , and spectroscopic factors, ). In these cases, we assumed a Porter-Thomas probability distribution Longland et al. (2010) to sample the reduced proton widths and truncated the distribution at the upper-limit value. For the recommended mean reduced width we adopted a value of , with an estimated uncertainty of a factor of 3 (see Figure 4 of Ref. Pogrebnyak et al. (2013)).
Finally, for the non-resonant component, the astrophysical factor is used instead of the cross section since it varies much more slowly with energy. It is expanded into a Taylor series, and the input to the rate calculation consists of the value and slope of at zero bombarding energy. The probability densities of these parameters are assumed to be lognormal distributions with the uncertainties again determined by the variance.
To perform the Monte Carlo calculation we used the program RatesMC Longland et al. (2010), which computes a probability density function of the total rate, , on a fixed temperature grid by sampling the relevant nuclear input. At each temperature, 20,000 samples were drawn. Based on the accumulated total rate distribution, a recommended reaction rate and rate uncertainty (assuming coverage) were derived. In the following we provide details on the nuclear physics input.
V.2 Observed resonances
The 30Si(,)31P reaction proceeds predominantly through narrow resonances. For the keV and keV resonances, we used the resonance strengths and energies determined in the present work (Table I).
Many higher-lying resonances occur in the MeV range. A complete reference list can be found in Ref. Ouellet and Singh (2013). We adopted resonance strength measurements from the following studies: keV (Hoogenboom Hoogenboom (1958)), keV (Wolff et al Wolff et al. (1969)), keV (van Rinsvelt and Smith Van Rinsvelt and Smith (1964)), (van Rinsvelt and Endt Van Rinsvelt and Endt (1966)), (van Rinsvelt and Endt Van Rinsvelt and Endt (1966), de Neijs et al de Neijs et al. (1975)), keV (de Neijs et al de Neijs et al. (1975)), keV (Bornman et al Bornman et al. (1967)). Where two references have been given, the average of the resonance measurements within the stated range was adopted. Each of these studies reported resonance strengths relative to the standard resonance at keV. All values have therefore been scaled to the recommended value by Paine and Sargood Paine and Sargood (1979) (see Section IV A).
V.3 Unobserved resonances near the proton threshold
Several 31P levels near the proton threshold have been observed that may contribute to the total 30Si reaction rate (see Figure 1). We list all of these levels located below the lowest-energy resonance observed in the present work ( keV) in Table II. In the following we will denote these states by their center-of-mass resonance energies, which are listed in column 2 of Table II.
| (keV)a | (keV)b | a | g | (eV) | |
|---|---|---|---|---|---|
| 7313.71.6 | 18.61.6 | (1/2, 3/2)+ | 0, 2 | 0.001 | 6.5010-37 h |
| 73144 | 18.94.0 | (5/2, 7/2)- | 3 | 0.002 | 8.6010-40 h |
| 73466 | 50.96.0 | (3/2, 5/2)- | 1, 3 | 1 | 5.0410-17 h |
| 7356 c | |||||
| 7441.41.0 | 146.31.0 | (3/2+, 5/2, 7/2, 9/2+)d | 2, 3, 4 | 1 | 7.6010-8 h,k |
| 7442.30.3 | 147.20.3 | 11/2+ | 6 | 1 | 1.2410-15 h |
| 74662 | 170.92.0 | (7/2, 9/2)- f | 3, 5 | 0.003 | 1.2710-10 h |
| 7572 c | |||||
| 7687.22.0 e | |||||
| 7717.00.3 i | 421.90.3 i | (3/2+, 5/2-) i | (1.280.25)10-4 i | ||
| 77364 | 440.94.0 | (5/2, 7/2)- | 3 | 0.02 | 3.7210-4 h |
| 7781.30.2 i | 486.20.2 i | 3/2- | 0.1880.014 i | ||
| 7898.00.3 i | 602.90.3 i | 1/2- | 1.950.10 j |
-
a
From Ref. Ouellet and Singh (2013) unless noted otherwise.
- b
-
c
Level has only been reported in the 33S(d,)31P study of Ref. Teterin et al. (1974), and has been disregarded in the present work.
-
d
Based on the -ray branches to a 5/2+ and levels observed by Ref. De Voigt et al. (1971).
-
e
Level has only been reported by Ref. de Neijs et al. (1975). It was weakly excited and the results were reported in parenthesis. We disregarded this state.
-
f
From Ref. Endt (1990), based on -ray decay and feeding.
-
g
Spectroscopic factors, estimated from the experiment of Ref. Vernotte et al. (1990), assuming the lowest value allowed.
-
h
Assuming .
-
i
From direct measurement of present work.
-
j
From Ref. Paine and Sargood (1979).
-
k
Upper limit corresponds to 2. Values for 3 and 4 are given in the text.
An unbound state at E keV was discovered by Ref. De Voigt et al. (1971) using the 27Al(,)31P reaction, corresponding to keV in 30Si(p,)31P. This state was later confirmed by Ref. Twin et al. (1974) using the 28Si(,p)31P reaction. The spin-parity is restricted to (7/2, 9/2)- Endt (1990), based on the -ray feeding and decay of this level. The lowest possible orbital angular momentum transfer is . From the 30Si(3He,d)31P spectrum shown in Figure 1 of Ref. Vernotte et al. (1990) we estimated a spectroscopic factor of . This value is based on the intensity of the nearby -keV peak () and assumes that -keV peak has an relative intensity of (at most) . Assuming , we find an upper limit for the resonance strength of eV.
Ouellet & Singh Ouellet and Singh (2013) list a doublet at keV ( ) and keV ( ), corresponding to resonance energies of keV and keV, respectively, while only one level is given by Endt Endt (1990) at keV ( ). The only evidence we have for concluding that these two levels are not identical is a weak (105%) primary branch to a lower-lying state. Such a decay would be unlikely for a ( ) state. Since the evidence for the existence of two levels is ambiguous, we will assume for the Monte Carlo sampling a 50% chance of a contribution from a keV resonance ( ) that is distinct from the keV resonance (11/2+). We are sampling each of the possible orbital angular momenta ( 2, 3 or 4) for the former resonance with equal probability. Both levels are located in the 30Si(3He,d)31P spectrum of Ref. Vernotte et al. (1990) in a region contaminated by 17F. Therefore, no more stringent estimate than 1 can be obtained. The resulting resonance strength upper limits are eV ( 2), eV ( 3), and eV ( 4) for the keV resonance, and eV ( 6) for the keV resonance.
Ouellet & Singh Ouellet and Singh (2013) list a level at Ex keV ( , ), corresponding to a resonance energy of keV. The lowest possible orbital angular momentum transfer is . Since this level is located in the 30Si(3He,d)31P spectrum of Ref. Vernotte et al. (1990) in a region contaminated by 17F, no more stringent estimate than 1 can be obtained. The resulting resonance strength upper limit is eV.
The reported Ouellet and Singh (2013) doublet at keV ( , ) and keV ( , ) corresponds to resonance energies of keV and keV, respectively. The latter state was populated in the 30Si(3He,d)31P study of Ref. Vernotte et al. (1990), who reported a spectroscopic factor of . The resulting resonance strength is eV. However, we can not exclude a contribution from the other state in the doublet, which would correspond to an s-wave resonance ( ). Assuming that the entire intensity measured for this doublet in the study of Ref. Vernotte et al. (1990) is caused by the keV level, and comparing this intensity to the one for the 7141 keV ( ) level, we can estimate a spectroscopic factor upper limit of 0.001. The resulting resonance strength upper limit is eV.
We disregarded three levels listed in Ref. Ouellet and Singh (2013). The level at E keV is listed with a question mark and has only been reported by Ref. de Neijs et al. (1975). This state was weakly excited and the excitation energy was placed in parenthesis de Neijs et al. (1975). The two levels at E keV and 7572 keV have only been reported in the 33S(d,)31P study of Ref. Teterin et al. (1974). The existence of these three threshold levels is questionable at present.
V.4 Direct capture
The direct capture contribution has been estimated using the formalism presented in Refs. Rolfs (1973); Iliadis and Wiescher (2004). The total direct capture cross section is given by an incoherent sum over orbital angular momenta and for all incoming and outgoing partial waves involved,
| (10) |
where the sum runs over all bound states in 31P for which proton spectroscopic factors have been measured Vernotte et al. (1990). The theoretical direct capture cross section in the energy range MeV was computed using a single-particle model with a Woods-Saxon bound state potential ( fm, fm). The total non-resonant cross section was then converted to the astrophysical S-factor, , with denoting the Sommerfeld parameter. The polynomial expansion of the total S-factor yields
| (11) |
with MeVb, b, and b/MeV.
V.5 Total Reaction Rate
The total 30Si(p,)31P reaction rates are listed in Table 3 and are shown in Figure 5. The tabulated “low”, “median”, and “high” rates refer to a coverage probability of 68%. The tabulated rate factor uncertainty, , is derived from , where denotes the spread parameter for the lognormal approximation of the total rate probability density Longland et al. (2010). It can be seen that the reaction rate uncertainty amounts to less than 15% at temperatures GK, but increases with decreasing temperature. For example, at GK and GK the uncertainty amounts to a factor of 9 and 4, respectively.
| T (GK) | Low | Median | High | f.u. |
|---|---|---|---|---|
| 0.010 | 1.0010-38 | 7.4210-38 | 1.2010-36 | 9.983 |
| 0.011 | 4.0810-37 | 5.2210-36 | 1.1410-34 | 13.23 |
| 0.012 | 1.5510-35 | 3.4310-34 | 5.7710-33 | 14.64 |
| 0.013 | 5.7210-34 | 1.3410-32 | 1.6810-31 | 14.22 |
| 0.014 | 1.5110-32 | 3.0610-31 | 3.1210-30 | 13.18 |
| 0.015 | 2.6110-31 | 4.6010-30 | 3.9310-29 | 12.20 |
| 0.016 | 3.1110-30 | 4.9010-29 | 3.7910-28 | 11.52 |
| 0.018 | 1.7510-28 | 2.4710-27 | 1.7410-26 | 10.80 |
| 0.020 | 4.0110-27 | 5.6510-26 | 3.9010-25 | 10.75 |
| 0.025 | 9.0610-25 | 1.4810-23 | 1.2110-22 | 11.49 |
| 0.030 | 3.1410-23 | 5.7910-22 | 5.6910-21 | 11.89 |
| 0.040 | 5.3310-21 | 5.4510-20 | 7.1310-19 | 9.271 |
| 0.050 | 4.8510-19 | 1.5010-18 | 1.4410-17 | 5.432 |
| 0.060 | 1.8610-17 | 3.5810-17 | 2.4610-16 | 4.040 |
| 0.070 | 3.9310-16 | 6.9310-16 | 3.5310-15 | 3.976 |
| 0.080 | 5.0610-15 | 9.4310-15 | 3.8310-14 | 4.107 |
| 0.090 | 4.2510-14 | 8.6510-14 | 3.1710-13 | 4.140 |
| 0.100 | 2.6510-13 | 5.7210-13 | 1.9010-12 | 4.022 |
| 0.110 | 1.2910-12 | 2.8210-12 | 9.0010-12 | 3.832 |
| 0.120 | 5.1510-12 | 1.0910-11 | 3.4310-11 | 3.601 |
| 0.130 | 1.7610-11 | 3.6310-11 | 1.0610-10 | 3.347 |
| 0.140 | 5.4510-11 | 1.0610-10 | 2.8410-10 | 3.067 |
| 0.150 | 1.6910-10 | 2.9310-10 | 6.9210-10 | 2.715 |
| 0.160 | 6.0210-10 | 8.7710-10 | 1.6910-09 | 2.262 |
| 0.180 | 1.1910-08 | 1.3310-08 | 1.6010-08 | 1.472 |
| 0.200 | 1.9810-07 | 2.1310-07 | 2.3110-07 | 1.155 |
| 0.250 | 3.8210-05 | 4.1010-05 | 4.3910-05 | 1.073 |
| 0.300 | 1.3210-03 | 1.4110-03 | 1.5110-03 | 1.069 |
| 0.350 | 1.6810-02 | 1.7810-02 | 1.9010-02 | 1.064 |
| 0.400 | 1.1510-01 | 1.2210-01 | 1.2910-01 | 1.058 |
| 0.450 | 5.1910-01 | 5.4710-01 | 5.7610-01 | 1.053 |
| 0.500 | 1.7510+00 | 1.8310+00 | 1.9210+00 | 1.050 |
| 0.600 | 1.0910+01 | 1.1410+01 | 1.1910+01 | 1.045 |
| 0.700 | 4.0210+01 | 4.1910+01 | 4.3710+01 | 1.043 |
| 0.800 | 1.0610+02 | 1.1110+02 | 1.1510+02 | 1.042 |
| 0.900 | 2.2510+02 | 2.3410+02 | 2.4410+02 | 1.041 |
| 1.000 | 4.0810+02 | 4.2510+02 | 4.4210+02 | 1.041 |
| 1.250 | 1.1710+03 | 1.2110+03 | 1.2610+03 | 1.040 |
| 1.500 | 2.3110+03 | 2.4010+03 | 2.5010+03 | 1.040 |
| 1.750 | 3.7410+03 | 3.8810+03 | 4.0410+03 | 1.039 |
| 2.000 | 5.3510+03 | 5.5510+03 | 5.7710+03 | 1.039 |
| 2.500 | 8.8810+03 | 9.2110+03 | 9.5610+03 | 1.038 |
| 3.000 | 1.2610+04 | 1.3110+04 | 1.3610+04 | 1.038 |
| 3.500 | 1.6410+04 | 1.7010+04 | 1.7710+04 | 1.038 |
| 4.000 | 2.0210+04 | 2.1010+04 | 2.1810+04 | 1.038 |
| 5.000 | 2.7610+04 | 2.8710+04 | 2.9810+04 | 1.039 |
| 6.000 | 3.6410+04 | 3.8910+04 | 4.1610+04 | 1.040 |
| 7.000 | 4.7410+04 | 5.0610+04 | 5.4110+04 | 1.041 |
| 8.000 | 5.8010+04 | 6.2010+04 | 6.6310+04 | 1.042 |
| 9.000 | 6.8710+04 | 7.3410+04 | 7.8410+04 | 1.044 |
| 10.00 | 8.1310+04 | 8.6910+04 | 9.2910+04 | 1.045 |
-
a
In units of cm3mol-1s-1. Columns 2, 3, and 4 list the 16th, 50th, and 84th percentiles of the total rate probability density at given temperatures. Rates for GK have been adopted from Ref. Iliadis et al. (2010b); they have not been obtained from the Monte Carlo sampling procedure, but account for the contributions of higher-lying resonances using the Hauser-Feshbach model.
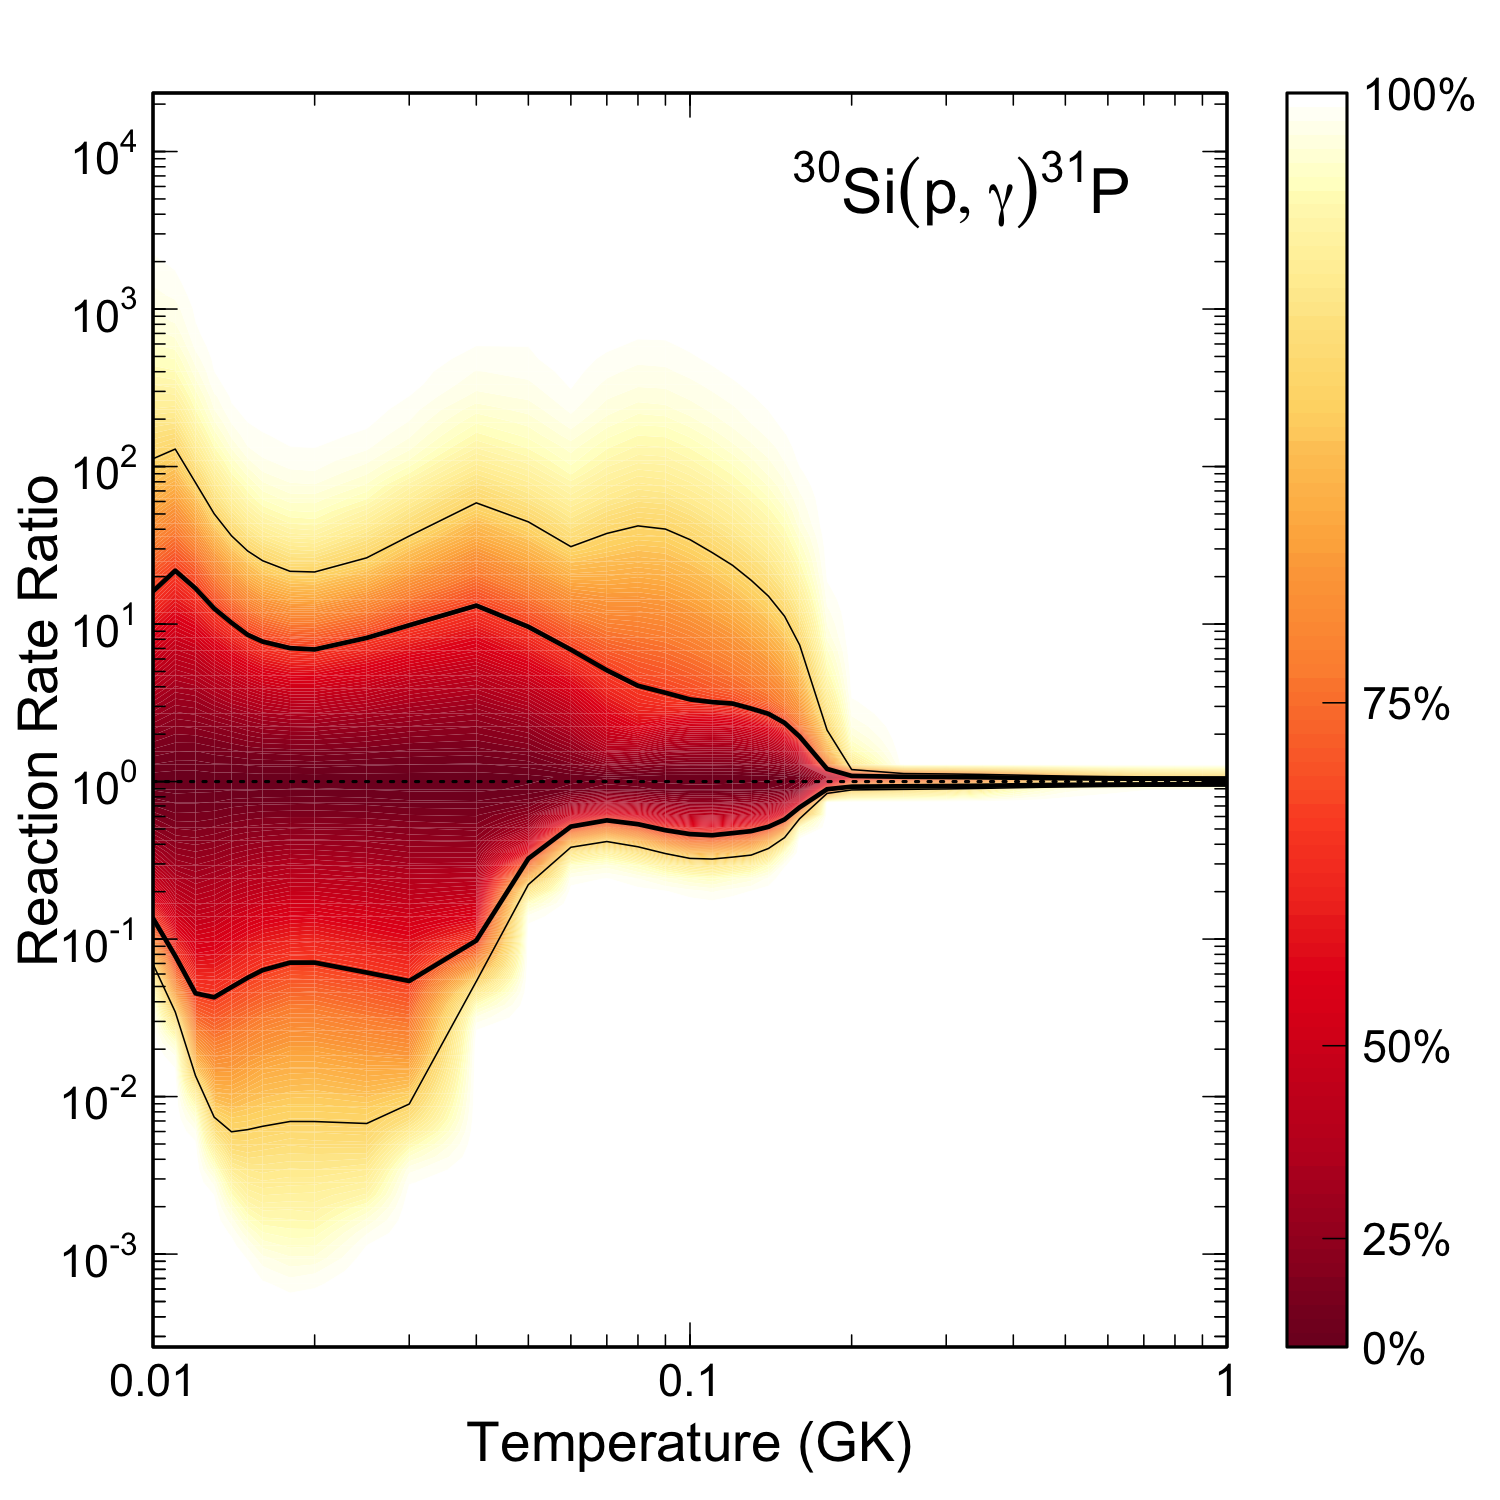
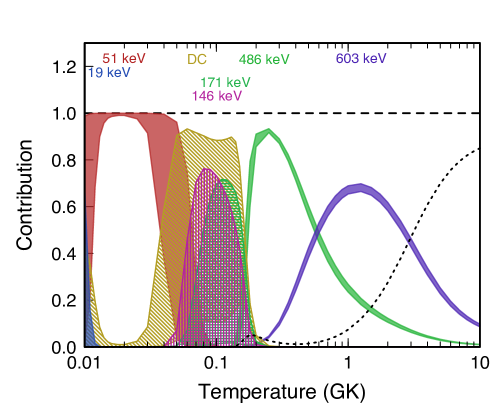
Figure 6 shows the fractional contributions of individual resonances to the total 30Si(p,)31P reaction rate. Resonances with energies above keV dominate the rate for temperatures GK. The 603 keV resonance, the highest-energy resonance measured in the present work, determines the rates in the range of 0.6 GK to 3 GK. The temperature region from 0.15 GK to 0.6 GK is dominated by the 486 keV resonance, also measured in this work. Between 0.04 GK and 0.15 GK, the resonances at 51 keV, 146 keV, 171 keV, and the direct capture process, contribute significantly to the total rates. Notice that only upper limit contributions could be established for these three resonances. The resonances at 147 keV, and 440 keV, as well as the 422 keV resonance measured in the present work, provide only insignificant contributions. Below GK, the 51 keV resonance is the most important contributor to the total rate.
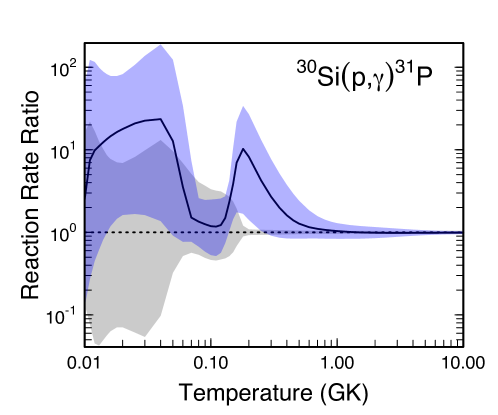
It is instructive to compare the present rates with those from the 2010 evaluation Iliadis et al. (2010b). The gray and blue shaded areas in Figure 7 show the 68% coverage probabilities of the present and previous rate probability density, respectively. All rates are normalized to the present recommended (median) rate listed in column 3 of Table 3. The previous rates are higher than the present results by about an order of magnitude near GK, which is a direct consequence of our measurement of the previously unobserved 422 keV resonance. We have reduced the contribution of this resonance to an insignificant level. From the respective widths of the gray and blue bands, it can also be seen that the present measurement has drastically reduced the total rate uncertainty near GK from a factor of to about 15%.
At lower temperatures, the situation is more complex. Near GK it can be seen that the total rate uncertainty has slightly increased compared to the 2010 evaluation Iliadis et al. (2010b). The reason is that only a single threshold state at keV (11/2+) was reported by Endt Endt (1990), whereas in the present work we take a doublet at keV ( ) and keV ( ) into account Ouellet and Singh (2013), as discussed in Section V.3 and shown in Table 2. The first level is associated with a d-wave ( ) resonance at keV, which would likely contribute significantly more to the total rate compared to the second level corresponding to an resonance at 147.2 keV.
VI Summary
The 30Si(p,)31P reaction was previously identified as being critical to our understanding of the abundance anomalies observed in some globular clusters. In the present work, we obtained new strength measurements for two resonances, at keV and keV. For the former, we reported the first resonance strength based on a direct measurement, eV. Using the -ray decay signature, the spin-parity of this state was restricted to . For the latter, we obtained a resonance strength of eV, which has a smaller uncertainty than previous results.
These strength measurements will help us to better understand the resonant component to the 30Si(p,)31P reaction rate. The 501 keV resonance, which was previously thought to play a minor role, is now understood to be the dominant resonance at stellar temperatures between 0.15 GK to 0.6 GK. Conversely, the contribution of the 435-keV resonance is found to be insignificant, contrary to previous results.
New thermonuclear rates for 30Si(p,)31P were presented. The reaction rate at 0.2 GK has been reduced by a factor of 10. Furthermore, the rate uncertainty has been reduced at temperatures near 0.2 GK from a factor of 3.5 to about . The implications of our new rate for the hydrogen burning in globular cluster stars will be explored in forthcoming work.
Acknowledgements.
We would like to thank Sean Hunt for his help with preparing the targets. This work was supported in part by the U.S. DOE under contracts DE-FG02-97ER41041 (UNC) and DE-FG02-97ER41033 (TUNL).References
- Mucciarelli et al. (2012) A. Mucciarelli, M. Bellazzini, R. Ibata, T. Merle, S. C. Chapman, E. Dalessandro, and A. Sollima, Monthly Notices of the Royal Astronomical Society 426, 2889 (2012).
- Cohen and Kirby (2012) J. G. Cohen and E. N. Kirby, The Astrophysical Journal 760, 86 (2012).
- Iliadis et al. (2016) C. Iliadis, A. I. Karakas, N. Prantzos, J. C. Lattanzio, and C. L. Doherty, The Astrophysical Journal 818, 98 (2016).
- Dermigny and Iliadis (2017) J. R. Dermigny and C. Iliadis, The Astrophysical Journal 848, 14 (2017).
- Wang et al. (2017) M. Wang, G. Audi, F. Kondev, W. Huang, S. Naimi, and X. Xu, Chinese Physics C 41, 030003 (2017).
- Harris et al. (1983) M. J. Harris, W. A. Fowler, G. R. Caughlan, and B. A. Zimmerman, Annual Review of Astronomy and Astrophysics 21, 165 (1983), https://doi.org/10.1146/annurev.aa.21.090183.001121 .
- Iliadis et al. (2001) C. Iliadis, J. M. D’Auria, S. Starrfield, W. J. Thompson, and M. Wiescher, The Astrophysical Journal Supplement Series 134, 151 (2001).
- Iliadis et al. (2010a) C. Iliadis, R. Longland, A. Champagne, A. Coc, and R. Fitzgerald, Nuclear Physics A 841, 31 (2010a), the 2010 Evaluation of Monte Carlo based Thermonuclear Reaction Rates.
- Longland et al. (2010) R. Longland, C. Iliadis, A. Champagne, J. Newton, C. Ugalde, A. Coc, and R. Fitzgerald, Nuclear Physics A 841, 1 (2010), the 2010 Evaluation of Monte Carlo based Thermonuclear Reaction Rates.
- Vernotte et al. (1990) J. Vernotte, A. Khendriche, G. Berrier-Ronsin, S. Grafeuille, J. Kalifa, G. Rotbard, R. Tamisier, and B. H. Wildenthal, Phys. Rev. C 41, 1956 (1990).
- Hoogenboom (1958) A. Hoogenboom, Ph.D. thesis, Utrecht University (1958).
- Riihonen et al. (1979) M. Riihonen, J. Keinonen, and A. Anttila, Nuclear Physics A 313, 251 (1979).
- Cesaratto et al. (2010) J. Cesaratto, A. Champagne, T. Clegg, M. Buckner, R. Runkle, and A. Stefan, Nucl. Instrum. Meth. A 623, 888 (2010).
- Note (1) The JN Van de Graaff accelerator is being decommissioned at the time of writing and will be replaced by a new machine.
- Middleton (1984) R. Middleton, Nuclear Instruments and Methods in Physics Research 220, 105 (1984).
- Endt (1990) P. Endt, Nuclear Physics A 521, 1 (1990).
- Paine and Sargood (1979) B. Paine and D. Sargood, Nuclear Physics A 331, 389 (1979).
- Longland et al. (2006) R. Longland, C. Iliadis, and A. Champagne, Nuclear Instruments and … (2006).
- Swartz et al. (2001) K. B. Swartz, D. Visser, and J. M. Baris, Nucl. Instrum. Meth. A 463, 354 (2001).
- Agostinelli et al. (2003) S. Agostinelli et al. (GEANT4), Nucl. Instrum. Meth. A 506, 250 (2003).
- Carson et al. (2010) S. Carson, C. Iliadis, J. Cesaratto, A. Champagne, L. Downen, M. Ivanovic, J. Kelley, R. Longland, J. R. Newton, and G. Rusev, Nuclear Instruments and Methods in Physics Research Section A: Accelerators, Spectrometers, Detectors and Associated Equipment 618, 190 (2010).
- Howard et al. (2013) C. Howard, C. Iliadis, and A. Champagne, Nucl. Instrum. Meth. A 729, 254 (2013).
- Dermigny et al. (2016) J. Dermigny, C. Iliadis, M. Buckner, and K. Kelly, Nucl. Instrum. Meth. A 830, 427 (2016).
- Buckner et al. (2015) M. Q. Buckner, C. Iliadis, K. J. Kelly, L. N. Downen, A. E. Champagne, J. M. Cesaratto, C. Howard, and R. Longland, Phys. Rev. C 91, 015812 (2015).
- Kelly et al. (2017) K. J. Kelly, A. E. Champagne, L. N. Downen, J. R. Dermigny, S. Hunt, C. Iliadis, and A. L. Cooper, Phys. Rev. C 95, 015806 (2017).
- de Neijs et al. (1975) E. de Neijs, G. Haasbroek, M. Meyer, R. Rossouw, and D. Reitmann, Nuclear Physics A 254, 45–62 (1975).
- Barlow and Beeston (1993) R. Barlow and C. Beeston, Comp. Phys. Commun. 77, 219 (1993).
- Smith and Endt (1958) P. B. Smith and P. M. Endt, Phys. Rev. 110, 1442 (1958).
- Hough et al. (1968) J. Hough, Z. du Toit, and W. Mouton, Nuclear Physics A 109, 393 (1968).
- Lyons et al. (1969) P. Lyons, J. Toevs, and D. Sargood, Nuclear Physics A 130, 1 (1969).
- Ouellet and Singh (2013) C. Ouellet and B. Singh, Nuclear Data Sheets 114, 209 (2013).
- Broude et al. (1958a) C. Broude, L. L. Green, and J. C. Willmott, Proceedings of the Physical Society 72, 1097 (1958a).
- Broude et al. (1958b) C. Broude, L. L. Green, and J. C. Willmott, Proceedings of the Physical Society 72, 1115 (1958b).
- Endt and Van der Leun (1967) P. Endt and C. Van der Leun, Nuclear Physics A 105, 1 (1967).
- Iliadis (2015) C. Iliadis, Nuclear Physics of Stars (Wiley-VCH Verlag GmbH & Co. KGaA, 2015).
- Betigeri et al. (1966) M. Betigeri, R. Bock, H. H. Duhm, S. Martin, and R. Stock, Zeitschrift fur Naturforschung - Section A Journal of Physical Sciences 21, 980 (1966), cited By :34.
- Moss (1969) C. Moss, Nuclear Physics A 124, 440 (1969).
- Al-Jadir et al. (1980) M. N. I. Al-Jadir, H. T. Fortune, and D. J. Pullen, Journal of Physics G: Nuclear Physics 6, 731 (1980).
- Ziegler et al. (2010) J. F. Ziegler, M. Ziegler, and J. Biersack, Nucl. Instrum. Meth. B 268, 1818 (2010), 19th International Conference on Ion Beam Analysis.
- Pogrebnyak et al. (2013) I. Pogrebnyak, C. Howard, C. Iliadis, R. Longland, and G. E. Mitchell, Physical Review C 88, 015808 (2013).
- Wolff et al. (1969) A. Wolff, W. Boelhouwer, and P. Endt, Nuclear Physics A 124, 273 (1969).
- Van Rinsvelt and Smith (1964) H. Van Rinsvelt and P. Smith, Physica 30, 59 (1964).
- Van Rinsvelt and Endt (1966) H. Van Rinsvelt and P. Endt, Physica 32, 529 (1966).
- Bornman et al. (1967) C. Bornman, M. Meyer, and D. Reitmann, Nuclear Physics A 99, 337 (1967).
- Iliadis (2019) C. Iliadis, The Physical Review C 99, 065809 (2019).
- Teterin et al. (1974) E. D. Teterin, S. V. Khlebnikov, Y. A. Nemilov, V. S. Romanov, and K. A. Gridnev, Sov. J. Nucl. Phys. 19, 5 (1974).
- De Voigt et al. (1971) M. J. A. De Voigt, D. A. Regenboog, J. Grootenhuis, and C. Van der Leun, Nuclear Physics A 176, 97 (1971).
- Twin et al. (1974) P. J. Twin, E. M. Jayasinghe, G. D. Jones, P. R. G. Lornie, A. Nagel, H. G. Price, and M. F. Thomas, Journal of Physics A: Mathematical, Nuclear and General 7, 1410 (1974).
- Rolfs (1973) C. Rolfs, Nuclear Physics A 217, 29 (1973).
- Iliadis and Wiescher (2004) C. Iliadis and M. Wiescher, Physical Review C 69 (2004).
- Iliadis et al. (2010b) C. Iliadis, R. Longland, A. Champagne, and A. Coc, Nuclear Physics A 841, 251 (2010b), the 2010 Evaluation of Monte Carlo based Thermonuclear Reaction Rates.