The dearth of difference between central and satellite galaxies III. Environmental dependencies of mass-size and mass-structure relations
Abstract
As demonstrated in Paper I, the quenching properties of central and satellite galaxies are quite similar as long as both stellar mass and halo mass are controlled. Here we extend the analysis to the size and bulge-to-total light ratio (B/T) of galaxies. In general central galaxies have size-stellar mass and B/T-stellar mass relations different from satellites. However, the differences are eliminated when halo mass is controlled. We also study the dependence of size and B/T on halo-centric distance and find a transitional stellar mass () at given halo mass (), which is about one fifth of the mass of the central galaxies in halos of mass . The transitional stellar masses for size, B/T and quenched fraction are similar over the whole halo mass range, suggesting a connection between the quenching of star formation and the structural evolution of galaxies. Our analysis further suggests that the classification based on the transitional stellar mass is more fundamental than the central-satellite dichotomy, and provide a more reliable way to understand the environmental effects on galaxy properties. We compare the observational results with the hydro-dynamical simulation, EAGLE and the semi-analytic model, L-GALAXIES. The EAGLE simulation successfully reproduces the similarities of size for centrals and satellites and even , while L-GALAXIES fails to recover the observational results.
Subject headings:
galaxies: general – methods: observational1. Introduction
Thanks to the large photometric and spectroscopic surveys of galaxies at both low and high redshift (e.g. York et al., 2000; Lilly et al., 2007; Abazajian et al., 2009; Grogin et al., 2011), our understanding of the formation and evolution of galaxies is rapidly enriched. One of the most remarkable findings is the strong size evolution of galaxies since redshift of about 2. In particular, while passive galaxies are observed to be 3-5 times smaller in size at redshift greater than 1 with respect to their counterparts of similar stellar mass in the local Universe (Shen et al., 2003; Daddi et al., 2005; Trujillo et al., 2006; Toft et al., 2007; Cimatti et al., 2008; van der Wel et al., 2008; van Dokkum et al., 2008; Buitrago et al., 2008; Damjanov et al., 2011; Raichoor et al., 2012; Mei et al., 2012; Cassata et al., 2013; van der Wel et al., 2014), star-forming galaxies are only about two times smaller in size than their counterparts today. This suggests an entangled evolution of size (or structural properties) and star formation activities of galaxies. Although the main driver of the size evolution of galaxies is still under debate, several suggestions have been made to account for these observational findings. A number of studies have argued that whereas active galaxies grow in size due to in-situ star formation, passive galaxies mainly grow in size due to frequent, minor mergers (Shen et al., 2003; Khochfar & Silk, 2006; Naab et al., 2006; Oser et al., 2010). However, others have argued that larger passive galaxies simply have quenched more recently, an effect known as “progenitor bias” (Newman et al., 2012; Carollo et al., 2013a; Poggianti et al., 2013; Fagioli et al., 2016). A third possibility is that the size evolution is driven by a quasi-adiabatic expansion, which results from the ejection of large amounts of mass from galaxies via, e.g., quasar feedback (Fan et al., 2008; Damjanov et al., 2009; Ragone-Figueroa & Granato, 2011).
In the standard cosmological model of structure formation, dark matter halos assemble hierarchically through mergers of smaller halos, and galaxies are assumed to form in these halos. A natural consequence of this process is that the properties of galaxies can be significantly affected by the formation histories of their host halos. Indeed, galaxies in massive halos are believed to suffer from a series of environmental effects, such as major or minor mergers (e.g. Conselice et al., 2003; Cox et al., 2006; Cheung et al., 2012; Peng et al., 2014), tidal interaction (e.g. Gunn & Gott, 1972; Read et al., 2006), ram-pressure stripping (e.g. Abadi et al., 1999; Wang et al., 2015; Poggianti et al., 2017) or strangulation (Larson et al., 1980; Balogh et al., 2000; van den Bosch et al., 2008a), and galaxy harassment (Farouki & Shapiro, 1982; Moore et al., 1996). These environmental effects may both change the size/structure of a galaxy and prevent its growth by quenching its star formation. Major merger is an effective way to turn gas-rich disk galaxies into passive ellipticals, as shown in numerical simulations (Toomre & Toomre, 1972; Farouki & Shapiro, 1982; Negroponte & White, 1983), while minor mergers may cause size growth of massive early-type galaxies (e.g. De Lucia et al., 2006, 2011; Fontanot et al., 2011; Khochfar et al., 2011; Shankar et al., 2013; Wilman et al., 2013). Strong tidal stripping can effectively strip stars in the outer regions of galaxies (e.g. Read et al., 2006), while galaxy harassment can disturb galaxies and cause enhancements of star formation in the central regions, making the galaxies to be more compact (Fujita, 1998). Ram-pressure stripping and strangulation can remove cold and hot gas for star formation, and inhibit the growth of galaxy sizes by suppressing star formation (van den Bosch et al., 2008a; Peng et al., 2015; Quilis et al., 2017). Some galaxy formation models have invoked parts of these mechanisms and predicted significant dependence of galaxy size on environments (see e.g. Guo et al., 2009; Shankar et al., 2013, 2014).
In many contemporary galaxy formation models, central and satellite galaxies are assumed to experience different environmental processes. Therefore, attempts have been made to constrain these processes by comparing these two populations. By using the SDSS galaxy group catalog of Yang et al. (2007), Weinmann et al. (2009) found that late-type satellite galaxies have smaller radii and larger concentrations than late-type central galaxies of the same stellar mass, but no difference is found for early-type galaxies. In contrast, Lim et al. (2017) found a significant difference between centrals and satellites for both late- and early-type galaxies. Spindler & Wake (2017) found that the mass-size relation for centrals and satellites shows no significant differences. However, when fixing the velocity dispersion, they found significant differences in size and stellar mass between centrals and satellites in the passive population. More recently, Bluck et al. (2019) found that the bulge to total ratio (B/T) of satellites is larger than that of centrals at given stellar mass, and the relation between B/T and halo mass or local over-density for centrals is stronger than that for satellites.
However, there is growing evidence that centrals and satellites may not be as different as usually assumed, in particular with respect to their quenching properties (Hirschmann et al., 2014; Knobel et al., 2015; Wang et al., 2018c, b, d). For example, Wang et al. (2018c), hereafter Paper I, presented a comprehensive comparison of the two populations and found that centrals and satellites show similar quenching properties and a similar prevalence of AGN activity, when the comparison is made at given both stellar and halo mass. In contrast, using the GAMA group catalog of (Robotham et al., 2011), Davies et al. (2019) found clear differences in the fractions of passive galaxies between centrals and satellites, even if both stellar and halo mass are controlled. They also found that the quenched fraction of central galaxies is independent of, or even decreases slightly with, the host halo mass, which is different from the results obtained previously, both from observations and from theoretical models (e.g. Hirschmann et al., 2014; Henriques et al., 2017; Wang et al., 2018c, b). It is unclear what causes these discrepancies. Part of it may be due to the differences in the group finders used, which are known to suffer from errors in central/satellite identification and in the assignment of halo mass. Indeed, as shown in Robotham et al. (2011), their group finder sometimes identifies small galaxies (less than M⊙) as central galaxies of massive galaxy clusters (more massive than M⊙), in conflict with the central galaxy mass - halo mass relation revealed by various methods (e.g. Yang et al., 2003, 2007; Guo et al., 2010; Leauthaud et al., 2012; Moster et al., 2013; Wang et al., 2013; Hudson et al., 2015; Han et al., 2015). The group catalog of Yang et al. (2007) used by Wang et al. (2018c) is not free of errors either (e.g., Campbell et al., 2015).
Given these discrepancies and the potential errors resulting from the use of imperfect galaxy group finders, it is prudent that any results be interpreted with great care. In Wang et al. (2018b), hereafter Paper II, we therefore used a forward modeling to compare the findings of Paper I with two galaxy formation models; the hydrodynamical EAGLE111Evolution and Assembly of GaLaxies and their Environments simulation (Schaye et al., 2015; Crain et al., 2015) and the L-GALAXIES semi-analytical model (Henriques et al., 2015, 2017). In particular, the observational data was compared to mock samples that were constructed from EAGLE and L-GALAXIES and analyzed using the same galaxy group finder as used for the SDSS data. This assures that the model-data comparison is fair, and also allows one to check how imperfections in the group finder impact the results. This analysis showed that L-GALAXIES fails to match the observed trends, while the EAGLE simulation nicely reproduces the observed similarities between centrals and satellites found in Paper I. The analysis presented in Paper II also revealed, though, that the results based on the Yang et al. (2007) group finder can cause centrals and satellites to appear more similar than they really are. This reiterates the conclusion of Campbell et al. (2015), that a proper interpretation of statistics inferred from a galaxy group catalog is best achieved using forward modeling (i.e. running group finders over mock data).
In this paper we extend the analyses in Paper I and Paper II by examining to what extent centrals and satellites are different with regard to their sizes and structural properties, especially when both are controlled for both stellar and halo mass. As in Paper II, we will compare the results obtained from the SDSS galaxy group catalog of Yang et al. (2007) to mock data extracted from the EAGLE simulation and the L-GALAXIES semi-analytical model. This will shed light on whether current galaxy formation models can reproduce the sizes and structural properties of galaxies as function of environment. The two environmental indicators to be considered in this study are host halo mass (i.e., the assigned group mass), and halo-centric distance (i.e., the projected distance from the luminosity-weighted group center).
This paper is organized as follows. In Section 2, we present the observational galaxy sample and group catalog, as well as samples generated from the simulation and semi-analytical model. In Section 3, we study the size and structural properties of galaxies hosted by different halos and at different locations within halos in the observational data. In Section 4, we compare the observational results with galaxy formation models. Finally, we summarize our results and discuss their implications in Section 5.
2. Data
2.1. Galaxies and groups from SDSS
The observational data, such as galaxy and group catalogs, used in this work are the same as in Paper I. Here we only briefly describe the sample selection and parameter measurements. The reader is referred to Paper I for details.
The galaxy sample is originally selected from the NYU-VAGC (Blanton et al., 2005) of the Sloan Digital Sky Survey (SDSS) DR7 (Abazajian et al., 2009). Galaxies are selected to have 1) redshift in the range of , 2) spectroscopic completeness and 3) magnitude limit mag. The first two criteria ensure that the sample galaxies are the same as those in the group catalog constructed by Yang et al. (2007), which provides the basic environmental information, such as central-satellite classification and halo mass ().
The stellar masses used here, taken from the group catalog of Yang et al. (2007), are computed using the empirical relation between the stellar mass-to-light ratio and the colour as given in Bell et al. (2003), adopting a Kroupa (2001) initial mass function. The overall uncertainty in this stellar mass estimate is about 0.15 dex (Bell et al., 2003). The magnitude and colour of galaxies are taken from the NYU-VAGC (Blanton et al., 2005), which is based on SDSS DR4 (Adelman-McCarthy et al., 2006), but includes a set of significant improvements over the original pipelines. The systematic calibration error in the photometry is about - across the sky.
In Yang et al. (2007), the most massive galaxy in a group/cluster is defined as the central galaxy, and the others are satellites. The halo masses of these galaxy groups/clusters are estimated by abundance matching galaxy groups, rank-ordered by the total stellar mass of all member galaxies with -band absolute magnitude brighter than mag, to dark matter halos rank-ordered by halo mass. Dark matter halos are defined to have a mean over-density of 180, and the halo mass is defined to be the mass of dark matter enclosed by the radius within which the mean over-density is 180. The typical uncertainty of halo mass is 0.25 dex (Yang et al., 2007). The center of a group is defined as the luminosity-weighted center of member galaxies. Thus, central galaxies are not always located at the centers of the groups. For each galaxy, we defined a scaled halo-centric radius (), which is the projected distance from the galaxy to the host group center scaled by the virial radius of the host halo (Yang et al., 2007).
In this paper, we investigate two structural properties, the size and morphology, of SDSS galaxies. We adopt the SDSS -band half-light radius () as the size of a galaxy, and the -band bulge-to-light ratio (B/T) to represent the morphology. The two parameters are taken from the UPenn photometric catalog 222http://alan-meert-website-aws.s3-website-us-east-1.amazonaws.com/fit_catalog/index.html (Meert et al., 2015), which contains galaxies from the SDSS DR7 spectroscopic sample. We adopt the measurement with Sérsic bulge + exponential disk model. The model of Sérsic bulge is more flexible than the model of de Vacouleurs bulge, and is likely to be a better choice for both high and low mass galaxies.
Our final sample contains 524,852 galaxies, of which 24% are satellite galaxies. Since this is a flux limited sample, we assign each galaxy a weight to correct for the selection effect, where is the co-moving volume between the minimum redshift and the maximum redshift to which the galaxy can be observed in the flux-limited survey (Blanton & Roweis, 2007), and is the spectroscopic completeness.
2.2. L-GALAXIES and EAGLE
As already mentioned in Section 1, in this paper we follow the methodology of Paper II, and compare the observational results inferred from the SDSS data with predictions from the latest version of the Munich semi-analytical model, L-GALAXIES333http://galformod.mpa-garching.mpg.de/public/LGalaxies/ (Henriques et al., 2015, 2017) and the state-of-the-art hydrodynamic simulation, EAGLE444http://eagle.strw.leidenuniv.nl/ (Crain et al., 2015; Furlong et al., 2015; Schaye et al., 2015; McAlpine et al., 2016). This allows us to fairly and directly interpret the observational results in the context of galaxy formation models. In particular, it tests to what extent the environmental dependence of the size and structural evolution of galaxies in EAGLE and L-GALAXIES is compatible with observations.
Here we briefly describe the two models; the details of the two models and how they are used to construct the mock catalogs used here can be found in Paper II. Semi-analytic models are phenomenological models that take the advantage of empirically motivated prescriptions to describe baryonic processes, such as gas accretion, cooling and heating, star formation, stellar and AGN feedback, and tidal/ram-pressure stripping. As the latest version of the Munich model, L-GALAXIES is built upon the Millennium Simulation (Springel et al., 2005) and employs a Markov Chain Monte Carlo method to explore the high-dimensional parameter space to match the observed galaxy stellar mass function and quenched fraction as a function of stellar mass from redshift of 0 to 3. In L-GALAXIES, the disk size of a galaxy is determined by the angular momentum of its infalling cold gas, while three different mechanisms are invoked to grow a bulge: major mergers, minor mergers and disc instability. In particular, during a major merger the disks of the progenitors are assumed to be completely destroyed and a spheroidal galaxy forms. During a minor merger, the stars from the least massive progenitor are added to the bulge component, while the stellar disk of the more massive progenitor remains unchanged. Note that, in L-GALAXIES, mergers among satellite galaxies are rare; the majority of all mergers are between a central and one of its satellites (Guo et al., 2011; Henriques et al., 2015). Tidal and ram-pressure stripping are assumed to affect only the hot gas surrounding satellite galaxies. Hence, these ‘satellite-specific’ processes do not directly affect the stellar distributions of satellite galaxies, but they do suppress their subsequent growth, and thus their size and structural evolution, by quenching star formation. Because of this specific treatment of processes that only operate on galaxies identified by the code as satellites, the structural properties of centrals and satellites in L-GALAXIES are expected to be shaped by different processes.
The EAGLE simulation adopts advanced smoothed particle hydrodynamics and subgrid models for a series of baryonic processes, such as gas cooling, metal enrichment, black hole growth, and stellar and AGN feedback. Free parameters in the feedback models are tuned by matching the galaxy stellar mass function and the stellar mass-black hole mass relation at (Crain et al., 2015; Furlong et al., 2015). The luminosities and stellar masses of EAGLE galaxies are obtained from their star formation histories by assuming the Chabrier (2003) initial mass function and the Bruzual & Charlot (2003) stellar population model. In contrast to L-GALAXIES, EAGLE adopts the same subgrid prescriptions for both centrals and satellite, and so the differences between these two populations, if any, must be due to their different environments. For instance, environmental effects such as tidal or ram-pressure stripping are treated self-consistently by the gravity and hydrodynamics solvers, without explicitly taking into consideration whether the galaxy is a central or a satellite. Following Paper II, we use the Ref-L100N1504 simulation, which has a box size of 100 Mpc sampled with particles. The simulation contains more than 11,000 dark matter halos with masses above M⊙, and nearly 10,000 galaxies with masses comparable to or larger than that of the Milky Way.
In both L-GALAXIES and EAGLE, halo mass is defined as the mass within the radius corresponding to an overdensity of 200. This halo mass is only slightly different from that defined in Yang et al. (2007) for halos with a NFW profile (Navarro-Frenk-White; Navarro et al., 1996). The stellar masses (recommended) in EAGLE are measured within a typical aperture of 30 kpc, to avoid the contamination of inter-cluster/intra-group light. The mass loss due to this effect is negligible for low-mass galaxies. However, for more massive galaxies the aperture reduces the stellar masses somewhat by cutting out intra-cluster light. At a stellar mass of , the mass loss due to aperture effect is only 0.1 dex. This is only a minor effect for the stellar mass range we are considering, and similar for both centrals and satellites.
The structural parameters for the model galaxies are also taken from the publicly released data. Unfortunately, the publicly available galaxy catalogs L-GALAXIES and EAGLE do not contain both size and bulge-to-total ratio. EAGLE only provides the half-mass radii, while L-GALAXIES only bulge-to-total mass ratios. We should also keep in mind that the parameters for model galaxies are measured in a very different way from those in the observational data. In principle, one may construct the -band images of model galaxies to fully mimic the observation, and measure the structural parameters of model galaxies using the same methods as in the observation. However, this is clearly beyond the scope of the present paper. Thus, we can only present a qualitative comparison between the model predictions and observational data.
To facilitate the model-data comparison, we construct mock galaxy catalogs for both L-GALAXIES and EAGLE that properly account for various observational effects (for details, see Lim et al., 2017, and Paper II). We use the snapshots at (the median redshift of SDSS galaxies used in this paper) to construct our mock catalogs. L-GALAXIES uses a simulation box of on a side, while the box size of the EAGLE simulation is only 100 Mpc. Both are significantly smaller than the volume probed by the SDSS, and we therefore stack duplicates of the original simulation boxes side by side to construct a sufficiently large volume. We then choose a location for the observer, and calculate the redshift and the apparent magnitude for each model galaxy based on its luminosity, distance, and velocity with respect to the observer. Finally, we select a flux-limited sample of galaxies from a light cone covering the redshift range , which is similar to that covered by our SDSS group catalog. All comparisons are based on these catalogs unless specified otherwise. Finally, we note both L-GALAXIES and EAGLE adopt the cosmology (Planck Collaboration et al., 2014b, a), which differs somewhat from the WMAP3 cosmology (Spergel et al., 2007) adopted in the construction of our SDSS group catalog. We note that the different cosmologies is not a concern as long as the results are presented in a self-consistent way, i.e. we use the WMAP3 cosmology for the analysis of the SDSS group catalog, while use cosmology for the analysis of the EAGLE and L-GALAXIES group catalogs.
3. Results
Massive galaxies are typically larger in size and more bulge-dominated than less massive ones (e.g. Simard et al., 2011; van der Wel et al., 2014). Hence, it is important to control the stellar mass when comparing centrals to satellites. We do this by focusing on the - and -B/T relations. Specifically, we investigate whether central and satellite galaxies follow the same relations and how these relations depend on environmental parameters, such as halo mass and halo-centric distance.


3.1. The sizes of centrals and satellites
The left panel of Figure 1 shows the average (in logarithmic space) as a function of stellar mass for centrals (red squares), satellites (blue circles) and all galaxies (black line). Here, and throughout the remainder of this paper, the errors are estimated using 1000 bootstrap samples. Note that the - relations for centrals and satellites are quite similar at (), while significant differences are evident at lower mass, with centrals being systematically larger, by , than satellites of the same stellar mass.
These results may reflect the fact that centrals and satellites have experienced different environmental processes. After all, satellites usually reside in more massive halos than centrals of the same stellar mass, and halo mass is known to be one of the primary environmental parameters regulating galaxy formation (in particular, galaxy quenching). To test the role of halo mass in controlling the sizes of galaxies of given stellar mass, we separate galaxies into six logarithmic bins in halo mass, each with a width of 0.6 dex, and covering the range from M⊙ to M⊙. For each bin, we again compute the - relations for centrals and satellites separately, the results of which are plotted in the top panels in Figure 2. As one can see, the differences between the two populations shown above are significantly reduced or even eliminated: centrals and satellites follow basically the same - relation at a given halo mass. This indicates that the environmental processes that affect the sizes of centrals and satellites are similar, strengthening the proposition that the difference in the - relation for the two populations shown in the left panel of Figure 1 is primarily due to differences in the distributions of halo mass for centrals and satellites.
Figure 3 shows the size distributions of centrals and satellites in different halo mass bins. To make a fair comparison, the two populations are controlled to have the same distribution in stellar mass. As one can see, the size distributions of centrals and satellites are quite similar. For the two intermediate halo mass bins (), the two distributions are almost indistinguishable, as indicated by the probabilities of the Kolmogorov-Smirnov test. For the other three massive halo mass bins, there are small differences between the two populations, which may due to the fact that the halo mass distribution of the two populations are not exactly the same. The results for the most massive bin are noisy, as there are only about 100 galaxies in each population.
Because galaxy size does not seem to depend on whether a galaxy is classified as a central or a satellite, we calculate the average - relations for galaxies in the six halo mass bins without distinguishing centrals and satellites. The result is shown in the left panel of Figure 4. As can be seen, galaxy size decreases with increasing halo mass at the low stellar mass end. This trend becomes less obvious with increasing stellar mass, and almost disappears at M⊙, as indicated by the vertical dashed line. The fact that galaxies of low stellar mass are smaller in more massive halos may be due to a number of processes. For example, more massive halos may be more effective in quenching star formation, particularly for low-mass galaxies (e.g. Peng et al., 2010; Woo et al., 2015; Wang et al., 2018d), probably due to stronger ram-pressure stripping and/or shock-excited heating. Consequently, low-mass galaxies in massive halos may stop growing their sizes due to quenching, and the fading of the disk may cause the half-light radius to shrink (Lilly & Carollo, 2016). Tidal stripping and galaxy harassment can strip stars from the outer stellar disk of low-mass galaxies, making the galaxy more compact and smaller. These two processes primarily depend on the mass density of the host halo, which is similar for halos of different mass.
3.2. The bulge-to-total light ratios of centrals and satellites
In this subsection, we focus on the bulge-to-total light ratio (B/T) to examine how environment impacts bulge formation in centrals and satellites. As in Section 3.1, we first show the mean B/T as a function of stellar mass in the right-hand panel of Figure 1, without separating galaxies into different halo mass bins. As one can see, at the low-mass end satellites tend to harbor more pronounced bulges than centrals. As with the sizes, the differences become weaker with increasing stellar mass and vanish for ().
To reduce effects caused by the difference in host halo masses between centrals and satellites, we show B/T as a function of stellar mass for centrals and satellites separated in six halo mass bins in the bottom panels of Figure 2. We see again that the significant difference between the two populations shown in Figure 1 disappears when the halo mass is controlled. This indicates that both centrals and satellites have similar B/T when both the stellar mass and halo mass are controlled, indicating again that centrals are not special in comparison with satellites as far as their star formation (Paper I and Paper II) and structural properties are concerned.
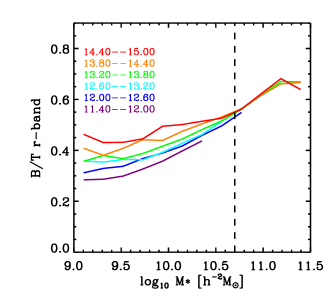
Since there is no significant evidence to suggest that centrals and satellites have systematically different B/T, we calculate the average -B/T relation for galaxies in the six halo mass bins without distinguishing centrals from satellites. This is shown in the right-hand panel of Figure 4. Clearly, galaxies appear to have higher B/T in more massive halos for stellar masses less than M⊙, but the environmental dependence becomes very weak for galaxies above this stellar mass. This is broadly consistent with previous studies (e.g., Bamford et al., 2009; Liu et al., 2019; Bluck et al., 2019).
The B/T distributions of centrals and satellites, controlled to have the same stellar mass distribution, are shown in the bottom group panels of Figure 3. The sub-samples here are exactly the same as those shown in the upper panels. As one can see, centrals and satellites have a similar distribution in B/T for almost all the halo mass bins. Except for the two left panels ( and ), the Kolmogorov-Smirnov test, in each of other panels, shows that the difference between the two populations is statistically insignificant. This strengthens the conclusion that centrals and satellites have similar B/T when both stellar mass and halo mass are controlled.
Combined with the result of Section 3.1, we conclude that centrals and satellites have similar sizes and B/T when both stellar mass and halo mass are controlled. We have also examined other structural properties than B/T, including the Sérsic index, the concentration, defined as the ratio of the radii enclosing 90 and 50 per cent of the galaxy light, and the stellar surface densities inside . All these show the same trends as B/T. As an example, we present the results for the stellar surface density within in the Appendix. Because of this, we therefore only present results based on B/T in the following.
A potential concern is that the results may be contaminated by groups that are not yet relaxed and within which satellites may not have experienced the environmental effects of their current host halos (e.g. Carollo et al., 2013b). A significant fraction of groups (6.0% of groups, corresponding to 15.5% of galaxies) is found to have centrals that have projected halo-centric distances greater than . These groups are more likely to be un-relaxed and including them may reduce the difference between centrals and satellites. We have reexamined our results by excluding these groups, and found no significant changes in our conclusion.
3.3. Dependence on halo-centric radius

Various environmental processes discussed in the literature, such as tidal stripping, ram pressure stripping, strangulation, and harassment, are all expected to depend on the location of a galaxy within its host halo. Indeed, recent analyses have revealed that the quenched population of satellite galaxies becomes more dominant toward the halo center (e.g. Weinmann et al., 2006; van den Bosch et al., 2008a; Wetzel et al., 2012; Kauffmann et al., 2013; Woo et al., 2013). This either indicates that the processes associated with quenching become stronger towards the halo center, and/or it reflects the fact that satellites that reside closer towards the center where accreted earlier (e.g., Gao et al., 2004; Contini et al., 2012; van den Bosch et al., 2016), and have therefore been exposed to quenching-inducing processes for a longer duration. Here we examine how the structural properties depend on the halo-centric distance (). We do not discriminate centrals and satellites, since the two populations intrinsically have no differences in size and structural properties (see Section 3.1 and 3.2).
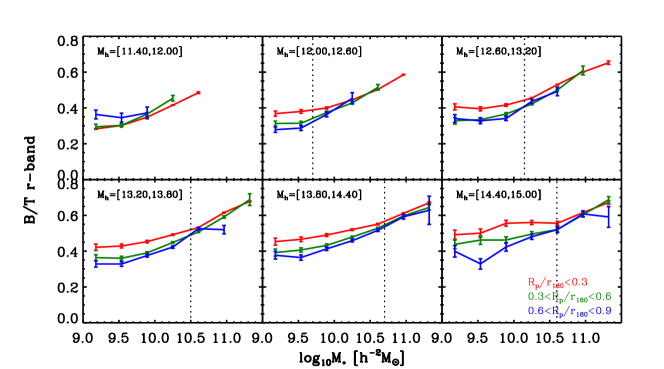
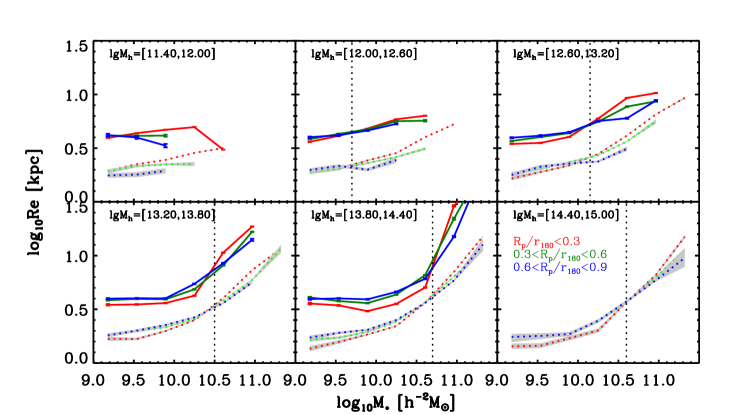
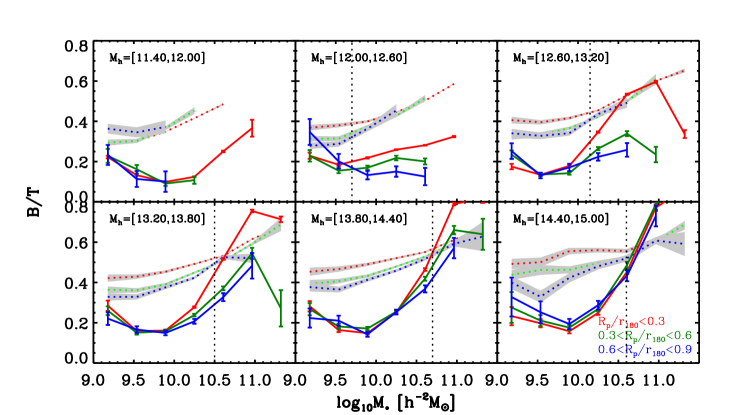
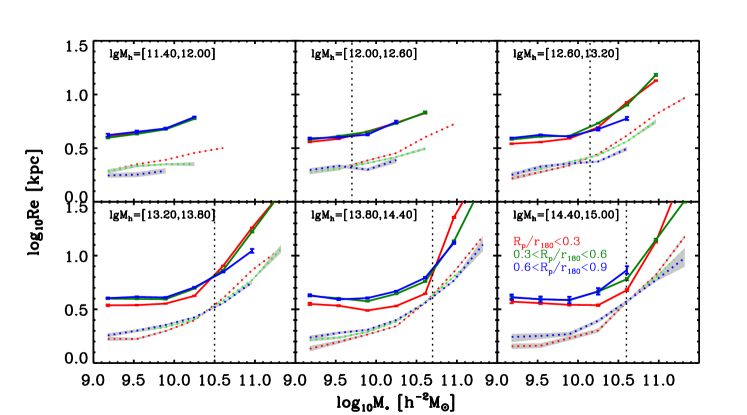
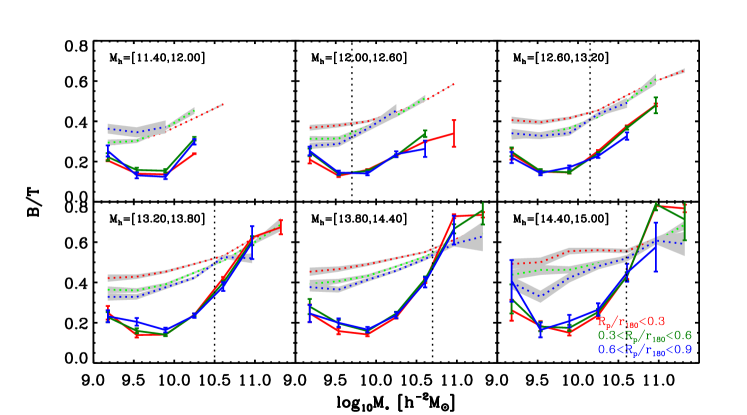
Figure 5 shows the - and -B/T relations for galaxies in three halo-centric distance bins: (red lines), (green lines), and (blue lines), where is the halo virial radius (see Yang et al., 2007). Both the size and B/T depend on over the whole halo mass range.
There are two interesting phenomena. The first one is that the dependences seem to be driven mainly by the innermost bin. This suggests an existence of a critical halo-centric radius, beyond which the mass-size (or mass-B/T) relation does not depend on the halo-centric radius. We search for the critical halo-centric radius (if any) by dividing galaxies into more halo-centric bins. We find that the mass-size (and the mass-B/T) relation does not depend on the halo-centric radius at above 0.5, at least for the three highest halo mass bins. It is not surprising for the existence of critical halo-centric radius, since beyond this radius most of galaxies may have not fallen into the inner region of the halos and therefore have not yet been affected by the environmental effects.
The second one is that the dependence of the size on is different for low and high mass galaxies. Except for the lowest halo mass bin, low-mass galaxies appear to have larger size in the outer region of halos than those of the same mass in the inner region. This trend is reversed at the high end. Similar results can be seen in B/T: at low galaxies at smaller projected halo-centric distances tend to have larger B/T. At the high end, though, this dependence of B/T on vanishes. This motivates us to define a ‘transitional’ stellar mass, , above which the dependence of the size and B/T on is absent or becomes opposite to that at the low stellar mass end. As is evident from Figure 5, increases with halo mass, consistent with the fact that some of the environmental processes are expected to be stronger in more massive halos. Furthermore, comparing the upper and lower sets of panels shows that the size and B/T have similar transitional masses for given halo mass, indicating that the changes in size and B/T may be driven by similar processes.
In Paper I, we found that the quenched fraction of low-mass galaxies strongly depends on , and the dependence becomes weak at the high mass end (see also Wang et al., 2018d). The transitional stellar masses for star formation quenching, taken from Paper I, are shown by the vertical dotted line in each panel of Figure 5. It is interesting to see that for star formation quenching is very similar to those for the size and B/T. This provides strong support that star formation quenching, size and structural evolution of galaxies may be connected. We have also examined the dependence of the inner stellar mass surface density within () on the scaled halo-centric radius at given stellar mass (see Appendix). The behavior of is quite similar to that of B/T (Figure 5), with a similar transitional stellar mass for each halo mass bins.
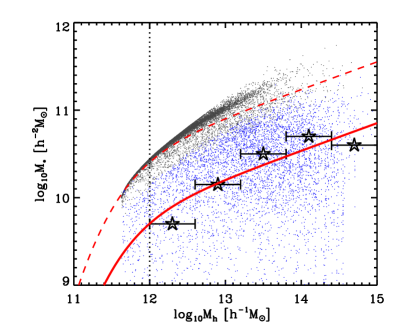
The pentagrams in Figure 6 show the transitional stellar mass as a function of halo mass, with the error bars indicating the halo mass bins. Grey and blue dots indicate centrals and satellites from a sample of 20,000 galaxies randomly selected from the SDSS group catalog, while the red, dashed curve indicates the central mass-halo mass relation obtained by Yang et al. (2009), which is given by
| (1) |
with , , and . For comparison, the red, solid curve is the same relation but shifted downwards by 0.7 dex (i.e., with ), which is a reasonably good fit to the relation, indicating that is approximately one-fifth of the stellar mass of the average central galaxy at the corresponding halo mass. Interestingly, a similar transitional mass was identified by Wang et al. (2018d), who found that the dependence of quenched fraction on halo-centric distance becomes insignificant for galaxies with stellar masses greater than one fifth of the masses of their centrals. From this figure, we can clearly see that the transition behavior is totally determined by satellite galaxies, as central galaxies are all above and far away from the transition curve.
To conclude, our results indicate that environmental effects on the size and structural properties of galaxies, as well as on star formation quenching, depend on where the galaxies are located on the diagram: galaxies located above the relation (the solid, red line in Figure 6), have sizes, quenched fractions and structural properties that are all independent of their location with their host halos. For galaxies below the relation, though, significant dependences on emerge. We will discuss the implications of these findings in Section 5.
3.4. Uncertainties in decomposition and seeing effect
The parameter B/T is highly model dependent. In our analysis above, we have adopted the measurements based on the Sérsic bulge + exponential disk model of the -band image. In their original paper, Meert et al. (2015) have performed the 2-dimensional modelling with other models, such as the de Vacouleurs bulge + exponential disk model, and found that the decomposition results can differ from that based on the Sérsic bulge + exponential disk model. In Paper I, we adopted the B/T measurements based on the de Vacouleurs bulge + exponential disk model from Simard et al. (2011). In order to quantify whether or not our results are sensitive to the different measurements, we have made tests using the B/T measurements of both Simard et al. (2011) and Meert et al. (2015) based on the de Vacouleurs bulge + exponential disk model. Our tests clearly showed that our results are insensitive to the use of different decomposition measurements.
Another important issue is the seeing effect. Even though the size and B/T are measured from the PSF (point spread function) de-convolved light profiles, seeing effect may still influence the accuracy of the measurements of both the size and B/T, especially for small galaxies. To check this effect quantitatively, we have made the same plots shown in Sections 3.1, 3.2 and 3.3 using a sub-sample limited to , where the half-width at half-maximum of the SDSS PSF (0.7 arcsec) corresponds to . We found little change in the results. This is expected, as the seeing effect affects centrals and satellites in a similar way, and for most of the halo mass bins, the comparisons between centrals and satellites are for relatively massive galaxies (M⊙).
4. Comparison with L-GALAXIES and EAGLE
In this section, we compare the observational results presented above with the mock samples generated from L-GALAXIES and EAGLE. Note that for EAGLE galaxies, only half-mass radii are available, and L-GALAXIES only provides bulge to total mass ratio. Because of this, we compare galaxy sizes predicted by EAGLE and the B/T predicted by L-GALAXIES with the observational results, respectively. As described in §2.2, the estimates of the two parameters for model galaxies are different from that for SDSS galaxies, and the comparison between model and observation can only be qualitative. As long as the differences between centrals and satellites are not affected by the differences in the estimators, we can still study whether EAGLE or L-GALAXIES can reproduce the observed similarity between centrals and satellites and the observed characteristic masses in the dependence of the galaxy structure on the environment.
In §4.1, we examine whether the two models can reproduce the similarity between centrals and satellites. In §4.2, we examine the dependence of galaxy size and B/T on halo-centric radius. In both subsections, halo masses and central-satellite classifications are taken directly from the models. In §4.3 we investigate uncertainties that are introduced by the group finder.
4.1. Galaxy size and B/T in galaxy formation models
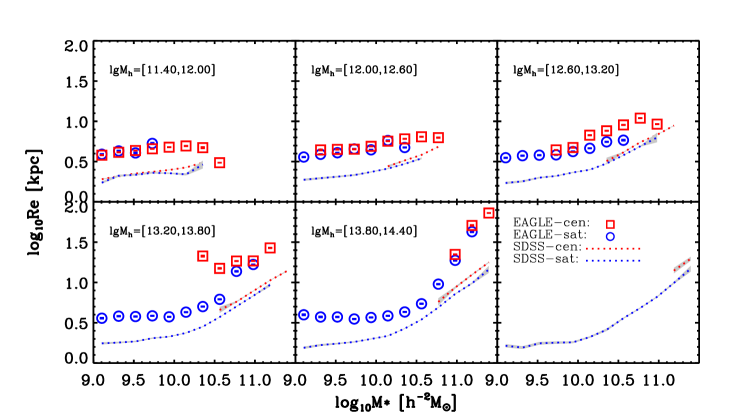
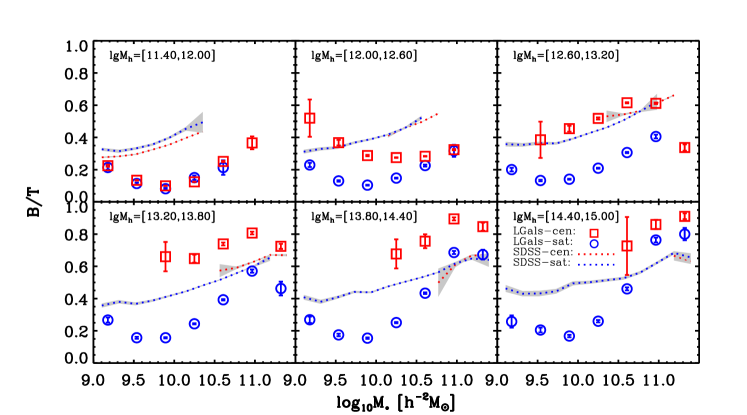
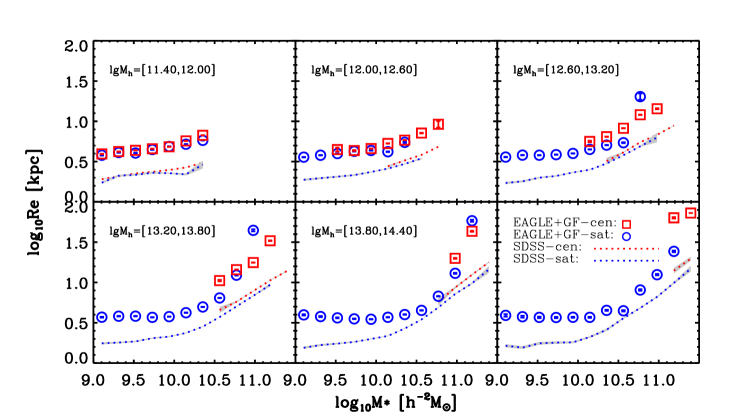
Figure 7 shows the half-mass radius of centrals and satellites from EAGLE as a function of stellar mass in six halo mass bins. Note that we use the same symbol, , to denote the half-mass radius as used previously to indicate the half-light radius of SDSS galaxies. Note that, because of the relatively small volume of the EAGLE simulation, there are too few massive halos to be able to plot any meaningful results for the most massive halo mass bin (). We caution that this also implies that the error bars for the massive EAGLE galaxies are severely underestimated (see Section 2.2 and Paper II).
Overall, Figure 7 reveals good, qualitative agreement with the SDSS results. In particular, for galaxies residing in halos with a mass less than M⊙, the - relation of EAGLE galaxies is nearly parallel to that of SDSS galaxies, albeit with an overall offset of 0.3 dex. The overall offset may be due to different measurement methods and the relatively bright surface brightness limit of the SDSS survey with respect to the EAGLE simulation, as demonstrated in Furlong et al. (2017). In massive halos, the offset becomes larger at both the low and high stellar mass ends. The larger offset at low mass ends may be due to the inadequate resolution, which blurs the boundaries of the low-mass galaxies, while the larger offset at high mass ends may be due to the inclusive of inter-cluster stellar components in the identification of EAGLE galaxies in groups or clusters. More importantly, centrals and satellites in EAGLE appear to have similar - relations over the whole halo mass range. An exception are the low-mass centrals in halos with , which seem to have larger sizes than their corresponding satellites. However, there are only 7 unique (i.e., non-repeating) centrals in these two data points combined, indicating that the true statistical errors are much larger than those estimated from the mock data set, which uses many repetitions of the same simulation box. Hence, this apparent difference between centrals and satellites is not significant.
We have used EAGLE to examine the size distributions of centrals and satellites controlled in stellar mass for a set of halo mass bins. We found that the two populations have a similar distribution for halo masses less than , while for higher halo masses the two size distributions have a small offset. This is consistent with the result shown in Figure 7.
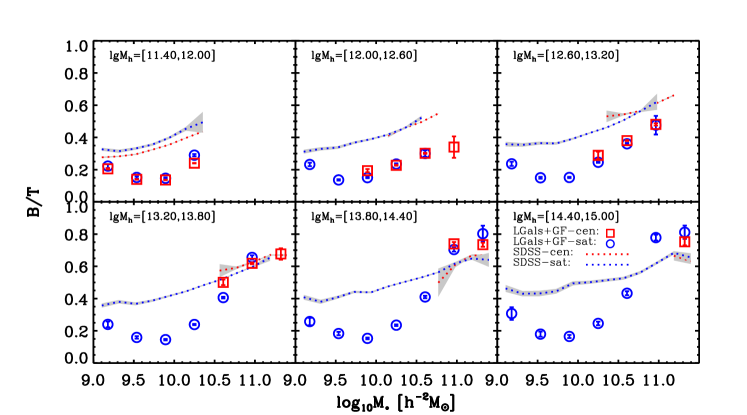
Figure 8 compares the B/T as a function of stellar mass for centrals (red squares) and satellites (blue circles) in L-GALAXIES to the SDSS results (dotted curves, taken from Figure 2). Clearly, the agreement is extremely poor; although L-GALAXIES roughly reproduces the increasing trend of B/T with stellar mass, at least for galaxies with , for less massive galaxies the trend predicted by L-GALAXIES is opposite to that in the data. In addition, typically there are large offsets between the average B/T predicted by L-GALAXIES and that observed for SDSS galaxies. Most importantly, in halos with mass greater than , centrals and satellites in L-GALAXIES typically have very different bulge-to-total ratios at fixed stellar and halo mass, inconsistent with the observational findings of Section 3.2.
We emphasize that for SDSS galaxies, the size and B/T measurements are based on the light distribution, while for the model galaxies they are based on the stellar mass distributions. Although this could explain some of the offsets between the model and data, we are primarily concerned with the differences between centrals and satellites, and these differences should largely be unaffected by such offsets. We therefore conclude that, as a whole, EAGLE successfully reproduces the similar mass-size relations for centrals and satellites, while L-GALAXIES fails to reproduce the similar B/T of the two populations.
4.2. The dependence on halo-centric radius
We now focus on the dependence of the - and -B/T relations on halo-centric radius, and investigate whether current galaxy formation models can reproduce the transitional stellar mass found in Section 3.3. Figure 9 shows the - relation of EAGLE galaxies in three bins of normalized halo-centric distance, . For comparison, we also show the results for SDSS galaxies as dotted lines. Similar to Figure 7, the sizes of EAGLE galaxies are overall 0.3 dex higher than those of SDSS galaxies, almost over the entire stellar and halo mass ranges. Interestingly, the dependence on for EAGLE galaxies is very similar to that for SDSS galaxies: galaxies at smaller halo-centric distances are smaller at the low-mass end and larger at the high-mass end. Most remarkably, the corresponding transitional stellar masses for EAGLE galaxies are almost identical to those for SDSS galaxies over the entire halo mass range probed.
For a given halo mass bin, the difference in the mass-size relation between the two high halo-centric radius bins is insignificant, consistent with the result of SDSS galaxies shown in Figure 5. As in Section 3.3, we have also tried to detect a possible critical halo-centric radius in the EAGLE sample. Such a critical radius was found, at least for halo masses above M⊙, and its value is about , comparable to that observed for SDSS galaxies.
Figure 10 shows the B/T of L-GALAXIES galaxies as a function of stellar mass at different . For comparison, the -B/T relations for SDSS galaxies, taken from Figure 5, are also plotted. In addition to the discrepancy in the overall trend between L-GALAXIES and SDSS galaxies discussed in §4.1, the dependence of the -B/T relation on for L-GALAXIES is also different from that of SDSS galaxies. The B/T of L-GALAXIES galaxies is almost independent of at low , and decreases with increasing at high , which is opposite to the trend seen in the observational results.
4.3. The effect of group finder algorithm
The SDSS groups are identified using the halo-based group finder of Yang et al. (2007), which carries its own uncertainties in central-satellite classification, group member identification and the assignment of halo mass (see e.g. Campbell et al., 2015). In Paper II we therefore carried out a detailed investigation of how errors due to the group finder impact a comparison of centrals and satellites at given stellar and/or halo mass. Here we examine potential errors in the - (for EAGLE) and -B/T (for L-GALAXIES) relations of centrals and satellites caused by imperfections of the group finder. To this end, we apply the group finder to the two mock galaxy catalogs and obtain two mock group catalogs, to which we refer as L-GALAXIES+GF and EAGLE+GF, respectively. For the two catalogs, halo masses are assigned to individual groups on the stellar mass of galaxies, consistent with the halo mass estimate used for SDSS groups.
The results are shown in Figures 11, 12, 13 and 14. After applying the group finder, the results for EAGLE change only very slightly. As before centrals and satellites reveal similar behavior (see Figure 7) and the transitional stellar masses are apparent and very similar to those in Figure 9. Furthermore, the overall trend in the mass-size relation is broadly consistent with that for SDSS galaxies. In contrast, in the case of L-GALAXIES, the application of the group finder drastically reduces the differences between centrals and satellites seen in Figure 8. Moreover, the dependence of B/T on halo-centric distance apparent in Figure 10 also disappears, but the upturn in the mass-B/T relation at the low-mass end remains (Figure 10).
Similar results were also obtained in Paper II, where we demonstrated that the similarity in the quenched fraction between centrals and satellites in EAGLE remains after applying the group finder, while the significant differences in the quenched fraction between centrals and satellites in L-GALAXIES was largely reduced. This indicates that the performance of the group finder depends on galaxy formation models. Indeed, further investigation shows that the application of the group finder to EAGLE yields more accurate halo mass assignments and better central-satellite separations than in the case of L-GALAXIES (see Paper II). Specifically, for EAGLE, the group finder is able to reproduce the true halo mass with an overall offset of 0.03 dex and an overall scatter of 0.2 dex. For L-GALAXIES, on the other hand, the group finder reproduces the true halo mass with a larger offset, 0.09 dex, and a larger scatter, 0.4 dex (see figure 8 in Paper II).
This leaves us with the somewhat uncomfortable situation that there are two possible explanations for the observed similarity between centrals and satellites in the SDSS: either there indeed is no intrinsic difference (at fixed stellar and halo mass), or the group finder has artificially erased an existing difference. And since it is unknown a priori whether L-GALAXIES or EAGLE is a better representation of the real universe, it is unclear which interpretation is more appropriate for SDSS galaxies. In Paper II, we addressed this conundrum by proposing an independent test to check the performance of the group finder. The test calculates the clustering of galaxy groups identified by the group finder as a function of their assigned halo mass and examines whether or not the resulting halo bias is consistent with theoretical predictions. If the group finder performs poorly, the assigned halo masses and member identifications should have large errors, causing the inferred ‘halo-bias’ to deviate from theoretical expectations. This test can be applied not only to galaxy formation models such as L-GALAXIES and EAGLE, but also to the actual SDSS data. Our examination in Paper II clearly shows that the resulting halo bias for EAGLE+GF agrees well with the prediction of Sheth et al. (2001), while the halo bias inferred from L-GALAXIES+GF differs strongly from these theoretical expectation. This is consistent with the direct examination of halo mass assignments: for L-GALAXIES, the halo masses assigned by the group finder carry large errors; in the case of EAGLE the errors are significantly smaller. Applying the ‘halo-bias’ test to the SDSS group catalog, we obtain results that are again in good agreement with the theoretical prediction (Wang et al., 2008). These results suggest that EAGLE is likely to be more reminiscent of the real universe and that the group finder is expected to work well for SDSS galaxies. And although not a watertight argument, this does suggest that centrals and satellites really are very similar at fixed stellar and halo mass.
When applying the group finder to EAGLE and L-GALAXIES, we correct the spectroscopic in-completeness due to the magnitude limit by using the observed luminosity function to account for the contribution of the missing galaxies. However, we do not include the in-completeness due to the fiber collisions555The in-completeness due to fiber collisions can have a significant effect on the richness of individual groups, but does not have a significant impact on the halo mass assignment (Yang et al., 2007). and the photometric uncertainties (or stellar mass uncertainties). Including these would undoubtedly make the performance of group finder worse. We have examined our results by using halo mass assignment based on the -band luminosity for EAGLE+GF, and found that the results shown in Figures 11 and 13 are not affected. This suggests that the uncertainties in converting -band luminosity to stellar mass should not change our results. This is consistent with the finding in Yang et al. (2007) that halo masses based on the -band luminosity and the stellar mass agree with each other (see their figure 10).
5. Summary and Discussion
In Paper I, we found that centrals and satellites essentially have the same quenched fraction as long as both the stellar and halo masses are controlled. The prevalence of optical-selected/radio-selected AGN is also found to be similar for centrals and satellites at given stellar masses. In the present paper, as an extension of Paper I, we investigate the sizes and bulge-to-total light ratios of centrals and satellites to analyze to what extent “central versus satellite” impacts the size and structural properties of galaxies. In particular, we use the SDSS galaxy groups from Yang et al. (2007) to examine the size and bulge-to-total light ratio as functions of galaxy stellar mass, and how the relations are affected by the host halo mass and halo-centric distance. We also compare the observational results with two galaxy formation models, the latest version of a semi-analytic model, L-GALAXIES, and the state-of-the-art hydrodynamical simulation, EAGLE. Our main results can be summarized as follows.
-
•
At a given stellar mass, central galaxies have larger sizes and smaller bulge-to-total ratios than satellites. However, when galaxies are separated into a set of narrow halo mass bins, the differences between centrals and satellites disappear. Thus, centrals and satellites have similar mass-size and mass-B/T relations as long as halo masses are controlled.
-
•
When the stellar mass distribution is controlled to be the same, centrals and satellites in halos of similar mass have similar size and B/T distributions.
-
•
The dependences of size and B/T on halo mass become weaker as stellar mass increases. For galaxies with stellar masses M⊙, neither size nor bulge-to-total ratio shows any dependence on halo mass at fixed stellar mass. At M⊙, sizes decrease and B/T increase with increasing halo mass.
-
•
The mass-size and mass-B/T relations as functions of the normalized halo-centric distance show a transitional stellar mass, below which the galaxy size (B/T) increases (decreases) with increasing halo-centric distance, while above which the dependence is reversed for size and disappears for B/T.
-
•
The transitional stellar masses for the size and B/T are similar to each other and to that seen in the quenched fraction, suggesting that star formation quenching, size and morphology evolution may all have related origins. The transitional stellar mass is about one-fifth of the stellar mass of centrals in the host halos.
-
•
The EAGLE simulation successfully reproduces the similarity of the mass-size relation for centrals and satellites at given halo masses, although the overall size is about 0.3 dex higher than that of SDSS galaxies. In contrast, L-GALAXIES fails to reproduce the similarity of the mass-B/T relation for centrals and satellites.
-
•
The EAGLE simulation successfully reproduces the observed dependence of galaxy size on halo-centric distance. The transitional stellar masses predicted by EAGLE also match well those obtained for SDSS galaxies. The L-GALAXIES fails to reproduce the observed dependence of B/T on halo-centric distance.
Combining these results with those from Paper I, we find that centrals have similar quenched fractions, a similar prevalence of radio/optical-selected AGN, and similar sizes and structural properties as satellites of similar stellar mass, as long as the halo masses are constrained to a narrow range. This indicates that the differences between centrals and satellites found in numerous previous investigations (e.g. van den Bosch et al., 2008b; Pasquali et al., 2009; Peng et al., 2012; Bluck et al., 2016; Spindler & Wake, 2017), mainly reflects that they were not controlled for stellar and/or halo mass.
Based on these findings, two different explanations emerge to account for the observational results. One natural scenario is that “being a central” is not special compared to “being a satellite”; their main difference is that they occupy different regions of the stellar mass-halo mass (or stellar mass-environment) parameter space. Specifically, the environmental processes, such as tidal stripping, ram-pressure stripping and harassment, work in the same way to galaxies of similar stellar mass in the same position of groups or clusters, regardless of “being a central” or “being a satellite”. However, it is also possible that the environmental processes indeed work on centrals and satellites in different ways, while the more massive satellites have been accreted more recently and have no sufficient time to be significantly affected by “satellite-specific” processes. Note that the two scenarios are not necessarily in conflict with each other; both may happen in reality. We discuss the above two scenarios in details respectively below.
The former scenario indicates a stellar mass-dependent environmental processes666Because centrals and satellites are believed to be the same under this scenario, we do not call some of the environmental processes as the “satellite-specific” processes. However, in the second scenario, the “satellite-specific” processes that work only on satellites are assumed to be exist., suggesting that a more fundamental parameter related to the environmental effects is the stellar mass of the galaxies at a given position of a given group, rather than “being a central” or “being a satellite”. Indeed, evidences have been found to reduce the difference between central and massive satellites. For instance, in the observations and hydrodynamical simulations, the hot gas reservoirs of massive satellite galaxies can survive for some considerable time after falling into a cluster (Sun et al., 2007; Jeltema et al., 2008; Weinmann et al., 2010). McCarthy et al. (2008) found that satellites with typical structural and orbital parameters can maintain up to 30 per cent of the initial hot halo gas for up to 10 Gyr. Furthermore, using hydrodynamic simulation, Kereš et al. (2009) found that both centrals and satellites of similar baryonic mass originally acquire most of their baryonic mass through filamentary “cold mode” accretion of gas with similar gas accretion rates at z1. These evidences indicate that massive satellites can acquire cold gas via both cooling of surrounding hot gas reservoirs and direct filamentary “cold mode” accretion, which resemble the properties of centrals. This may be the reason for the similar quenching properties of centrals and satellites when both stellar mass and halo mass are controlled.
Thus, the simple scenario that the effect of environmental processes only depend on the stellar mass of galaxies and their location in groups at given halo mass, appears to be able to explain the similarity of centrals and satellites found in Paper I and this work. This scenario is not unreasonable, because the effects of some of the environmental processes are indeed related to the gravitational potential and/or the structure of the galaxies. For instance, more massive galaxies are not easily disturbed in galaxy-galaxy interaction and/or harassment. Ram pressure stripping is more inefficient for galaxies with higher stellar mass surface density, usually corresponding to more massive galaxies.
The later scenario is that the massive satellites are newly accreted and have not yet been affected by the “satellite-specific” processes. In this case, the origin of the transitional stellar mass is more related to the time since accretion of the satellite galaxies. More massive satellite galaxies are likely to have been accreted more recently, for three reasons; first of all, massive satellites experience strong dynamical friction, and therefore have a limiting ‘lifetime’ before being cannibalized. Secondly, the fact that the satellites are massive, with a stellar mass close to that of the central, means that they cannot (yet) have experienced much tidal stripping. And finally, massive satellites reside in massive subhalos, and, due to the hierarchical nature of structure formation, more massive subhalos are typically accreted later (van den Bosch et al., 2016). Hence, the fact that satellites with a stellar mass above the transitional mass look similar to centrals, with no obvious sign of having been affected by satellite-specific processes, may simply indicate that said processes have not yet had sufficient time to significantly affect the star formation rate or structural properties of the satellites in question. Indeed, tidal and ram-pressure stripping are unlikely to affect the stellar mass of the satellite galaxy until most of the halo has been stripped down to the extent of the stellar body, which can take multiple pericentric passages. Strangulation, i.e., choking off the supply of new gas onto the subhalo, only affects the star formation rate of a satellite galaxy once it has run out of its cold gas supply, which can also take several Gyrs. Within this picture, massive satellite simply look identical to centrals simply because they were centrals until fairly recent.
Although both of the suggested scenarios can explain the similarity of centrals and satellites found in Paper I and this work, it is unclear which one is more likely to be real. Fortunately, the fact that galaxies with do show a dependence of size on halo-centric radius may provide clues. Actually, the dependence of galaxy size on environment have been found in decades, and minor merger has been proposed to explain the observational result that galaxies in dense environment are larger than their counterparts in less dense environment (e.g. Cooper et al., 2012; Strazzullo et al., 2013; Delaye et al., 2014; Yoon et al., 2017; Huang et al., 2018). This does not seem to support the second scenario that the massive satellites are accreted more recently.
Neglecting which scenario is more likely to be real, an interesting implication of our results is that the commonly adopted ‘split’ in centrals and satellite galaxies, which is often used to assess the importance of environment on galaxy formation and evolution may not be optimal. In this work, we find that galaxies below the transitional stellar mass, roughly one-fifth of that of the (average) central, have quenched fractions, sizes and bulge-to-total ratios that depend on halo-centric radius, indicating that they are experiencing environmentally-induced changes to their properties. Above the transitional stellar mass, galaxy properties show virtually no dependence on halo-centric distance777An exception is galaxy size, which becomes larger at smaller halo-centric distances; this trend is opposite to that for galaxies below the transitional stellar mass.. According to this, we argue instead that splitting the galaxy population based on the transitional stellar mass identified here might be more fundamental, in that it more accurately separates those galaxies that have been affected by satellite-specific processes from those that have not.
An intriguing aspect of the transitional stellar mass is that it is basically the same for quenching properties, galaxy sizes, and structural properties such as the dominance of the bulge. There is no shortage of suggested explanations for this. For instance, it has been suggested that the quenching of star formation is directly associated with a morphological transformation (e.g. Fujita, 1998; Read et al., 2006; Brennan et al., 2015; Pawlik et al., 2018), or with the ‘apparent’ evolution in galaxy size due to fading of the disk (e.g., Weinmann et al., 2009). Others have suggested that quenching preferentially occurs in more compact galaxies (e.g. Fang et al., 2013; Barro et al., 2017; Wang et al., 2018a; Socolovsky et al., 2019; Wang et al., 2019), possibly due a shorter gas depletion time and/or enhanced feedback from more massive black holes in more compact star forming galaxies. A subtly different idea is that quenched galaxies have formed earlier, when the Universe was denser resulting in more compact galaxies (e.g. Carollo et al., 2013a; Díaz-García et al., 2019). Finally, Lilly & Carollo (2016) have pointed out that the close link between quenching and evolution in structural properties does not necessarily imply a physical causation; it can simply arise from a combination of a mass-dependent quenching law and the observed evolution of the size-mass relation for star-forming galaxies.
To fully uncover the origin of the transitional stellar mass, there is an obvious path forward. As we have demonstrated, the hydrodynamical EAGLE simulation accurately reproduces the trends identified in this paper. In particular, it reveals the same transitional stellar mass as function of halo mass as in the SDSS data, and even reveals the same, opposite trends between halo-centric radius and galaxy size above and below this transitional stellar mass. A detailed study of the evolution of galaxies in the EAGLE simulation therefore should be able to shed important light on how galaxies quench, and evolve in size and bulge-to-total ratio. Contrasting this with what happens in the semi-analytical model L-GALAXIES, which fails to reproduce many of the trends presented here, will also help in furthering our understanding of the intricate processes that underly galaxy formation and evolution. In a forthcoming paper we will follow this approach and analyze the detailed evolution of galaxies in both the EAGLE simulations and the L-GALAXIES semi-analytical model. Finally, we also advocate comparing the SDSS results presented here and in Paper I with other models for galaxy formation, including state-of-the-art hydrodynamical simulations such as Illustris-TNG (Pillepich et al., 2018) and Horizon-AGN (Dubois et al., 2014), semi-analytical models such as GALFORM (Cole et al., 2000) and Galacticus (Benson, 2012), and even empirical models such as EMERGE (Moster et al., 2018) and the UniverseMachine (Behroozi et al., 2019).
References
- Abadi et al. (1999) Abadi, M. G., Moore, B., & Bower, R. G. 1999, MNRAS, 308, 947
- Abazajian et al. (2009) Abazajian, K. N., Adelman-McCarthy, J. K., Agüeros, M. A., et al. 2009, ApJS, 182, 543
- Adelman-McCarthy et al. (2006) Adelman-McCarthy, J. K., Agüeros, M. A., Allam, S. S., et al. 2006, ApJS, 162, 38
- Balogh et al. (2000) Balogh, M. L., Navarro, J. F., & Morris, S. L. 2000, ApJ, 540, 113
- Bamford et al. (2009) Bamford, S. P., Nichol, R. C., Baldry, I. K., et al. 2009, MNRAS, 393, 1324
- Barro et al. (2017) Barro, G., Faber, S. M., Koo, D. C., et al. 2017, ApJ, 840, 47
- Behroozi et al. (2019) Behroozi, P., Wechsler, R. H., Hearin, A. P., & Conroy, C. 2019, MNRAS, 1134
- Bell et al. (2003) Bell, E. F., McIntosh, D. H., Katz, N., & Weinberg, M. D. 2003, ApJS, 149, 289
- Benson (2012) Benson, A. J. 2012, New Astronomy, 17, 175
- Blanton & Roweis (2007) Blanton, M. R., & Roweis, S. 2007, AJ, 133, 734
- Blanton et al. (2005) Blanton, M. R., Schlegel, D. J., Strauss, M. A., et al. 2005, AJ, 129, 2562
- Bluck et al. (2016) Bluck, A. F. L., Mendel, J. T., Ellison, S. L., et al. 2016, MNRAS, 462, 2559
- Bluck et al. (2019) Bluck, A. F. L., Bottrell, C., Teimoorinia, H., et al. 2019, MNRAS, 485, 666
- Brennan et al. (2015) Brennan, R., Pandya, V., Somerville, R. S., et al. 2015, MNRAS, 451, 2933
- Bruzual & Charlot (2003) Bruzual, G., & Charlot, S. 2003, MNRAS, 344, 1000
- Buitrago et al. (2008) Buitrago, F., Trujillo, I., Conselice, C. J., et al. 2008, ApJ, 687, L61
- Campbell et al. (2015) Campbell, D., van den Bosch, F. C., Hearin, A., et al. 2015, MNRAS, 452, 444
- Carollo et al. (2013a) Carollo, C. M., Bschorr, T. J., Renzini, A., et al. 2013a, ApJ, 773, 112
- Carollo et al. (2013b) Carollo, C. M., Cibinel, A., Lilly, S. J., et al. 2013b, ApJ, 776, 71
- Cassata et al. (2013) Cassata, P., Giavalisco, M., Williams, C. C., et al. 2013, ApJ, 775, 106
- Chabrier (2003) Chabrier, G. 2003, PASP, 115, 763
- Cheung et al. (2012) Cheung, E., Faber, S. M., Koo, D. C., et al. 2012, ApJ, 760, 131
- Cimatti et al. (2008) Cimatti, A., Cassata, P., Pozzetti, L., et al. 2008, A&A, 482, 21
- Cole et al. (2000) Cole, S., Lacey, C. G., Baugh, C. M., & Frenk, C. S. 2000, MNRAS, 319, 168
- Conselice et al. (2003) Conselice, C. J., Chapman, S. C., & Windhorst, R. A. 2003, ApJ, 596, L5
- Contini et al. (2012) Contini, E., De Lucia, G., & Borgani, S. 2012, MNRAS, 420, 2978
- Cooper et al. (2012) Cooper, M. C., Griffith, R. L., Newman, J. A., et al. 2012, MNRAS, 419, 3018
- Cox et al. (2006) Cox, T. J., Jonsson, P., Primack, J. R., & Somerville, R. S. 2006, MNRAS, 373, 1013
- Crain et al. (2015) Crain, R. A., Schaye, J., Bower, R. G., et al. 2015, MNRAS, 450, 1937
- Daddi et al. (2005) Daddi, E., Renzini, A., Pirzkal, N., et al. 2005, ApJ, 626, 680
- Damjanov et al. (2009) Damjanov, I., McCarthy, P. J., Abraham, R. G., et al. 2009, ApJ, 695, 101
- Damjanov et al. (2011) Damjanov, I., Abraham, R. G., Glazebrook, K., et al. 2011, ApJ, 739, L44
- Davies et al. (2019) Davies, L. J. M., Robotham, A. S. G., Lagos, C. d. P., et al. 2019, MNRAS, 483, 5444
- De Lucia et al. (2011) De Lucia, G., Fontanot, F., Wilman, D., & Monaco, P. 2011, MNRAS, 414, 1439
- De Lucia et al. (2006) De Lucia, G., Springel, V., White, S. D. M., Croton, D., & Kauffmann, G. 2006, MNRAS, 366, 499
- Delaye et al. (2014) Delaye, L., Huertas-Company, M., Mei, S., et al. 2014, MNRAS, 441, 203
- Díaz-García et al. (2019) Díaz-García, L. A., Cenarro, A. J., López-Sanjuan, C., et al. 2019, arXiv e-prints
- Dubois et al. (2014) Dubois, Y., Pichon, C., Welker, C., et al. 2014, MNRAS, 444, 1453
- Fagioli et al. (2016) Fagioli, M., Carollo, C. M., Renzini, A., et al. 2016, ApJ, 831, 173
- Fan et al. (2008) Fan, L., Lapi, A., De Zotti, G., & Danese, L. 2008, ApJ, 689, L101
- Fang et al. (2013) Fang, J. J., Faber, S. M., Koo, D. C., & Dekel, A. 2013, ApJ, 776, 63
- Farouki & Shapiro (1982) Farouki, R. T., & Shapiro, S. L. 1982, ApJ, 259, 103
- Fontanot et al. (2011) Fontanot, F., De Lucia, G., Wilman, D., & Monaco, P. 2011, MNRAS, 416, 409
- Fujita (1998) Fujita, Y. 1998, ApJ, 509, 587
- Furlong et al. (2015) Furlong, M., Bower, R. G., Theuns, T., et al. 2015, MNRAS, 450, 4486
- Furlong et al. (2017) Furlong, M., Bower, R. G., Crain, R. A., et al. 2017, MNRAS, 465, 722
- Gao et al. (2004) Gao, L., White, S. D. M., Jenkins, A., Stoehr, F., & Springel, V. 2004, MNRAS, 355, 819
- Grogin et al. (2011) Grogin, N. A., Kocevski, D. D., Faber, S. M., et al. 2011, ApJS, 197, 35
- Gunn & Gott (1972) Gunn, J. E., & Gott, III, J. R. 1972, ApJ, 176, 1
- Guo et al. (2010) Guo, Q., White, S., Li, C., & Boylan-Kolchin, M. 2010, MNRAS, 404, 1111
- Guo et al. (2011) Guo, Q., White, S., Boylan-Kolchin, M., et al. 2011, MNRAS, 413, 101
- Guo et al. (2009) Guo, Y., McIntosh, D. H., Mo, H. J., et al. 2009, MNRAS, 398, 1129
- Han et al. (2015) Han, J., Eke, V. R., Frenk, C. S., et al. 2015, MNRAS, 446, 1356
- Henriques et al. (2015) Henriques, B. M. B., White, S. D. M., Thomas, P. A., et al. 2015, MNRAS, 451, 2663
- Henriques et al. (2017) —. 2017, MNRAS, 469, 2626
- Hirschmann et al. (2014) Hirschmann, M., De Lucia, G., Wilman, D., et al. 2014, MNRAS, 444, 2938
- Huang et al. (2018) Huang, S., Leauthaud, A., Greene, J., et al. 2018, MNRAS, 480, 521
- Hudson et al. (2015) Hudson, M. J., Gillis, B. R., Coupon, J., et al. 2015, MNRAS, 447, 298
- Jeltema et al. (2008) Jeltema, T. E., Binder, B., & Mulchaey, J. S. 2008, ApJ, 679, 1162
- Kauffmann et al. (2013) Kauffmann, G., Li, C., Zhang, W., & Weinmann, S. 2013, MNRAS, 430, 1447
- Kereš et al. (2009) Kereš, D., Katz, N., Fardal, M., Davé, R., & Weinberg, D. H. 2009, MNRAS, 395, 160
- Khochfar & Silk (2006) Khochfar, S., & Silk, J. 2006, ApJ, 648, L21
- Khochfar et al. (2011) Khochfar, S., Emsellem, E., Serra, P., et al. 2011, MNRAS, 417, 845
- Knobel et al. (2015) Knobel, C., Lilly, S. J., Woo, J., & Kovač, K. 2015, ApJ, 800, 24
- Kroupa (2001) Kroupa, P. 2001, MNRAS, 322, 231
- Larson et al. (1980) Larson, R. B., Tinsley, B. M., & Caldwell, C. N. 1980, ApJ, 237, 692
- Leauthaud et al. (2012) Leauthaud, A., Tinker, J., Bundy, K., et al. 2012, ApJ, 744, 159
- Lilly & Carollo (2016) Lilly, S. J., & Carollo, C. M. 2016, ApJ, 833, 1
- Lilly et al. (2007) Lilly, S. J., Le Fèvre, O., Renzini, A., et al. 2007, ApJS, 172, 70
- Lim et al. (2017) Lim, S. H., Mo, H. J., Lu, Y., Wang, H., & Yang, X. 2017, MNRAS, 470, 2982
- Liu et al. (2019) Liu, C., Hao, L., Wang, H., & Yang, X. 2019, ApJ, 878, 69
- McAlpine et al. (2016) McAlpine, S., Helly, J. C., Schaller, M., et al. 2016, Astronomy and Computing, 15, 72
- McCarthy et al. (2008) McCarthy, I. G., Frenk, C. S., Font, A. S., et al. 2008, MNRAS, 383, 593
- Meert et al. (2015) Meert, A., Vikram, V., & Bernardi, M. 2015, MNRAS, 446, 3943
- Mei et al. (2012) Mei, S., Stanford, S. A., Holden, B. P., et al. 2012, ApJ, 754, 141
- Moore et al. (1996) Moore, B., Katz, N., Lake, G., Dressler, A., & Oemler, A. 1996, Nature, 379, 613
- Moster et al. (2013) Moster, B. P., Naab, T., & White, S. D. M. 2013, MNRAS, 428, 3121
- Moster et al. (2018) Moster, B. P., Naab, T., & White, S. D. M. 2018, MNRAS, 477, 1822
- Naab et al. (2006) Naab, T., Khochfar, S., & Burkert, A. 2006, ApJ, 636, L81
- Navarro et al. (1996) Navarro, J. F., Frenk, C. S., & White, S. D. M. 1996, ApJ, 462, 563
- Negroponte & White (1983) Negroponte, J., & White, S. D. M. 1983, MNRAS, 205, 1009
- Newman et al. (2012) Newman, A. B., Ellis, R. S., Bundy, K., & Treu, T. 2012, ApJ, 746, 162
- Oser et al. (2010) Oser, L., Ostriker, J. P., Naab, T., Johansson, P. H., & Burkert, A. 2010, ApJ, 725, 2312
- Pasquali et al. (2009) Pasquali, A., van den Bosch, F. C., Mo, H. J., Yang, X., & Somerville, R. 2009, MNRAS, 394, 38
- Pawlik et al. (2018) Pawlik, M. M., Taj Aldeen, L., Wild, V., et al. 2018, MNRAS, 477, 1708
- Peng et al. (2015) Peng, Y., Maiolino, R., & Cochrane, R. 2015, Nature, 521, 192
- Peng et al. (2012) Peng, Y.-j., Lilly, S. J., Renzini, A., & Carollo, M. 2012, ApJ, 757, 4
- Peng et al. (2014) —. 2014, ApJ, 790, 95
- Peng et al. (2010) Peng, Y.-j., Lilly, S. J., Kovač, K., et al. 2010, ApJ, 721, 193
- Pillepich et al. (2018) Pillepich, A., Springel, V., Nelson, D., et al. 2018, MNRAS, 473, 4077
- Planck Collaboration et al. (2014a) Planck Collaboration, Ade, P. A. R., Aghanim, N., et al. 2014a, A&A, 571, A1
- Planck Collaboration et al. (2014b) —. 2014b, A&A, 571, A16
- Poggianti et al. (2013) Poggianti, B. M., Calvi, R., Bindoni, D., et al. 2013, ApJ, 762, 77
- Poggianti et al. (2017) Poggianti, B. M., Moretti, A., Gullieuszik, M., et al. 2017, ApJ, 844, 48
- Quilis et al. (2017) Quilis, V., Planelles, S., & Ricciardelli, E. 2017, MNRAS, 469, 80
- Ragone-Figueroa & Granato (2011) Ragone-Figueroa, C., & Granato, G. L. 2011, MNRAS, 414, 3690
- Raichoor et al. (2012) Raichoor, A., Mei, S., Stanford, S. A., et al. 2012, ApJ, 745, 130
- Read et al. (2006) Read, J. I., Wilkinson, M. I., Evans, N. W., Gilmore, G., & Kleyna, J. T. 2006, MNRAS, 366, 429
- Robotham et al. (2011) Robotham, A. S. G., Norberg, P., Driver, S. P., et al. 2011, MNRAS, 416, 2640
- Schaye et al. (2015) Schaye, J., Crain, R. A., Bower, R. G., et al. 2015, MNRAS, 446, 521
- Schlegel et al. (1998) Schlegel, D. J., Finkbeiner, D. P., & Davis, M. 1998, ApJ, 500, 525
- Shankar et al. (2013) Shankar, F., Marulli, F., Bernardi, M., et al. 2013, MNRAS, 428, 109
- Shankar et al. (2014) Shankar, F., Mei, S., Huertas-Company, M., et al. 2014, MNRAS, 439, 3189
- Shen et al. (2003) Shen, S., Mo, H. J., White, S. D. M., et al. 2003, MNRAS, 343, 978
- Sheth et al. (2001) Sheth, R. K., Mo, H. J., & Tormen, G. 2001, MNRAS, 323, 1
- Simard et al. (2011) Simard, L., Mendel, J. T., Patton, D. R., Ellison, S. L., & McConnachie, A. W. 2011, ApJS, 196, 11
- Socolovsky et al. (2019) Socolovsky, M., Maltby, D. T., Hatch, N. A., et al. 2019, MNRAS, 482, 1640
- Spergel et al. (2007) Spergel, D. N., Bean, R., Doré, O., et al. 2007, ApJS, 170, 377
- Spindler & Wake (2017) Spindler, A., & Wake, D. 2017, MNRAS, 468, 333
- Springel et al. (2005) Springel, V., White, S. D. M., Jenkins, A., et al. 2005, Nature, 435, 629
- Strazzullo et al. (2013) Strazzullo, V., Gobat, R., Daddi, E., et al. 2013, ApJ, 772, 118
- Sun et al. (2007) Sun, M., Jones, C., Forman, W., et al. 2007, ApJ, 657, 197
- Toft et al. (2007) Toft, S., van Dokkum, P., Franx, M., et al. 2007, ApJ, 671, 285
- Toomre & Toomre (1972) Toomre, A., & Toomre, J. 1972, ApJ, 178, 623
- Trujillo et al. (2006) Trujillo, I., Förster Schreiber, N. M., Rudnick, G., et al. 2006, ApJ, 650, 18
- van den Bosch et al. (2008a) van den Bosch, F. C., Aquino, D., Yang, X., et al. 2008a, MNRAS, 387, 79
- van den Bosch et al. (2008b) —. 2008b, MNRAS, 387, 79
- van den Bosch et al. (2016) van den Bosch, F. C., Jiang, F., Campbell, D., & Behroozi, P. 2016, MNRAS, 455, 158
- van der Wel et al. (2008) van der Wel, A., Holden, B. P., Zirm, A. W., et al. 2008, ApJ, 688, 48
- van der Wel et al. (2014) van der Wel, A., Franx, M., van Dokkum, P. G., et al. 2014, ApJ, 788, 28
- van Dokkum et al. (2008) van Dokkum, P. G., Franx, M., Kriek, M., et al. 2008, ApJ, 677, L5
- Wang et al. (2018a) Wang, E., Kong, X., & Pan, Z. 2018a, ApJ, 865, 49
- Wang et al. (2019) Wang, E., Lilly, S. J., Pezzulli, G., & Matthee, J. 2019, ApJ, 877, 132
- Wang et al. (2018b) Wang, E., Wang, H., Mo, H., et al. 2018b, ApJ, 864, 51
- Wang et al. (2015) Wang, E., Wang, J., Kauffmann, G., Józsa, G. I. G., & Li, C. 2015, MNRAS, 449, 2010
- Wang et al. (2018c) Wang, E., Wang, H., Mo, H., et al. 2018c, ApJ, 860, 102
- Wang et al. (2018d) Wang, H., Mo, H. J., Chen, S., et al. 2018d, ApJ, 852, 31
- Wang et al. (2013) Wang, L., Farrah, D., Oliver, S. J., et al. 2013, MNRAS, 431, 648
- Wang et al. (2008) Wang, Y., Yang, X., Mo, H. J., et al. 2008, ApJ, 687, 919
- Weinmann et al. (2009) Weinmann, S. M., Kauffmann, G., van den Bosch, F. C., et al. 2009, MNRAS, 394, 1213
- Weinmann et al. (2010) Weinmann, S. M., Kauffmann, G., von der Linden, A., & De Lucia, G. 2010, MNRAS, 406, 2249
- Weinmann et al. (2006) Weinmann, S. M., van den Bosch, F. C., Yang, X., & Mo, H. J. 2006, MNRAS, 366, 2
- Wetzel et al. (2012) Wetzel, A. R., Tinker, J. L., & Conroy, C. 2012, MNRAS, 424, 232
- Wilman et al. (2013) Wilman, D. J., Fontanot, F., De Lucia, G., Erwin, P., & Monaco, P. 2013, MNRAS, 433, 2986
- Woo et al. (2015) Woo, J., Dekel, A., Faber, S. M., & Koo, D. C. 2015, MNRAS, 448, 237
- Woo et al. (2013) Woo, J., Dekel, A., Faber, S. M., et al. 2013, MNRAS, 428, 3306
- Yang et al. (2003) Yang, X., Mo, H. J., & van den Bosch, F. C. 2003, MNRAS, 339, 1057
- Yang et al. (2009) —. 2009, ApJ, 695, 900
- Yang et al. (2007) Yang, X., Mo, H. J., van den Bosch, F. C., et al. 2007, ApJ, 671, 153
- Yoon et al. (2017) Yoon, Y., Im, M., & Kim, J.-W. 2017, ApJ, 834, 73
- York et al. (2000) York, D. G., Adelman, J., Anderson, Jr., J. E., et al. 2000, AJ, 120, 1579
Appendix A The examination of the stellar surface density within for centrals and satellites.
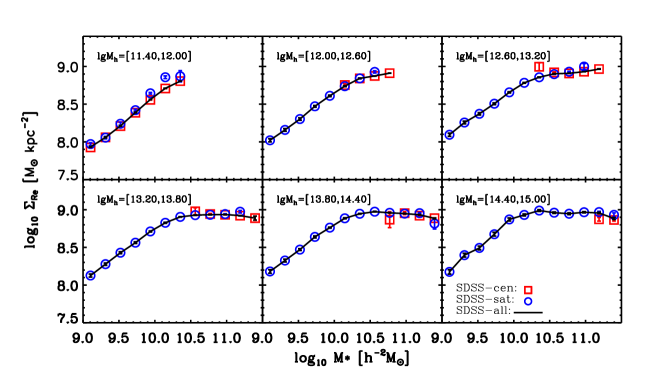
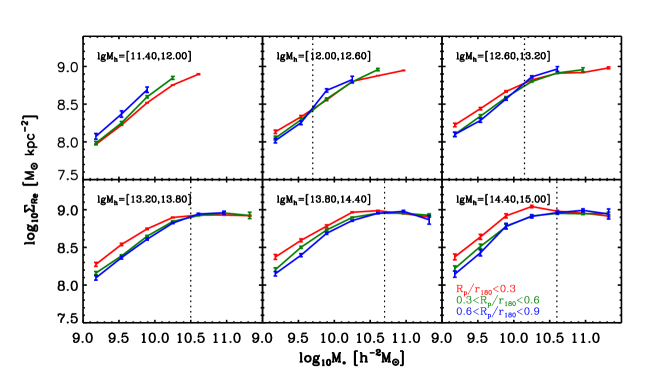
In the main text, we have compared the half-light radius and the bulge-to-light ratio of centrals and satellites with both stellar mass and halo mass controlled. We found that centrals and satellites in halos of a given mass have similar mass-size and mass-B/T relations. However, the measurement of B/T may depend on the model of the bulge assumed in the decomposition. Here, we present the comparison between centrals and satellites in the same way as in Sections 3.2 and 3.3, but using stellar surface density within the effective radius, . This parameter can be estimated without an assumed model for the light profile of a galaxy.
The is calculated by directly integrating the light profiles from the innermost point out to , adopting the relation between (ratio between stellar mass and -band luminosity) and the rest-frame color from Fang et al. (2013): . In practice, we generate the cumulative flux profile at a series of radii and obtain the total flux within by the cubic spline interpolation for the and bands, based on the azimuthally averaged radial surface brightness profile (also known as ProfMean in the output of the SDSS pipeline). The -band luminosity and color are corrected to the rest frame Blanton & Roweis (2007) and for Galactic extinction (Schlegel et al., 1998). The ProfMean provided by the SDSS pipeline is based on the light profile in circular aperture. To obtain the in a consistent way, we adopt the from the NYU-VAGC catalog (Blanton et al., 2005), which is measured also with circular aperture.
The top group panel of Figure 15 shows the mean relation for centrals and satellites at the six halo mass bins. As one can see, when both halo mass and stellar mass are controlled, centrals and satellites show similar -dependence of . The bottom group panel of Figure 15 shows the relation for galaxies (including both centrals and satellites) in three bins of halo-centric radius and six bins of halo mass. The results here are similar to those shown in Figure 5. The relation depends on at stellar mass below the transitional stellar mass, while this dependence disappears for more massive galaxies. All these results are in good agreement with those presented in Section 3.