H.E.S.S. and Fermi-LAT observations of PSR B1259–63/
LS 2883 during its 2014 and 2017 periastron passages
Abstract
Context. PSR B1259–63/LS 2883 is a gamma-ray binary system consisting of a pulsar in an eccentric orbit around a bright Oe stellar-type companion star that features a dense circumstellar disc. The bright broad-band emission observed at phases close to periastron offers a unique opportunity to study particle acceleration and radiation processes in binary systems. Observations at gamma-ray energies constrain these processes through variability and spectral characterisation studies.
Aims. The high- and very-high-energy (HE, VHE) gamma-ray emission from PSR B1259–63/LS 2883 around the times of its periastron passage are characterised, in particular, at the time of the HE gamma-ray flares reported to have occurred in 2011, 2014, and 2017. Short-term and average emission characteristics of PSR B1259–63/LS 2883 are determined. Super-orbital variability is searched for in order to investigate possible cycle-to-cycle VHE flux changes due to different properties of the companion star’s circumstellar disc and/or the conditions under which the HE gamma-ray flares develop.
Methods. Spectra and light curves were derived from observations conducted with the H.E.S.S.-II array in 2014 and 2017. Phase-folded light curves are compared with the results obtained in 2004, 2007, and 2011. Fermi-LAT observations from 2010/11, 2014, and 2017 are analysed.
Results. A local double-peak profile with asymmetric peaks in the VHE light curve is measured, with a flux minimum at the time of periastron and two peaks coinciding with the times at which the neutron star crosses the companion’s circumstellar disc (). A high VHE gamma-ray flux is also observed at the times of the HE gamma-ray flares () and at phases before the first disc crossing (). The spectral energy range now extends to below and up to .
Conclusions. PSR B1259–63/LS 2883 displays periodic flux variability at VHE gamma-rays without clear signatures of super-orbital modulation in the time span covered by the monitoring of the source with the H.E.S.S. telescopes. This flux variability is most probably caused by the changing environmental conditions, particularly at times close to periastron passage at which the neutron star is thought to cross the circumstellar disc of the companion star twice. In contrast, the photon index remains unchanged within uncertainties for about around periastron. At HE gamma-rays, PSR B1259–63/LS 2883 has now been detected also before and after periastron, close to the disc crossing times. Repetitive flares with distinct variability patterns are detected in this energy range. Such outbursts are not observed at VHEs, although a relatively high emission level is measured. The spectra obtained in both energy regimes displays a similar slope, although a common physical origin either in terms of a related particle population, emission mechanism, or emitter location is ruled out.
Key Words.:
Astroparticle physics — Radiation mechanisms: non-thermal — Shock waves — Gamma rays: general — binaries: general — pulsars: general;
11footnotemark: 1 Corresponding authors
22footnotemark: 2 Deceased
1 Introduction
Gamma-ray binaries consist of a massive star and a compact object, either a stellar-mass black hole or a neutron star, in orbit around each other. These systems display a non-thermal energy flux maximum in the gamma-ray band. At very high energies (VHE; ) only a handful of such systems have been detected: LS 5039 (Aharonian et al., 2005a), PSR B1259–63/LS 2883 (Aharonian et al., 2005b), LS I +61 303 (Albert et al., 2006), HESS J0632+057 (Aharonian et al., 2007), HESS J1018-589 (Abramowski et al., 2015), and the recently discovered objects LMC P3 (Abdalla et al., 2015) and TeV J2032+4130 (MAGIC Collaboration & VERITAS Collaboration, 2017). Only in the cases of PSR B1259–63/LS 2883 and TeV J2032+4130 are the compact companions well-identified, in both cases as pulsars, making them unique objects for the study of the interaction between pulsar and stellar winds as well as particle acceleration as well as emission and absorption mechanisms in close binary systems.
Initially discovered in a high-frequency radio survey aiming to detect young and distant short-period pulsars, PSR B1259–63/LS 2883 has since been the object of extensive studies at all frequencies. The source is composed of the rapidly rotating pulsar PSR B1259–63/LS 2883 with a spin period of and a spin-down luminosity of and a bright Oe companion star, LS 2883, with a bolometric luminosity of (Negueruela et al., 2011).
The pulsar orbits the companion with a period () in a very eccentric orbit () with an orbital separation of about 13.4 astronomical units (s) at apastron and less than at periastron (Johnston et al., 1992a; Wex et al., 1998; Wang et al., 2004). The mass function of the system indicates a mass of the companion star of and an orbital inclination angle for the minimal neutron star mass of .
The massive star LS 2883 features an equatorial disc which extends to at least 10 stellar radii (Johnston et al., 1992a; Negueruela et al., 2011; Chernyakova et al., 2014). The disc is inclined with respect to the pulsar’s orbital plane (Johnston et al., 1992a; Melatos et al., 1995; Negueruela et al., 2011) in such a way that the pulsar crosses the disc twice each orbit, just before () and after (, Johnston et al., 2005) the time of periastron ().
PSR B1259–63/LS 2883 displays broad-band emission which extends from radio wavelengths up to VHE gamma rays. In the radio domain, a pulsed component is detectable until the system approaches periastron (see e.g. Johnston et al., 1992b). Thereafter the intensity of the radio pulsed emission decreases until its complete disappearance between and . The definition of the nominal times of the disc crossings is based on the disappearance of this pulse. The times of the disc crossings are almost constant across orbits, although some differences of a few days have been reported (see e.g. Connors et al., 2002; Johnston et al., 2005; Abdo et al., 2011). A transient unpulsed component appears and sharply rises to a level more than ten times higher than the flux density of the pulsed emission far from periastron (see e.g. Johnston et al., 2005). Flux maxima are observed around the first and second disc crossings by the neutron star. A similar behaviour is observed in the X-ray domain (see e.g. Chernyakova et al., 2014). The transient, unpulsed radio emission is presumably synchrotron radiation produced by electrons accelerated at the shock interface between the relativistic pulsar wind and stellar outflows (see e.g. (Ball et al., 1999)).
At optical wavelengths, variability in the H and HeI lines has been reported to occur around the periastron passage of PSR B1259–63/LS 2883, with the line strengths displaying a maximum about after periastron (van Soelen et al., 2016). These observations are consistent with a scenario in which the circumstellar disc gets disrupted around periastron due to the interaction with the pulsar wind. Furthermore, the decrease in the equivalent width of the H line seems to roughly coincide with the onset of the HE gamma-ray flare observed with the -LAT, implying a physical connection between the properties of the disc and the mechanisms behind the HE flares (Chernyakova et al., 2015).
In high-energy (HE; ) gamma rays, the source was detected by the Fermi-LAT for the first time around the periastron passage of 2010/2011. In this energy band, a strong, unexpected enhancement of the emission starting approximately after periastron was detected. This flare lasted more than one month. At the peak, the emitted power in gamma rays almost matched the total spin-down luminosity of the pulsar (Abdo et al., 2011). This flaring event was detected again around the periastron passages in 2014 (see e.g. Caliandro et al., 2015) and in 2017 (e.g. Tam et al., 2018), strengthening the hypothesis of a periodic phenomenon. The nature of these flaring episodes is still unclear, with theoretical interpretations considering either the unshocked pulsar wind, Doppler-boosted emission from shocked material, and/or enhanced photon field energy densities provided by the circumstellar disc (Chernyakova et al., 2015; Khangulyan et al., 2011, 2012). Moreover, differences in the HE flare as observed in 2011, 2014 and in particular in 2017, seem to indicate that other factors need to be accounted for to characterise it. In particular, the flaring event of 2017 has shown variability characteristics such as minute scale variability that were not identified in previous cycles (Johnson et al., 2018).
At very high energies, the H.E.S.S. telescopes detected the source during the periastron passage in 2004 (Aharonian et al., 2005b) and also recorded the subsequent passages in 2007 (Aharonian et al., 2009), 2010/2011 (Abramowski et al., 2013), 2014 (see Romoli et al. (2015) for preliminary results of these observations) and 2017. The source was detected firmly in every case except 2017, where the limited data set prevented a detection above the level. Observations at other orbital phases did not reveal a detectable signal from the source (Aharonian et al., 2009; Abramowski et al., 2013; Romoli et al., 2015; Aharonian et al., 2005b).
Due to the visibility constraints of ground-based telescopes, during each observation campaign it was only possible to probe parts of the orbit around each periastron passage. In 2004, PSR B1259–63/LS 2883 was observed mostly after the periastron, in 2007 mostly before it and in 2011 only a short observation window of five days around was available. A double-peak profile of the VHE light curve in the orbital phase range encompassing the first and second disc crossings, with a local flux minimum close to , results when combining data from all those years (see e.g. the discussion in Kerschhaggl, 2011). The similarity of this light curve to the profiles derived from radio and X-ray observations suggests a common particle population and/or emitting region.
Sufficient coverage of the orbital phase around the time of periastron passage at VHEs was lacking up to now, preventing a definite assessment of the double-peak profile or of any possible super-orbital variability of the source at these energies. Furthermore, neither the periastron passage nor the periods in which HE flares occur have been covered deeply so far. This situation changed after a deep H.E.S.S. observation campaign was conducted in 2014 under favourable observation conditions. Observations of PSR B1259–63/LS 2883 in 2017 are reported here for the first time. For this campaign, the observation conditions were not optimal, and the campaign was restricted to a short time period about 40 d before periastron.
In Sect. 2 of this paper, the H.E.S.S. observations conducted in 2014 and 2017 are described. Furthermore, descriptions of the telescopes and different H.E.S.S. observation modes are given. In Sect. 3, details of the VHE analysis procedures used in this paper are provided. The results of the analyses are reported in Sect. 4, including a sky map obtained with the H.E.S.S.-II array (see Sect. 3), as well as the spectral and timing characterisations of the source for all available data. A dedicated analysis of the Fermi-LAT data during the source periastron passage in 2011, 2014 and 2017 has also been performed. This LAT analysis and the results obtained for each event are summarised in Sect. 5. In Sect. 6, the outcomes of the analyses are discussed in a multi-wavelength context. The findings from the analyses are compared with theoretical models addressing the phase-folded light-curve profiles and the spectral and timing properties of PSR B1259–63/LS 2883 in the gamma-ray domain. Conclusions and perspectives are briefly outlined in Sect. 7.
2 Observations of PSR B1259–63/LS 2883 with H.E.S.S.
2.1 The H.E.S.S. array and observation modes
H.E.S.S. is an array of five telescopes designed to detect the Cherenkov light produced during the development of air showers that are initiated by highly-energetic particles as they interact with particles of air in the upper atmosphere. H.E.S.S. is located in the Khomas Highland in Namibia at an altitude of above sea level. In its first phase (H.E.S.S. I), the array consisted of four identical imaging atmospheric Cherenkov telescopes (CT1–4) with a mirror diameter of , positioned on the corners of a square with a side length of . The H.E.S.S. I array provides a field of view (FoV) with a diameter of about and an energy threshold of about . A detailed description of the H.E.S.S. I array can be found in Aharonian et al. (2006).
In 2012 a new telescope (CT5), featuring a parabolic dish, was added to the centre of the array, initiating the phase H.E.S.S. II. The Cherenkov camera of CT5 covers a FoV of about . Due to the large reflector area, the energy threshold of CT5 can be as low as , for example in the case of pulsed signals (H. E. S. S. Collaboration et al., 2018).
In 2016, the cameras of the CT1–4 telescopes underwent an extensive upgrade aiming to reduce their readout dead time and to improve the overall performance of the array (Giavitto et al., 2017). Data taken with these new cameras in 2017 are, however, not included in the analyses presented here, such that data obtained with CT5 are considered exclusively in this case.
The heterogeneous composition of the H.E.S.S.-II array allows for various observation and analysis modes. In this paper, data obtained with CT5 and a minimum of three of the CT1–4 telescopes are referred to as CT1–5 stereo-mode data. Data analysed with a minimum of three of the smaller telescopes but not CT5 are referred to as CT1–4 stereo mode, whereas CT5 mono indicates CT5 standalone analyses.
The PSR B1259–63/LS 2883 VHE data reported in this paper were all taken in a mode in which the H.E.S.S. telescopes are pointed towards two symmetric positions offset from the source by along right ascension. In case of the 2017 data set, a third pointing position south of PSR B1259–63/LS 2883 was used for of the observations.
2.2 H.E.S.S. observations in 2014 and 2017
The H.E.S.S. observation campaign in 2014 benefited from favourable observing conditions of PSR B1259–63/LS 2883 at orbital phases close to its periastron passage. The source was observable both before, during and after the time of periastron, in particular also at the orbital phase during which a HE gamma-ray flare was detected in 2011 and 2014. A rich data set was obtained, including 141 (151) observation runs (typically -blocks of observations), corresponding to a total acceptance corrected observation time of () in CT5 mono (CT1–5 stereo) mode. The runs were taken at mean zenith angles in the range to , with an average value of . Data were taken during six periods, each corresponding to one moon cycle, with interruptions in the monitoring of the source every lasting about .
In 2017, PSR B1259–63/LS 2883 was observable for a much shorter time period. Observations were conducted only in the time range . These observations were mainly intended to cover a phase period in which a relatively high flux level was observed during the 2014 campaign. A data set of was collected, taken at zenith angles between to with an average value of .
| 2004 | 2007 | 2011 | 2014 | 2017 | ||
| Start Date | Feb 27 | Apr 09 | Jan 10 | Mar 07 | Aug 10 | |
| End Date | Jun 15 | Aug 08 | Jan 16 | Jul 21 | Aug 20 | |
| CT5 Mono | - | - | - | 141 | 12 | |
| / [] | - | - | - | 62.2 | 6 | |
| / [] | - | - | - | 41.8 | 57 | |
| CT1–5 Stereo | - | - | - | 151 | - | |
| / [] | - | - | - | 63.4 | - | |
| / [] | - | - | - | 41.8 | - | |
| CT1–4 Stereo | 138 | 213 | 11 | 163 | - | |
| / [] | 57.1 | 93.9 | 4.8 | 68.1 | - | |
| / [] | 42.5 | 45.1 | 47.6 | 41.9 | - |
In Table 1, the total number of runs, observation times and average zenith angles of the 2014 and 2017 data sets are summarised. Values are provided for both monoscopic analyses and for analyses using CT1–4.
2.3 The 2004, 2007 and 2011 H.E.S.S. data sets
Observations of PSR B1259–63/LS 2883 during its periastron passage in 2004, 2007 and 2011 have been reported in Aharonian et al. (2005b), Aharonian et al. (2009) and Abramowski et al. (2013), respectively. These data are re-analysed using up-to-date analysis techniques, the same used for the analysis of the 2014 and 2017 data sets, in CT1–4 stereo mode. This approach allows for a consistent study of cycle-to-cycle variability and for performing stacked analyses (see Sect. 4.3) of all available H.E.S.S. observations of the source in the aforementioned mode. A total observation time of , and for the 2004, 2007 and 2011 data sets, respectively, is used in this paper, with corresponding zenith angle ranges of to , to and to . A summary of those values is given in Table 1. These data sets can differ slightly from the ones used in previous publications, as improved quality selection criteria are applied. In particular, more restrictive values of the atmospheric transparency coefficient and a minimum of three participating telescopes per run are required for the analysis reported here.
The phase bin coverage for these years is rather inhomogeneous. In 2004, observations took place mainly at , while in 2007, most of the data corresponds to . A minor overlap between the two exists at . The smaller 2011 data set was recorded around , with no phase-folded overlap with either the 2004 or the 2007 observations.
3 H.E.S.S. data analysis
Regardless of the analysis mode, data were analysed with two different analysis pipelines, each using distinct calibration methods (Aharonian et al., 2006) and independent, advanced gamma-ray reconstruction techniques. The first reconstruction pipeline, used to obtain the results reported in this paper, is based on the Image Pixel-wise fit for Atmospheric Cherenkov Telescopes method (ImPACT, Parsons & Hinton, 2014). This pipeline is based on a likelihood fitting of camera pixel amplitudes to image templates generated by Monte Carlo simulations. The standard cut configuration was used. The second pipeline, used as a cross-check analysis in this paper, is based on the Model Analysis method (de Naurois & Rolland, 2009), in which the camera images are compared with a semi-analytical model using a log-likelihood minimisation technique. Both pipelines can be used to analyse data in CT5 mono mode, not taking into account information from CT1–4 even if they participated in the data taking, in CT1–4 stereo mode, even if CT5 participated in the data taking, or in CT1–5 stereo mode. The choice of an analysis mode is usually based on the telescope participation, but also on the goal of the analysis.
Observation runs were selected for both the main and internal cross-check analyses, based on independent run quality selection cuts (Aharonian et al., 2006). Only runs passing cuts in both pipelines were used in this analysis.
Background emission produced by hadrons, electrons and diffuse gamma-ray emission, for example from the nearby Galactic plane, is calculated from source-free regions close to the source under study. For morphological studies and the production of significance maps, the background is estimated for each pixel from a ring around the pixel position (Ring Background method, Berge et al., 2007). An adaptive algorithm is applied to optimise the size of the ring to avoid artificial excesses.
The background for spectral analyses is derived from OFF regions with a similar offset with respect to the camera centre as the source ON region (Reflected Background, Berge et al., 2007). This ensures that a similar acceptance for background events in the source and background control regions is obtained. Similar to the morphological analysis, regions with known sources are excluded a priori in the background estimation for spectral analyses.
Systematic uncertainties for stereo analyses reported in this paper are based on the procedure described in Aharonian et al. (2006). The systematic uncertainty on the flux is estimated to be at a level of , whereas the uncertainty on the spectral slope is taken to be . For the mono analysis, the studies of PKS 2155–304 and PG 1553+113 (Abdalla et al., 2017) are used as reference. Systematic uncertainties on the flux are similar to the stereo case (), whereas systematic uncertainties on the photon index are estimated to range from about (for PKS 2155–304) up to (for PG 1553+113). While the photon index of PSR B1259–63/LS 2883 is more similar to the one of PKS 2155–304, the observation conditions are more similar to those of PG 1553+113 (higher zenith angle). To be conservative, a value of is adopted for the results presented here.
4 H.E.S.S. analysis results
4.1 Sky map and source statistics
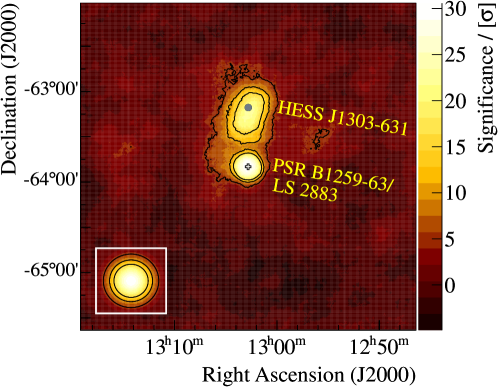
The nominal position of PSR B1259–63/LS 2883 is RA = , Dec = ). A cut on deg2, optimised for point-like source analyses, is used to evaluate the statistics obtained on PSR B1259–63/LS 2883. A total of gamma-ray candidate events are collected from the ON region around the source, whereas such events are recorded from the OFF background regions. After correcting for the ON to OFF exposure ratio (), a total of excess events is obtained, yielding a detection of the source at a statistical significance of 36.5.
A significance map of the region around PSR B1259–63/LS 2883 is shown in Fig. 1. This sky map is the first one produced for the source with the H.E.S.S.-II array, and corresponds to the analysis of the 2014 data set. The significance map corresponds to a total acceptance corrected observation time of , considering events at energies above . The image and corresponding contours were smoothed with a top-hat function on a scale similar to that of the PSF, which has a containment radius of . In addition to PSR B1259–63/LS 2883, the extended pulsar wind nebula HESS J1303–631 (Aharonian et al., 2005) is also apparent in the map, roughly one degree to the north from PSR B1259–63/LS 2883. Residuals in the map are apparent and mostly related to background fluctuations. Close to the two gamma-ray sources, towards the west in Fig. 1, an additional feature is visible at statistical significances of up to (significances here and thereafter are computed following Li & Ma, 1983). This feature is caused by a block of sixteen adjacent pixels in the CT5 camera that was faulty during a large part of the observations conducted in 2014. Furthermore, a gradient in the gains of the PMTs across the camera of CT5 was present during the first part of the observation campaign, which contributes to the features visible in the sky map. The influence of this feature on derived fluxes is estimated based on the variation of the number of gamma-ray candidate events in each of the OFF regions as a function of the declination of the centre of the respective OFF region. It is found that the effect on flux levels measured at the position of PSR B1259–63/LS 2883 is approximately . This systematic effect is accounted for in the analysis of the 2014 data, although it is noted that it is much lower than the commonly assumed level of systematic uncertainties of (Aharonian et al., 2006) and thus negligible.
The data set recorded in 2017 is much smaller, as indicated in Table 1. The analysis of this data set results in a detection with a statistical significance at the level of .
4.2 Spectral analysis results
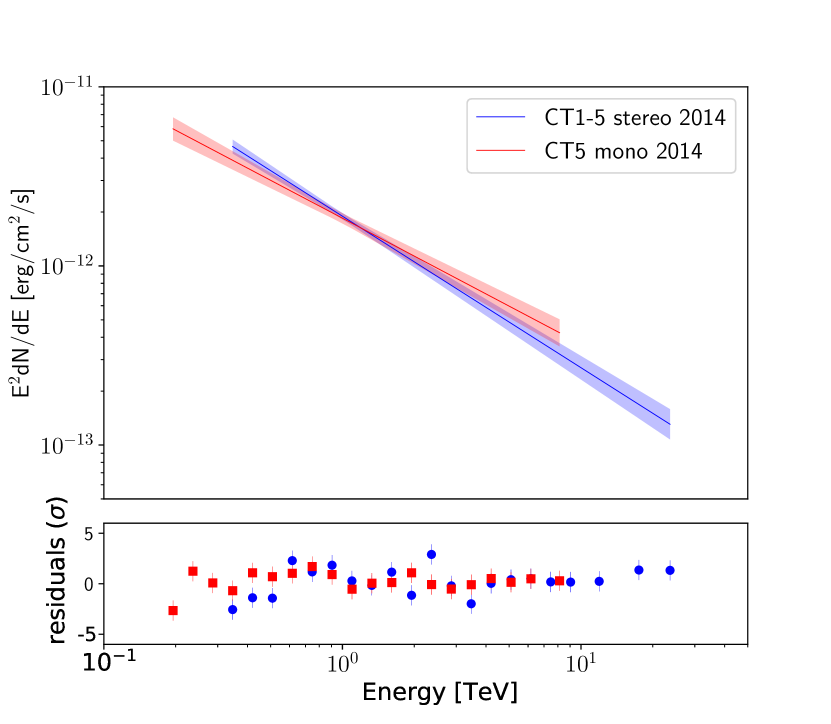
Spectra derived from the 2014 data set have been computed for the mono and CT1–5 stereo configurations. Figure 2 (left panel) displays the spectral energy distributions for both configurations. In mono mode, the spectral analysis covers the energy range –, whereas the stereo spectrum covers a range of –. Energy ranges for spectral analyses are defined such that the energy reconstruction bias, determined from Monte Carlo simulations, is lower than of the energy, and in addition the effective area calculated for each data set individually is required to exceed of the maximum value. The energy binning for the 2014 mono and stereo spectra shown in Fig. 2 has been chosen such that every flux point has a statistical significance of at least . In case of the data taken in 2017, no spectrum can be reconstructed due to the low number of gamma rays recorded.
Power-law models describe well both the mono and stereo spectra. Photon indices of and are obtained for the mono and stereo analyses, respectively. Differential fluxes at are found to be ) and ). The spectral results obtained in 2014 for both analysis configurations are compatible with each other within uncertainties. No significant improvement, based on the comparison of likelihood values obtained from the corresponding spectral fits, is attained when fitting the VHE data with more complex models.
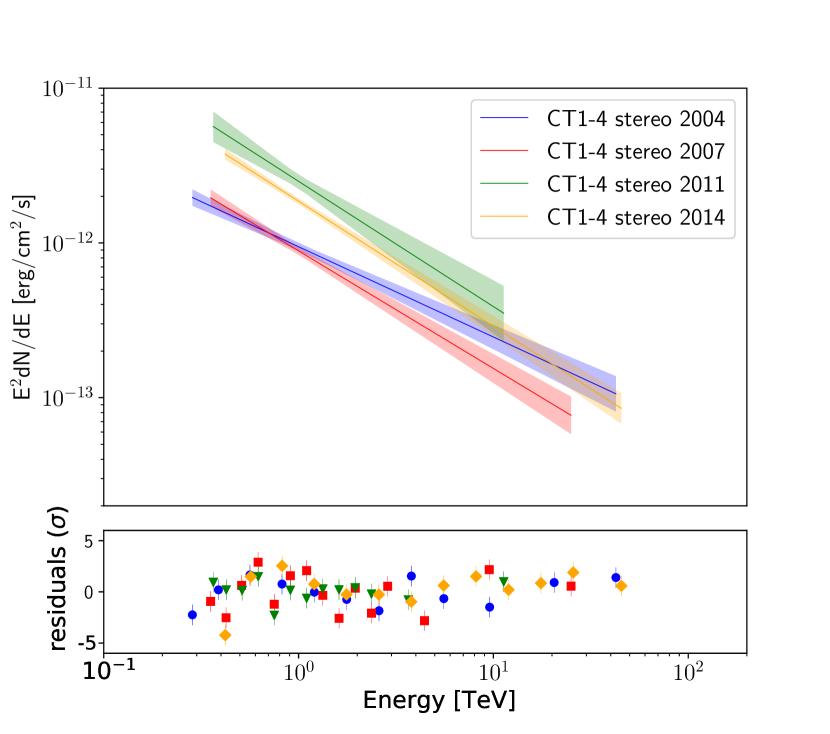
Also the spectral energy distributions for the 2004, 2007 and 2011 periastron passages were computed. The results of the spectral analysis reported here are compatible with previous reports for the corresponding years. Data from 2014, analysed in CT1–4 stereo mode, have also been included. The results are displayed in the right panel of Fig. 2, and fit details are given in Table 2. The distribution of photon indices obtained from these analyses are compatible with a constant at the level. Hence it is concluded that there is no evidence for super-orbital spectral variability. However, the flux normalisations obtained for the different data sets display differences up to a factor of a few. Such differences are attributed to different orbital phase coverage in each campaign (see Sect. 4.3).
| Data Set | / | / [] | |
|---|---|---|---|
| 2004 | 22.4 | ||
| 2007 | 18.0 | ||
| 2011 | 1.5 | ||
| 2014 | 39.0 | ||
| 2014: CT1–5 Stereo | 10.1 |
The CT1–4 spectra shown in Fig. 2 are well-described by simple power-law spectral models. Due to the lack of cut-off features, lower limits on the energies at which tentative exponential cut-offs could be located were derived for all available spectra. The derivation is based on the simulation of spectra, simulated under the assumption that the number of events in both the ON and OFF regions defined according to the Reflected Background method follow a Poisson distribution. Systematic uncertainties on the gamma-ray flux are taken into account in the simulation. Each of the resulting spectra was fitted with a power-law function with an exponential cut-off. From the resulting set of energies at which hypothetical cut-off values are placed, a lower limit on the cut-off energy at the confidence level was derived. The resulting values for each year can be found in Table 2. The most constraining value is found for the spectrum obtained from a CT1–4 analysis of the 2014 data set, according to which a cut-off energy below can be rejected at the confidence level. This finding strengthens the argument that particle acceleration is extremely efficient in PSR B1259–63/LS 2883.
4.3 Light curve analysis results
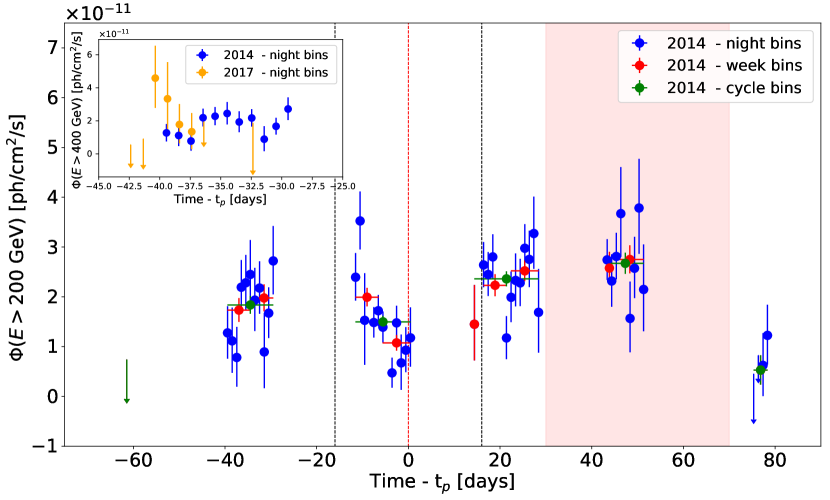
Phase-folded light curve profiles have been derived from the 2014 data set for CT5 mono and for CT1–5 stereo configurations. Three different integration time scales have been considered: binning the data per night, week, and observing-cycle periods (). Light curve points, including uncertainty intervals, are computed if the respective flux estimate and the lower limit of its uncertainty interval are positive, otherwise a confidence level upper limit is calculated assuming a power-law spectrum with an index derived from the spectral analysis described in Sect. 4.2.
An energy threshold of is employed for the CT5 mono analysis of the 2014 data set. The resulting flux points are shown in Fig. 3.
Light curves from the analysis of CT1–5 stereo data above an energy threshold of have also been studied. The shapes of these light curves are similar to the light curves shown in Fig. 3 and are therefore not reported in this paper.
For the 2017 data set, an energy threshold of the CT5 mono analysis of is obtained. Although the significance is less than the threshold for detection in this time period, a light curve has been computed assuming that the source emits VHE gamma rays, as observed in previous observation campaigns at the same orbital phase. A photon index of is assumed (see Sect. 4.2). The resulting light curve for integral fluxes above 400 GeV is shown for night-by-night integration time scales in the inset of Fig. 3, where the results for the 2014 data set in CT5 mono configuration for the same energy threshold are also included for comparison.
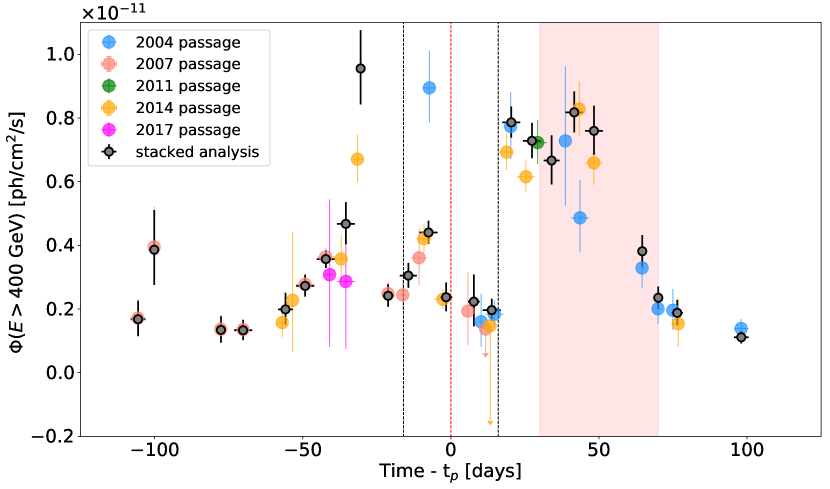
At the level, no evidence for short-term (night-by-night) variability is found when comparing adjacent bins within statistical uncertainties in the 2014 and in the 2017 light curves. Light curves have also been produced using weekly integration time scales for the H.E.S.S.-I configuration including observations from 2004 to 2014 (see Fig. 4). These light curves have been computed by assuming photon indices obtained from annual averages. Energy thresholds, defined here according to the aforementioned criterion on the energy reconstruction bias only, are below in all cases. Hence this energy was adopted as a common threshold for the calculation of the light curves. For the 2017 data set, results from the CT5 mono analysis are included in Fig. 4. Fluxes are compatible with the those observed at similar phases in previous years.
4.4 Stacking analysis results
Assuming that the processes responsible for the VHE emission from PSR B1259–63/LS 2883 close to periastron repeat periodically, a phase-folded stacking analysis including all H.E.S.S. data sets available for PSR B1259–63/LS 2883 has been performed. The analysis is restricted to the CT1-4 stereo configuration for all observations, and a common energy threshold is applied. In Fig. 4, weekly binned phase-folded light curves from individual periastron passages (coloured flux points) are shown together with the all-year stacked light curve (grey flux points). For the stacked light curve, a fixed photon index of has been assumed.
Fitting the resulting light curve assuming a constant flux yields an average value of . The value , describing the fit probability given the number of degrees of freedom Ndf, implies that the fluxes are incompatible with a constant at a level greater than . Thus it is confirmed that PSR B1259–63/LS 2883 is a variable source of VHE gamma rays.
Week-to-week variability is observed in different regions of the stacked light curve, in particular close to the time of the disc crossings. The most significant flux variation is found at a level greater than at the second disc crossing between neighbouring bins centred at and at after periastron. A flux increase by a factor of at least 2.9 is derived at the confidence level.
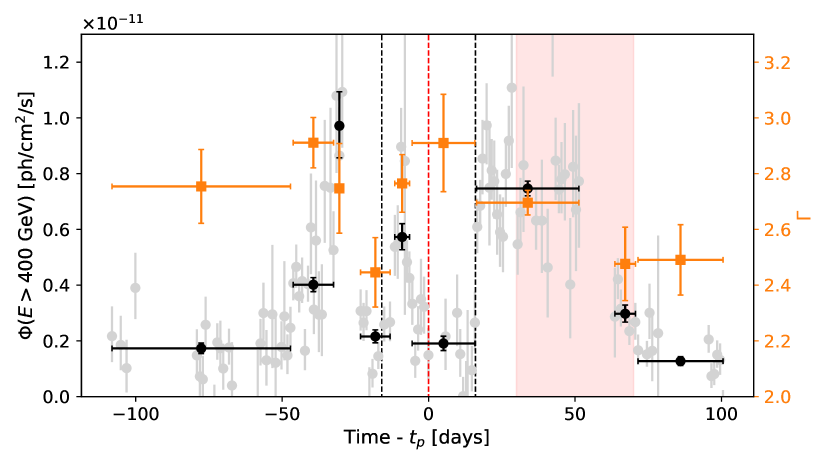
A stacked light curve has also been produced with a dedicated time binning that was derived from a Bayesian Block analysis (Scargle et al., 2013) on the phase-folded nightwise-binned light curve for energies above . The implementation in the astropy Python package (version 2.0.12) was used, and a false alarm probability of was chosen. The aim is to identify flux states of the source that could be linked with the physical processes taking place in the system. The intervals found by the algorithm are illustrated in Fig. 5 and reported in Table 3. The identified intervals match the current knowledge of the orbital behaviour of the system near the periastron and track the newly identified high state between and from periastron. Distinct low flux states before the disc crossings, high flux states after the disc crossings and a low state around periastron are identified.
The photon index in each interval is derived from a dedicated spectral analysis per bin. Spectral energy ranges are defined according to the procedure described above. Photon indices for these spectra are shown in Fig. 5.
| Interval | Days from / [] | / | Signif. | |||
|---|---|---|---|---|---|---|
| Int. 1 | 34.8 | 11.0 | ||||
| Int. 2 | 31.2 | 20.7 | ||||
| Int. 3 | 2.6 | 12.1 | ||||
| Int. 4 | 29.4 | 11.2 | ||||
| Int. 5 | 11.9 | 16.5 | ||||
| Int. 6 | 29.0 | 8.7 | ||||
| Int. 7 | 42.6 | 39.8 | ||||
| Int. 8 | 12.6 | 11.8 | ||||
| Int. 9 | 29.3 | 9.4 |
5 Fermi-LAT data analysis and results
Observations of PSR B1259–63/LS 2883 have also been performed in HE gamma rays with the large area telescope (LAT) onboard the Fermi satellite. As part of its full-sky coverage pointing strategy, the LAT monitored PSR B1259–63/LS 2883 during its last three periastron passages in 2010/11, 2014 and 2017 (see e.g. Abdo et al., 2011; Caliandro et al., 2015; Tam et al., 2018). The source was clearly detected by the LAT, displaying low to moderate fluxes around the disc crossings and at the periastron passage itself. In addition, bright HE gamma-ray flaring episodes starting about 30– after periastron and lasting for roughly have been detected after each of these three periastron passages. The nature of these flares is still unknown.
A re-analysis of the data of the 2010/11, 2014 and 2017 periastron passages using the software provided by the Fermi-LAT Collaboration (Science Tools v10r0p5, and the instrument response functions (IRFs) PASS8) is reported. For each dataset, an interval of about 5 months was chosen around the periastron passage. The time intervals are reported in Table 4.
Photon events in an energy range between and were extracted from a square region with side lengths of , centred on the position of the PSR B1259–63/LS 2883 system. The emission from this region of interest (RoI) was modelled taking into account all the sources reported in the 3FGL catalogue (Acero et al., 2015) within of PSR B1259–63/LS 2883, also including the models for the Galactic and isotropic background emission (gll_iem_V06 and ISO_P8R2_SOURCE_V06_v06, respectively). A binned likelihood analysis was performed, with sources outside the RoI having all their spectral parameters fixed to the 3FGL values. Sources included in the annulus between and the edges of the RoI had only their spectral normalisation free to vary, while sources within from PSR B1259–63/LS 2883 had all their spectral parameters free. The fit was performed twice, taking into account in the second fit only sources with a significance above 2. All the background sources were then fixed to the values obtained through this procedure and a weekly light curve was then derived by performing a new likelihood fit on weekly time intervals where only the flux normalisations of PSR B1259–63/LS 2883 and of sources flagged as variable in the 3FGL catalogue were left free to vary. To better explore the emission in the pre-flare phase, a stacked analysis was also performed merging together all the data of the 3 passages. To keep the computation of the light curve consistent, the data were stacked in a phase interval from before the periastron passage to after. The result of the likelihood fits for each time interval is reported in Table 4.
| Time Interval / [MJD] | Year | Days from / [] | / [] | |
|---|---|---|---|---|
| 55478.5 - 55646.5 | 2010/11 | |||
| 56714.5 - 56882.5 | 2014 | |||
| 57951.5 - 58119.5 | 2017 | |||
| stacked | all years |
The HE gamma-ray light curves with a weekly binning obtained from the analysis of Fermi-LAT data are shown in Fig. 6. Flux points are displayed only if the significance of the source is above a TS value of 10 (corresponding to a detection), otherwise a 2 upper limit is placed. The results of this analysis yields compatible results with what was reported previously (Tam et al., 2018; Johnson et al., 2018; Chang et al., 2018). The most striking feature of these light curves are the bright HE flares starting about after periastron in 2010/11 and 2014, and after periastron in 2017. The flares last about a month in all cases with substructures on timescales from days to minutes (Johnson et al., 2018).
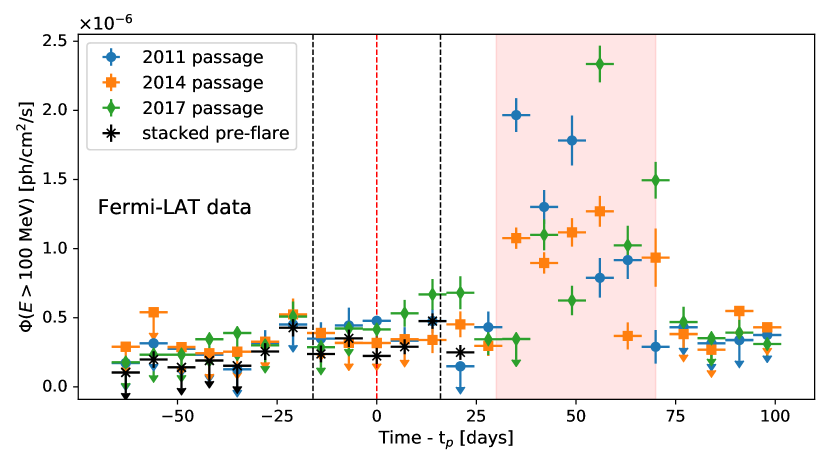
Using a stacked analysis of all the LAT observations of PSR B1259–63/LS 2883 falling in the range [ - , ], we confirm the presence of significant emission during the two disc crossings and at (Tam et al., 2018; Chang et al., 2018).
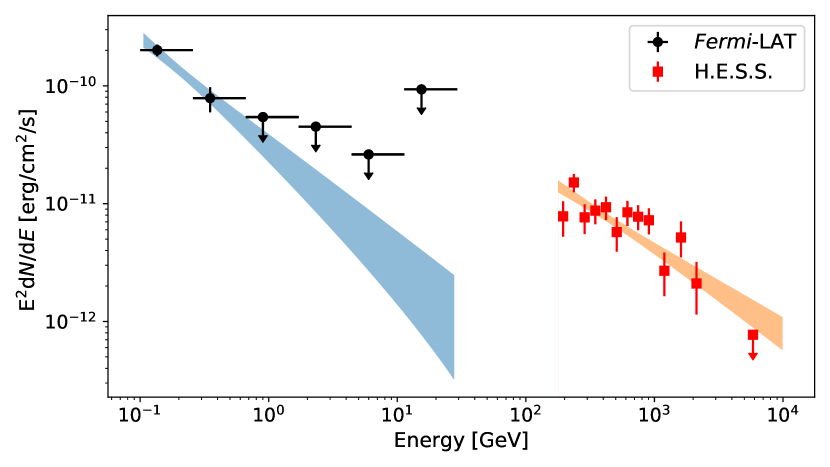
Due to the simultaneity of the H.E.S.S. observations with the ongoing GeV flare in 2014, a dedicated spectral analysis was performed in the time interval from MJD 56825.2 to MJD 56833.2, corresponding to the phase range [, ] when the H.E.S.S. data were taken. The likelihood fit returned a flux above of with a photon index . The SED obtained from this interval is shown in Fig. 7. The spectral points were computed with a likelihood fit in each energy band, where only the flux normalisation is left free to vary while the photon index is fixed to the average value over the full energy range.
6 Discussion
The long-term monitoring of PSR B1259–63/LS 2883 allows its gamma-ray profile to be robustly characterised, its HE and VHE spectral properties to be constrained at different periastron passages and within distinct orbital phases, and the (non-)correlation of the emission in these two energy bands to be determined concretely.
It is noted that in this discussion only models employing leptons as primary particles are considered. The stellar wind and the circumstellar disc provide reservoirs of target material with which relativistic protons could also interact to produce gamma rays through decay. However, hadronic interpretations proposed for this source (Chernyakova et al., 2006; Kawachi et al., 2004) were not able to explain the light-curve profiles adequately unless complex disc morphologies were invoked (Aharonian et al., 2009). Furthermore, arguments based on the time scales of the observed variability favour leptonic scenarios (Dubus, 2013).
6.1 Origin of short- and long-term VHE flux variability
PSR B1259–63/LS 2883 features distinct VHE maxima in its phase-folded light curve, contained within around the time of periastron as shown in Fig. 4. When all available data are combined, high emission states around the times of the first and second disc crossings become apparent. This general trend is similar to and contemporaneous with other non-thermal lower-energy profiles, as obtained from dedicated multi-wavelength analyses of the source (see e.g. Fig. 5 in Chernyakova et al., 2015). A local VHE gamma-ray flux minimum is found at the time of periastron . Such a local double-peak profile centred approximately on and encompassing the emission at the times of the disc crossings was already hinted at in previous H.E.S.S. observations (see e.g. Aharonian et al., 2009) and is confirmed here in particular with the data taken in 2014, which covered itself for the first time.
In a scenario in which electrons are accelerated up to relativistic energies at the shock interface (Rees & Gunn, 1974; Kennel & Coroniti, 1984) of the pulsar wind with the stellar wind emitted by LS 2883, VHE gamma-ray emission can be produced by such electrons through inverse Compton (IC) scattering off the dense photon field provided by the bright companion star (see e.g. Tavani & Arons, 1997; Kirk et al., 1999). In this framework, the relatively close distance between the compact object and the companion star during orbital phases close to periastron is expected to cause enhanced gamma-ray fluxes from the source. The presence of a double-peak profile encompassing the first and second disc crossings as well as the time of periastron , where a local minimum is found, has been successfully interpreted as a signature of strong non-radiative losses in the system, which may be dominant all along the orbit (see e.g. Khangulyan et al., 2007; Kerschhaggl, 2011). Adiabatic (or escape) losses displaying a peak at the times close to periastron could reproduce the VHE gamma-ray profile. The origin of such a peak is still under debate.
Absorption of VHE photons can also be significant at these orbital phases. Recently, Sushch & van Soelen (2017) evaluated such effects while accounting for an improved description of the properties of the circumstellar disc (see e.g. van Soelen et al., 2012) and updated values for the companion star (Negueruela et al., 2011). These authors conclude that a maximum of the – attenuation should take place () before periastron for gamma-ray photons absorbed by photon fields of the star (circumstellar disc). The nightwise-binned light curve shown in Fig. 3 displays a minimum in the flux level a few days before periastron. However, the statistical fluctuations of the time-binned flux points around this minimum make it difficult to further constrain its precise location. In addition, the stacked light curves in Fig. 3 and in Fig. 4 show that the emission level remains relatively low for after periastron. At about , the optical depth should already be about of that at periastron, according to the predictions in Sushch & van Soelen (2017). Since – absorption alone cannot fully explain the dip of the VHE flux close to periastron, it becomes clear that non-radiative losses and/or intrinsic changes in the emitter around periastron need to be taken into account as well.
With the extended data set analysed here, an asymmetry of the light curve peaks at VHEs becomes apparent (see Fig. 4). Comparing nightwise-binned fluxes observed at times symmetric to the time of periastron yields the result that, on average, the fluxes measured during the second disc crossing phase are times as high as the fluxes observed during the first disc crossing phase. The fine-tuning of different emission or absorption mechanisms in order to obtain a symmetric profile at VHEs, for instance Doppler boosting effects, – absorption or a large emitter size, is no longer required (see discussion in Kerschhaggl (2011)). Such processes and their complex interplay may nevertheless still be present and be partly responsible for the observed flux modulation.
The high fluxes observed at the times of the disc crossings rise within one day from local flux minima just before the disc crossings. The decrease of flux levels is asymmetric, lasting few days in case of the peak around the first disc crossing, and more than two weeks in case of the peak after periastron. VHE fluxes measured during the time of the HE flare connect smoothly with the flux observed after the second disc crossing.
Enhanced VHE emission on a relatively short time scale is also observed about before the time of the first disc crossing (). This is most evident from the observational campaign conducted with H.E.S.S. in 2014. This bright emission lasts for about five days and might therefore be unrelated to the emission produced at the disc crossing itself. A similar enhancement is not observed at radio wavelengths, X-rays or HE gamma rays. The analysis of the data taken in 2017 yields moderate fluxes compatible with the fluxes obtained from the 2014 data set at similar parts of the orbit. Due to the uneven sampling of the orbit, the presence of the pronounced peak cannot be tested for periodicity. Further observations of the source at VHEs are needed to clarify whether this is a repetitive event.
6.2 spectral evolution and stacked analysis
No signature of spectral curvature has been found in any of the spectra shown in Sect. 4.2, and fitting with more complex spectral models has provided no significant improvement with respect to a power-law fit. The absence of an energy cut-off implies a highly efficient acceleration process taking place in the system at orbital phases close to the periastron passage. The severe radiation (and possibly non-radiative) energy losses do not imprint any feature on the spectra measured by H.E.S.S. A spectral break in the VHE gamma-ray spectra would be expected if absorption of VHE photons on the photon field of either the companion star or its circumstellar disc were significant. This change in the spectral slope might however start already at lower energies, such that the H.E.S.S. data would correspond to the absorbed spectrum.
The observed VHE radiation from PSR B1259–63/LS 2883 is likely produced through IC emission deep in the Klein-Nishina (KN) regime. For a black-body target photon field provided by the companion star, with surface temperatures between and (Negueruela et al., 2011), the seed photons have an energy of –, respectively. The transition from the Thomson to the KN regime should take place at corresponding electron Lorentz factors of and , respectively. In the Thomson regime, the resulting gamma-ray photon energy is typically . For gamma-ray photons with energies of , electrons with Lorentz factors – would be required. These Lorentz factors are much larger than . If the emission from the circumstellar disc is considered, assuming a Planck spectrum with a peak at about (for a disc temperature of ), then , whereas electrons with Lorentz factors would be required to produce photons. From this simple estimation, the existence of a spectral break following the transition from Thomson to KN regimes in the energy domain studied here can be ruled out.
The spectral results reported in Sect. 4.2 provide a 95% confidence level constraint on the minimum cut-off energy to for the analysis of the 2014 data set. Being deep in the KN regime, with and (Moderski et al., 2005), the energy of the emitting parent electron population reaches at least values similar to that of the IC up-scattered photon, . This corresponds to a lower bound on the maximum electron Lorentz factor of . In addition, the absence of a downturn of the VHE spectrum in this regime implies that no transition from IC scattering to synchrotron emission as dominant energy loss processes occurs in the energy range 0.2–.
The spectral profile plotted in Fig. 5 does not show a significant variability of the photon index of PSR B1259–63/LS 2883 within errors (statistical and systematic). This is in contrast to what is observed in the X-ray spectrum (Chernyakova et al., 2015), where a hardening of the emission can be observed when the source approaches the periastron passages, with softer emission observed at the disc crossings and at periastron itself. A hint for a softening of the spectral index at VHEs is observed right before periastron, but statistical and systematic errors prevent a firm conclusion on this. It is worth noting that a hardening of the synchrotron X-ray emission would be expected in the transition to the KN regime as a consequence of an excess at the high-energy end of the parent electron population. The looser KN cross-section dependency on the electron energy would, however, compensate the IC contribution, such that the effect would be limited in the VHE gamma-ray domain.
During the second disc crossing and during the HE flaring period, compatible photon indices of –2.8 are observed. Together with the smooth evolution of the VHE flux for (see below), the evolution of the VHE spectral parameters around the time of the HE flaring period does not provide support for a distinct emission component emerging at this orbital phase. It is worth noting, however, that in the HE regime the photon index of the spectrum of PSR B1259–63/LS 2883 is also unchanged for the whole periastron passage period and during the gamma-ray flare. A spectral analysis of the stacked pre-flare data sets (see black data points in Fig. 6) provides a photon index , well compatible with that obtained during the flaring periods (e.g. in 2014; see also Tam et al., 2018). If the flare originated from a separate component showing up only after in the HE regime, this cannot be distinguished based solely on the analysis of the photon index.
6.3 The HE gamma-ray flare observed at VHEs
The phase-folded VHE light curves reported in Figs. 3 and 4 (see also Fig. 5) display a pronounced high level of emission at , lasting for at least three weeks. The flux transition from the orbital phases, in which the system is assumed to cross the circumstellar disc of the companion star for the second time, is smooth. Furthermore the spectral properties remain unchanged (see Fig. 5). This suggests that the processes taking place in the system and responsible for the VHE emission after this second disc crossing are related and seem to extend to longer timescales than previously expected. A sudden increase by a factor of a few at these orbital phases, as seen in the HE gamma-ray band (see Fig. 6), is not observed at VHEs. Following the procedure in Abramowski et al. (2013), a flare coefficient can be introduced and constrained to quantify this statement. Based on the fluxes above shown in Fig. 3, a flux increase by a factor can be excluded at the confidence level when comparing the monthly bins just before and during the time of the GeV flare. At energies above , the flare coefficient can be constrained to based on the fluxes observed at the time of the second disc crossing and at the time of the HE gamma-ray flare (Fig. 5, Table 3). Systematic uncertainties have been taken into account in the calculation of these limits. At HEs, instead, a flux increase from the last point before the flare to the first bin belonging to the flare of a factor is observed. Furthermore, the VHE emission shows only moderate variability at the time of the HE gamma-ray flare. This is in contrast to the HE variability observed in PSR B1259–63/LS 2883 in 2011, 2014 and 2017, when large flux differences down to variability time scales of days and even hours (Tam et al., 2018; Johnson et al., 2018) were observed.
From Fig. 7 it also becomes apparent that distinct components are responsible for either the HE or the VHE emission during the flare. The SED shows that an extrapolation of the power-law fit to the Fermi-LAT data is incompatible with the emission observed at VHEs by several orders of magnitude. Similar conclusions were derived from the analysis of the limited VHE data set in 2011 (Abramowski et al., 2013). Contrary to the case of other gamma-ray binaries (Hadasch et al., 2012), the sub- emission is not accompanied by multi- emission in PSR B1259–63/LS 2883. Finally, it is noted that at other orbital phases, the HE flux of PSR B1259–63/LS 2883 is too low for a similar spectral constraint.
The analysis of the Fermi-LAT data reported in Sect. 5 shows in addition that significant HE gamma-ray emission is detected between the times when the compact object crosses the circumstellar disc. It is considered unlikely that the mechanism responsible for this baseline emission is also responsible for the emission during the HE gamma-ray flare. The true anomaly of the pulsar changes by in this time range (see e.g. Aharonian et al. (2009) for a sketch), and the emission observed during the flaring period is thought to have a strong geometric dependence.
Whether or not the HE and VHE gamma-rays (and X-ray and radio emission, if they are also correlated) at are produced by the same particle population, acceleration mechanism, or in the same physical regions, is still unclear. There are no theoretical predictions of high VHE fluxes for such a remarkably long () time scale after the second disc crossing.
The HE and VHE gamma rays emitted between the disc crossings could have the same origin. The significant differences of the flux profiles and spectral properties measured during the gamma-ray flare in these two energy bands suggest that different processes are responsible for the emission in the two domains at this part of the orbit.
7 Conclusions
The observations of the periastron passages of PSR B1259–63/LS 2883 in 2014 and 2017 at VHEs with H.E.S.S. together with a reanalysis of data obtained in previous observations reveals a complex VHE gamma-ray light curve that remains repetitive over years. A double-peak profile around encompassing the two disc crossing times emerges when all light curves are shown or stacked together, displaying a clear asymmetry between the pre- and post-periastron orbital phases. Additional features in the light curve are also apparent, in particular those derived from the rich data set obtained in 2014. A high flux is observed before the first disc crossing. Subsequently, high flux levels are also observed during the HE flaring events. Contrary to the HE case, however, there is a smooth continuation of the VHE flux from previous orbital phases. The Fermi-LAT analysis reveals that these HE flares exhibit a significant cycle-to-cycle variability. In particular for 2017, the onset of the flare is delayed by with respect to 2011 and 2014. The analysis shows that HE gamma rays are produced also before the flare, during the times of the disc crossing by the compact object and at itself. Therefore, any theoretical interpretation correlating the emission at radio wavelengths, X-rays and VHE gamma-rays at orbital phases around should account as well for this emission.
There is no evidence for variability of the photon index at VHEs, therefore an hypothesis in which distinct emission components dominate at different orbital phases around is not supported by the presented spectral results. PSR B1259–63/LS 2883 does not show spectral variability in our analysis at HE either.
A lower limit on the energy at which a hypothetical spectral cut-off could be found is placed at an energy of . Therefore, it is concluded that PSR B1259–63/LS 2883 is a very efficient particle accelerator.
The next passage is expected in early 2021 ( occurring on February 9). The source will be observable in excellent conditions from the H.E.S.S. site in Namibia. Further observations of periastron passages of PSR B1259–63/LS 2883, in particular with the Cherenkov Telescope Array (CTA) (Acharya et al., 2013; The CTA Consortium, 2019), are expected to substantially improve the VHE characterisation of the source.
Acknowledgments
The support of the Namibian authorities and of the University of Namibia in facilitating the construction and operation of H.E.S.S. is gratefully acknowledged, as is the support by the German Ministry for Education and Research (BMBF), the Max Planck Society, the German Research Foundation (DFG), the Helmholtz Association, the Alexander von Humboldt Foundation, the French Ministry of Higher Education, Research and Innovation, the Centre National de la Recherche Scientifique (CNRS/IN2P3 and CNRS/INSU), the Commissariat a l’Énergie atomique et aux Énergies alternatives (CEA), the U.K. Science and Technology Facilities Council (STFC), the Knut and Alice Wallenberg Foundation, the National Science Centre, Poland grant no. 2016/22/M/ST9/00382, the South African Department of Science and Technology and National Research Foundation, the University of Namibia, the National Commission on Research, Science & Technology of Namibia (NCRST), the Austrian Federal Ministry of Education, Science and Research and the Austrian Science Fund (FWF), the Australian Research Council (ARC), the Japan Society for the Promotion of Science and by the University of Amsterdam. We appreciate the excellent work of the technical support staff in Berlin, Zeuthen, Heidelberg, Palaiseau, Paris, Saclay, Tübingen and in Namibia in the construction and operation of the equipment. This work benefitted from services provided by the H.E.S.S. Virtual Organisation, supported by the national resource providers of the EGI Federation.
References
- Abdalla et al. (2017) Abdalla, H., Abramowski, A., Aharonian, F., et al. 2017, A&A, 600, A89
- Abdalla et al. (2015) Abdalla, H. et al. 2015, Astron. Astrophys., 610, L17
- Abdo et al. (2011) Abdo, A. A., Ackermann, M., Ajello, M., et al. 2011, ApJL, 736, L11
- Abramowski et al. (2013) Abramowski, A., Acero, F., Aharonian, F., et al. 2013, A&A, 551, A94
- Abramowski et al. (2015) Abramowski, A., Aharonian, F., Ait Benkhali, F., et al. 2015, A&A, 577, A131
- Acero et al. (2015) Acero, F., Ackermann, M., Ajello, M., et al. 2015, ApJS, 218, 23
- Acharya et al. (2013) Acharya, B. S., Actis, M., Aghajani, T., et al. 2013, Astroparticle Physics, 43, 3
- Aharonian et al. (2009) Aharonian, F., Akhperjanian, A. G., Anton, G., et al. 2009, A&A, 507, 389
- Aharonian et al. (2005a) Aharonian, F., Akhperjanian, A. G., Aye, K.-M., et al. 2005a, Science, 309, 746
- Aharonian et al. (2005b) Aharonian, F., Akhperjanian, A. G., Aye, K.-M., et al. 2005b, A&A, 442, 1
- Aharonian et al. (2005) Aharonian, F., Akhperjanian, A. G., Aye, K.-M., et al. 2005, A&A, 439, 1013
- Aharonian et al. (2006) Aharonian, F., Akhperjanian, A. G., Bazer-Bachi, A. R., et al. 2006, ApJ, 636, 777
- Aharonian et al. (2007) Aharonian, F. A., Akhperjanian, A. G., Bazer-Bachi, A. R., et al. 2007, A&A, 469, L1
- Albert et al. (2006) Albert, J., Aliu, E., Anderhub, H., et al. 2006, Science, 312, 1771
- Ball et al. (1999) Ball, L., Melatos, A., Johnston, S., & Skjæ Raasen, O. 1999, ApJL, 514, L39
- Berge et al. (2007) Berge, D., Funk, S., & Hinton, J. 2007, A&A, 466, 1219
- Caliandro et al. (2015) Caliandro, G. A., Cheung, C. C., Li, J., et al. 2015, ApJ, 811, 68
- Chang et al. (2018) Chang, Z., Zhang, S., Chen, Y.-P., et al. 2018, Research in Astronomy and Astrophysics, 18, 152
- Chernyakova et al. (2014) Chernyakova, M., Abdo, A. A., Neronov, A., et al. 2014, MNRAS, 439, 432
- Chernyakova et al. (2006) Chernyakova, M., Neronov, A., Lutovinov, A., Rodriguez, J., & Johnston, S. 2006, MNRAS, 367, 1201
- Chernyakova et al. (2015) Chernyakova, M., Neronov, A., van Soelen, B., et al. 2015, MNRAS, 454, 1358
- Connors et al. (2002) Connors, T. W., Johnston, S., Manchester, R. N., & McConnell, D. 2002, MNRAS, 336, 1201
- de Naurois & Rolland (2009) de Naurois, M. & Rolland, L. 2009, Astroparticle Physics, 32, 231
- Dubus (2013) Dubus, G. 2013, Astronomy and Astrophysics Review, 21, 64
- Giavitto et al. (2017) Giavitto, G., Bonnefoy, S., Ashton, T., et al. 2017, International Cosmic Ray Conference, 35, 805
- H. E. S. S. Collaboration et al. (2018) H. E. S. S. Collaboration, Abdalla, H., Aharonian, F., et al. 2018, A&A, 620, A66
- Hadasch et al. (2012) Hadasch, D., Torres, D. F., Tanaka, T., et al. 2012, ApJ, 749, 54
- Johnson et al. (2018) Johnson, T. J., Wood, K. S., Kerr, M., et al. 2018, ApJ, 863, 27
- Johnston et al. (2005) Johnston, S., Ball, L., Wang, N., & Manchester, R. N. 2005, MNRAS, 358, 1069
- Johnston et al. (1992a) Johnston, S., Manchester, R. N., Lyne, A. G., et al. 1992a, ApJL, 387, L37
- Johnston et al. (1992b) Johnston, S., Manchester, R. N., Lyne, A. G., et al. 1992b, ApJL, 387, L37
- Kawachi et al. (2004) Kawachi, A., Naito, T., Patterson, J. R., et al. 2004, ApJ, 607, 949
- Kennel & Coroniti (1984) Kennel, C. F. & Coroniti, F. V. 1984, ApJ, 283, 694
- Kerschhaggl (2011) Kerschhaggl, M. 2011, A&A, 525, A80
- Khangulyan et al. (2011) Khangulyan, D., Aharonian, F. A., Bogovalov, S. V., & Ribó, M. 2011, ApJ, 742, 98
- Khangulyan et al. (2012) Khangulyan, D., Aharonian, F. A., Bogovalov, S. V., & Ribó, M. 2012, ApJL, 752, L17
- Khangulyan et al. (2007) Khangulyan, D., Hnatic, S., Aharonian, F., & Bogovalov, S. 2007, MNRAS, 380, 320
- Kirk et al. (1999) Kirk, J. G., Ball, L., & Skjæraasen, O. 1999, Astroparticle Physics, 10, 31
- Li & Ma (1983) Li, T.-P. & Ma, Y.-Q. 1983, ApJ, 272, 317
- MAGIC Collaboration & VERITAS Collaboration (2017) MAGIC Collaboration & VERITAS Collaboration. 2017, The Astronomer’s Telegram, 10810
- Melatos et al. (1995) Melatos, A., Johnston, S., & Melrose, D. B. 1995, MNRAS, 275, 381
- Moderski et al. (2005) Moderski, R., Sikora, M., Coppi, P. S., & Aharonian, F. 2005, MNRAS, 363, 954
- Negueruela et al. (2011) Negueruela, I., Ribó, M., Herrero, A., et al. 2011, ApJL, 732, L11
- Parsons & Hinton (2014) Parsons, R. D. & Hinton, J. A. 2014, Astroparticle Physics, 56, 26
- Rees & Gunn (1974) Rees, M. J. & Gunn, J. E. 1974, MNRAS, 167, 1
- Romoli et al. (2015) Romoli, C., Bordas, P., Mariaud, C., et al. 2015, ArXiv e-prints
- Scargle et al. (2013) Scargle, J. D., Norris, J. P., Jackson, B., & Chiang, J. 2013, ApJ, 764, 167
- Sushch & van Soelen (2017) Sushch, I. & van Soelen, B. 2017, ApJ, 837, 175
- Tam et al. (2018) Tam, P.-H. T., He, X., Sarathi Pal, P., & Cui, Y. 2018, ArXiv e-prints
- Tavani & Arons (1997) Tavani, M. & Arons, J. 1997, ApJ, 477, 439
- The CTA Consortium (2019) The CTA Consortium. 2019, Science with the Cherenkov Telescope Array (WORLD SCIENTIFIC)
- van Soelen et al. (2012) van Soelen, B., Meintjes, P. J., Odendaal, A., & Townsend, L. J. 2012, MNRAS, 426, 3135
- van Soelen et al. (2016) van Soelen, B., Väisänen, P., Odendaal, A., et al. 2016, MNRAS, 455, 3674
- Wang et al. (2004) Wang, N., Johnston, S., & Manchester, R. N. 2004, MNRAS, 351, 599
- Wex et al. (1998) Wex, N., Johnston, S., Manchester, R. N., et al. 1998, MNRAS, 298, 997