SOFIA/HAWC+ View of an Extremely Luminous Infrared Galaxy, WISE1013+6112
Abstract
We present far-infrared (FIR) properties of an extremely luminous infrared galaxy (ELIRG) at = 3.703, WISE J101326.25+611220.1 (WISE1013+6112). This ELIRG is selected as an IR-bright dust-obscured galaxy (DOG) based on the photometry from the Sloan digital sky survey (SDSS) and wide-field infrared survey explorer (WISE). In order to derive its accurate IR luminosity, we perform follow-up observations at 89 and 154 using the high-resolution airborne wideband camera-plus (HAWC+) on board the 2.7-m stratospheric observatory for infrared astronomy (SOFIA) telescope. We conduct spectral energy distribution (SED) fitting with CIGALE using 15 photometric data (0.4–1300 ). We successfully pin down FIR SED of WISE1013+6112 and its IR luminosity is estimated to be = (1.62 0.08) , making it one of the most luminous IR galaxies in the universe. We determine the dust temperature of WISE1013+6112 is = 89 3 K, which is significantly higher than that of other populations such as SMGs and FIR-selected galaxies at similar IR luminosities. The resultant dust mass is . This indicates that WISE1013+6112 has a significant active galactic nucleus (AGN) and star-forming activity behind a large amount of dust.
1 Introduction
Galaxies whose infrared (IR) luminosity exceeds 1013 and 1014 have been termed as hyper-luminous IR galaxies (HyLIRGs: Rowan-Robinson, 2000) and extremely-luminous IR galaxies (ELIRGs: Tsai et al., 2015), respectively. Their IR luminosity () is expected to be produced by star formation (SF), active galactic nucleus (AGN) activity, or both. In the context of major merger scenario, their extreme IR luminosity could indicate that it corresponds to the peak of AGN and/or SF activity behind a large amount of gas and dust (Narayanan et al., 2010; Ricci et al., 2017; Blecha et al., 2018). Therefore, it is important to search for IR luminous galaxies such as HyLIRGs and ELIRGs for understanding the galaxy formation and evolution and connection to their super massive black holes (SMBHs) (see e.g., Hopkins et al., 2008). However, their volume densities are extremely low (Rowan-Robinson & Wang, 2010; Gruppioni et al., 2013), and thus wide and deep surveys are required to detect these spatially rare populations.
One successful technique to search for HyLIRGs and ELIRGs is based on mid-IR (MIR) colors taken with Wide-field Infrared Survey Explorer (WISE: Wright et al., 2010). Most of objects that are faint or undetected by WISE at 3.4 (W1) and 4.6 (W2) but are well detected at 12 (W3) or 22 (W4) are classified as HyLIRGs/ELIRGs. They are termed hot dust-obscured galaxies (DOGs111The original definition of DOGs was flux density at 24 mJy and –[24] 14, where R and [24] represent Vega magnitudes in the -band and 24 , respectively (see Dey et al., 2008, for more detail).) or “W1W2 dropouts” (Eisenhardt et al., 2012; Wu et al., 2012). Indeed, a hot DOG with was reported as the most luminous galaxy in the universe (Tsai et al., 2015). However, Fan et al. (2018) recently reported that this ELIRG is contaminated by a foreground galaxy, resulting in an over estimation of its total IR luminosity by a factor of about two (see also Tsai et al., 2018).
Toba & Nagao (2016) also performed an extensive search for HyLIRGs and ELIRGs by using the Sloan digital sky survey (SDSS: York et al., 2000) and WISE. By combining the SDSS Data Release 12 (DR12: Alam et al., 2015) spectroscopic catalog and ALLWISE catalog (Cutri et al., 2014), they selected optically-faint but IR bright objects with and flux density at 22 3.8 mJy in 14,555 deg2, where and [22] are -band and 22 m AB magnitudes, respectively, yielding 67 objects with spectroscopic redshift. These objects are known as IR-bright DOGs (Toba et al., 2015, 2017a; Noboriguchi et al., 2019). Toba & Nagao (2016) then estimated their tentative IR luminosities based on the spectral energy distribution (SED) fitting with a SED fitting code. SED analysis using Bayesian statistics (SEABASs; Rovilos et al., 2014) (see also Toba et al., 2017c), where they used only SDSS and WISE data (see Figure 6 in Toba & Nagao 2016). Consequently, an IR-bright DOG, WISE J101326.25+611220.1 (hereafter WISE1013+6112) at spectroscopic redshift () = 3.70, was left as an ELIRG candidate.
Toba et al. (2018) then executed follow-up observations of WISE1013+6112 with the submillimetre common user bolometer array 2 (SCUBA-2: Holland et al., 2013) on the James Clerk Maxwell telescope (JCMT) (S17AP002, PI: Y.Toba), and the Submillimeter Array (SMA: Ho et al., 2004) (2016BA003, PI: Y.Toba). They performed the SED fitting by adding data points at 450 and 850 (SCUBA-2/JCMT) and 870 and 1300 (SMA). The derived IR luminosity was , making it an ELIRG. However, as we did not have deep rest-frame MIR and far-IR (FIR) photometry responsible for FIR SED, the derived IR luminosity remains a large uncertainty. In order to constrain IR luminosity of this ELIRG more accurately and to investigate the SF activity and dust property of its host galaxy, we require deep FIR data.
In this paper, we present follow-up observations of an extremely luminous DOG, WISE1013+6112, at 89 and 154 using a high-resolution airborne wideband camera-plus (HAWC+: Harper et al., 2018) on the 2.7-m stratospheric observatory for infrared astronomy (SOFIA) telescope (Temi et al., 2018). These observations with HAWC+/SOFIA enable us to pin down the FIR-SED of WISE1013+6112. Throughout this paper, the adopted cosmology is a flat universe with = 70 km s-1 Mpc-1, = 0.3, and = 0.7, which are same as those adopted in Toba et al. (2018). Solar luminosity is defined as erg s-1 (Mamajek et al., 2015).
2 Data and analysis
2.1 Follow-up observations with SOFIA
Flux densities at 89 and 154 were obtained using HAWC+/SOFIA in Cycle 6 (PI: Y.Toba). The filter transmission profiles222https://www.sofia.usra.edu/science/proposing-and-observing/observers-handbook-cycle-8/7-hawc/71-specifications#FiltersHAWC for these bands are shown in Figure 1. Data have been obtained for the observation (PlanID: 06_0029) during HAWC+ mission 2019-02-13_HA_F546. We performed the total intensity mapping with HAWC+ bands C (89 ) and D (154 ) providing angular resolutions of 7.8 and 13.6 in full width at half maximum (FWHM), respectively. The total on-source integration times were approximately 100 minutes at both 89 and 154 . Data were reduced using the HAWCDPR PIPELINE v1.3.0 (Harper et al., 2018). As the source is faint, this data is processed using the faint option.
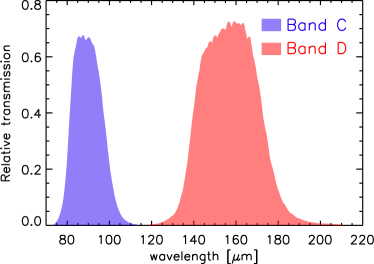
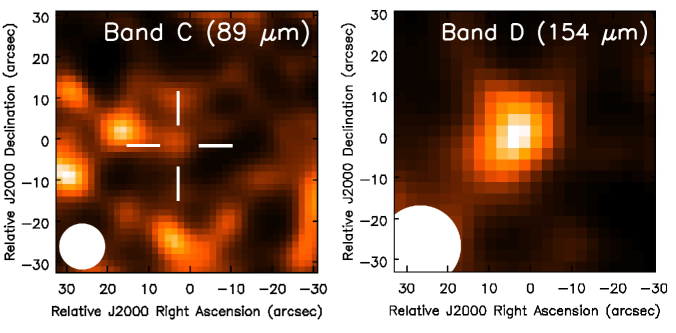
Figure 2 shows the FIR image of WISE1013+6112 taken by HAWC+. WISE1013+6112 was marginally detected at 89 with signal-to-noise ratio (S/N) = 4.1 while this object was clearly detected at 154 with S/N = 9.8 that were evaluated using 2D Gaussian fitting (see below). The flux measurements were performed in the same manner as performed for SCUBA-2 and SMA data in Toba et al. (2018). We employed the common astronomy software applications package (CASA ver. 5.5.0; McMullin et al., 2007). We performed a 2D Gaussian fit for each image and estimated the total fluxes within 10 and 20 aperture, respectively. The photometry of WISE1013+6112 including SOFIA FIR flux densities measured in this work are summarized in Table 2.1.
| WISE J101326.25+611220.1 | |
|---|---|
| R.A. (SDSS) [J2000.0] | 10:13:26.24 |
| Decl. (SDSS) [J2000.0] | +61:12:19.76 |
| Redshift (SDSS) | 3.703 0.001 |
| SDSS-band [Jy] | 1.26aafootnotemark: |
| SDSS-band [Jy] | 3.47 0.47 |
| SDSS-band [Jy] | 13.70 0.67 |
| SDSS-band [Jy] | 13.58 0.95 |
| SDSS-band [Jy] | 21.09 4.03 |
| WISE 3.4 [mJy] | 0.05 0.01 |
| WISE 4.6 [mJy] | 0.13 0.01 |
| WISE 12 [mJy] | 3.30 0.16 |
| WISE 22 [mJy] | 10.70 0.98 |
| HAWC+/SOFIA 89 [mJy] | 22.5 5.5 |
| HAWC+/SOFIA 154 [mJy] | 63.4 6.5 |
| SCUBA-2/JCMT 450 [mJy] | 46.00 8.05bbfootnotemark: |
| SCUBA-2/JCMT 850 [mJy] | 13.35 0.67bbfootnotemark: |
| SMA 870 [mJy] | 13.60 2.72bbfootnotemark: |
| SMA 1.3 mm [mJy] | 6.49 1.30bbfootnotemark: |
| [] | |
| [] | |
| [] | |
| [] | |
| SFR [ yr-1] | |
| [K] | |
| [] | |
| (a) 3 upper limit. | |
| (b) see Toba et al. (2018) in details. | |
2.2 SED fitting with CIGALE
We employed CIGALE333https://cigale.lam.fr/2018/11/07/version-2018-0/ (code investigating galaxy emission: Burgarella et al., 2005; Noll et al., 2009; Boquien et al., 2019) to conduct a detailed SED modeling in a self-consistent framework by considering the energy balance between the ultraviolet/optical and IR. In this code, users can handle various parameters, such as star formation history (SFH), single stellar population (SSP), attenuation law, AGN emission, dust emission, and radio synchrotron emission (see e.g., Toba et al., 2019a, b, c).
SFH is assumed as two exponential decreasing star formation rate (SFR)with different e-folding times (Ciesla et al., 2015, 2016), where we parameterized e-folding time of the main stellar population () and the late starburst population (), mass fraction of the late burst population (), and age of the main stellar population in the galaxy (see Section 3.1.2 in Boquien et al., 2019, in details). We used the stellar templates provided from Bruzual & Charlot (2003) assuming the Chabrier (2003) initial mass function (IMF), and the standard default nebular emission model included in CIGALE (see Inoue, 2011). Dust attenuation is modeled by using the Calzetti et al. (2000) starburst attenuation curve with small Magellanic cloud (SMC) extinction curve (Pei, 1992), where the color excess of the emission lines is parameterized. The color excess of stars, can be converted from by assuming a simple reduction factor ( = ) = 0.44 (Calzetti, 1997). For AGN emission, we utilized models provided by Fritz et al. (2006). In order to avoid a degeneracy of AGN templates in the same manner as in Ciesla et al. (2015) and Toba et al. (2019b), we fixed certain parameters that determine the density distribution of the dust within the torus, i,e., ratio of the maximum to minimum radii of the dust torus (), optical depth at 9.7 (), density profile along the radial and the polar distance coordinates parameterized by and (see equation 3 in Fritz et al., 2006), and opening angle (). Hence, we parameterized the parameter (an angle between equatorial axis and line of sight) that corresponds to a viewing angle of the torus. We further parameterized AGN fraction () that is the contribution of IR luminosity from the AGN to the total IR luminosity (Ciesla et al., 2015).
As one of the purposes of this work is to derive the dust temperature (), we employed the analytic model provided by Casey (2012) for dust emission. This model consists of two components: one is a single temperature modified black body (MBB) and the other is power-law emission in the MIR. As the MIR power-low component is expected to be dominated by the AGN torus emission that was already taken into account in Fritz et al. (2006) model, we focus only on the MBB component. MBB is formulated as , where is the frequency, is the emissivity index of the dust, and is the Planck function. is the optical depth, where is the frequency where optical depth equals unity (Draine, 2006). In this work, we fixed = 1.5 THz ( = 200 ) (e.g., Conley et al., 2011) and = 1.6 (e.g., Fan et al., 2016), and parameterized only . We confirmed that the choice of and does not significantly affect the following results as long as adopting THz and = 1–2 (see also Kovács et al., 2006). Note that Casey (2012) model does not include polycyclic aromatic hydrocarbon (PAH) emission that could dominate MIR emission (particularly for SF galaxies), in exchange for parameterizing dust temperature. However, we confirmed that the resultant IR luminosity is consistent with what we reported in this work even when we used other dust models with PAH emission such as the one by Dale et al. (2014). The detailed parameter ranges adopted in the SED fitting is tabulated in Table 2.2.
| Parameter | Value |
|---|---|
| Double exp. SFH | |
| [Myr] | 50, 100, 500, 1000, 3000 |
| [Myr] | 3, 5, 8, 10 |
| 0.5, 0.7, 0.8, 0.9, 0.95 | |
| age [Myr] | 500, 1000, 3000, 5000 |
| SSP (Bruzual & Charlot, 2003) | |
| IMF | Chabrier (2003) |
| Metallicity | 0.02 |
| Dust attenuation (Calzetti et al., 2000) | |
| 0.2, 0.4, 0.6, 0.8, 1.0 | |
| 0.44 | |
| Extinction curve | SMC (Pei, 1992) |
| AGN emission (Fritz et al., 2006) | |
| 150 | |
| 0.6 | |
| 0.00 | |
| 0.0 | |
| 60 | |
| 0.001, 60.100, 89.990 | |
| 0.1, 0.2, 0.3, 0.4, 0.5, 0.6, 0.7, 0.8, 0.9 | |
| Dust emission (Casey, 2012) | |
| [K] | 10, 20, 30, 40, 50, 60, 70, 80, 90, 100 |
| Emissivity | 1.6 |
3 Results and Discussions
3.1 IR luminosity
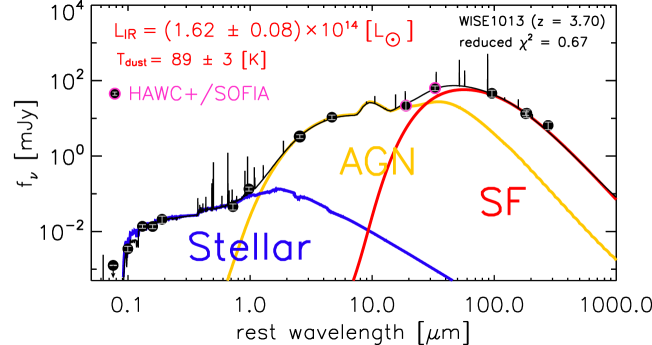
Figure 3 shows the SED of WISE1013+6112 in the rest frame at = 3.70. The observed data points of WISE1013+6112 are well-fitted by the combination of stellar, AGN, and SF components with an adequately reduced (= 0.67). The resultant IR luminosity is that is consistent with that reported in Toba et al. (2018) ( ) within the errors. Nevertheless, we have successfully estimated IR luminosity more accurately owing to additional FIR data taken by HAWC+/SOFIA; the relative error of was reduced approximately to 5%. We confirmed that WISE1013+6112 is still one of the most IR luminous galaxies in the universe.
The AGN fraction defined as (AGN)/ is 0.7, which is smaller than what was reported in Toba et al. (2018) (). This is because Toba et al. (2018) overestimated AGN luminosity owing to the lack of SOFIA data that covered the peak of the FIR luminosity. We found that WISE1013+6112 is still AGN-dominated but SF luminosity moderately contributes to the total IR luminosity (see Section 3.2).
3.2 Host properties
We discuss host properties, stellar mass () and star formation rate (SFR), of WISE1013+6112 in this subsection. The resultant and SFR outputs by CIGALE are and SFR = yr-1, respectively. The stellar mass is in good agreement with that reported in Toba et al. (2018). On the other hand, SFR is 2.2 times larger than that reported in Toba et al. (2018). This is reasonable because Toba et al. (2018) underestimated the SF luminosity as discussed in Section 3.1, and SFR derived here is more reliable with small uncertainty. We confirmed that WISE1013+6112 shows a significant offset with respect to the main-sequence (MS) galaxies at (Tomczak et al., 2016). Given the same stellar mass, SFR of WISE1013+6112 is roughly an order of magnitude higher than that of SF galaxies at similar redshifts, suggesting that WISE1013+6112 still has very active star formation. The resultant SFH, i.e., (, , , age) = (100 Myr, 10 Myr, 0.95, 1000 Myr) suggests that WISE1013+6112 might have an instantaneous starburst that lasts a few hundred Myr.
3.3 Dust temperature
We then discuss the dust temperature () heated by SF activity in WISE1013+6112. Although Toba et al. (2018) discussed qualitatively based on ratio of flux densities at the observed frame between 850 and 22 , our dataset covering around the peak of FIR emission from dust enables us to do more quantitative discussion.
The dust temperature derived by the SED fitting is = 89 3 K. This is significantly higher than submillimeter galaxies (SMGs) (Chapman et al., 2005; Kovács et al., 2006) and that of FIR-selected HyLIRGs (Yang et al., 2007) whose ranges from 30 to 60 K. This result is consistent with what was reported qualitatively in Toba et al. (2018).
This high dust temperature was also reported in a nearby ultraluminous IR galaxy (ULIRG), Arp 220 at = 0.018 (Wilson et al., 2014); the estimated of the eastern part in Arp 220 is about 80 K. The IR luminosity surface density of WISE1013+6112 (with an effective radius of 2 kpc) is about kpc-2 that is roughly consistent with that of eastern “nucleus (0.08 kpc 0.12 kpc)” of Arp 220 (Wilson et al., 2014). This result could suggest that WISE1013+6112 has an extreme activity that is comparable to nucleus activity of nearby ULIRGs, over the galaxy scale.
Figure 4 shows dust temperature as a function of IR luminosity for various DOG populations; IR-faint DOGs at (Melbourne et al., 2012) whose MIR flux densities are fainter than those of IR-bright DOGs, hot DOGs at (Tsai et al., 2015; Fan et al., 2016), and WISE1013+6112 at . We note that the definition of IR luminosity is often different in the literature. Historically, IR luminosity is defined as the one integrated over a wavelength range of 8–1000 (e.g., Sanders & Mirabel, 1996; Chary & Elbaz, 2001), which allows stellar emissions to contribute towards the IR luminosity. On the other hand, recent SED fitting codes such as CIGALE and MAGPHYS (multiwavelength analysis of galaxy physical properties; da Cunha et al., 2008, 2015) employ physically-motivated IR luminosity without any boundary for the integration range in wavelength. The IR luminosity is defined as the energy re-emitted by dust that absorbs radiations from stellar and AGNs (see Boquien et al., 2019). In order to compare IR luminosity with the literature under the same conditions, we integrated the best-fit SED to estimate (8–1000 ) to be , which is plotted in Figure 4.
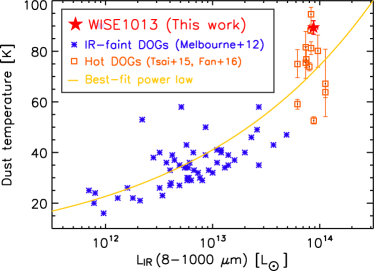
The dust temperature of IR-faint DOGs in Melbourne et al. (2012) is 20–60 K that is consistent with other studies on IR-faint DOGs (Calanog et al., 2013). We found that there is a correlation between and (8–1000 ), with , and WISE1013+6112 is located at the luminous-end of the correlation. The – correlation for IR galaxies was reported by several authors (e.g., Dunne et al., 2000; Chapman et al., 2003; Amblard et al., 2010; Hwang et al., 2010; Magnelli et al., 2014; Liang et al., 2019), although the origin of this correlation is still under debate (see Schreiber et al., 2018, and references therein). One possibility is that as (i) the dust temperature is also likely to depend on redshift (e.g., Magdis et al., 2012; Genzel et al., 2015; Béthermin et al., 2015) and (ii) those DOGs plotted in Figure 4 are flux–limited samples (i.e., IR luminosity correlates with redshift), the observed – correlation might be due to the selection effect.
It should be noted that WISE1013+6112 with flux density at 3.4 50 Jy does not satisfy the selection criteria of hot DOGs444The exact criteria of hot DOGs are W1 17.4 ( 34 Jy), and either (i) W4 7.7 ( 6.9 mJy) and W2 – W4 8.2 or (ii) W3 10.6 ( 1.7 mJy) and W2 – W3 5.3, where W1, W2, W3, and W4 are given in Vega magnitude (Eisenhardt et al., 2012). whose flux density at 3.4 must be smaller than 34 Jy (Eisenhardt et al., 2012). The name “hot” DOGs was originated from a fact that the dust temperature of hot DOGs is much hotter than that of IR-faint, classical DOGs (see Dey et al., 2008; Wu et al., 2012), which is consistent with the trend seen in Figure 4. This result could suggest that once IR luminosity exceeds , i.e., in ELIRG regime, MIR-selected objects may have a high dust temperature regardless of satisfying the hot DOGs criteria.
3.4 Dust mass
Finally, we derive the dust mass () of WISE1013+6112 in the same manner as in Toba et al. (2017d) where is derived from the following formula:
| (1) |
where is flux density at observed frequency (), is the luminosity distance, is the dust mass absorption coefficient at rest frequency (), and ) is the Planck function at temperature and at . We estimated dust mass at 850 ( = 353 GHz) using a dust absorption coefficient of (850 ) = 0.383 cm2 g-1 (Draine, 2003) and the = 89 K (see Section 3.3). Here we employed the Monte Carlo technique to calculate the dust mass and its uncertainty. Assuming a Gaussian distribution with a mean () and sigma (its uncertainty), we randomly chose one value among the distributions as an adopted . We repeated this process 10,000 times and calculated the mean and standard deviation of the resultant distribution. The estimated dust mass is . The estimated dust-to-stellar mass ratio of WISE1013+6112 is that is roughly consistent with that of star-forming galaxies at (Santini et al., 2014; Calura et al., 2017).
We found that the resultant dust mass of WISE1013+6112 is inconsistent with what expected from –SFR relation for local galaxies at (da Cunha et al., 2010); extrapolating the relation to high SFR shows that observed dust mass is about two orders of magnitude smaller than predicted (see also Lianou et al., 2019). This would indicate that –SFR relation depend on the redshift. This discrepancy was also reported by Hjorth et al. (2014) who mentioned that a difference of evolutionally sequence causes galaxies to move around in the diagram and contributes to the scatter of the –SFR relation. Indeed, give a high SFR, dust mass of dusty starburst galaxies at 2–4 tends to have smaller dust mass compared to local SDSS galaxies (Swinbank et al., 2014). The dust mass of those high-z starburst galaxies is roughly consistent with that of WISE1013+6112. Nevertheless, in order to explain such a large dust mass of WISE1013+6112 at , an efficient and rapid dust formation process may be required (Hjorth et al., 2014).
4 Summary and conclusions
In this paper, we report FIR properties of an extremely-luminous DOG (WISE1013+6112) at = 3.703. Thanks to the multi-wavelength data set of the SDSS, WISE, SOFIA, SCUBA-2, and SMA, we pinned down their SED at rest-frames of 0.1–300 . In particular, adding the observed-frames 89 and 154 data taken by HAWC+ is crucial to constrain the peak of FIR SED. We derived the physical quantities of WISE1013+6112 such as IR luminosity and dust temperature based on the SED fitting with CIGALE. The resultant IR luminosity is = (1.62 0.08) , making it one of the most luminous IR galaxies in the universe. The derived dust temperature is = 89 3 K that is significantly higher than that of other populations such as SMGs and FIR-selected galaxies. We observed that there exists a positive correlation between and of DOGs including classical IR-faint DOGs and hot DOGs, with , and WISE1013+6112 is located at the luminous-end of this correlation. The dust mass inferred from is that is inconsistent with what expected from –SFR relation for local galaxies. An efficient formation of dust from the metals may need to be considered to produce such a high dust mass given the redshift of .
References
- Alam et al. (2015) Alam, S., Albareti, F. D., Allende Prieto, C., et al. 2015, ApJS, 219, 12
- Amblard et al. (2010) Amblard, A., Cooray, A., Serra, P., et al. 2010, A&A, 518, L9
- Boquien et al. (2019) Boquien, M., Burgarella, D., Roehlly, Y., et al. 2019, A&A, 622, A103
- Béthermin et al. (2015) Béthermin, M., Daddi, E., Magdis, G., et al. 2015, A&A, 573, A113
- Blecha et al. (2018) Blecha, L., Snyder, G. F., Satyapal, S., & Ellison, S. L. 2018, MNRAS, 478, 3056
- Bruzual & Charlot (2003) Bruzual, G., & Charlot, S. 2003, MNRAS, 344, 1000
- Burgarella et al. (2005) Burgarella, D., Buat, V., & Iglesias-Páramo, J. 2005, MNRAS, 360, 1413
- Calanog et al. (2013) Calanog, J. A., Wardlow, J., Fu, H., et al. 2013, ApJ, 775, 61
- Casey (2012) Casey, C. M. 2012, MNRAS, 425, 3094
- Calura et al. (2017) Calura, F., Pozzi, F., Cresci, G., et al. 2017, MNRAS, 465, 54
- Calzetti (1997) Calzetti, D. 1997, in American Institute of Physics Conference Series, Vol. 408, American Institute of Physics Conference Series, ed. W. H. Waller, 403–412
- Calzetti et al. (2000) Calzetti, D., Armus, L., Bohlin, R. C., et al. 2000, ApJ, 533, 682
- Chabrier (2003) Chabrier, G. 2003, PASP, 115, 763
- Chapman et al. (2003) Chapman, S. C., Helou, G., Lewis, G. F., & Dale, D. A. 2003, ApJ, 588, 186
- Chapman et al. (2005) Chapman S. C., Blain A. W., Smail I., Ivison R. J., 2005, ApJ, 622, 772
- Chary & Elbaz (2001) Chary, R., & Elbaz, D. 2001, ApJ, 556, 562
- Ciesla et al. (2016) Ciesla, L., Boselli, A., Elbaz, D., et al. 2016, A&A, 585, A43
- Ciesla et al. (2015) Ciesla, L., Charmandaris, V., Georgakakis, A., et al. 2015, A&A, 576, A10
- Conley et al. (2011) Conley, A., Cooray, A., Vieira, J. D., et al. 2011, ApJ, 732, L35
- Cutri et al. (2014) Cutri, R. M., & et al. 2014, VizieR Online Data Catalog, 2328, 0
- Dale et al. (2014) Dale, D. A., Helou, G., Magdis, G. E., et al. 2014, ApJ, 784, 83
- da Cunha et al. (2008) da Cunha, E., Charlot, S., & Elbaz, D. 2008, MNRAS, 388, 1595
- da Cunha et al. (2010) da Cunha, E., Eminian, C., Charlot, S., & Blaizot, J. 2010, MNRAS, 403, 1894
- da Cunha et al. (2015) da Cunha, E., Walter, F., Smail, I. R., et al. 2015, ApJ, 806, 110
- Dey et al. (2008) Dey, A., Soifer, B. T., Desai, V., et al. 2008, ApJ, 677, 943
- Draine (2003) Draine, B. T. 2003, ARA&A, 41, 241
- Draine (2006) Draine, B. T. 2006, ApJ, 636, 1114
- Dunne et al. (2000) Dunne, L., Eales, S., Edmunds, M., et al. 2000, MNRAS, 315, 115
- Eisenhardt et al. (2012) Eisenhardt, P. R. M., Wu, J., Tsai, C.-W., et al. 2012, ApJ, 755, 173
- Fan et al. (2016) Fan, L., Han, Y., Nikutta, R., Drouart, G., & Knudsen, K. K. 2016, ApJ, 823, 107
- Fan et al. (2018) Fan, L., Gao, Y., Knudsen, K. K., & Shu, X. 2018, ApJ, 854, 157
- Fritz et al. (2006) Fritz, J., Franceschini, A., & Hatziminaoglou, E. 2006, MNRAS, 366, 767
- Gruppioni et al. (2013) Gruppioni, C., Pozzi, F., Rodighiero, G., et al. 2013, MNRAS, 432, 23
- Genzel et al. (2015) Genzel, R., Tacconi, L. J., Lutz, D., et al. 2015, ApJ, 800, 20
- Harper et al. (2018) Harper, D. A., Runyan, M. C., Dowell, C. D., et al. 2018, JAI, 7, 1840008
- Hjorth et al. (2014) Hjorth, J., Gall, C., & Michałowsk, M. J. 2014, ApJ, 782, L23
- Ho et al. (2004) Ho, P. T. P., Moran, J. M., & Lo, K. Y. 2004, ApJ, 616, L1
- Holland et al. (2013) Holland, W. S., Bintley, D., Chapin, E. L., et al. 2013, MNRAS, 430, 2513
- Hopkins et al. (2008) Hopkins, P. F., Hernquist, L., Cox, T. J., & Kereš, D. 2008, ApJS, 175, 356
- Hwang et al. (2010) Hwang, H. S., Elbaz, D., Magdis, G., et al. 2010, MNRAS, 409, 75
- Inoue (2011) Inoue, A. K. 2011, MNRAS, 415, 2920
- Kovács et al. (2006) Kovács A., Chapman S. C., Dowell C. D., Blain A. W., Ivison R. J., Smail I., Phillips T. G., 2006, ApJ, 650, 592
- Landsman (1993) Landsman, W. B. 1993, in ASP Conf. Ser. 52, Astronomical Data Analysis Software and Systems II, ed. R. J. Hanisch, R. J. V. Brissenden, & J. Barnes (San Francisco, CA: ASP), 246
- Liang et al. (2019) Liang, L., Feldmann, R., Keres̆, D., et al. 2019, MNRAS, 489, 1397
- Lianou et al. (2019) Lianou S., Barmby P., Mosenkov A., et al. 2019, A&A, 631, 38
- Magdis et al. (2012) Magdis, G. E., Daddi, E., Béthermin, M., et al. 2012, ApJ, 760, 6
- Magnelli et al. (2014) Magnelli, B., Lutz, D., Saintonge, A., et al. 2014, A&A, 561, A86
- Mamajek et al. (2015) Mamajek, E. E., Prsa, A., Torres, G., et al. 2015, arXiv:1510.07674
- McMullin et al. (2007) McMullin, J. P., Waters, B., Schiebel, D., Young, W., & Golap, K. 2007, in ASP Conf. Ser. 376, Astronomical Data Analysis Software and Systems XVI, ed. R. A. Shaw, F. Hill, & D. J. Bell (San Francisco, CA: ASP), 127
- Melbourne et al. (2012) Melbourne, J., Soifer, B., Desai, V., et al. 2012, AJ, 143, 125
- Narayanan et al. (2010) Narayanan, D., Dey, A., Hayward, C. C., et al. 2010, MNRAS, 407, 1701
- Noboriguchi et al. (2019) Noboriguchi, A., Nagao, T., Toba, Y., et al. 2019, ApJ, 876, 132
- Noll et al. (2009) Noll, S., Burgarella, D., Giovannoli, E., et al. 2009, A&A, 507, 3
- Pei (1992) Pei, Y. C. 1992, ApJ, 395, 130
- Ricci et al. (2017) Ricci, C., Bauer, F. E., Treister, E., et al. 2017, MNRAS, 468, 1273
- Rovilos et al. (2014) Rovilos, E., Georgantopoulos, I., Akylas, A., et al. 2014, MNRAS, 438, 494
- Rowan-Robinson (2000) Rowan-Robinson, M. 2000, MNRAS, 316, 885
- Rowan-Robinson & Wang (2010) Rowan-Robinson, M., & Wang, L. 2010, MNRAS, 406, 720
- Sanders & Mirabel (1996) Sanders, D. B., & Mirabel, I. F. 1996, ARA&A, 34, 749
- Santini et al. (2014) Santini, P., Maiolino, R., Magnelli, B., et al. 2014, A&A, 562, A30
- Schreiber et al. (2018) Schreiber, C., Elbaz, D., Pannella, M., et al. 2018, A&A, 609, A30
- Swinbank et al. (2014) Swinbank, A. M., Simpson, J. M., Smail, I., et al. 2014, MNRAS, 438, 1267
- Temi et al. (2018) Temi, P., Hoffman, D., Ennico, K., & Le, J. 2018, JAI, 7, 1840011
- Toba et al. (2015) Toba, Y., Nagao, T., Strauss, M. A., et al. 2015, PASJ, 67, 86
- Toba & Nagao (2016) Toba, Y., & Nagao, T. 2016, ApJ, 820, 46
- Toba et al. (2017a) Toba, Y., Nagao, T., Kajisawa, M., et al. 2017a, ApJ, 835, 36
- Toba et al. (2017b) Toba, Y., Nagao, T., Wang, W-H., et al. 2017b, ApJ, 840, 21,
- Toba et al. (2017c) Toba, Y., Bae, H-J., Nagao, T., et al. 2017c, ApJ, 850, 140
- Toba et al. (2017d) Toba, Y., Komugi, S., Nagao, T., et al. 2017d, ApJ, 851, 98
- Toba et al. (2018) Toba Y., Ueda J., Lim C.-F., et al. 2018, ApJ, 857, 31
- Toba et al. (2019a) Toba, Y., Ueda, Y., Matsuoka, K., et al. 2019a, MNRAS, 484, 196
- Toba et al. (2019b) Toba, Y., Yamashita, T., Nagao, T., et al. 2019b, ApJS, 243, 15
- Toba et al. (2019c) Toba, Y., Yamada, S., Ueda, Y., et al. 2019c, ApJ, in press. (arXiv:1911.04702)
- Tomczak et al. (2016) Tomczak, A. R., Quadri, R. F., Tran, K.-V. H., et al. 2016, ApJ, 817, 118
- Tsai et al. (2015) Tsai, C.-W., Eisenhardt, P. R. M., Wu, J., et al. 2015, ApJ, 805, 90
- Tsai et al. (2018) Tsai, C.-W., Eisenhardt, P. R. M., Jun, H. D., et al. 2018, ApJ, 868, 15
- Wilson et al. (2014) Wilson, C. D., Rangwala, N., Glenn, J., et al. 2014, ApJ, 789, L36
- Wright et al. (2010) Wright, E. L., Eisenhardt, P. R. M., Mainzer, A. K., et al. 2010, AJ, 140, 1868
- Wu et al. (2012) Wu, J., Tsai, C.-W., Sayers, J., et al. 2012, ApJ, 756, 96
- Yang et al. (2007) Yang M., Greve T. R., Dowell C. D., Borys C., 2007, ApJ, 660, 1198
- York et al. (2000) York, D. G., Adelman, J., Anderson, J. E., Jr., et al. 2000, AJ, 120, 1579