Present address: ]National Aeronautics and Space Administration/Goddard Space Flight Center
Energy of the 229Th Nuclear Clock Isomer Determined by Absolute -ray Energy Difference
Abstract
The low-lying isomeric state of 229Th provides unique opportunities for high-resolution laser spectroscopy of the atomic nucleus. We determine the energy of this isomeric state by taking the absolute energy difference between the excitation energy required to populate the 29.2-keV state from the ground-state and the energy emitted in its decay to the isomeric excited state. A transition-edge sensor microcalorimeter was used to measure the absolute energy of the 29.2-keV -ray. Together with the cross-band transition energy (29.2 keVground) and the branching ratio of the 29.2-keV state measured in a recent study, the isomer energy was determined to be 8.300.92 eV. Our result is in agreement with latest measurements based on different experimental techniques, which further confirms that the isomeric state of 229Th is in the laser-accessible vacuum ultraviolet range.
The energy of the first-excited isomeric state of 229Th is sufficiently low so that it can be excited by laser light Beck-PRL-2007 ; Seiferle-Nature-2019 . The natural linewidth of the transition between the ground and the isomer states is predicted to be on the order of mHz Tkalya-PRC-2015 ; Minkov-PRL-2017 . Therefore this nuclear transition offers unique opportunities for laser spectroscopy of the atomic nucleus. One of the promising applications is an optical nuclear clock: an atomic clock referencing a nuclear transition Peik-EL-2003 . Since the atomic nucleus is highly isolated from the environment due to shielding by the electron cloud, fractional accuracy of the nuclear clock is expected to approach 110-19 Campbell-PRL-2012 . Extensive experimental efforts have been made to accurately measure this nuclear transition energy ( in Fig. 1) Beck-PRL-2007 ; Seiferle-Nature-2019 ; Wense-Nature-2016 ; Jeet-PRL-2015 ; Yamaguchi-NJP-2015 ; Stellmer-PRC-2018 ; Masuda-Nature-2019 . While early measurements suggested energy values of 3.5 Helmer-PRC-1994 or 5.5 eV Guimaraes-PRC-2005 , in the latest measurements the value drastically increased to 7.8 Beck-PRL-2007 and 8.28 eV Seiferle-Nature-2019 . Further measurements based on different experimental techniques are important to improve the confidence in the energy of the isomer state.
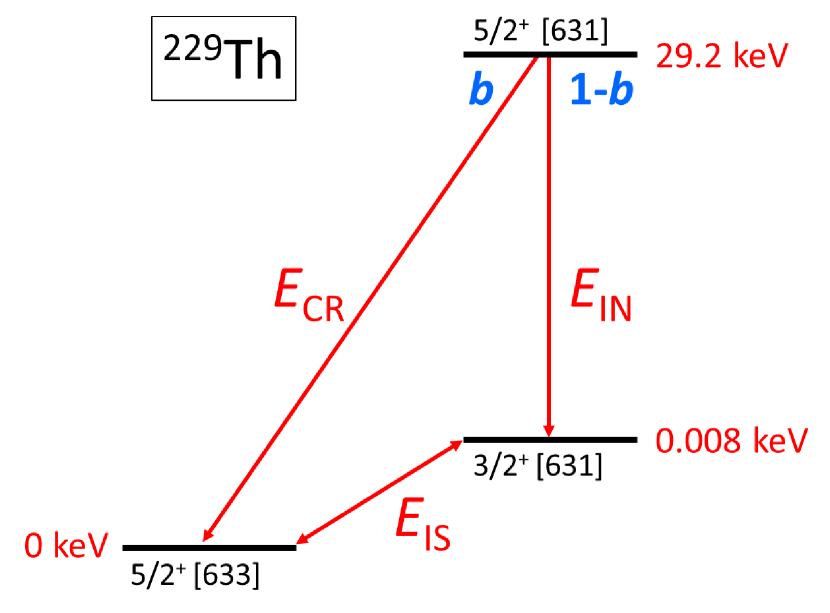
Here we determine by taking the difference of absolute energies between two 29.2-keV transitions ( and in Fig. 1). The cross-band transition energy and the branching ratio were recently experimentally determined by resonantly exciting the 29.2-keV state with narrow-band synchrotron radiation Masuda-Nature-2019 . In order to determine , we performed spectroscopy of -rays emitted from the decay of the 29.2-keV state. Two -rays, and , were not directly resolved due to insufficient detector resolution. Instead, a single spectrum, whose peak energy is the weighted average of the two peaks (), was observed. Thanks to the precise value of and Masuda-Nature-2019 , we were able to extract and determine by .
The value was previously measured by using a low energy photon spectrometer Barci-PRC-2003 and X-ray spectrometer Beck-PRL-2007 . In this study, we measured by using a single-pixel transition edge sensor (TES) microcalorimeter Irwin_CPD_2005 . We find that our value disagrees with the previous measurement (3.8 discrepancy from the value in Ref. Barci-PRC-2003 where is their standard deviation), but the extracted is in agreement with latest two measurements based on different experimental techniques Beck-PRL-2007 ; Seiferle-Nature-2019 .
| Line | Energy | Width | Ref. |
|---|---|---|---|
| Ag | 21990.30 (10) | 9.32 | Deslattes-RMP-2003 ; Krause-JPCRD-1979 |
| Ag | 22162.917 (30) | 9.16 | Deslattes-RMP-2003 ; Krause-JPCRD-1979 |
| 241Am(26.3 keV) | 26344.6 (2) | - | Helmer-NIMPRA-2000 |
| Cs | 30625.40 (45) | 15.80 | Deslattes-RMP-2003 ; Krause-JPCRD-1979 |
| Cs | 30973.13 (46) | 15.60 | Deslattes-RMP-2003 ; Krause-JPCRD-1979 |
We detected the 29.2-keV -rays emitted following -decay of 233U. The 26 MBq of 233U was first chemically purified as 233UO2Cl2 by an ion exchange column to remove daughter nuclei. It was then dissolved in dilute hydrochloric acid and sealed in a container made of 0.5-mm-thick fluorocarbon polymer, resulting in attenuation of the 29.2-keV -rays by the container wall of less than 5%. Diameter and thickness of this 233U source is 25 mm and 3 mm, respectively. The source is attached to outside of a 1-mm thick beryllium window of a dilution refrigerator in which the TES is installed. The distance between the source and the TES pixel is 5 cm. The TES pixel is made of a titanium-gold bilayer whose transition temperature is designed to be 164 mK. The 3.6-m thick and 300-m square gold absorber is attached to the TES pixel Muramatsu_IEEE_2017 . Based on results of Monte Carlo simulations, we estimate the total detection efficiency of the 29.2-keV -rays, including both solid angle and absorption efficiency of -rays by an absorber, to be on the order of 10-7. Energy resolution for 29.2-keV -rays was observed to be 36 eV (full width at half maximum) at a heat sink temperature of 90 mK.
The TES is biased with a pseudo constant voltage using a shunt resistor Irwin_CPD_2005 , and the signal is obtained from the TES current measured by a superconducting quantum interference device (SQUID) array amplifier Sakai_JLTP_2014 . The SQUID output voltage was recorded by a 15-bit digitizer and, in the offline analysis, restored to the TES current. The pulse-height of the TES current exhibits a non-linear response to the incident -ray energy because of several reasons Peille-SPIE-2016 . A part of the non-linearity can be removed by converting the TES current to the TES resistance value Bandler_NIMPRA_2006 . Spectral data was collected for 18 consecutive days, during which the detector gain drifted due to a change of the detector temperature. We thus divided all data into blocks, where the gain drift is negligible. Each data block was processed independently with the optimum filter Szymkowiak-JLTP-1993 to make a pulse height amplitude (PHA) spectrum. The total PHA spectrum (Fig. 2) was obtained by combining all PHA spectra.
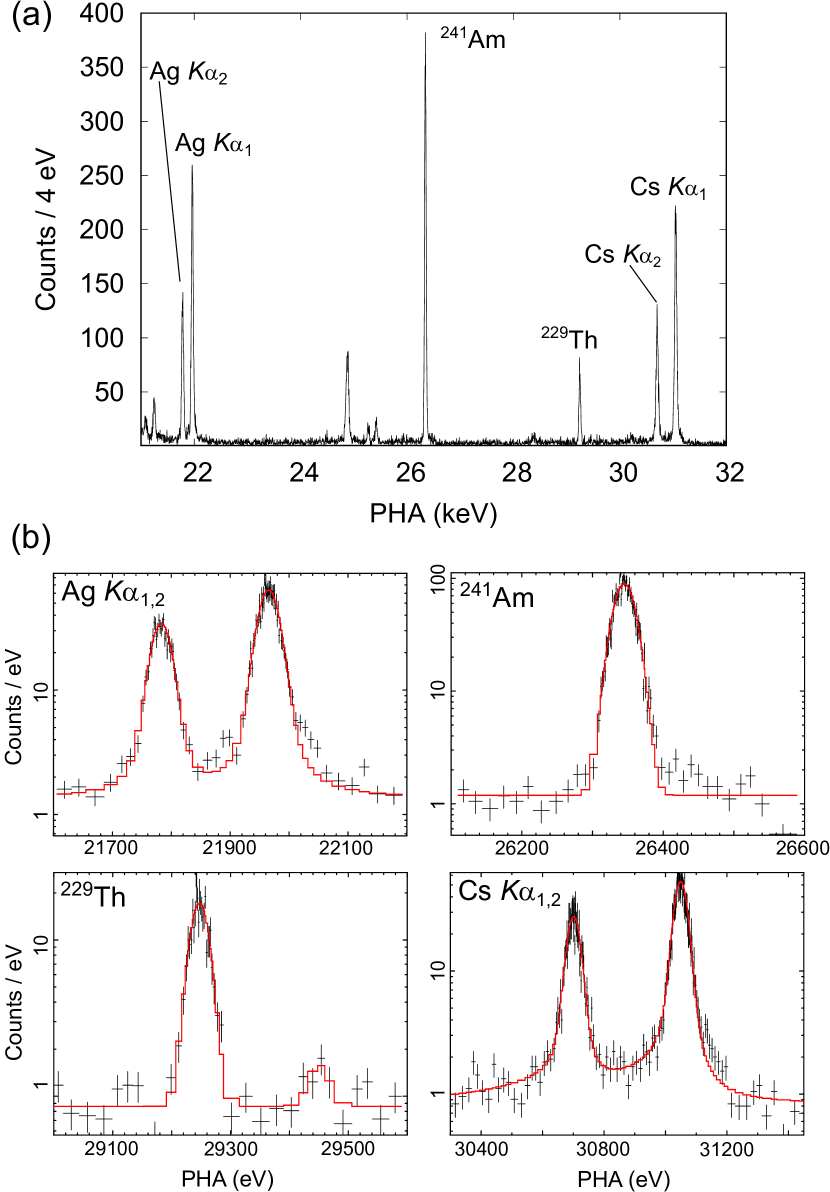
The PHA shows non-linearity to the -ray energy, and thus energy calibration plays a crucial role in this study. We chose five - and X-rays as the energy calibration lines around the 29.2-keV target peak (as labeled in Fig. 2(a)). In Table 1, the energy and natural linewidth of each calibration line are listed. These calibration peaks are simultaneously recorded with the 29.2-keV target peak by attaching 241Am (2.4 MBq) and 133Ba (59 kBq) sources behind the 233U source. The Cs X-rays are emitted in the process of electron capture (EC) decay of 133Ba. The 26.3-keV -rays are from -decay of 241Am. Since our 241Am source is electroplated onto a silver plate, the Ag X-rays are emitted mainly when the strong 59.5-keV -rays from the 241Am source are photoelectrically absorbed by the silver plate.
| dof | /dof | ||
|---|---|---|---|
| 1 | 3 | 10909 | |
| 30563 | |||
| 2 | 2 | 1.07 | |
| 0.05 | |||
| 3 | 1 | 2.05 |
a The order of polynomial. The number of free parameters is .
The centroid PHA values of all calibration peaks and the 29.2-keV target peak were determined by model fitting of the PHA spectrum with a maximum likelihood method. For X-ray calibration peaks, we used a Voigt function as a model function. The natural linewidth was fixed to the literature value (see Table 1) which was converted into the PHA value by assuming a locally linear PHA-to-energy relation Muramatsu_IEEE_2017 . The -ray peaks at 26.3 keV (241Am) and 29.2 keV (229Th) were fitted with a Gaussian function. Here we assumed a constant background within a fitting region. Detailed spectra are shown in Fig. 2(b) where the red curve represents the best-fit model curve. The 1 errors of the centroid PHA values were also estimated from the model fits. The total counts in the 29.2-keV peak was 630(30). A small peak observed at the higher-PHA side of the 29.2-keV target peak in the 229Th spectrum corresponds to the 7/2+[631](71.82 keV)7/2+[633](42.43 keV) cross-band transition (not shown in Fig. 1).
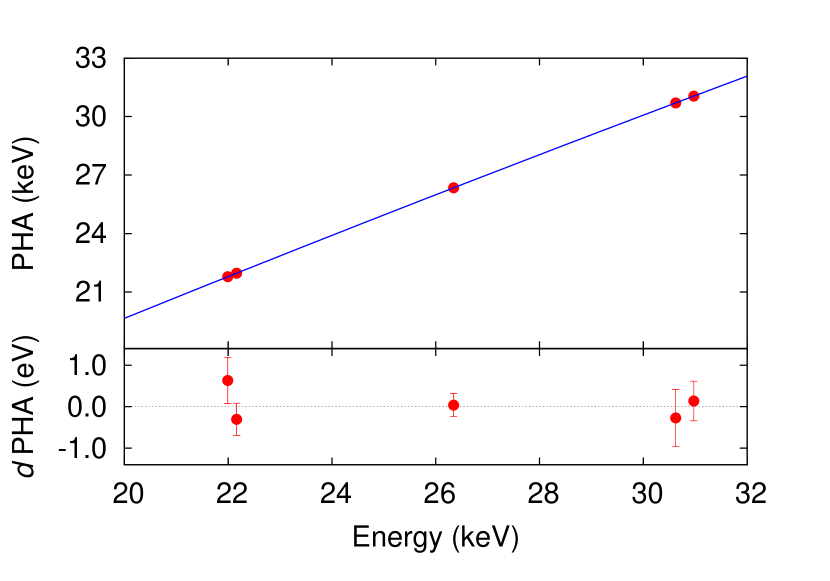
In order to accurately determine the 29.2 keV -ray energy, we need to define a suitable calibration curve which precisely converts PHA to energy. Within the limited energy range from 21.9 keV to 31 keV, in which all calibration lines and the 29.2-keV target line are contained, we found that the calibration curve can be well-approximated by a polynomial function. To find the optimal polynomial order, we performed fitting of the PHA-to-energy relation with -th order polynomial functions where 1, 2, or 3. For the s of the , the 1 errors of the centroid PHA values from the maximum-likelihood PHA fits were used. The errors of energies will be included later in the systematic errors. The best value was determined to be 2 from the value of improvement Bevington-1969 (Table 2). The value from -th to -th order polynomial model is defined by , where and dof are, respectively, the minimum value and the degrees of freedom of -th order polynomial fit. is very large and the improvement is statistically significant. On the other hand, is smaller than unity, which indicates that the added parameter just represents the statistical fluctuation. We thus employed a 2nd-order polynomial function as a calibration curve. In Fig. 3, the PHA values of five calibration lines are plotted as a function of their energies. The best-fit 2nd order polynomial calibration curve is shown by a blue curve. The PHA (= data model) values at each calibration peak are also shown in Fig. 3. By using this calibration curve, the absolute energy of the 29.2-keV -ray was determined to be 29182.51 eV. For further validation of the calibration curve, we checked the energy of the 25.5-keV Ag X-ray and the 25.3-keV 229Th -ray lines in Fig. 2(a), neither of which were used to define the calibration curve. The first energy, for Ag in a metal form, was determined to be 25456.6(11) eV. Although there is some uncertainty of less than 0.4 eV mainly due to the so-called shake-off effect Hansen-AISP-1985 , the value is in agreement with 25456.71(31) eV in Ref. Deslattes-RMP-2003 . The second energy was determined to be 25308.4(19) eV, which agrees with 25310.6(8) eV in Ref. Helmer-PRC-1994 .
As statistical error for , we considered the following two errors. One is the 1 error of centroid PHA value of the 29.2-keV spectrum converted to energy, which is 0.67 eV. The other is caused by 1 statistical errors of three coefficients of the 2nd order polynomial calibration curve. To evaluate this, we calculated values for all combinations of three coefficients which satisfied , where is the minimum value of the fit. We converted the centroid PHA of 29.2-keV line to the energy for each combination. Then the minimum and the maximum energies give the error range. The total statistical error was estimated from root sum square of the two errors, which is 0.72 eV.
The following three errors are considered as systematic errors for . The first is the errors in the literature values as listed in Table 1. The second is the errors due to various effects which could shift the X-ray energies. For such effects, we regarded hyperfine, chemical and shake-off effects as follows Hansen-AISP-1985 . The final state of the X-ray transition has two hyperfine states Breit-PR-1930 . When the transition probability to these states is not equal, the X-ray spectral peak shifts. Such a shift could occur when, for example, X-rays are generated by the EC decay Borchert-PL-1977 . Since whether X-rays used in the literature were generated by photoionization or EC decay is not clear, we took half of the hyperfine splitting energy as the largest possible error due to hyperfine effect, which is estimated to be 0.03 eV for Ag and 0.36 eV for Cs Hansen-AISP-1985 . The chemical effect can be partially estimated based on the formula given in Ref. Sumbaev-JETP-1970 . However, information on the chemical condition of both our calibration sources and sources used in the literature is sparse. We therefore did not include the chemical effect in our systematic error. If we assume the largest possible coordination number (12 for Cs and 8 for Ag Shannon-AC-1976 ) and electronegativity difference (2.65 for Cs and 2.05 for Ag) as an example, the chemical shift could be estimated to be 0.08 and 0.10 eV for Ag , 0.26 and 0.31 eV for Cs , which would contribute to the total systematic error by only 0.01 eV. For the error induced by the shake-off effect Crasemann-PRC-1979 , we conservatively estimated it to be 0.05 eV for all X-rays based on the discussions in Ref. Hansen-AISP-1985 . The combined systematic error caused by the aforementioned first and second errors was determined by a Monte Carlo simulation where we fixed the PHA value for all calibration lines and scanned the energy within each systematic error. Here we used a Gaussian function as a distribution of errors for the literature value and a flat function for all other errors. At each set of energies, we calculated a calibration curve and derived the 29.2-keV energy. The standard deviation of the 29.2-keV energies was taken as the combined systematic error, which is 0.22 eV. The third error is the error due to an inappropriate functional form for the calibration curve. A cubic spline curve with natural boundary conditions Fowler-Metrologia-2017 was tested as a calibration curve, resulting in an energy discrepancy of 0.25 eV. We therefore determined the overall systematic error by taking a root sum square of both errors (0.22 eV and 0.25 eV), which is 0.33 eV.
As an absolute energy , we concluded
The root sum square of statistical and systematic errors is 0.79 eV. In order to determine by , we need to extract from . As discussed earlier, they are related to each other by . The and values were experimentally measured to be 29189.930.07 eV and 0.1060.027 in a recent study Masuda-Nature-2019 . Combining these values, we determined the isomer energy to be
Here we included the errors of and in the systematic error. The root sum square of statistical and systematic errors is 0.92 eV.
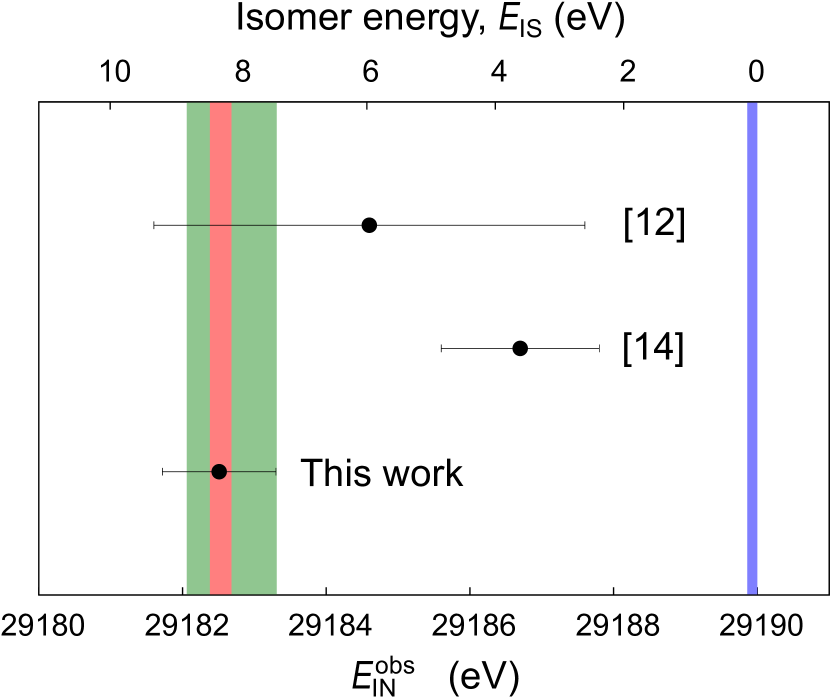
In Fig. 4, the value determined in this study is compared to previous measurements. The isomer energy calculated by is presented in the upper side of the figure. The blue bar indicates Masuda-Nature-2019 . The green and red bands denote the isomer energies with errors reported in Refs. Beck-PRL-2007 and Seiferle-Nature-2019 , respectively. In Ref. Beck-PRL-2007 , the isomer energy is determined to be 7.80.5 eV by using an estimated . If we replace the by the experimental value reported in Ref. Masuda-Nature-2019 , their isomer energy can be estimated to be 8.10.7 eV, which is shown in Fig. 4 as a green band. While our new differs from the most accurate previous value (29186.71.1 eV Barci-PRC-2003 ) by more than 3.8 in their uncertainty, the extracted isomer energy agrees with both latest measurements (red and green bands) within their 1 uncertainty.
In summary, the energy of the first isomeric state in 229Th is determined to be 8.300.92 eV by measuring the absolute energy difference between two transitions from the 29.2-keV second-excited state. The absolute energy of the 29.2-keV -ray following -decay of 233U was measured by a single-pixel TES microcalorimeter. Agreement between our value and two latest values measured by different experimental techniques further confirms that the energy of the 229Th nuclear clock isomer is in the laser-accessible vacuum ultraviolet range and paves the way for high-resolution laser spectroscopy of the atomic nucleus.
We thank D. Aoki for supports to conduct this research and T. Yamamura for technical supports to prepare the 233U source. We also thank T. Masuda, A. Yoshimi, K. Yoshimura and A. Hinton for their valuable comments on the manuscript. This work was supported by JSPS Grant-in-Aid for Scientific Research (B) Grant No. JP18H01241. A.Y. acknowledges Technology Pioneering Projects in RIKEN. The 233U sample used in this study is provided by the 233U cooperation project between JAEA and the Inter-University Cooperative Research Program of the Institute for Materials Research, Tohoku University (proposal no.17K0204). H.M. is partially supported by JSPS Grant-in-Aid for JSPS Fellows Grant No. 17J07990. We fabricated the TES microcalorimeter partly using the nano-electronics fabrication facility of JAXA. The SQUID array amplifier was fabricated by CRAVITY of AIST.
References
- (1) B. R. Beck, J. A. Becker, P. Beiersdorfer, G. V. Brown, K. J. Moody, J. B. Wilhelmy, F. S. Porter, C. A. Kilbourne, and R. L. Kelley, Energy Splitting of the Ground-State Doublet in the Nucleus 229Th, Phys. Rev. Lett. 98, 142501 (2007); B. R. Beck, C. Y. Wu, P. Beiersdorfer, G. V. Brown, J. A. Becker, K. J. Moody, J. B. Wilhelmy, F. S. Porter, C. A. Kilbourne, R. L. Kelley, Improved Value for the Energy Splitting of the Ground-State Doublet in the Nucleus 229mTh, LLNL-PROC-415170 (2009).
- (2) B. Seiferle, et al., Energy of the 229Th nuclear clock transition, Nature 573, 243 (2019).
- (3) E. V. Tkalya, C. Schneider, J. Jeet, and E. R. Hudson, Radiative lifetime and energy of the low-energy isomeric level in 229Th, Phys. Rev. C 92, 054324 (2015).
- (4) N. Minkov and A. Pálffy, Reduced Transition Probabilities for the Gamma Decay of the 7.8 eV Isomer in 229Th, Phys. Rev. Lett. 118, 212501 (2017).
- (5) E. Peik and Chr. Tamm, Nuclear laser spectroscopy of the 3.5 eV transition in Th-229, Europhys. Lett. 61, 181 (2003).
- (6) C. J. Campbell, A. G. Radnaev, A. Kuzmich, V. A. Dzuba, V. V. Flambaum, and A. Derevianko, Single-Ion Nuclear Clock for Metrology at the 19th Decimal Place, Phys. Rev. Lett. 108, 120802 (2012).
- (7) L. von der Wense et al., Direct detection of the 229Th nuclear clock transition, Nature 533, 47 (2016).
- (8) J. Jeet, C. Schneider, S. T. Sullivan, W. G. Rellergert, S. Mirzadeh, A. Cassanho, H. P. Jenssen, E. V. Tkalya, and E. R. Hudson, Results of a Direct Search Using Synchrotron Radiation for the Low-Energy 229Th Nuclear Isomeric Transition, Phys. Rev. Lett. 114, 253001 (2015).
- (9) A. Yamaguchi, M. Kolbe, H. Kaser, T. Reichel, A. Gottwald, and E. Peik, Experimental search for the low-energy nuclear transition in 229Th with undulator radiation, New J. Phys. 17, 053053 (2015).
- (10) S. Stellmer, Y. Shigekawa, V. Rosecker, G. A. Kazakov, Y. Kasamatsu, Y. Yasuda, A. Shinohara, and T. Schumm, Toward an energy measurement of the internal conversion electron in the deexcitation of the 229Th isomer, Phys. Rev. C 98, 014317 (2018).
- (11) T. Masuda et al., X-ray pumping of the 229Th nuclear clock isomer, Nature 573, 238 (2019).
- (12) R. G. Helmer and C. W. Reich, An excited state of 229Th at 3.5 eV, Phys. Rev. C 49, 1845 (1994).
- (13) Z. O. Guimarães-Filho and O. Helene, Energy of the 3/2+ state of 229Th reexamined, Phys. Rev. C 71, 044303 (2005).
- (14) V. Barci, G. Ardisson, G. Barci-Funel, B. Weiss, O. El Samad, and R. K. Sheline, Nuclear structure of 229Th from -ray spectroscopy study of 233U -particle decay, Phys. Rev. C 68, 034329 (2003).
- (15) K. D. Irwin and G. C. Hilton, Transition-Edge Sensors, in Cryogenic Particle Detection, Top. Appl. Phys., vol. 99, edited by C. Enss (Springer, Berlin, Heidelberg, 2005) p. 63.
- (16) R. D. Deslattes, E. G. Kessler Jr., P. Indelicato, L. de Billy, E. Lindroth, and J. Anton, X-ray transition energies: new approach to a comprehensive evaluation, Rev. Mod. Phys. 75, 35 (2003).
- (17) M. O. Krause and J. H. Oliver, Natural widths of atomic and levels, X-ray lines and several Auger lines, J. Phys. Chem. Ref. Data 8, 329 (1979).
- (18) R. G. Helmer and C. van der Leun, Recommended standards for -ray energy calibration (1999), Nucl. Instr. and Meth. A 450, 35 (2000).
- (19) H. Muramatsu, T. Hayashi, K. Maehisa, Y. Nakashima, K. Mitsuda, N. Y. Yamasaki, T. Hara, K. Maehata, A Study of X-Ray Response of the TES X-Ray Microcalorimeter for STEM, IEEE Trans. Appl. Supercond. 27, 2101204 (2017).
- (20) K. Sakai, Y. Takei, R. Yamamoto, N. Y. Yamasaki, K. Mitsuda, M. Hidaka, S. Nagasawa, S. Kohjiro, and T. Miyazaki, Baseband Feedback Frequency-Division Multiplexing with Low-Power dc-SQUIDs and Digital Electronics for TES X-Ray Microcalorimeters, J. Low Temp. Phys. 176, 400 (2014).
- (21) P. Peille et al., Performance assessment of different pulse reconstruction algorithms for the ATHENA X-ray Integral Field Unit, in Proceedings of SPIE 9905, Space Telescopes and Instrumentation 2016: Ultraviolet to Gamma Ray, Edinburgh, United Kingdom, 2016, edited by J-W. A. den Herder, T. Takahashi, and M. Bautz, 99055W.
- (22) S. R. Bandler, E. Figueroa-Feliciano, N. Iyomoto, R. L. Kelley, C. A. Kilbourne, K. D. Murphy, F. S. Porter, T. Saab, and J. Sadleir, Non-linear effects in transition edge sensors for X-ray detection, Nucl. Instrum. Methods Phys. Res. A 559, 817 (2006).
- (23) A. E. Szymkowiak, R. L. Kelley, S. H. Moseley, C. K. Stahle, Signal processing for microcalorimeters, J. Low Temp. Phys. 93, 281 (1993).
- (24) P. R. Bevington and D. K. Robinson, Data Reduction and Error Analysis for the Physical Sciences, (McGraw-Hill, Inc., NY, 1969).
- (25) P. G. Hansen, B. Jonson, G. L. Borchert, and O. W. B. Schult, Mechanisms for energy shifts of atomic X rays, Atomic Inner-Shell Physics, (Plenum Press, New York, 1985), p. 237.
- (26) G. Breit, Possible Effects of Nuclear Spin on X-Ray Terms, Phys. Rev. 35, 1447 (1930).
- (27) G. L. Borchert, P. G. Hansen, B. Jonson, H. L. Ravn, O. W. B. Schult, P. Tidemand-Petersson, and ISOLDE Collaboration, Shifts in xenon K X-ray energies following electron-capture beta decay and the role of nuclear hyperfine structure, Phys. Lett. A 63, 15 (1977).
- (28) O. I. Sumbaev, The effect of the chemical shift of the x-ray lines in heavy atoms. Systematization of the experimental data and comparison with theory, Sov. Phys.-JETP 30, 927, (1970).
- (29) R. D. Shannon, Revised Effective Ionic Radii and Systematic Studies of Interatomic Distances in Halides and Chalcogenides, Acta Cryst. A32, 751 (1976).
- (30) B. Crasemann, M. H. Chen, J. P. Briand, P. Chevallier, A. Chetioui, and M. Tavernier, Atomic electron excitation probabilities during orbital electron capture by the nucleus, Phys. Rev. C 19, 1042 (1979).
- (31) J. W. Fowler et al., A reassessment of absolute energies of the x-ray L lines of lanthanide metals, Metrologia 54, 494, (2017).