DGEMM performance is data-dependent
DGEMM performance is data-dependent
Tom Cornebize , Arnaud Legrand
Project-Teams POLARIS
Research Report n° 9310 — December 2019 — ?? pages
Abstract: The DGEMM function is a widely used implementation of the matrix product. While the asymptotic complexity of the algorithm only depends on the sizes of the matrices, we show that the performance is significantly impacted by the matrices content. Our experiments show that this may be due to bit flips in the CPU causing an energy consumption overhead.
Key-words: performance,DVFS,BLAS,DGEMM
Les performances de DGEMM dépendent des données
Résumé : La fonction DGEMM est une implémentation très utilisée du produit matriciel. Bien que la complexité asymptotique de l’algorithme ne dépende que des tailles des matrices, nous montrons que les performances sont significativement impactées par le contenu des matrices. Nos expériences montrent que cela pourrait être causé par une surconsommation énergétique due aux changements d’état dans le processeur.
Mots-clés : performance,DVFS,BLAS,DGEMM
1 Context
In a recent work, we have shown how to predict the performance of an MPI application efficiently and faithfully[1], using High Performance Linpack (HPL) as a case study. We needed to build a performance model for several computation kernels, including dgemm. This was done by running these kernels on all the nodes of the platform with various parameter combinations and measuring their durations. We noticed a significant mismatch between the durations measured with our calibration code and the durations observed in HPL. We found out that, the performance of the dgemm function depends on the content of the matrix, which was unexpected.
The different experiments presented in this report have been repeated on several nodes and follow the same steps:
-
1.
Deploy and install a fresh OS on the node.
-
2.
Run the stress command for 10 minutes to warm the node.
-
3.
Start a background process111https://github.com/Ezibenroc/Stress-Test/blob/8a33d1f/basic_monitoring.py to monitor the core frequencies every second.
-
4.
On each core, run a custom code222https://github.com/Ezibenroc/platform-calibration/blob/153a4a1/src/calibration/calibrate_blas.c that will perform a sequence of calls to the dgemm function with a single thread and three square matrices of order 2,048. The durations of each dgemm call is written in a CSV file. The only change in the different experiments we did is how the three matrices are initialized.
The plots shown in this report have been obtained on four nodes of the Dahu cluster from Grid’5000333https://www.grid5000.fr/w/Grenoble:Hardware. Each of these nodes has two Intel Xeon Gold 6130 CPU, which are 16 core CPU from the Skylake generation. They have a base frequency of 2.1 GHz and a turbo frequency of up to 3.7 GHz, but their turbo frequency is limited to 2.4 GHz when their 16 cores are active and in AVX2 mode444https://en.wikichip.org/wiki/intel/xeon_gold/6130. We have used OpenBLAS555https://github.com/xianyi/OpenBLAS version 0.3.1, compiled with GCC version 6.3.0 on a Debian 9 installation with kernel version 4.9.0.
Note that one of the nodes we used, dahu-15, is known to have severe cooling issues that lead to significant frequency and performance drops666https://intranet.grid5000.fr/bugzilla/show_bug.cgi?id=10270.
2 Randomization of the matrix initialization
The three matrices are allocated once at the start of the program as a buffer of size with . Then, their content is initialized in three different ways, depending on the experiment:
-
1.
All the elements of the matrices are equal to some constant. We have tested with three different values: 0, 0.987 and 1.
-
2.
The elements of the matrices are made of an increasing sequence in the interval . More precisely, mat[i] = i/(N^2-1) for i in .
-
3.
Each element of the matrix is randomly and uniformly sampled in the interval .
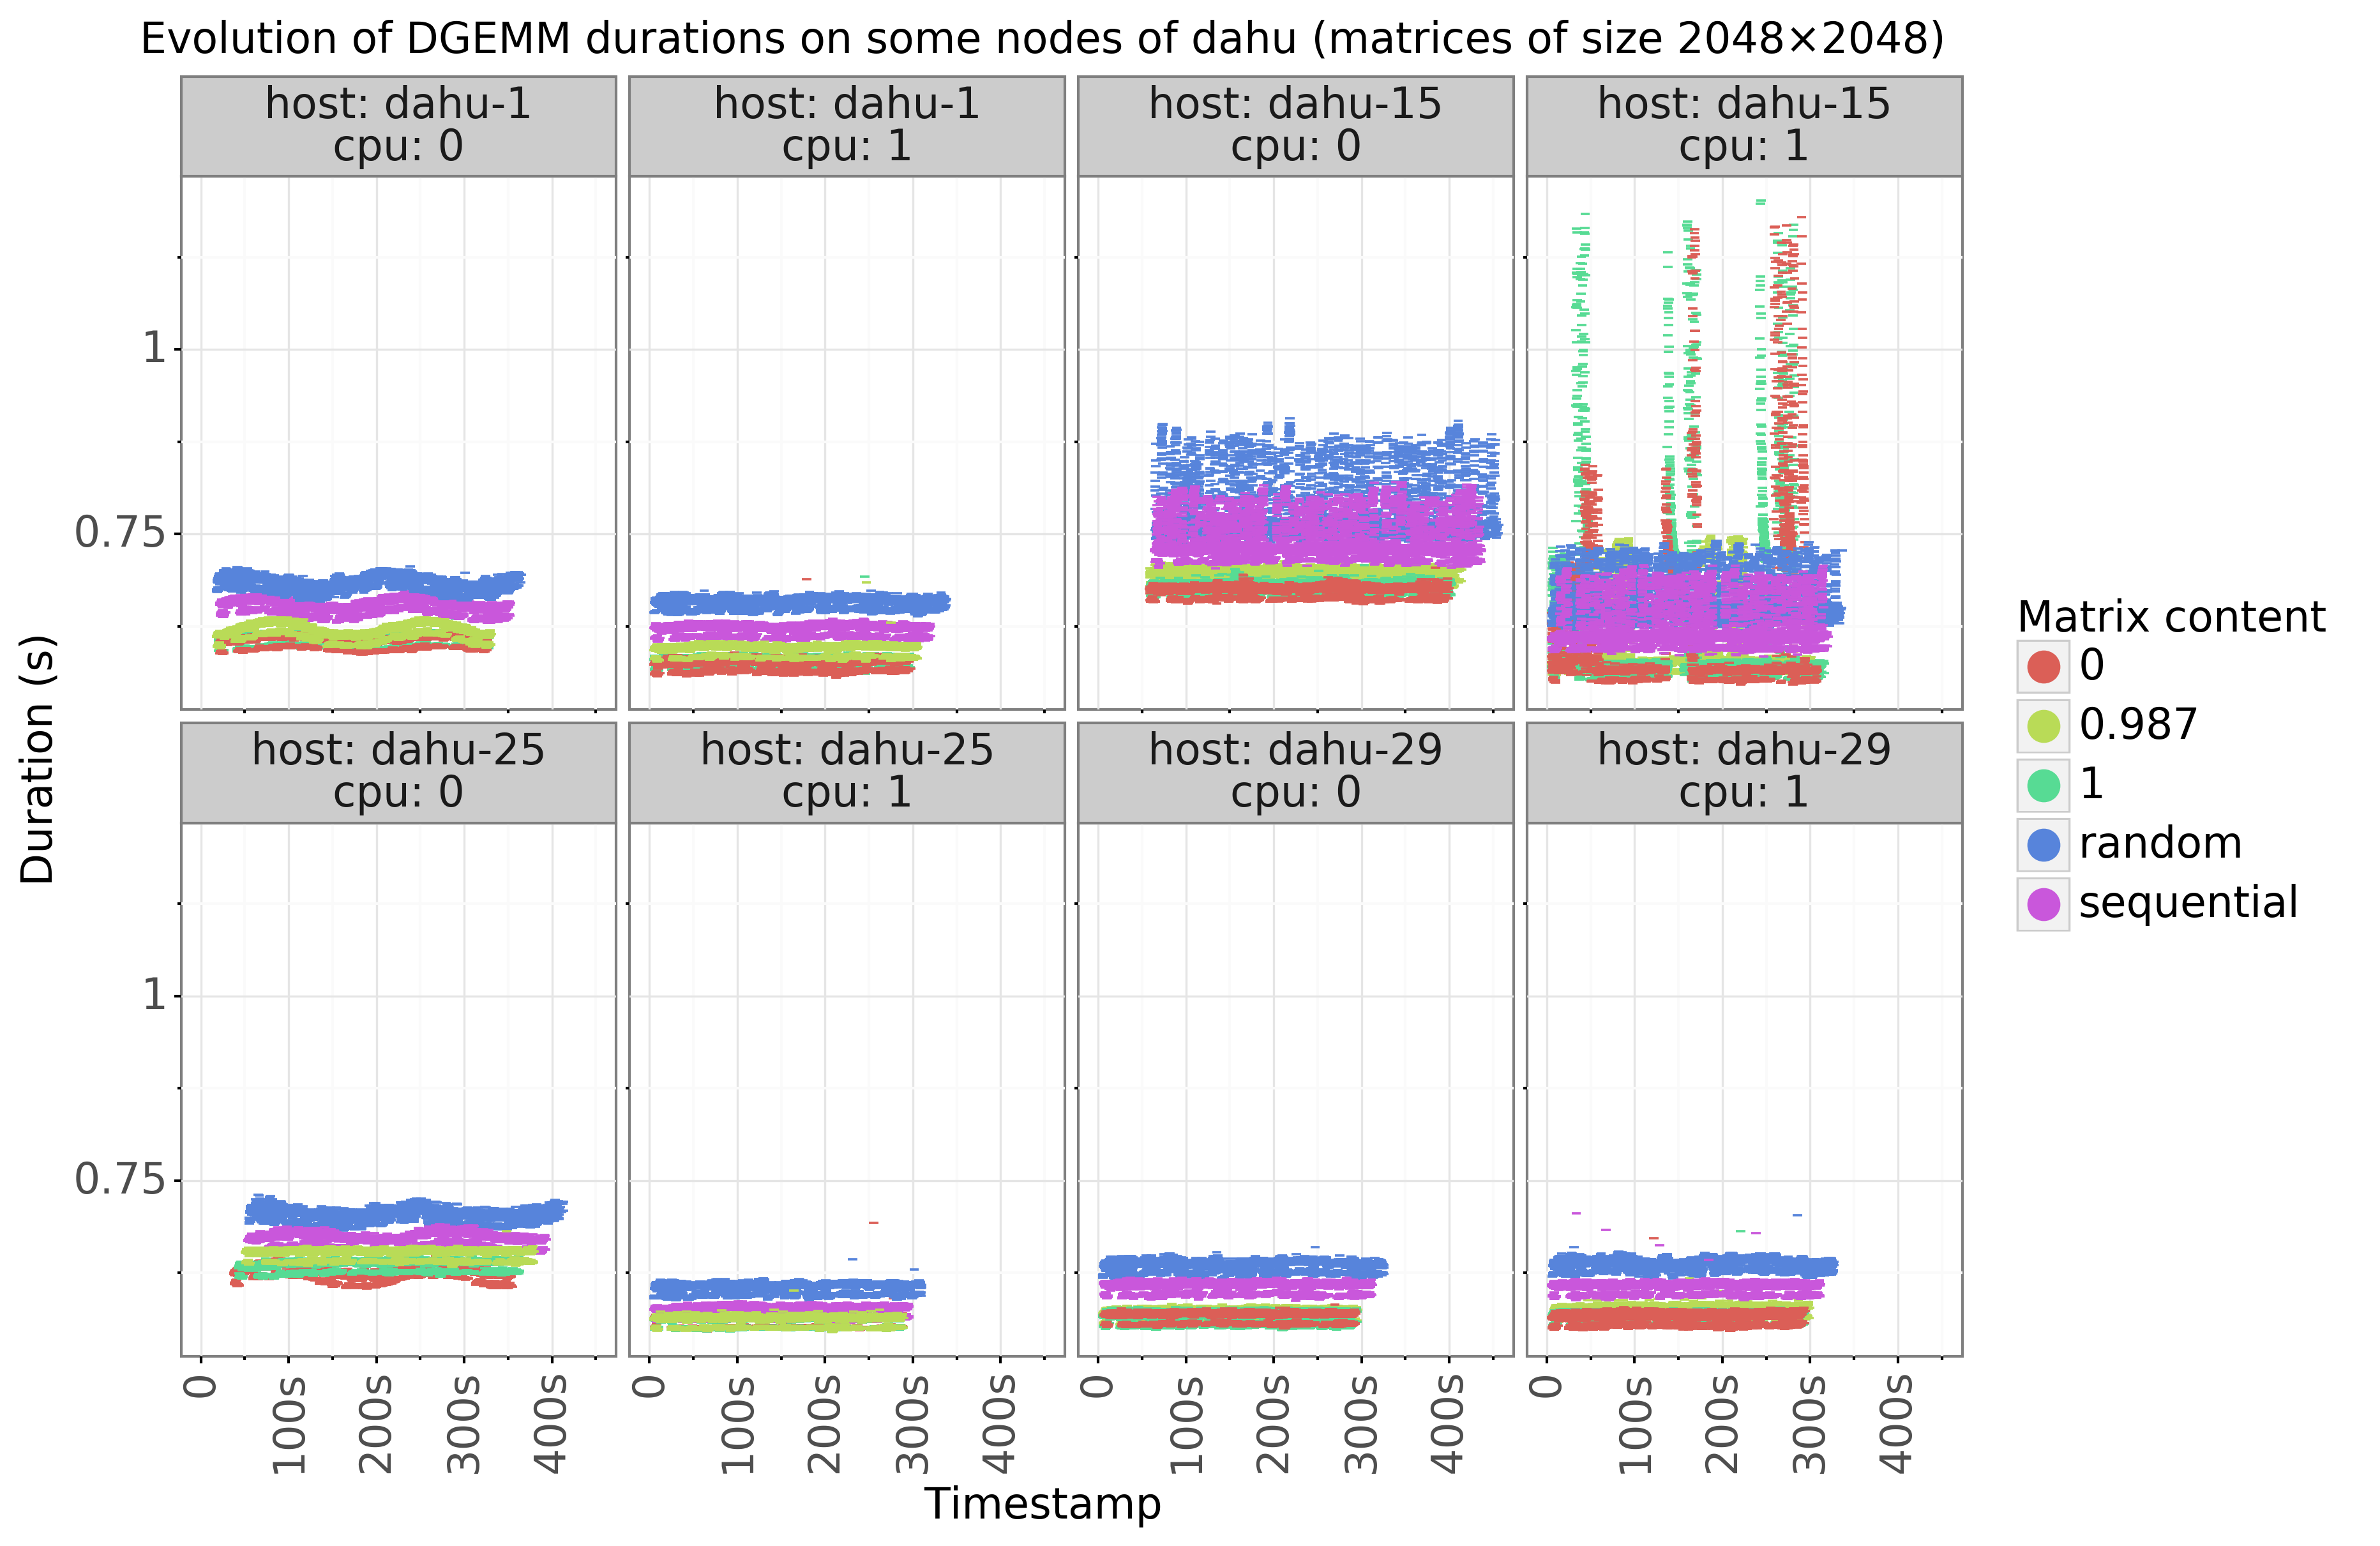
Figure 1 shows the evolution of the dgemm durations during the experiment. Several temporal patterns can be distinguished: the CPU 0 of dahu-1 and dahu-25 have oscillating performance, the CPU 1 of dahu-15 has huge performance drops. More interestingly, several layers can be seen: the random points seem to be on top of the sequential points which are above the constant ones.
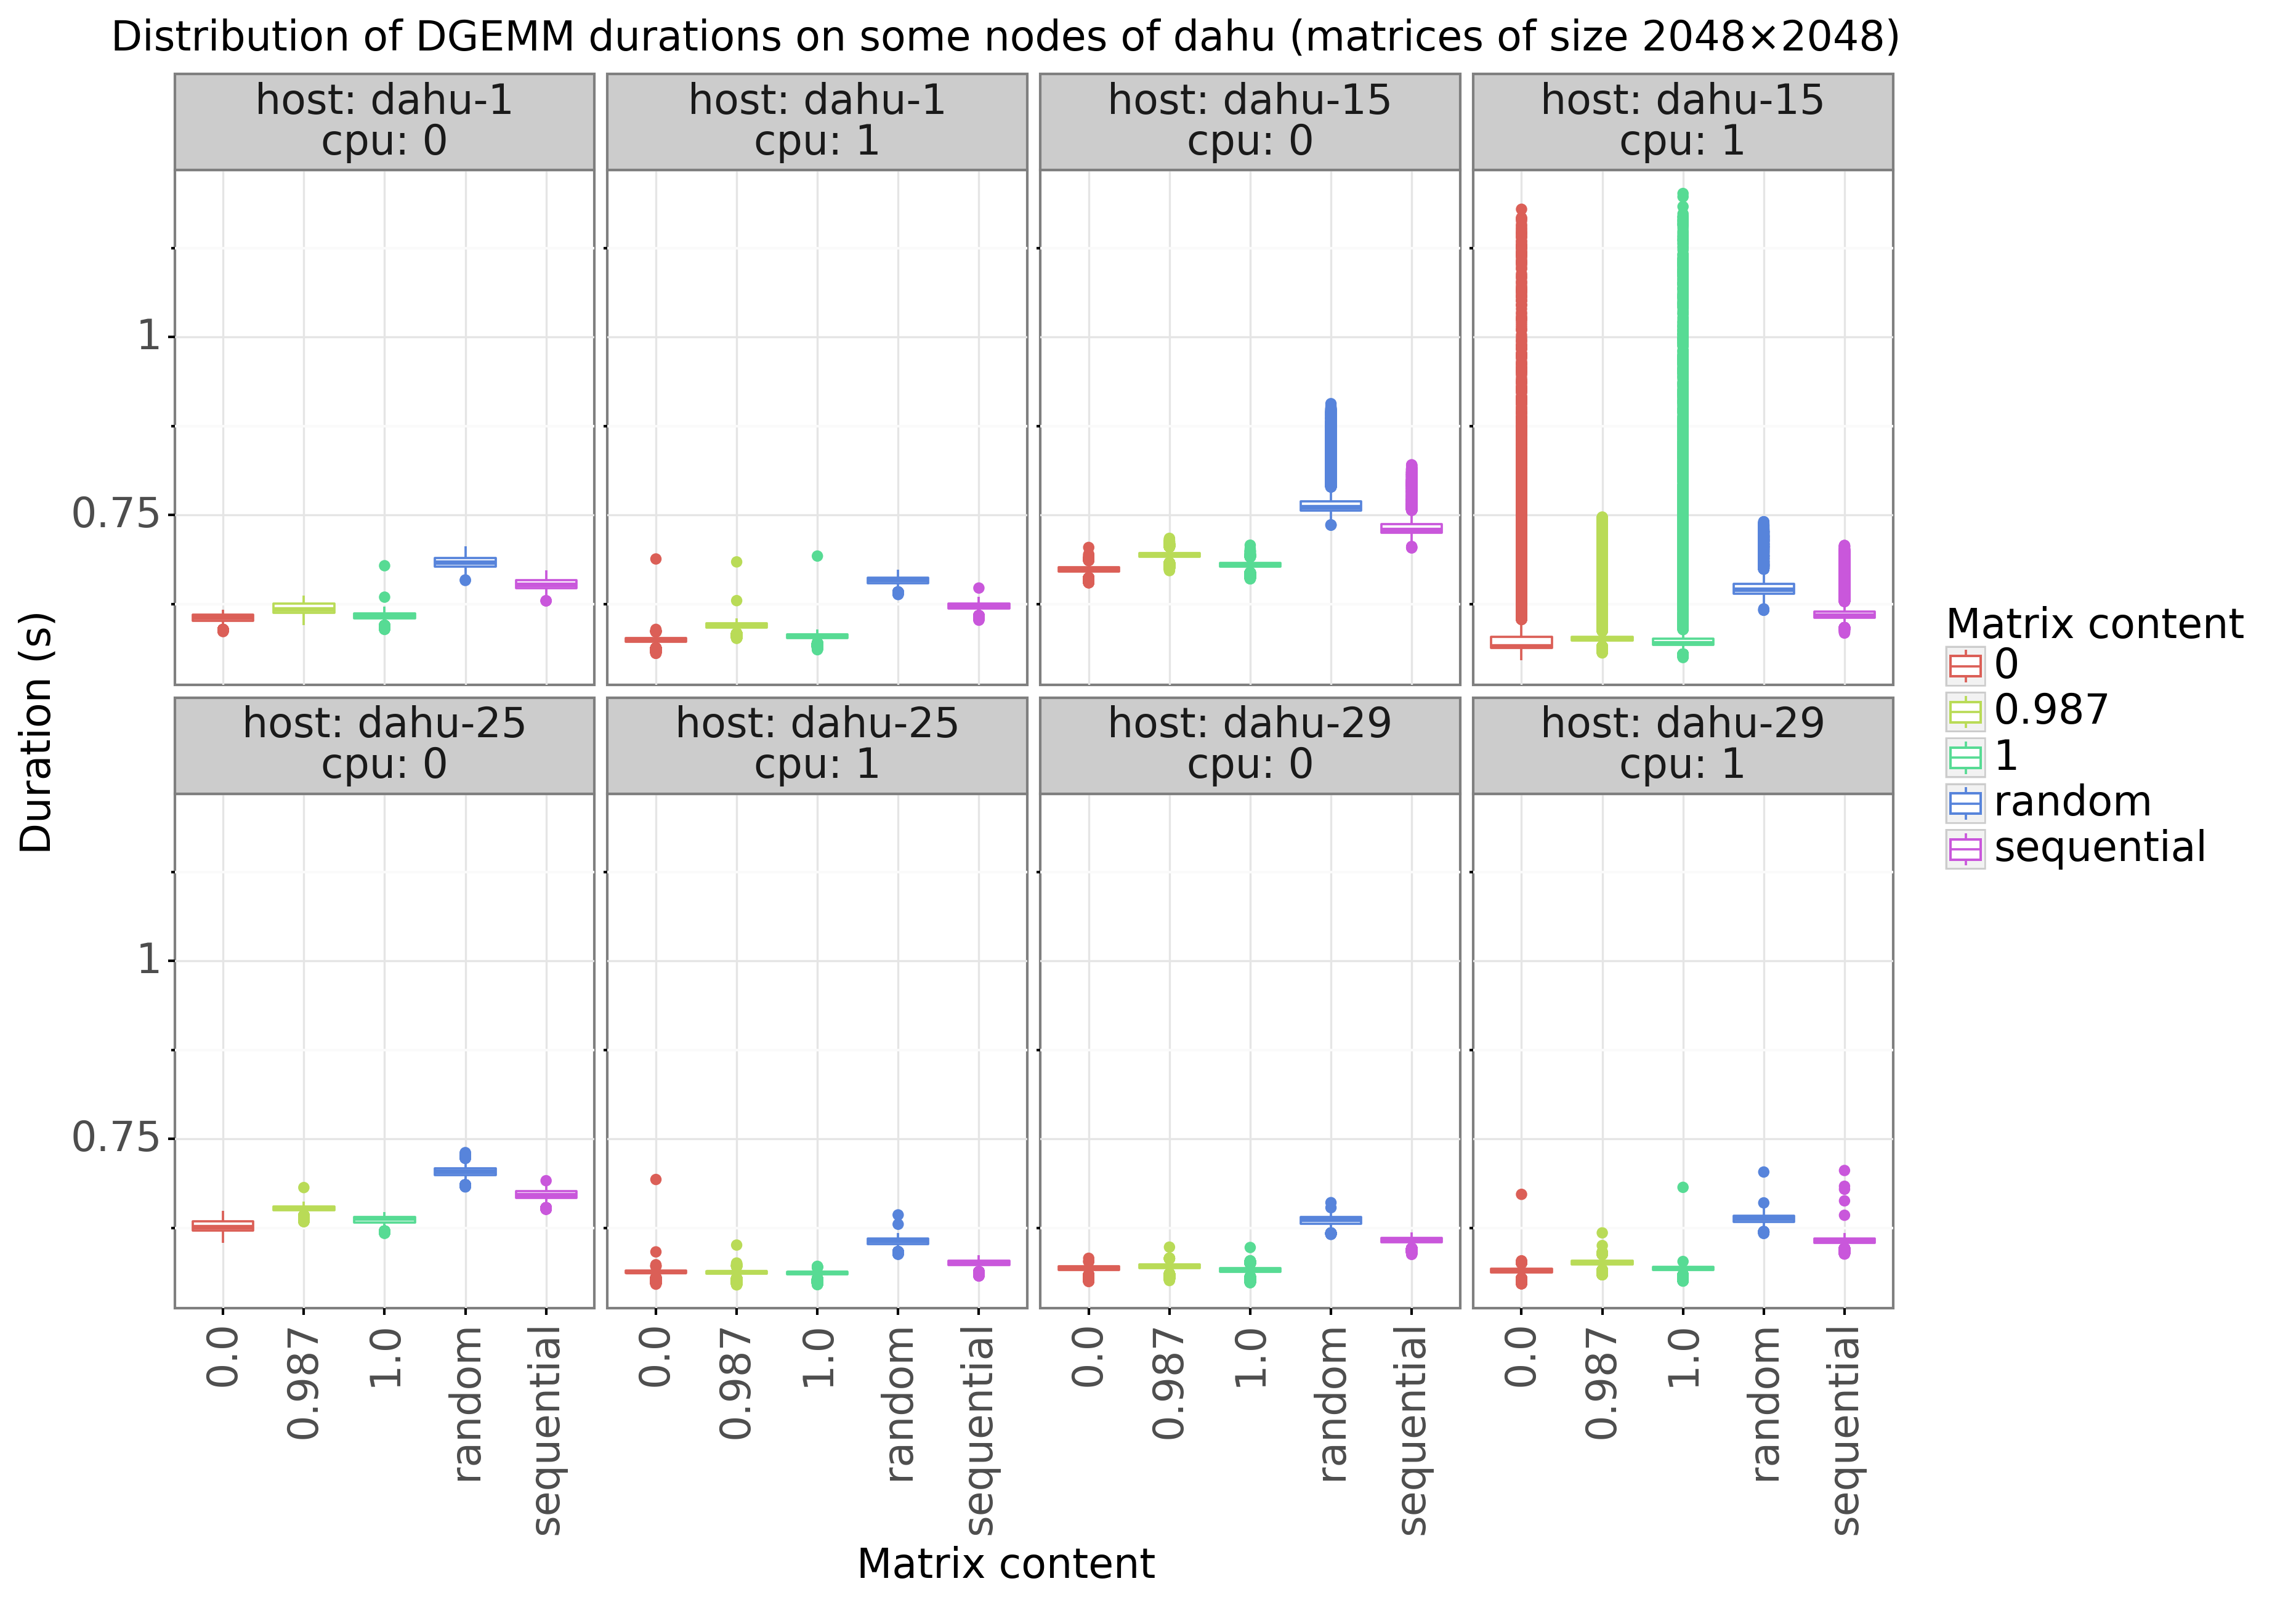
This last observation is confirmed by the box plots shown in figure 2. We see here that on the four nodes, the durations of dgemm are the highest when the matrices are initialized randomly and the lowest when they are initialized with a constant value. The sequential initialization is in between.
Such an observation was unforeseen. The function dgemm implements the usual matrix product with cubic complexity. The control flow of the function does not depend on the matrix content, so we did not expect its duration to be data-dependent.
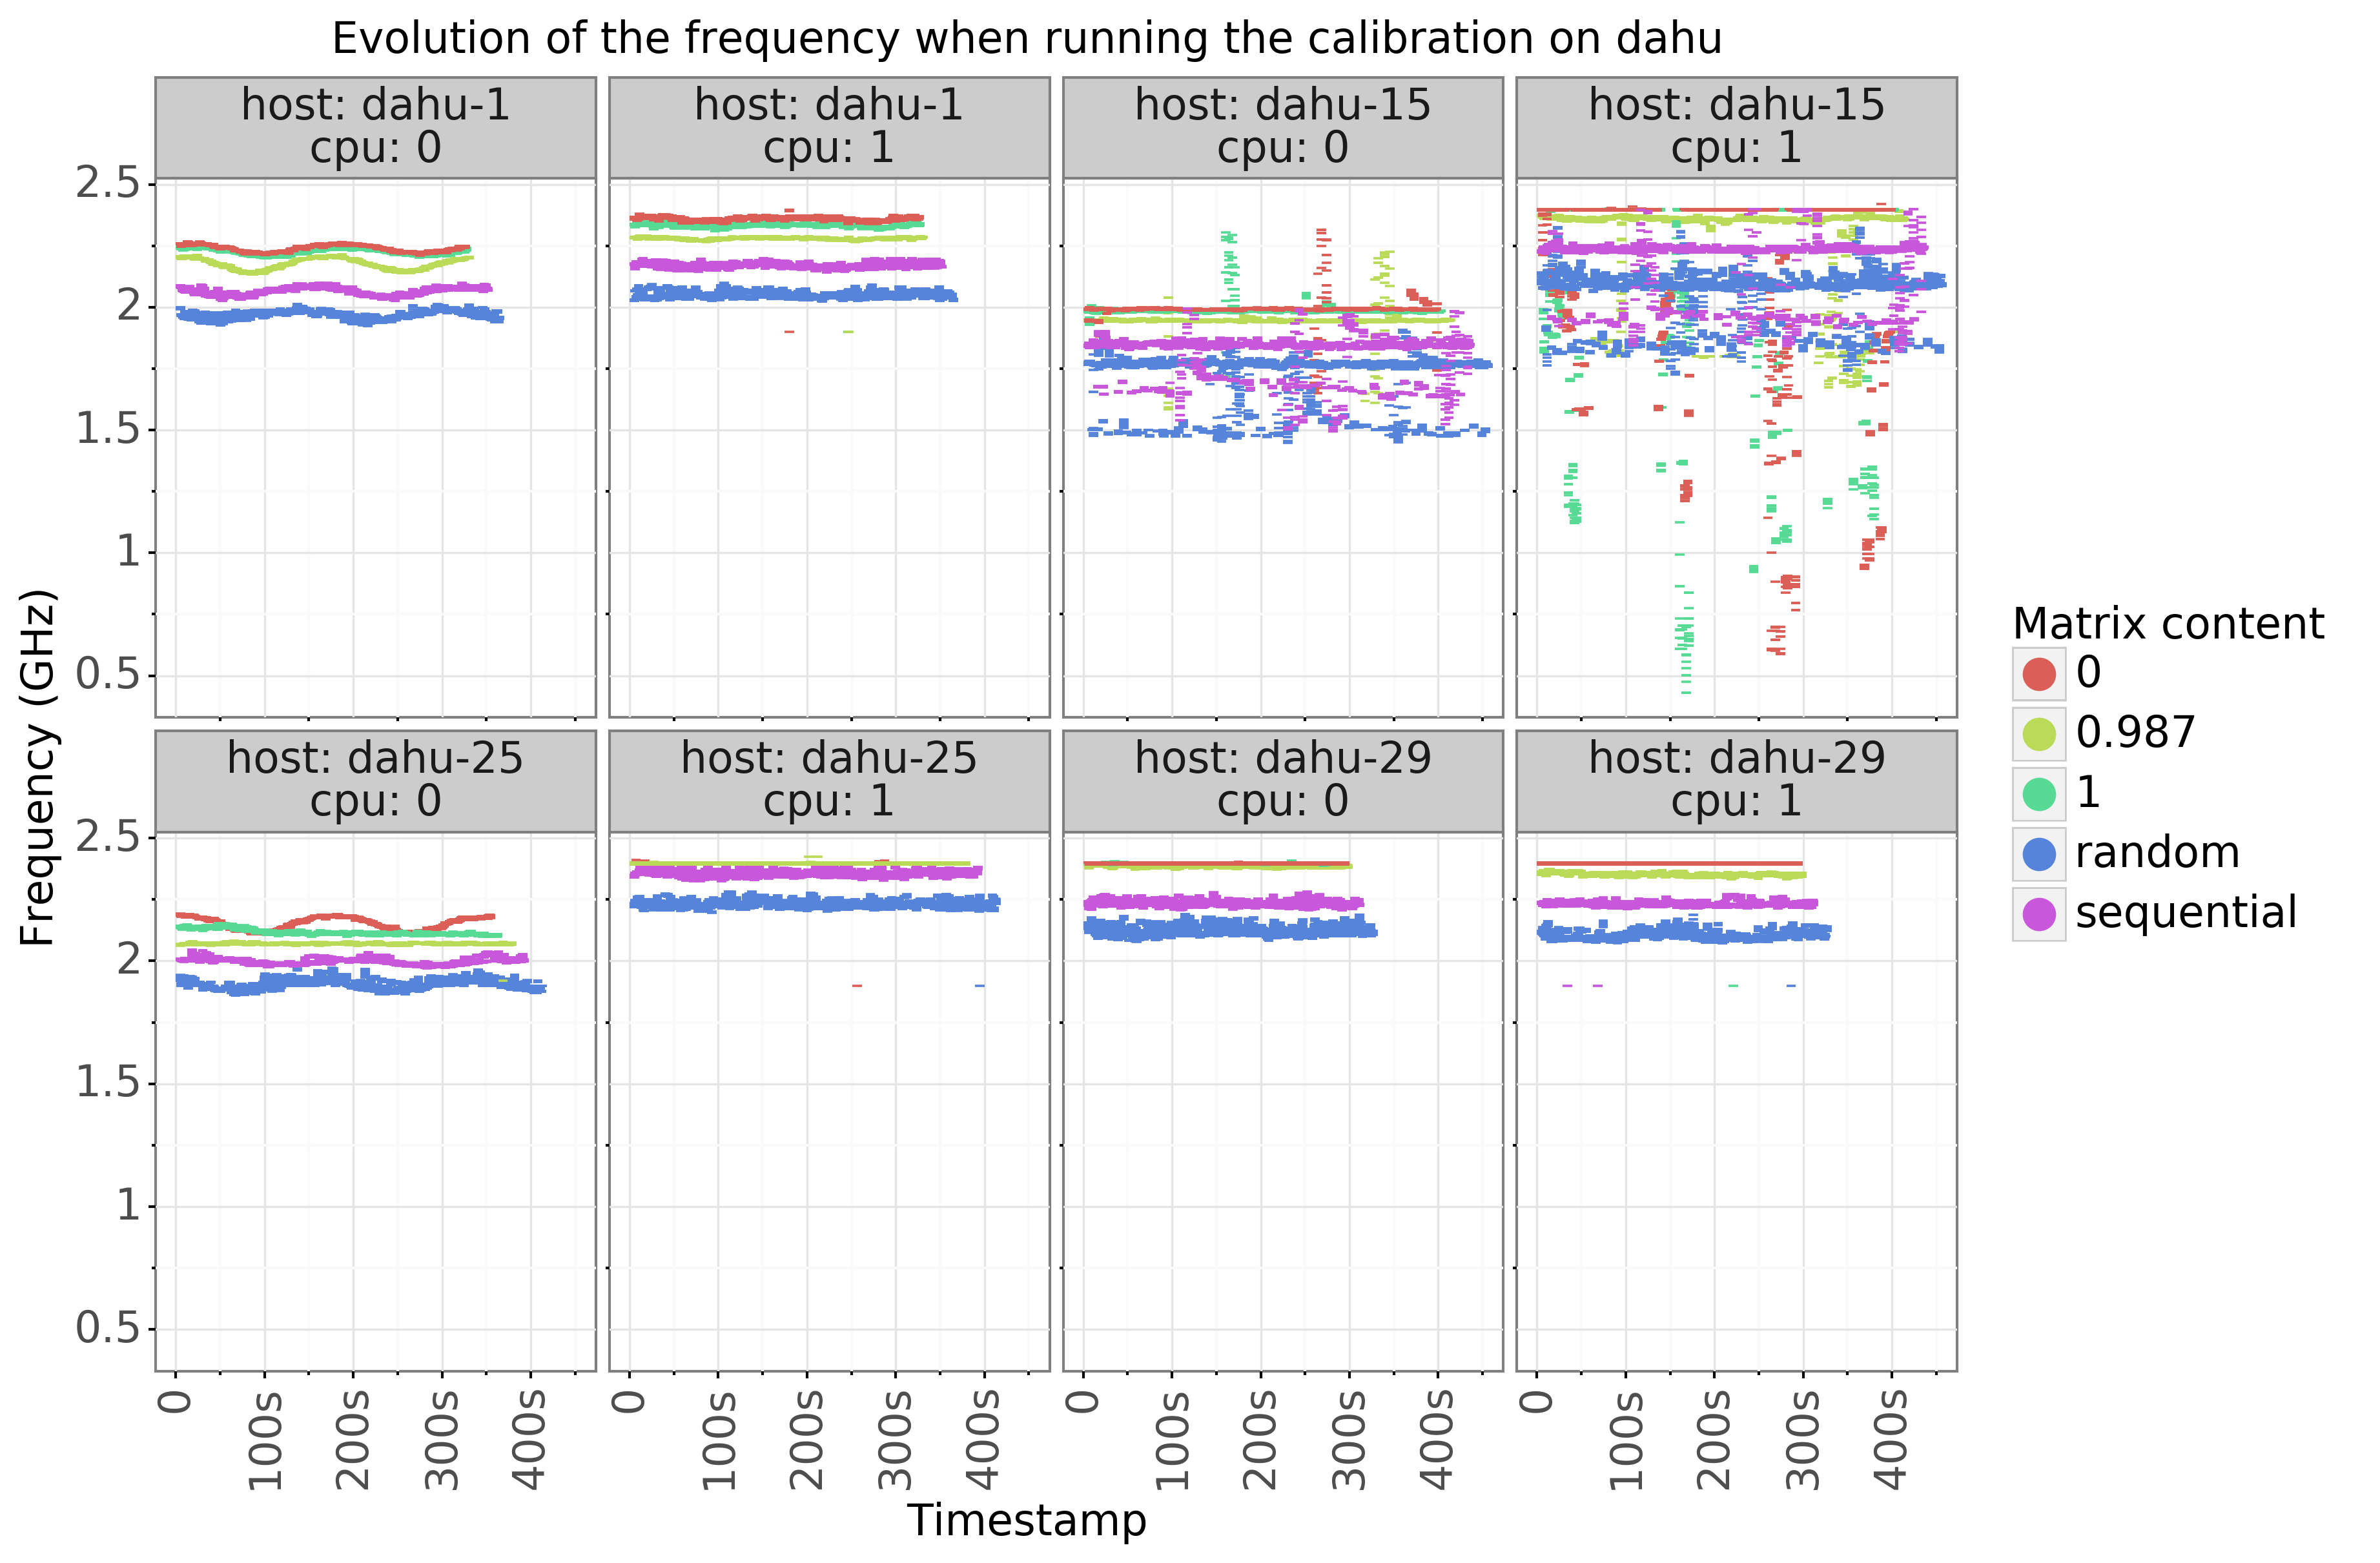
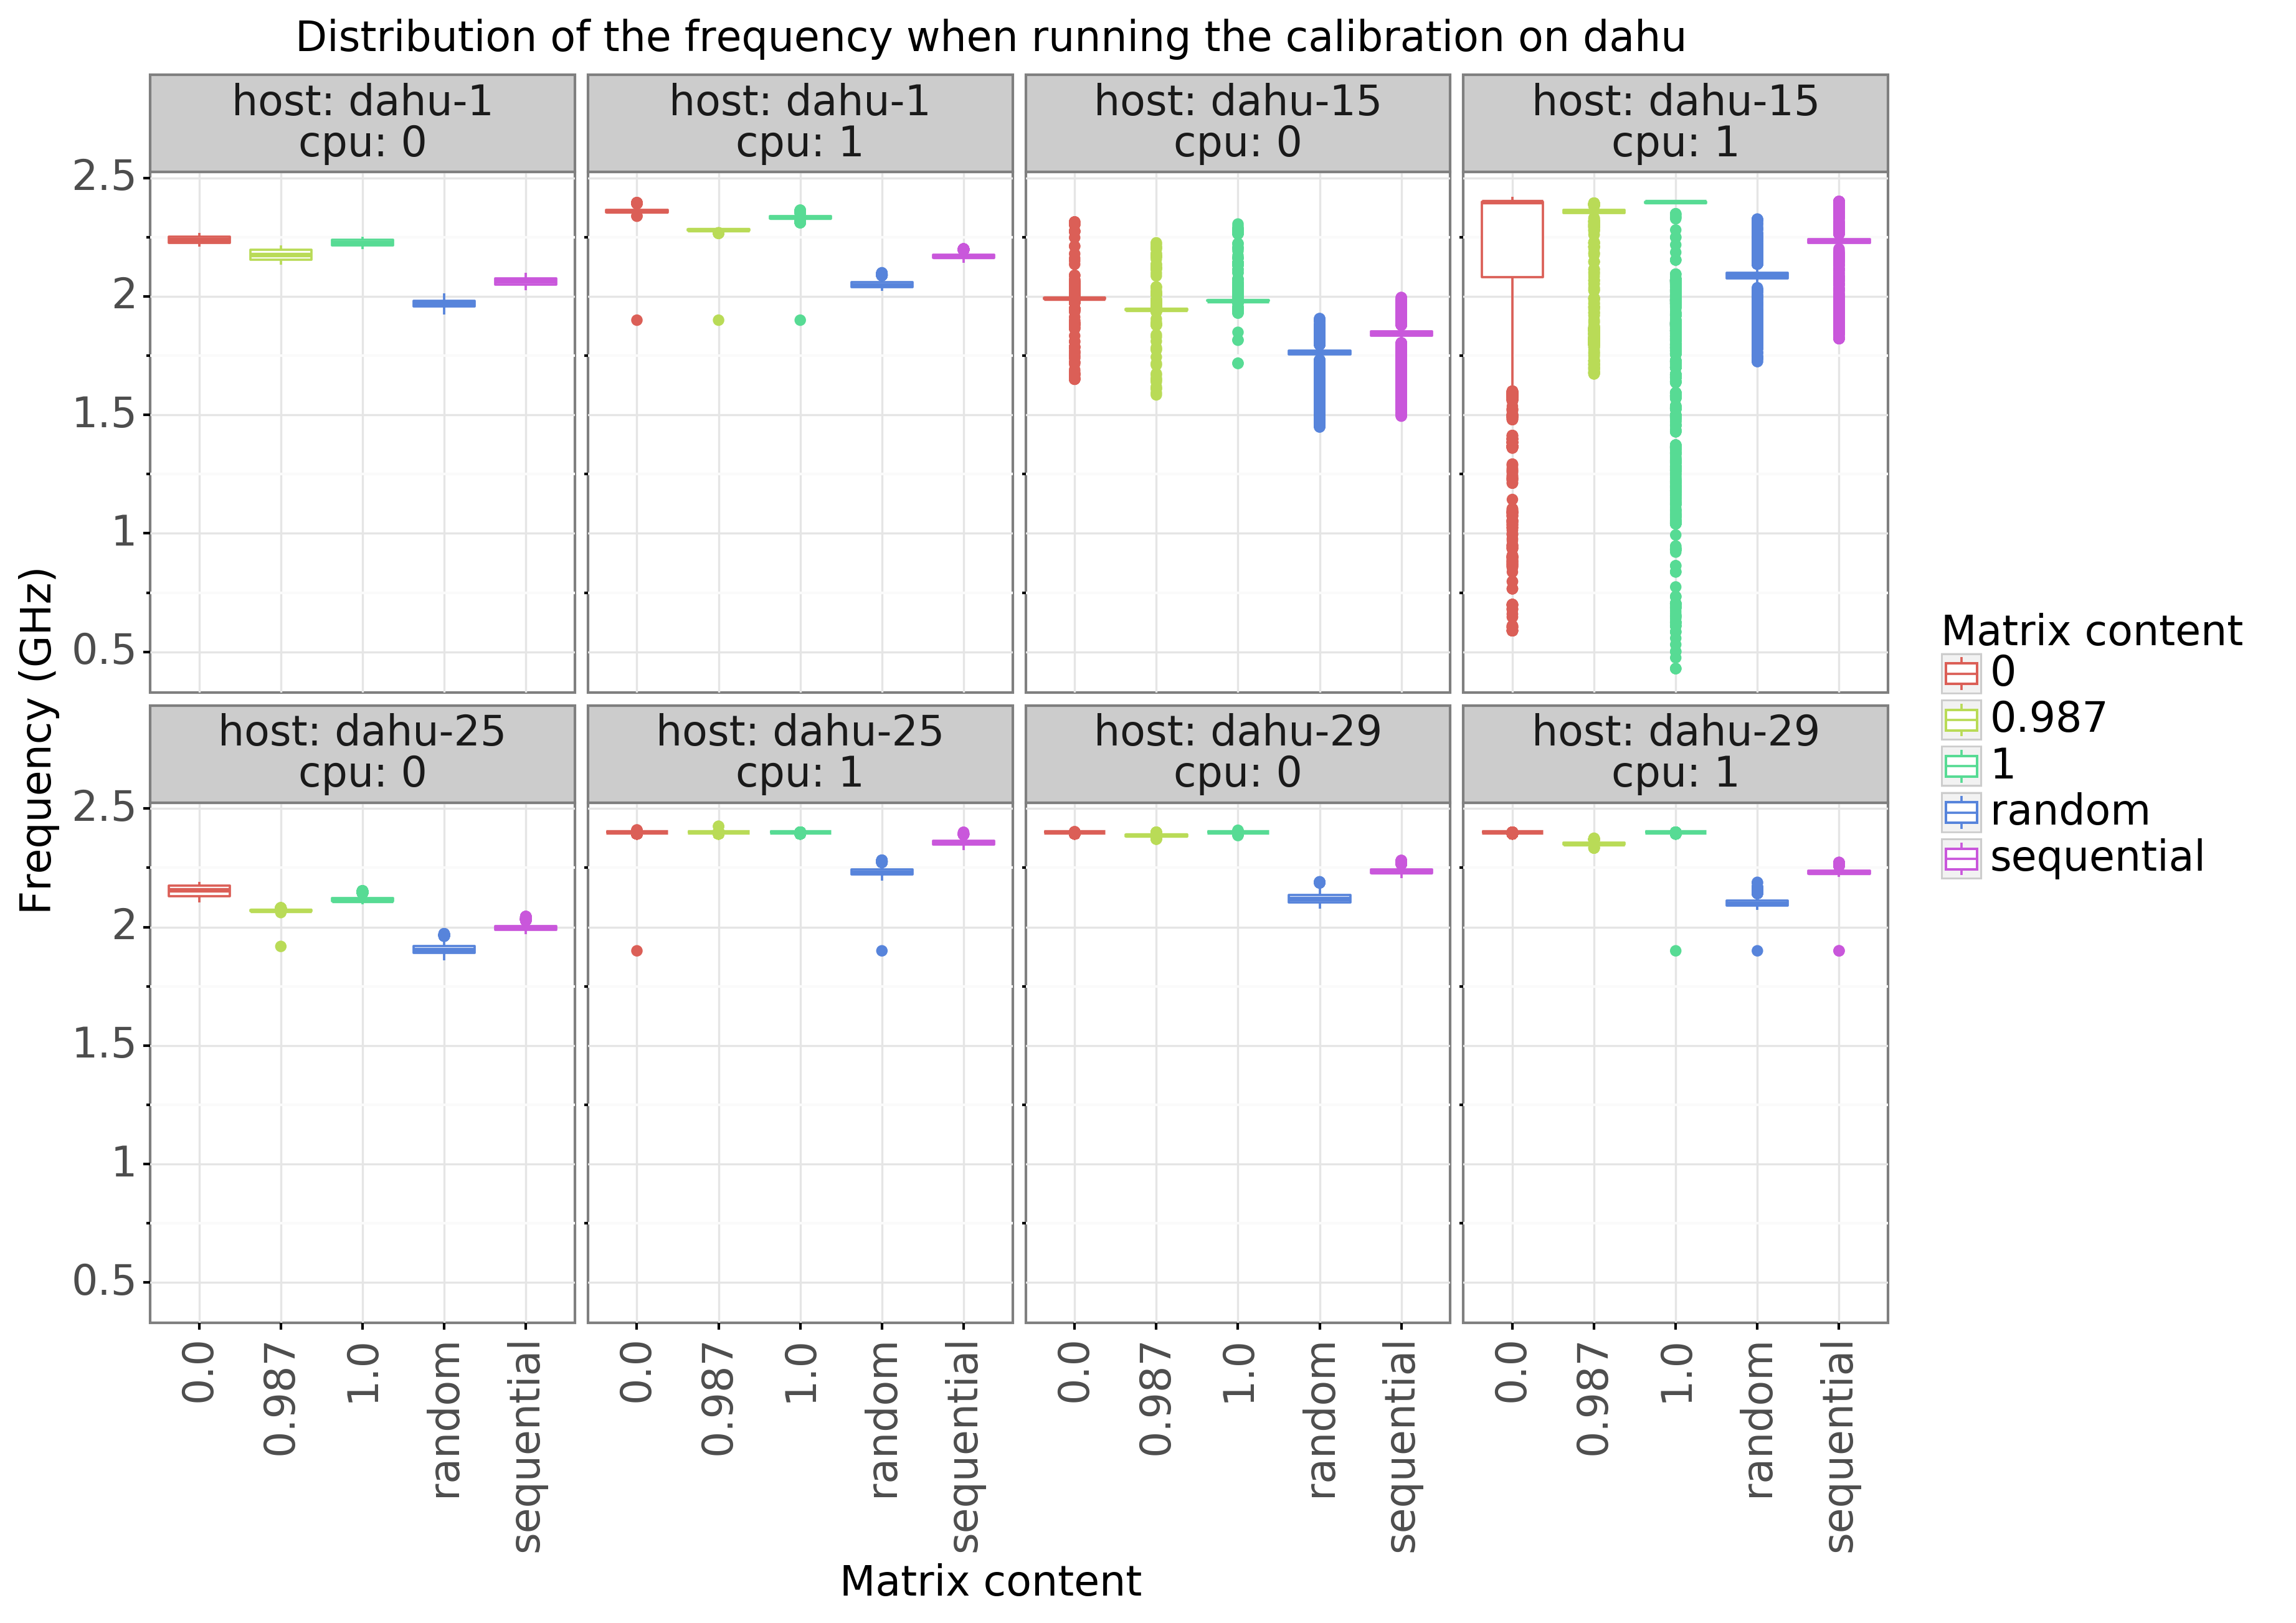
The observations we have made on dgemm performance can be explained by figures 3 and 4 which respectively show the evolution of the core frequencies over time and the distributions of these frequencies. There is a clear correlation between the frequencies and dgemm performance: the random initialization produces lower frequencies whereas the constant initialization gives higher frequencies. Similar temporal patterns can also be distinguished: the oscillation on the CPU 0 of dahu-1 and dahu-25 as well as the huge drops for the CPU 1 of dahu-15.
This experiment has been repeated on other Grid’5000 clusters. Table 1 gives a summary of our observations. Four other clusters show a similar behavior, the performance of dgemm is higher when the matrices are generated with a constant value. However, for four other clusters, this phenomenon could not be observed, the matrix content had no impact on the performance.
| Cluster | CPU | Generation | Performance anomaly |
|---|---|---|---|
| dahu | Intel Xeon Gold 6130 | Skylake | yes |
| yeti | Intel Xeon Gold 6130 | Skylake | yes |
| ecotype | Intel Xeon E5-2630L v4 | Broadwell | yes |
| gros | Intel Xeon Gold 5220 | Cascade Lake | yes |
| parasilo | Intel Xeon E5-2630 v3 | Haswell | yes |
| paranoia | Intel Xeon E5-2660 v2 | Ivy Bridge | no |
| nova | Intel Xeon E5-2620 v4 | Broadwell | no |
| taurus | Intel Xeon E5-2630 | Sandy Bridge | no |
| chiclet | AMD EPYC 7301 | - | no |
3 Hypotheses
Several hypotheses were discussed to explain this unexpected phenomenon.
There could be a small cache on the floating point unit of the cores to memorize the results of frequent operations. This could explain why the durations were higher when the matrices were initialized randomly, but this does not explain why the sequential initialization is in between.
This could be due to kernel same page merging (KSM), a mechanism that allows the kernel to share identical memory pages between different processes. Again, this would explain the difference between the random initialization and the constant one, but not why the sequential initialization gives intermediate performance.
A last hypothesis is the power consumption of the cores. Each state change of the electronic gates of the CPU costs an energy overhead. In the case of the constant initialization, the registers will change less often during the execution of dgemm, in comparison with the random initialization. As for the sequential initialization, we can imagine that we have a locality effect: nearby elements of the matrices will have more bits in common, this would causes less bit flips than the random initialization but more bit flips than the constant initialization and thus an intermediate performance.
4 Testing the bit-flip hypothesis
To test the hypothesis that the lower frequencies are caused by more frequent bit flips in the processor, the matrix initialization has been changed. Now, each element of the matrix is randomly and uniformly sampled in the interval . Then a bit mask is applied on the lower order bits of their mantissa. As a result, all the elements of the matrices have some bits in common. Several mask sizes have been tested, from 0 (the elements are left unchanged) to 53 (the mantissa becomes completely deterministic, all the elements are equal).
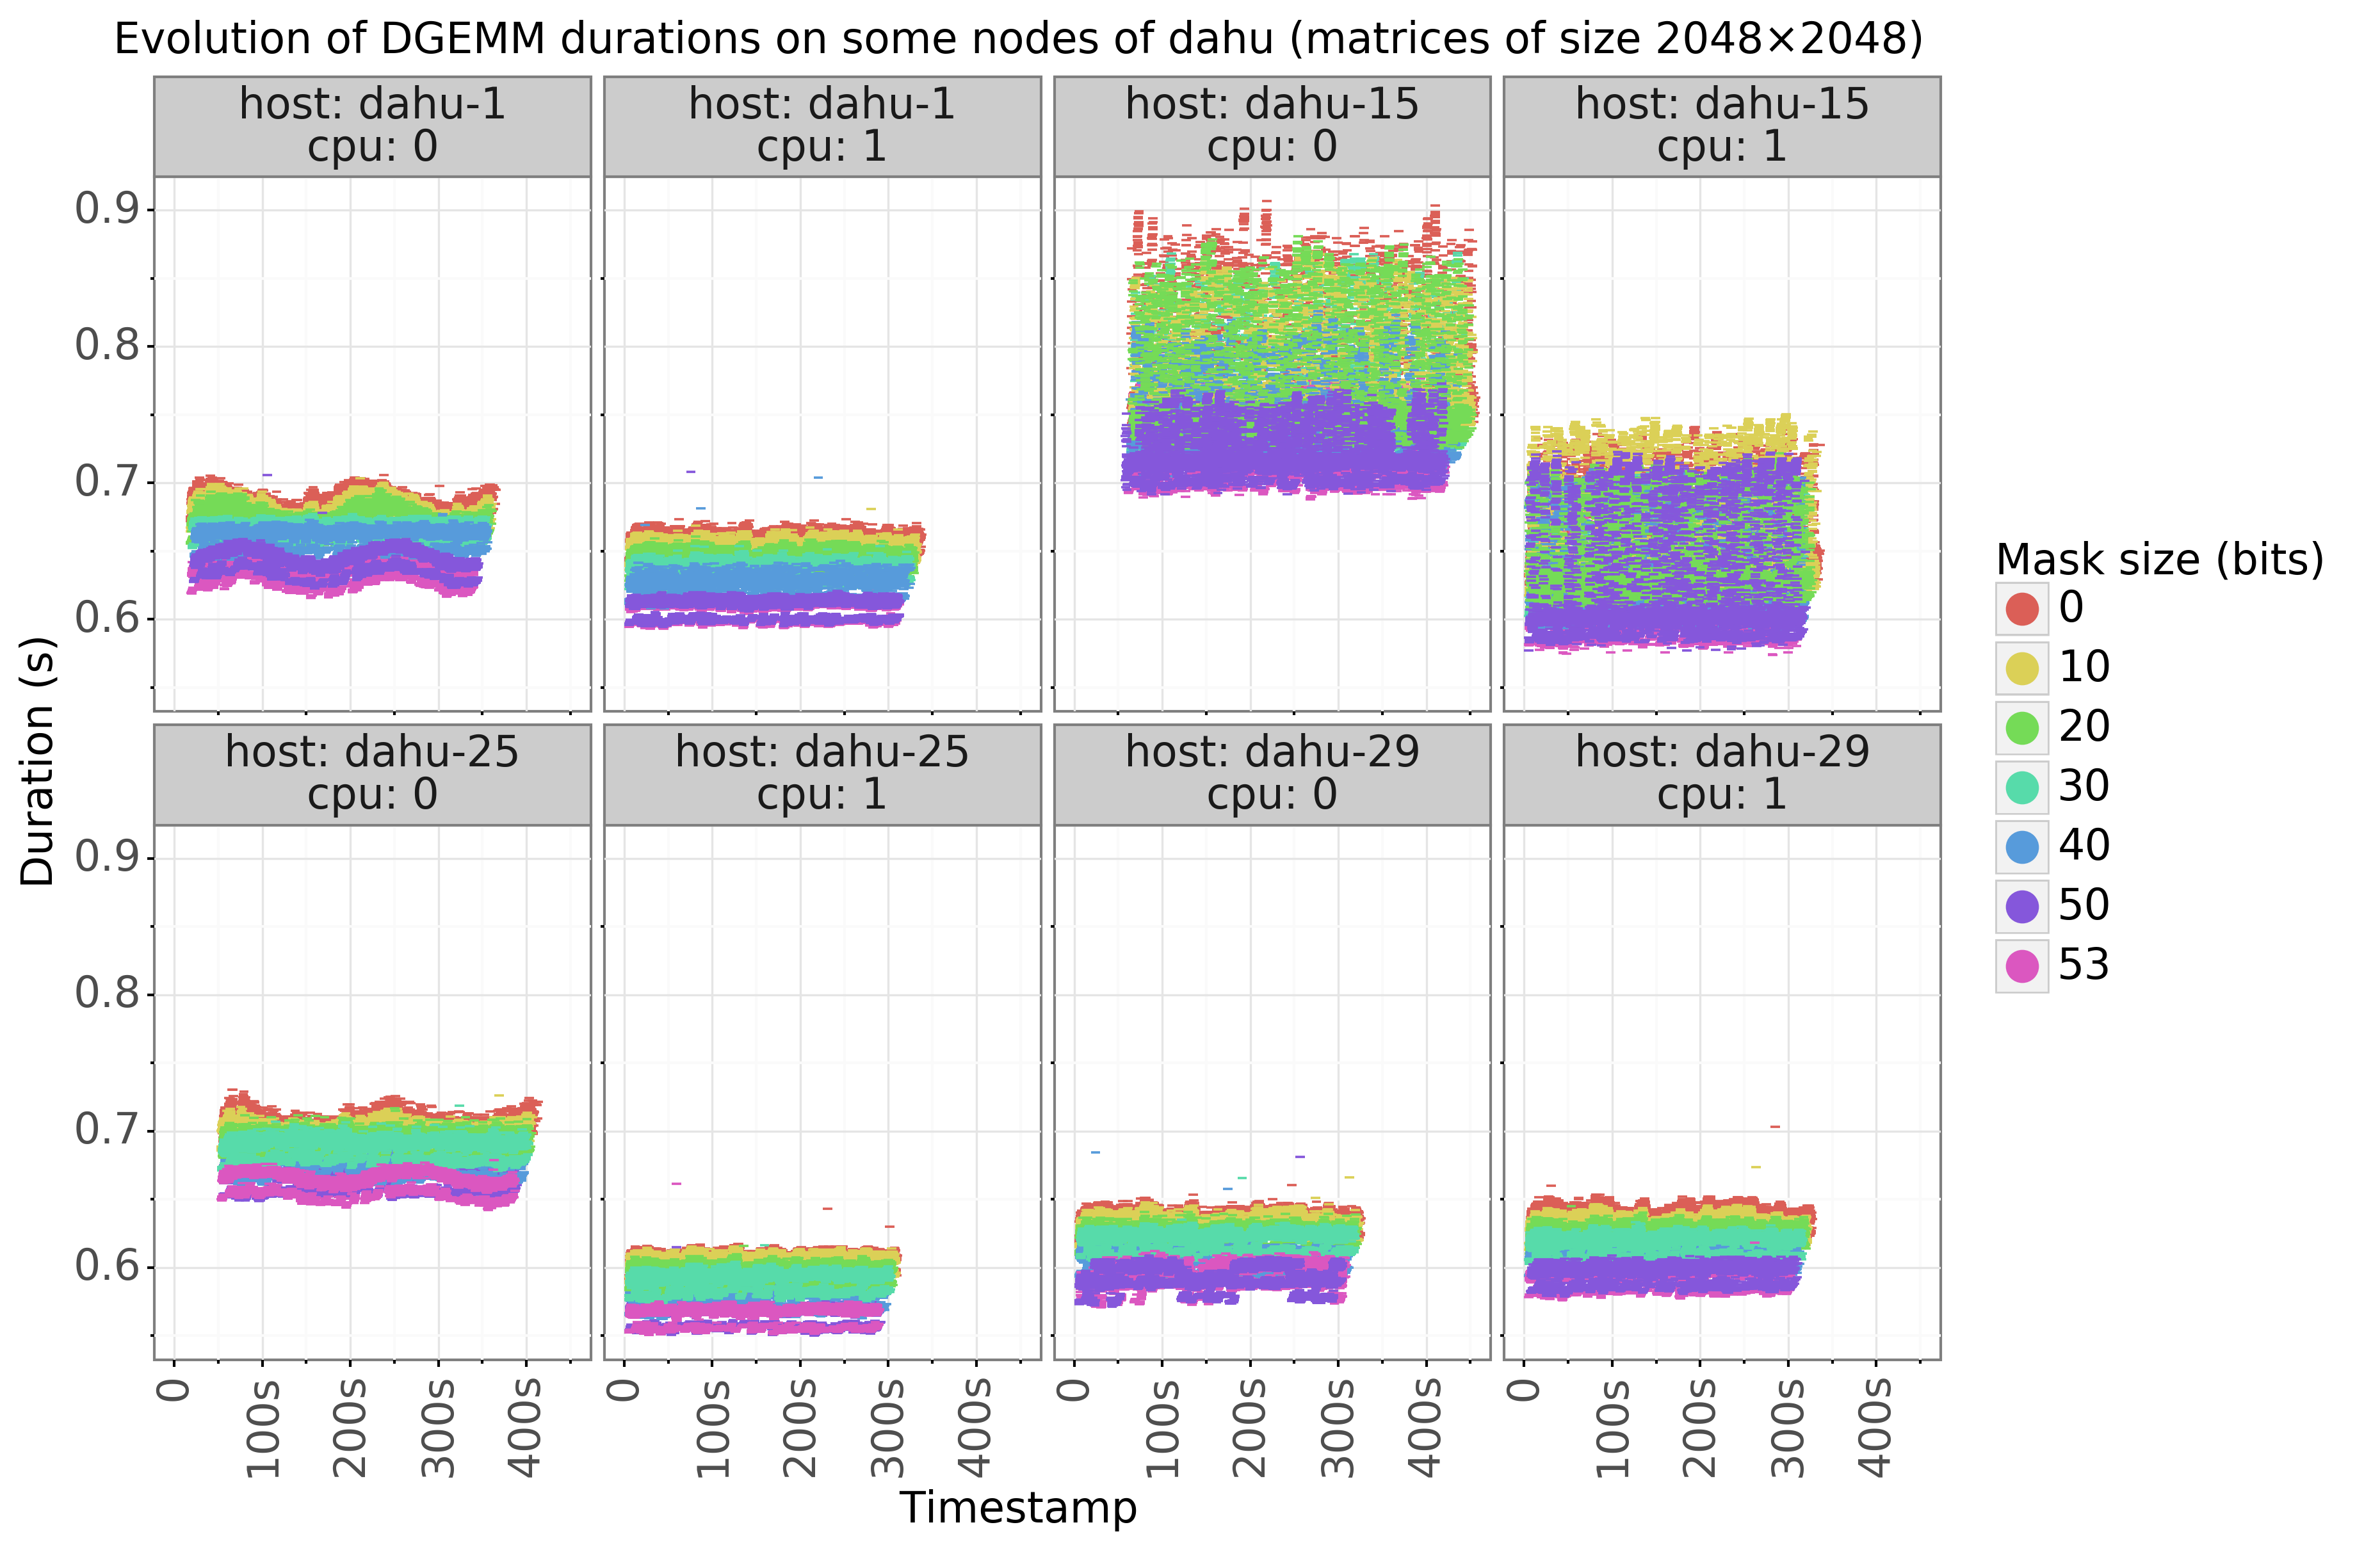
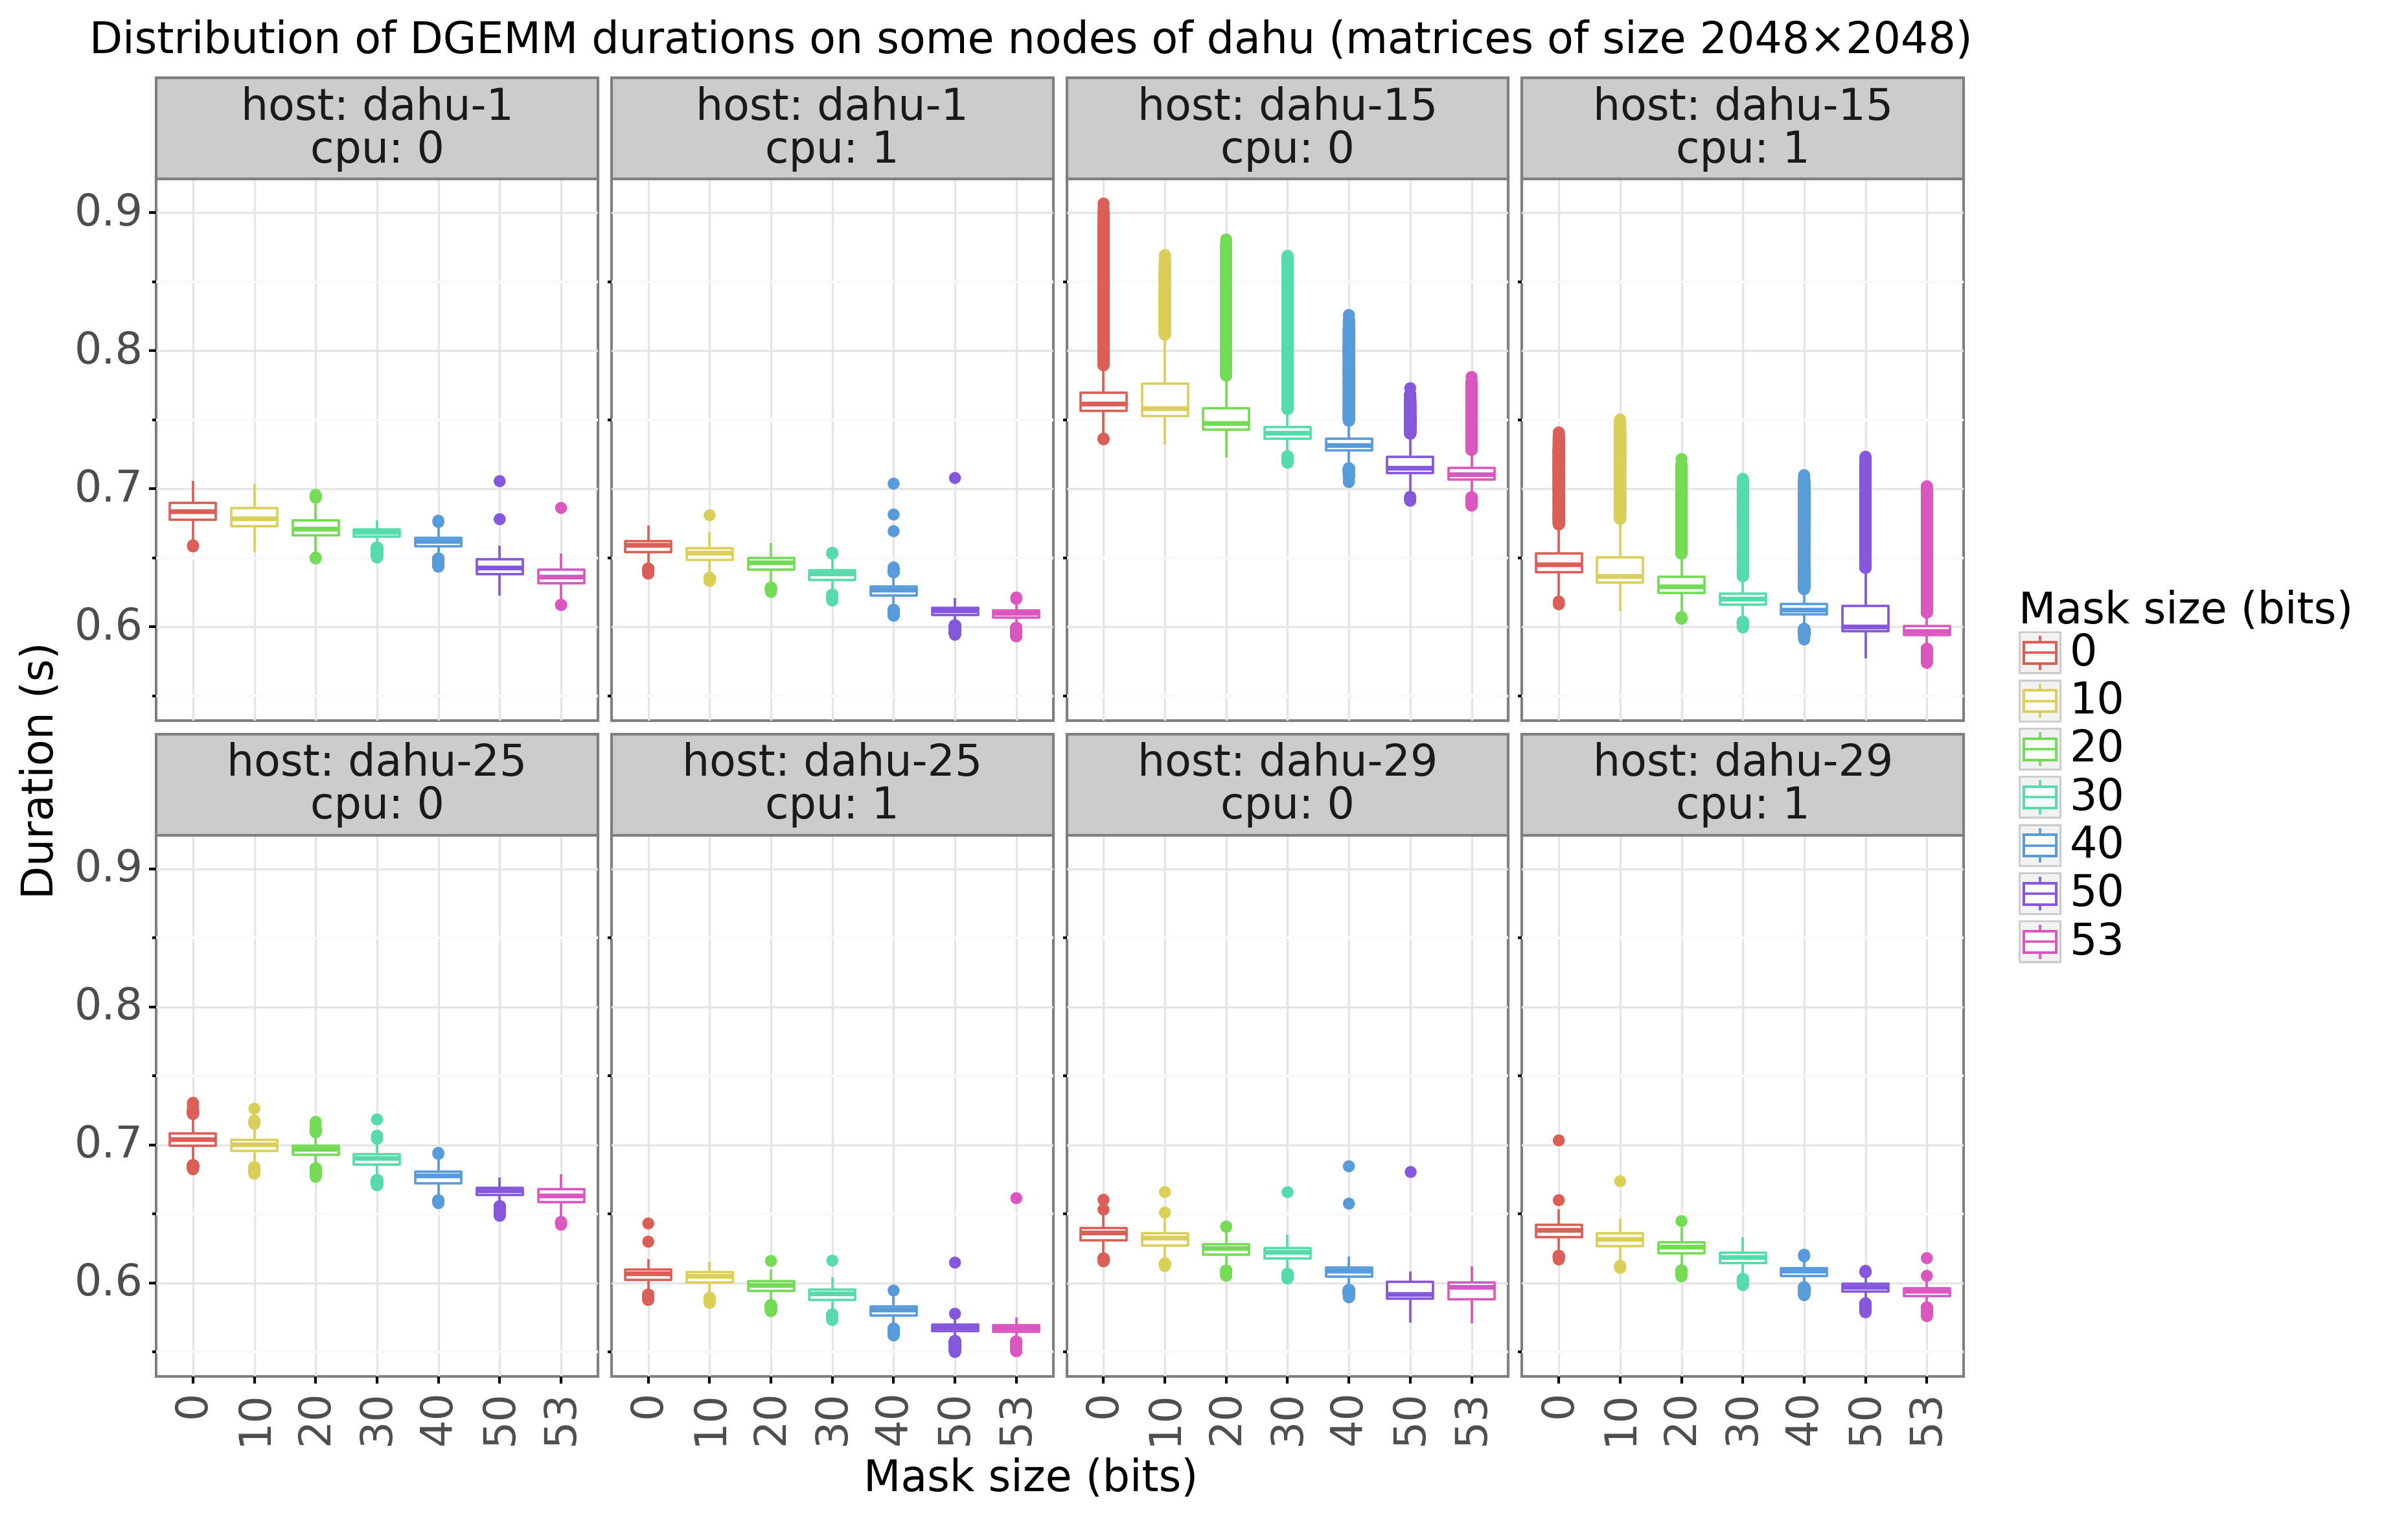
The evolution of the dgemm durations is plotted in figure 5. Their distribution is shown in figure 6. Their is a very clear correlation between the mask size and the performance: the larger the mask, the lower the duration. Similarly to the previous experiment, some temporal patterns can also be distinguished.
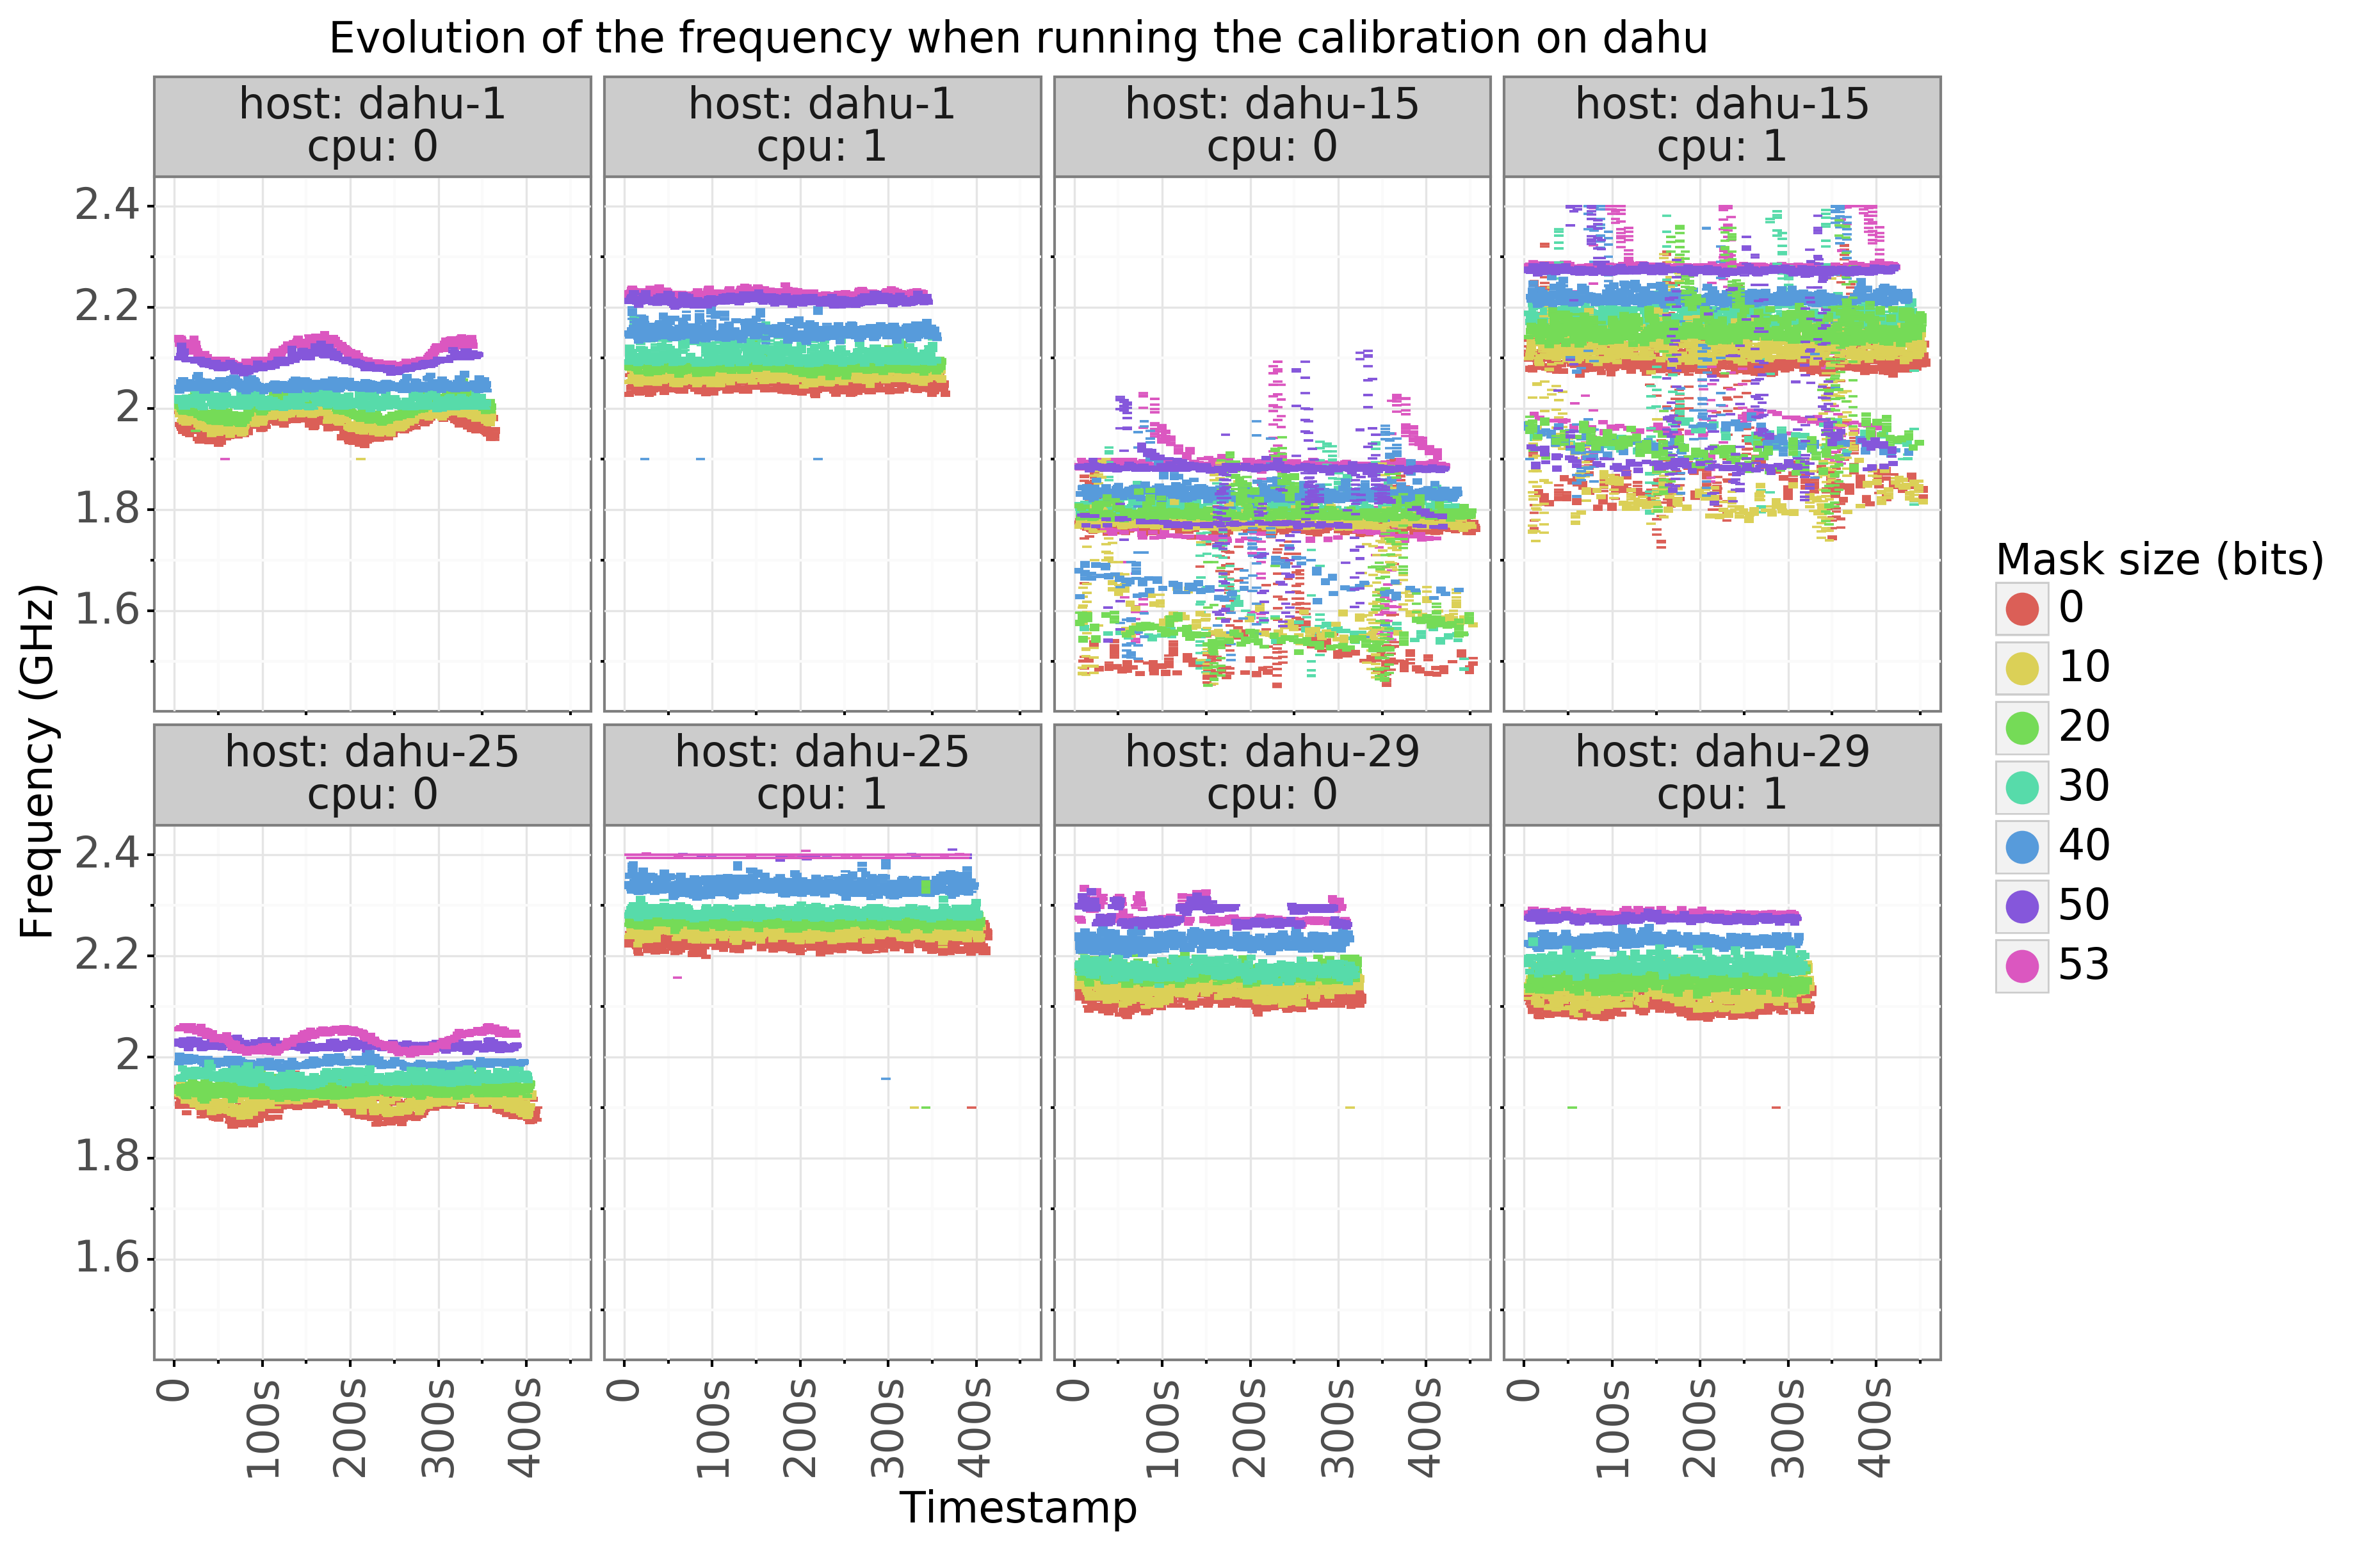
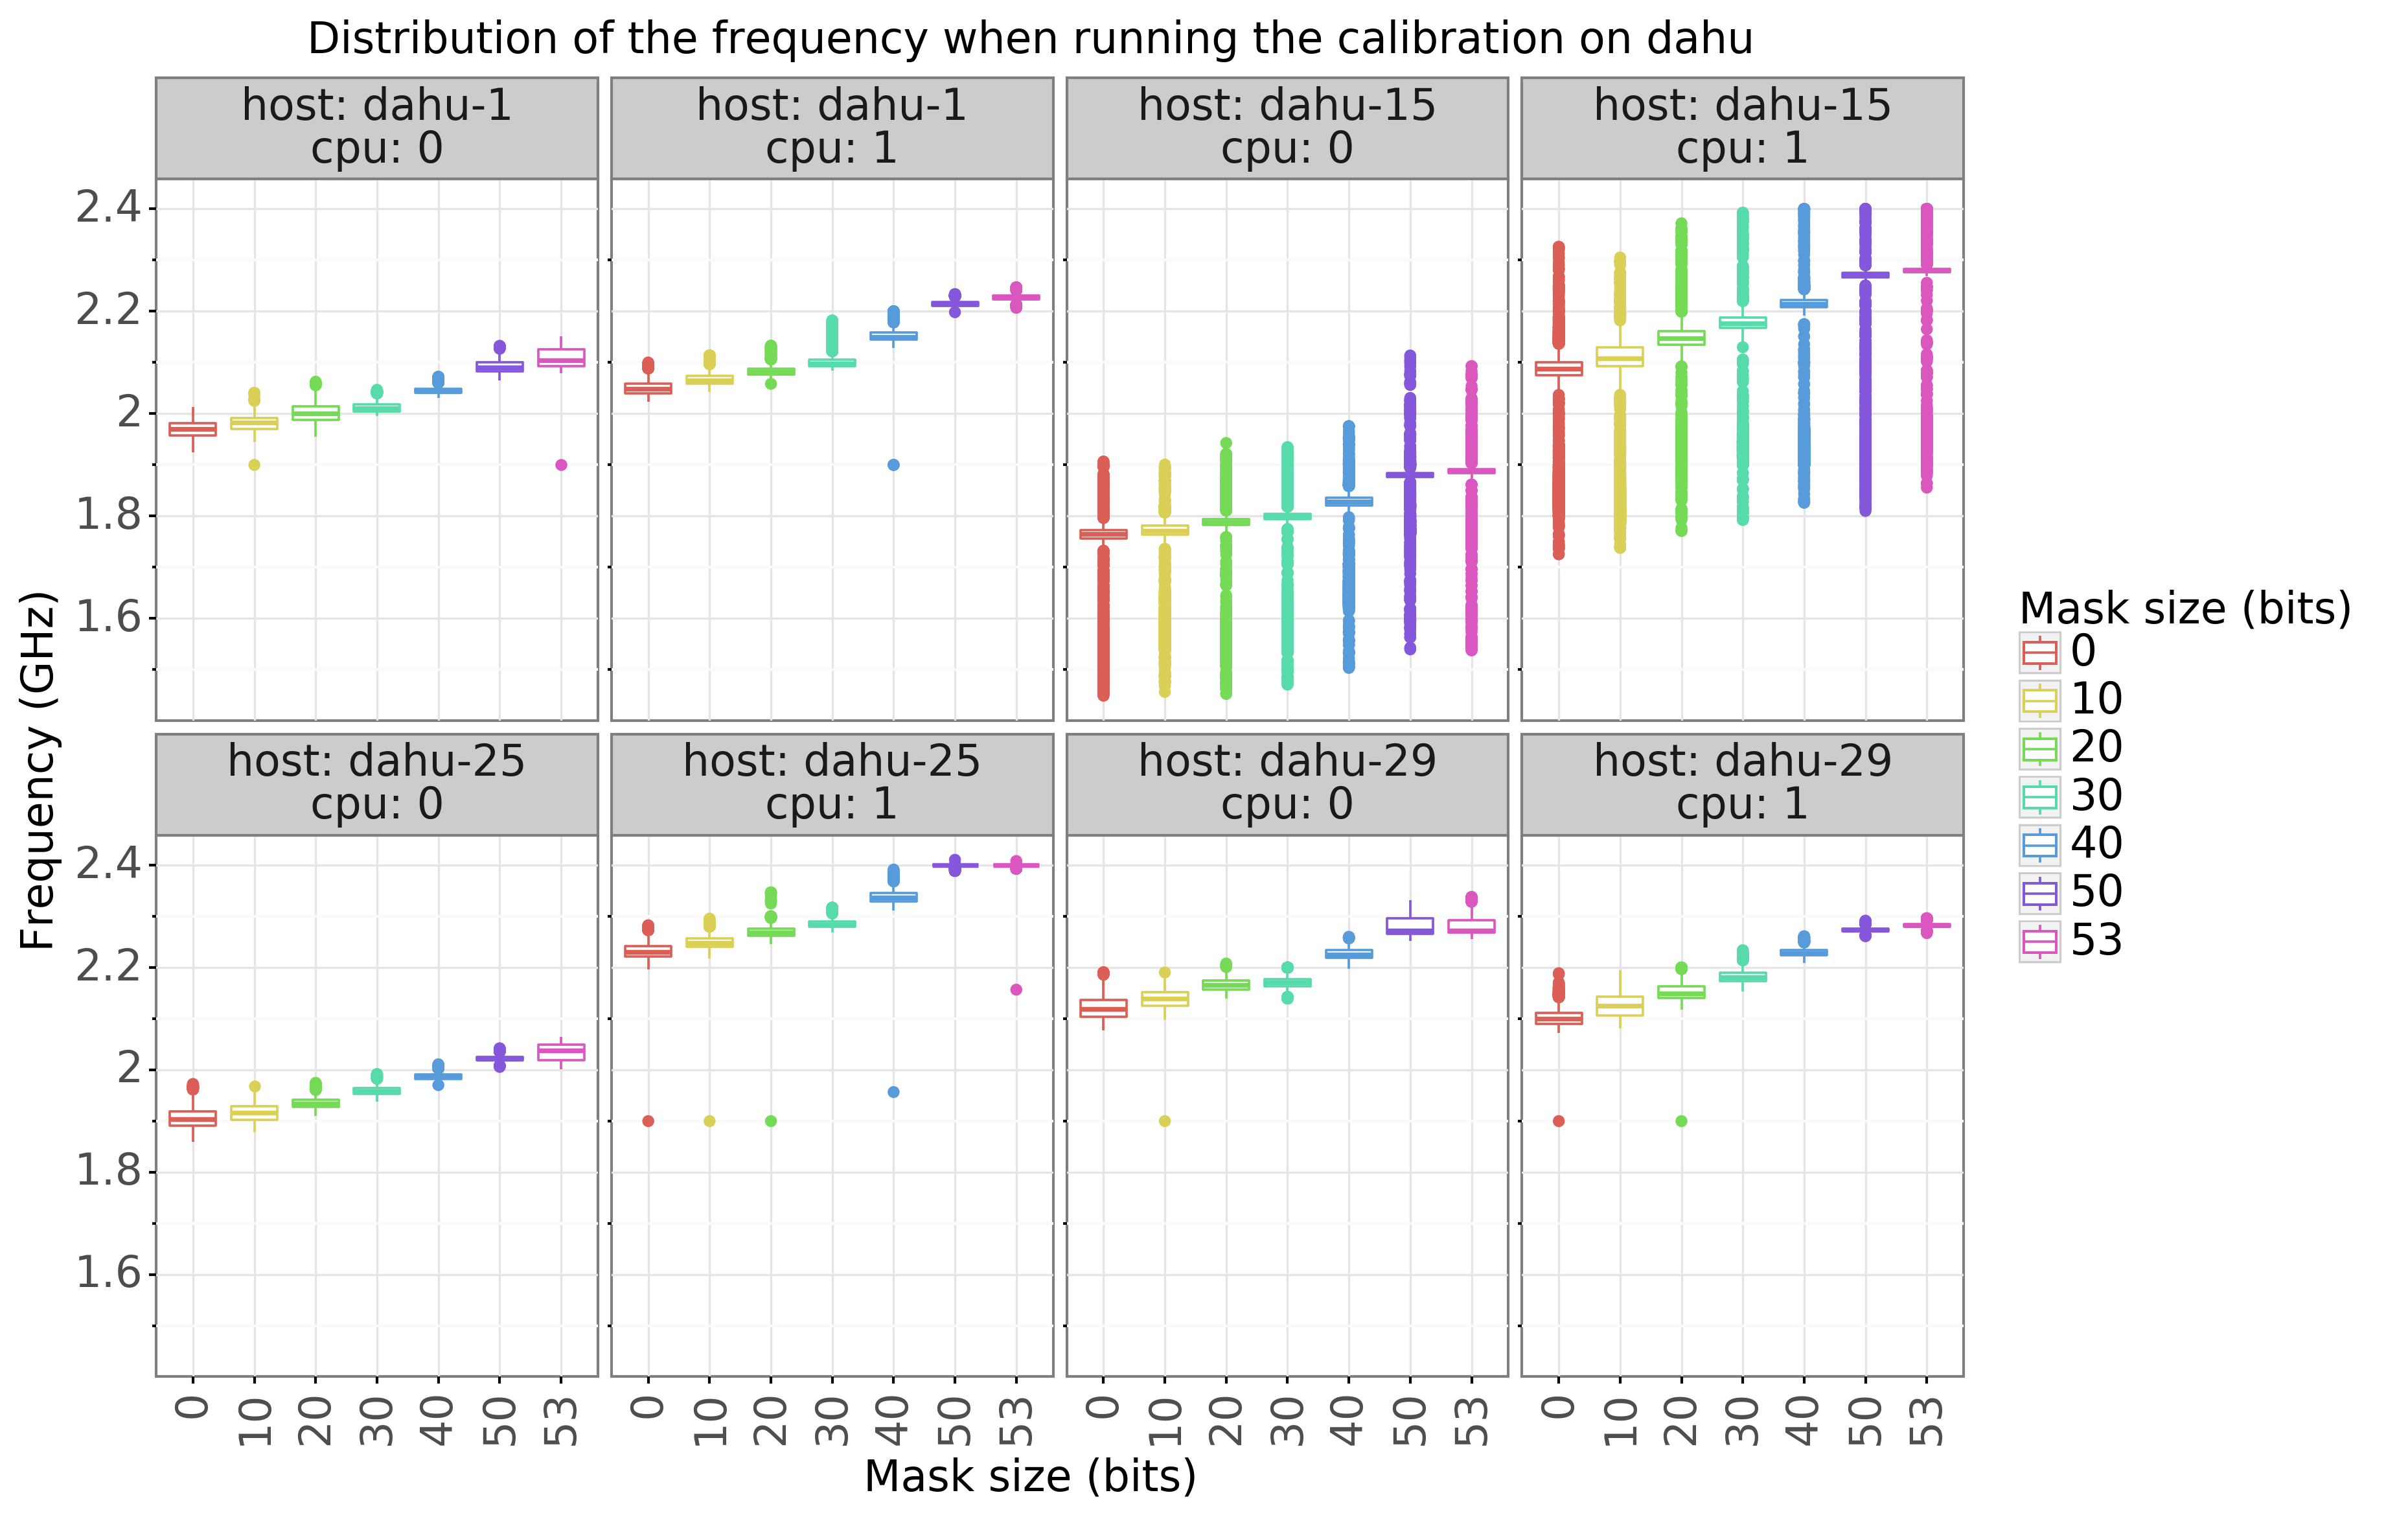
This correlation with the mask size can also be seen with the frequencies in figures 7 and 8: larger masks lead to higher frequencies.
This experiment has been repeated on two other Grid’5000 clusters, ecotype and gros. For both of them, the same observations could be made, a clear correlation between the mask size, the frequencies and the performance.
5 Conclusion
We have shown that the performance of the dgemm function is data-dependent. The best explanation we have for this counter-intuitive fact is an energy cost overhead caused by bit flips inside the processor. This theory has been corroborated by a controlled experiment where the elements of the matrices are initialized semi-randomly: they all share an identical bit suffix.
To strengthen this claim further, the next steps will be to perform a similar experiment with another compiler, another BLAS library and/or another computation kernel. We also need to understand why some processors are subject to this phenomenon and some others are not. Last, we wonder whether this could be applied to perform a side-channel attack.
6 Acknowledgements
We warmly thank our colleagues that helped us to find hypotheses for this performance anomaly. In particular, Guillaume Huard suggested that the performance anomaly may be caused by the bit flips in the processor.
Experiments presented in this paper were carried out using the Grid’5000 testbed, supported by a scientific interest group hosted by Inria and including CNRS, RENATER and several Universities as well as other organizations (see https://www.grid5000.fr).
References
- [1] T. Cornebize, A. Legrand, and F. C. Heinrich, “Fast and Faithful Performance Prediction of MPI Applications: the HPL Case Study,” in 2019 IEEE International Conference on Cluster Computing (CLUSTER), ser. 2019 IEEE International Conference on Cluster Computing (CLUSTER), Albuquerque, United States, Sep. 2019. [Online]. Available: https://hal.inria.fr/hal-02096571