Testing CIBER cosmic infrared background measurements and axionlike particles with observations of TeV blazars
Abstract
The first measurements from the CIBER experiment of extragalactic background light (EBL) in near-infrared (NIR) band exhibit a higher intensity than those inferred through -ray observations. Recent theoretical-EBL intensities are typically consistent with the very high energy (VHE) -ray observations. Yet, it is possible that the excess NIR radiation is a new component of EBL and not in tension with the TeV spectra of distant blazars, since the hypothetical axion-like particle (ALP) may lead to a reduced opacity of the Universe for VHE -rays. In order to probe whether the excess component arises mainly from EBL, thirteen observed spectra in high energy and VHE ranges from ten distant TeV BL Lac objects are fitted by four theoretical spectra which involve theoretical EBL (Gilmore ), Gilmore’s EBL model including photon/ALP coupling, Gilmore’s EBL with CIBER excess and the latter including photon/ALP coupling respectively. We find the goodness of fit for the model with CIBER excess can be improved with a significance of after including the photon/ALP coupling; Thus, the ALP/photon mixing mechanism can effectively alleviate the tension; However, the Gilmore EBL model, on the whole, is more compatible with the observed spectra compared to those with ALP, although individual blazars such as PKS 1424+240 and 1ES 1101-232 prefer the ALP-model. Our results suggest that the recent EBL models can solely explain the VHE -ray observations, and assuming the existence of the ALP to alleviate the tension is not required in a statistical sense, thus the excess over the EBL models is less likely to be a new EBL component.
I Introduction
The extragalactic background light (EBL) is the cosmic background photon field that is mainly composed by ultraviolet (UV), optical, and near-infrared (NIR) light. It is mainly produced by stars and interstellar medium in galaxies throughout the cosmic history. Consequently, the EBL is an important observable for models of galaxy formation and evolution Hauser2001 . The EBL could be directly measured with different instruments (e.g. Refs. Sano2015 ; Sano2016 ; Matsumoto2015 ; Tsumura2013c ; CIBER2017 ), but it is a challenge to accurately subtract the foreground of zodiacal light and diffuse Galactic light. The lower limits of the EBL can be estimated using deep-galaxy-surveys data (e.g. Refs. Keenan2010 ). Several empirical EBL models based on different complementary methodologies have been developed (e.g. Refs. Franceschini2008 ; Dominguez2011 ; Kneiske2010 ; Finke2010 ; Gilmore2012 ; Stecker2016 ). Another technique to constrain the EBL indirectly is based on the -ray observations of extragalactic sources.
The very-high-energy (VHE, above 100 GeV) -rays from distant () blazars would suffer significant attenuation by pair-production interactions with the EBL during the propagation in extragalactic space Nikishov1962 ; Hauser2001 ; HESS2006 ; Dwek2013 ; Costamante2013 . As a result, a absorption imprint of the EBL is carried on the VHE observed spectra of blazars. This provide an independent way to constrain indirectly the EBL intensities (for reviews see e.g. Refs. Hauser2001 ; Dwek2013 ; Costamante2013 ) and test the empirical EBL models, e.g. Refs. Franceschini2008 ; Dominguez2011 ; Kneiske2010 ; Finke2010 ; Gilmore2012 ; Stecker2016 , by comparing the difference between the assumed-intrinsic spectra and the observed one. Thanks to the discovery of more and more distant Tev blazars, several groups have detected this imprint, e.g. Refs. HESS2006 ; MAGIC2008 ; Fermi2012 , and found the intensities were near the galaxy-count lower limits.
The spectra of a few individual blazars such as PKS1424+240 appear to be unexpectedly hard Abdalla2018 . Furthermore, hints for a reduced gamma-ray opacity in the form of a pair-production anomaly Horn2012 (i.e., VHE -ray observations require an EBL level below the lower limits from galaxy counts), or unusual redshift-dependent intrinsic (after correction for EBL absorption) spectral hardening found in large samples, have been claimed by several authors Essey2012 ; Rubtsov2014 ; Galanti2015 ; Korochkin2018 . However, no significant and systematic anomalies on the entire sample were revealed by recent systematic studies of spectra fitted with recent theoretical EBL absorption on large samples of VHE blazars, see e.g., Refs. Biteau2015 ; Dominguez2015 ; MAGIC2017 ; HESS2017 ; Zhong2018 ; Fermi2018 ; Abdalla2018 ; Desai2019 ; MAGIC2019 . The intensities of these recent EBL models (e.g. Franceschini 2008 Franceschini2008 , Dominguez 2011 Dominguez2011 , Kneiske 2010 Kneiske2010 , Finke 2010 Finke2010 , Gilmore 2012 Gilmore2012 , Stecker 2016 Stecker2016 ) are close to that from the galaxy counts. At present, many EBL measurements inferred by -ray observations reveal that its intensities are generally consistent with those given by the recent EBL models, see e.g., Refs. Fermi2012 ; Gong2013 ; HESS2013 ; VERITAS2015 ; Biteau2015 ; MAGIC2016 ; Armstrong2017 ; Desai2019 ; Pueschel2019 .
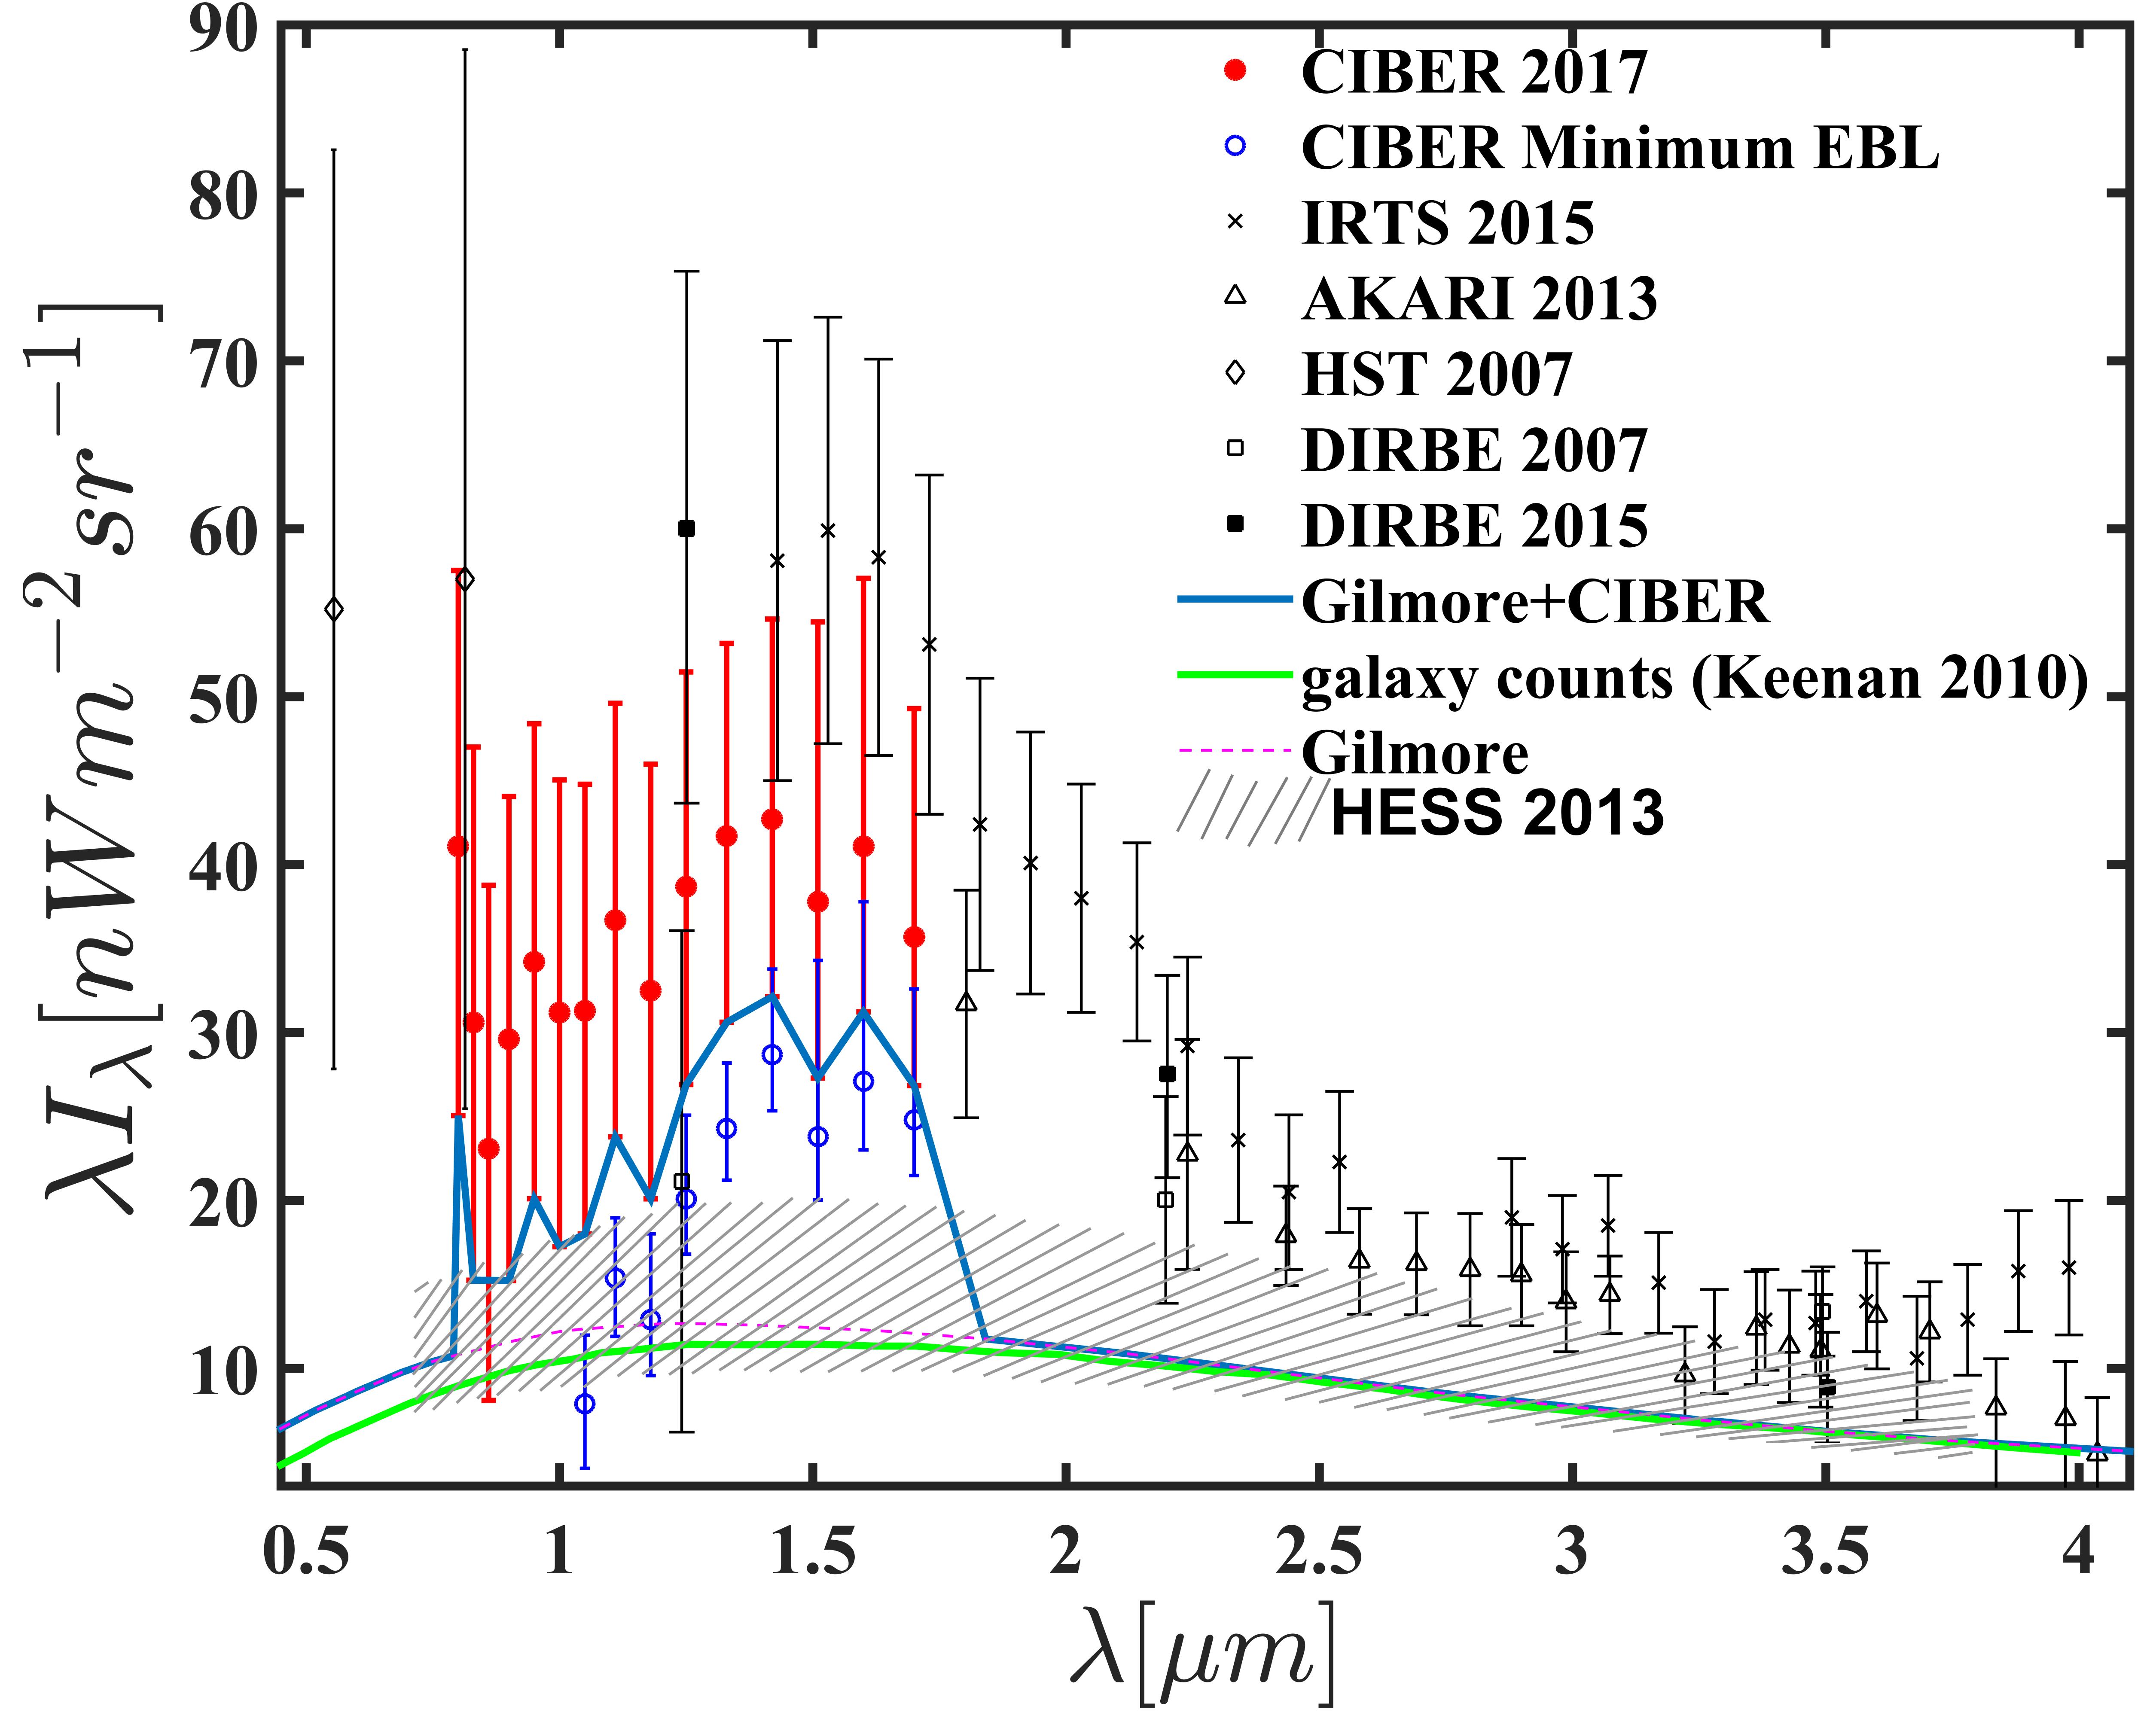
However, most of the direct local measurements of EBL from several different groups (e.g. Refs. Sano2015 ; Sano2016 ; Matsumoto2015 ; Tsumura2013c ; CIBER2017 ) in NIR band (0.8-5 m), especially the first result recently released at 0.8-1.7 m by CIBER CIBER2017 , exhibit larger intensity than those predicted by EBL models and measured using -rays observations, see Fig. 1. Moreover, the attenuation by pair producing interaction for the TeV photons from distant blazars is most sensitive to the NIR EBL intensity at the wavelength around 1 m Kori2017 . Thus, even if only taking into account the measurements of CIBER, the excess radiation may lead to pair-production anomaly or an un-physically hard intrinsic spectrum (the spectrum is harder than that expected from the traditional acceleration and radiation model of blazar) for distant TeV blazars. If the excess radiation is a new EBL component, unconventional solutions are required to alleviate the tension between the VHE spectra of blazar and the measurements of CIBER.
To alleviate this tension, a possible attractive way is to assume the existence of a very light pseudo-scalar spin-zero boson called axion-like particle (ALP) Kori2017 ; Kalashev2019 , which is predicted by many extensions of the Standard Model of particle and especially superstring theories (for reviews see e.g. Refs. Masso2010 ). ALP is characterized by a two-photon coupling (a two-photon vertex) Raffelt1988 , so it can mix with photons in external magnetic fields. This mechanism could prevent a considerable fraction of VHE photons from distant blazars from being absorbed by the soft EBL photons under given conditions, see e.g. Refs. Angelis2007 ; Mirizzi2009 ; Dominguez2011b ; Angelis2013 ; Meyer2013 ; Troitsky2016 . As a consequence, the detection of hard TeV photons from high red-shift sources by Imaging Atmospheric Cherenkov Telescopes (IACTs) could be reasonably interpreted even if the EBL intensity in NIR band is as high as that measured by CIBER. This is recently verified by Kohri . Kori2017 on two hard spectra of TeV blazar 1ES1101-232 and H2356-309. In homogeneous external magnetic fields, they assume the emitted TeV photons can convert to ALPs in blazar jet and then this ALPs can re-convert into the photons inside the Milky Way (MW) Galaxy.
We aim to probe whether the excess radiation of CIBER is a new EBL component. So, we propose a method: thirteen observed spectra of distant TeV BL Lac objects are fitted by four theoretical spectra which involve theoretical EBL (Gilmore et al), Gilmore’s EBL model with CIBER excess and Gilmore’s EBL with/witout CIBER excess including photon/ALP coupling respectively; If the model including ALP and CIBER data has more significant advantage on explaining the -ray observations than that only with CIBER data, the tension can be alleviated or solved; Furthermore, if it is more compatible with the observations than theoretical EBL only model, then the excess component could be EBL in the presence of ALP; Otherwise the excess is less likely to be a new EBL component.
If the excess is contributed by foreground yet undefined component CIBER2017 and the Gilmore’s EBL model is more preferred by the observed spectra than that including ALP, there is no real discrepancy among the observations and the hypothetical ALP is not required. Therefore, investigating the origin of the excess radiation is necessary and significant.
The structure of the paper is as follows. In Sec. II, we briefly describe the ALP/photon oscillation model. In Sec. III, we present the magnetic fields configuration and ALP/photon conversion scenarios. In Sec. IV, we analyze the Fermi-LAT and IACTs data of 10 BL Lacs (13 spectra). In Sec. V, the results of the spectral fits performed with the three models above are presented and discussed. Summary and conclusion are given in Sec. VI.
II ALP (axion-like particle)-photon oscillation
The ALP/photon oscillation are assumed to take place in the magnetic field regions along the path of the propagating gamma-ray photons from the source to the earth.
We denote the y-axis direction as that of the propagating gamma-ray photons. We consider a photon/ALP beam of energy propagating along the line of sight in a cold magnetized plasma. The beam for unpolarized photons is described with the density matrix , where and describe the photon linear polarization amplitudes along the x and z axis, respectively, a(y) is the ALP amplitude. From the Lagrangian of photon-ALP system, we can derive the beam propagation equation for ultra-relativistic ALPs Raffelt1988 ; Tavecchio2012 ; Angelis2013 ; Masaki2017
| (1) |
Here, M denotes the photon-ALP mixing matrix, including the mixing, refractive and the photon absorption effects. It is defined as zhang2018
| (2) |
where is the component of the magnetic field strength in the x-z plane, represents the mixing matrix for and V is the rotation matrix in the x-z plane. When forms an angle with the z axis, the matrix V is
| (3) |
The Faraday effect is totally irrelevant at the energies (HE and VHE) considered in this paper and can be neglected, then the mixing matrix can be written as
| (4) |
We denote the mean free path of -ray photon in extragalactic space as , and the ALP mass as .
Then the various terms in are Raffelt1988 and , where is the coupling constant. The plasma effect is stemmed from an effective photon mass produced by charge screening in plasma. is photon/ALP mixing term. The term describes the photon one-loop vacuum polarization. Photon-photon dispersion provided by the cosmic microwave background (CMB) leads to the term with a factor to account for the evolution of CMB density at red-shift , which is considered only in extragalactic space. The Cotton-Mouton effect, for the energies and magnetic fields considered here, can be reasonably neglected.
For the relevant parameters, numerically we find under the natural Lorentz-Heaviside units Montanino2017
| (5) |
where we have used the relation of unit conversion: , and Anchordoqui2018 .
We split the beam path, in every mixing region, into many small cells with a homogeneous magnetic field in each cell. For an initial photon matrix at , the density matrix at position is the solution of Eq. 2, which have been given in the literature, e.g. Refs. Tavecchio2012 ; Angelis2013 ; Montanino2017 , as
| (6) |
where is the transfer matrix. Then the photon survival probability at the final polarization states and after propagating through a mixing region is given by
| (7) |
.
If we neglect the absorption and the magnetic field strength is the same constant in all the cell but with a random angle in each one, the condition for significant conversion is
| (8) |
where is the distance the beam have propagated, and is the cell length Meyer2014 . We use the notation above and , where A represents , , or .
In a simple case where the magnetic field is homogeneous and the resonant conversion Hochmuth2007 is neglected, the conversion probability of a photon to an ALP is Kori2017 ; Hooper2007
| (9) |
where is a critical energy, see e.g. Refs. Angelis2008 ,
| (10) |
From Eq. 9, become energy-independent and sizable when and .
III magnetic field configuration and conversion scenarios
III.1 Magnetic field configuration
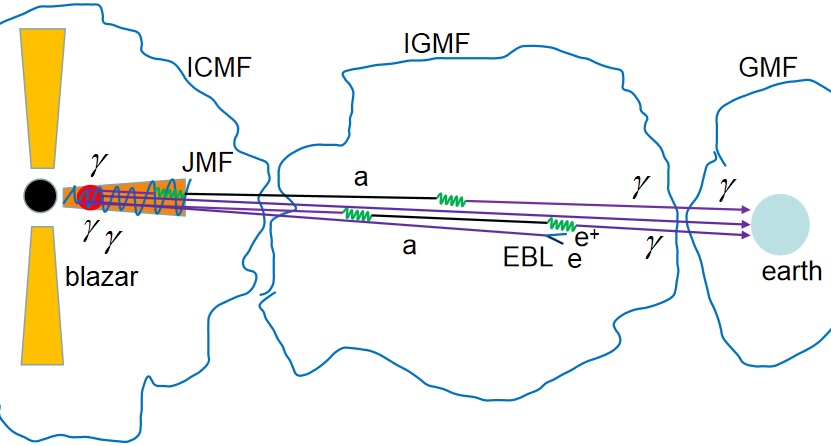
Along the entire path of the ALP/photon beam from the source to the Earth, the magnetic fields are ubiquitous. The environment along the line of sight can provide some cues about the magnetic fields. It is widely believed that BL Lacs reside in elliptical galaxies embedded in small galaxy clusters or galaxy groups Farina2015 . Thus the photon/ALP beam crosses altogether five different regions of plasma and magnetic field configurations. As done in Refs. Meyer2014 , we ignore the mixing in the magnetic field of the host galaxy due to the small conversion probability in this region. Hence we only need to consider the environments of four regions the -rays photons pass through: 1. the jet magnetic field (JMF); 2. intra-cluster magnetic field (ICMF); 3. the intergalactic magnetic fields (IGMF); 4. the galactic magnetic field (GMF), as show in Fig. 2.
The ALP/photon conversion, with allowed ALP parameters, in IGMF has recently been found to be significant and could enhance the spectral hardening for cosmic TeV photons, if the IGMF obtained from large-scale cosmological simulations were adopted Montanino2017 . We will apply the simulated IGMF to model the observations for the first time. At the same time, a realistic magnetic fields configurations of the ALP/photon mixing region in blazar jet will be considered.
In the following subsections, we discuss the observational evidence and model assumptions for each environment respectively.
JMF—According to the observations and theory diagnostics, the magnetic field in BL Lac jet appears to be large scale coherent field ranging from 0.1 pc near the central engine up to kpc scales along the jet, this field is mainly ordered and the component traversed to the jet axis is predominant Pudritz2012 ; Tavecchio2015 . Based on this observational evidence and theoretical deduction, we apply the model proposed by Tavecchio et al. Tavecchio2015 or Mena et al. Mena2013 , in which and y is the coordinate along the jet axis.
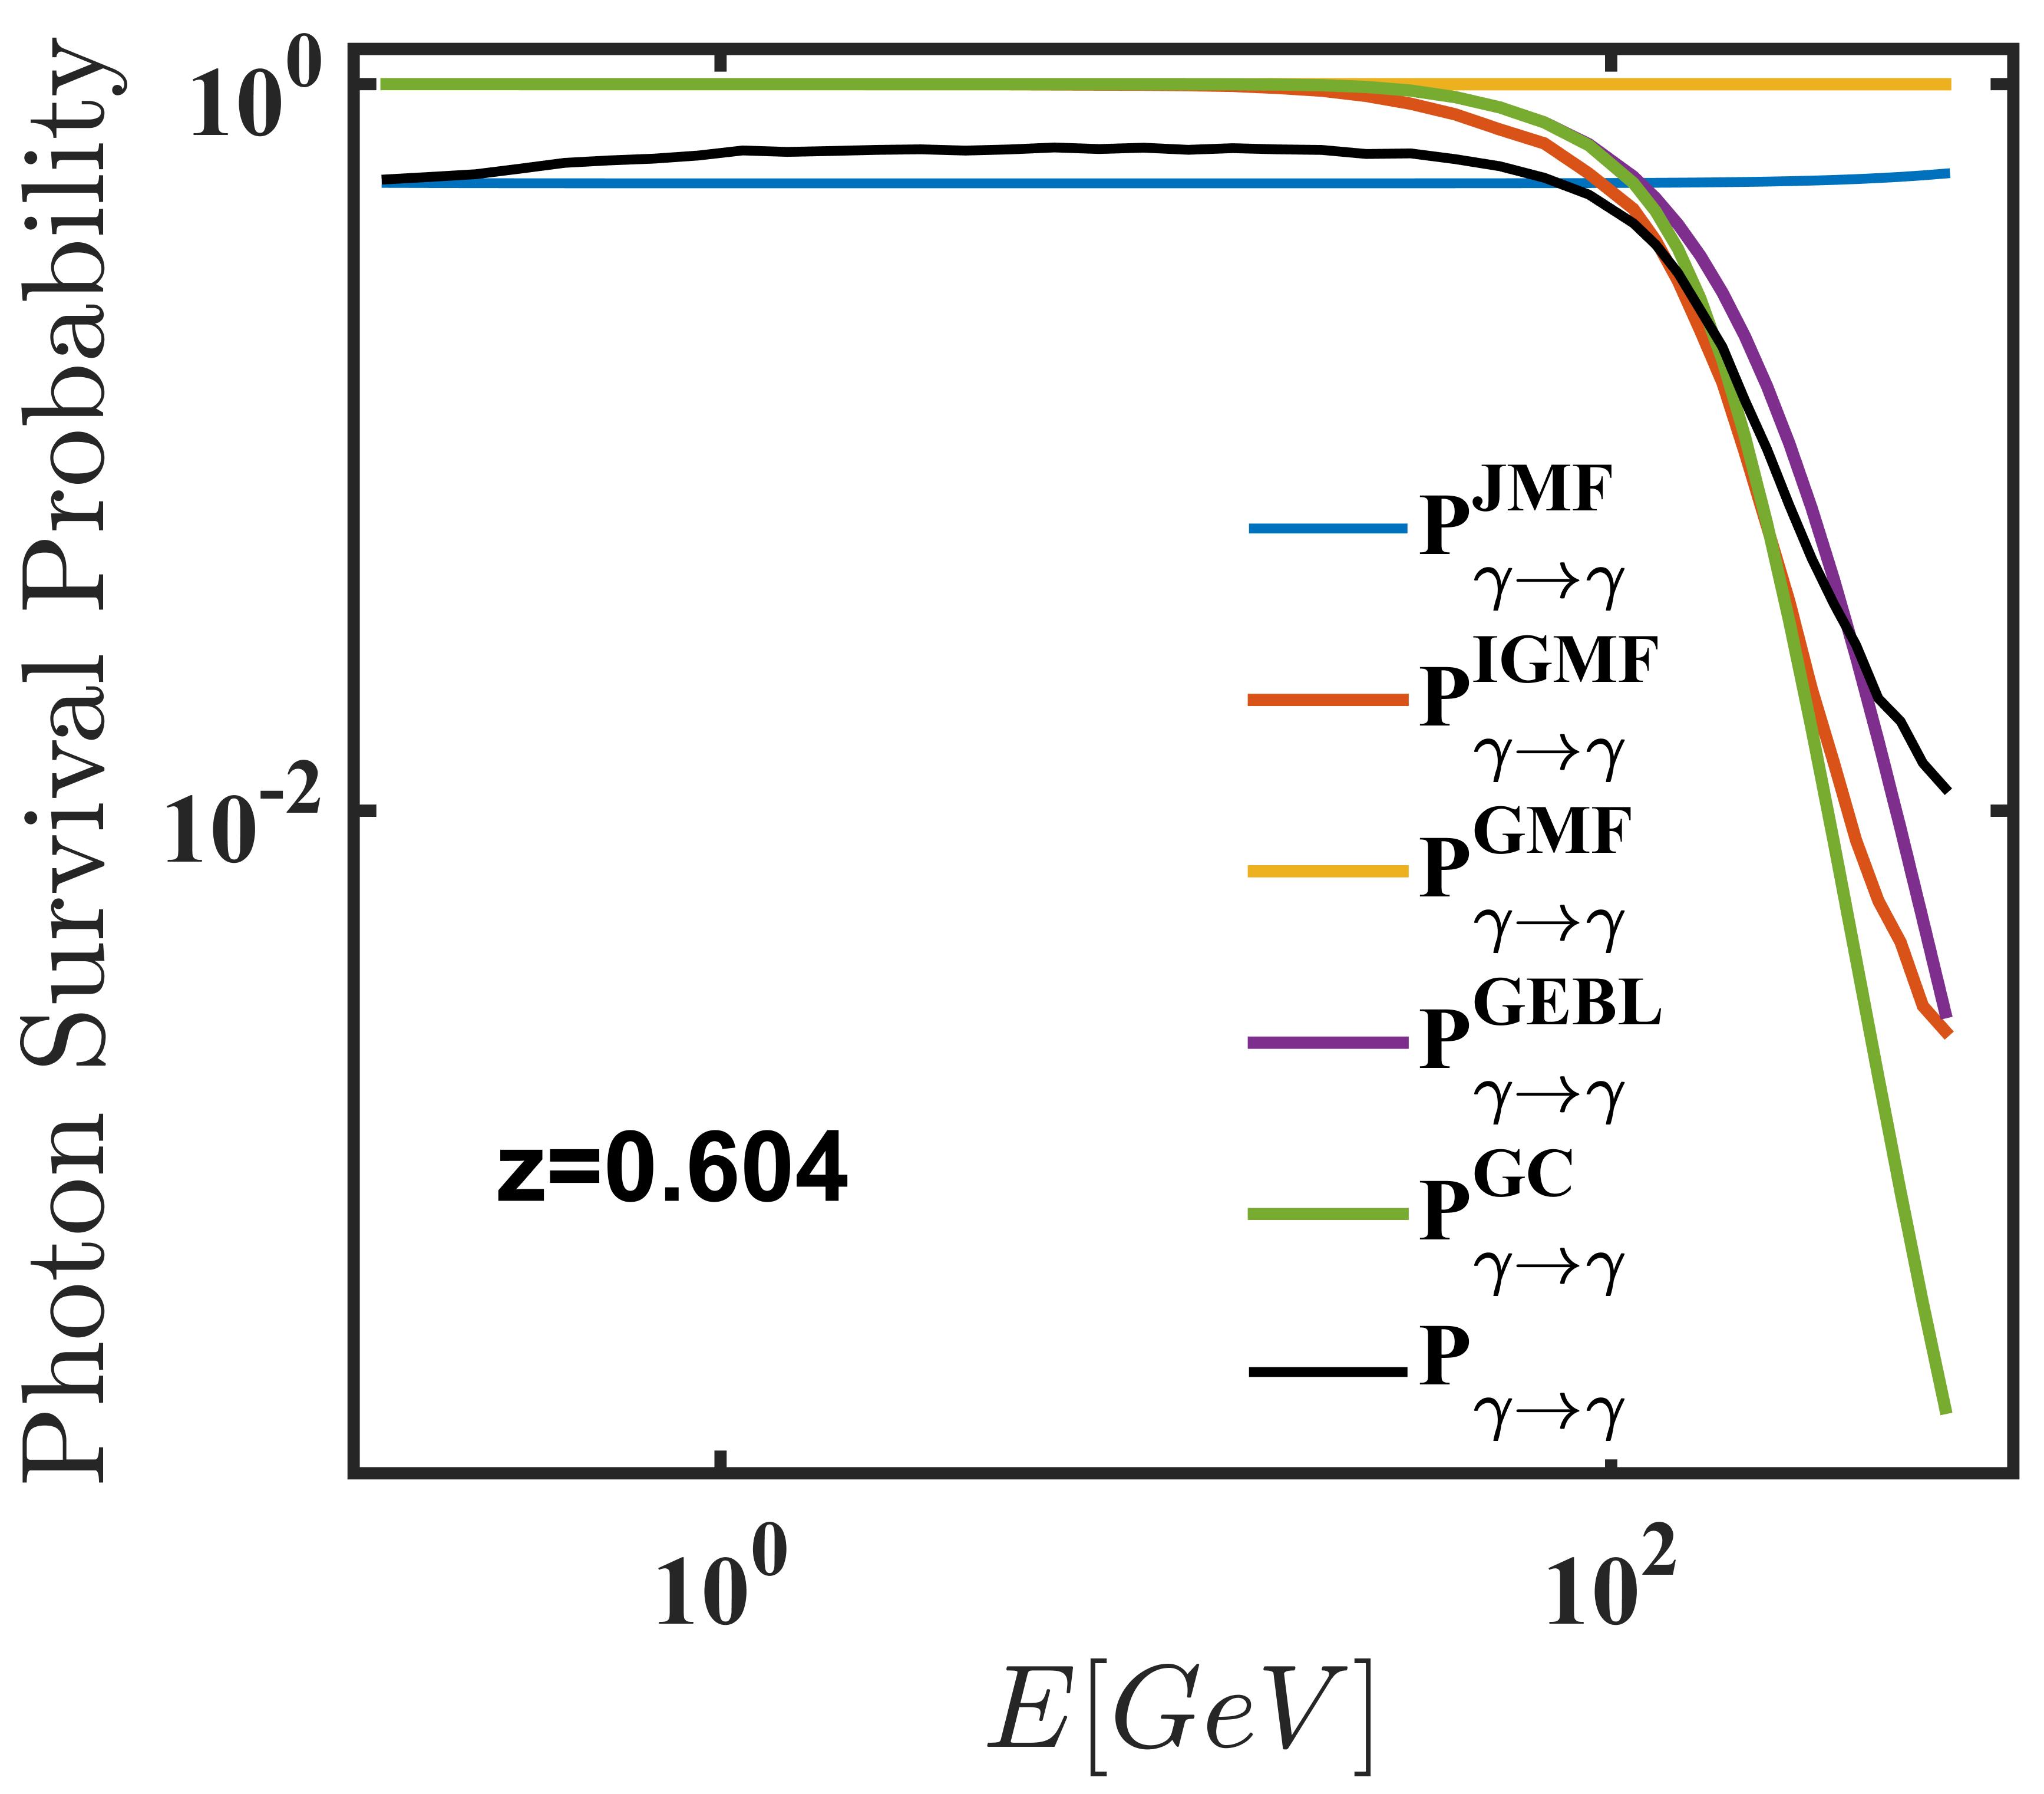
In this model, the plasma effect can be neglected according to its numerical value in Eq. 5, given the typical relevant-parameter values (for example, the electron density . Thus, there are four free parameters in the mixing model to be determined: the distance of VHE emitting region from the central engine, the magnetic field strength in VHE emitting region, the jet Doppler factor , and the length of the large scale coherent magnetic field. We adopt the typical values for every source. , and the size of emission region can be determined, in principle, by fitting to the multi-frequency observations with theoretical models for blazar emission such as synchrotron self Compton (SSC) Xue2016 . But for simplicity we adopt a single central value for all sources, and they are =0.2 G, =30 and = cm. Thus can be estimated by . An efficient conversion can realize, even if the coupling constant is down to for these values of and L according to . Finally, we calculate the photon survival probability in this region, as show in Fig. 2 (for the source PKS 1424+240).
ICMF—Faraday rotation measurements (FMs) and synchrotron emission at radio frequencies well establish that turbulent magnetic field with strength a few exists in the center of poor clusters or groups in which BL Lacs may be harboured Feretti2012 . The turbulent ICMF can be modeled with a divergence-free (i.e., =0) homogeneous and isotropic Gaussian field, which is described in detail in Refs. Meyer2014 . In this ICMF model Fermi2016 , there are five complete free parameters, if considering the degeneracy between the magnetic field strength at the cluster centre and the index . The mixing probability is sensitive to three parameters, i.e., , the cluster radius and the correlation length that is related to the free parameters of the turbulence spectrum.
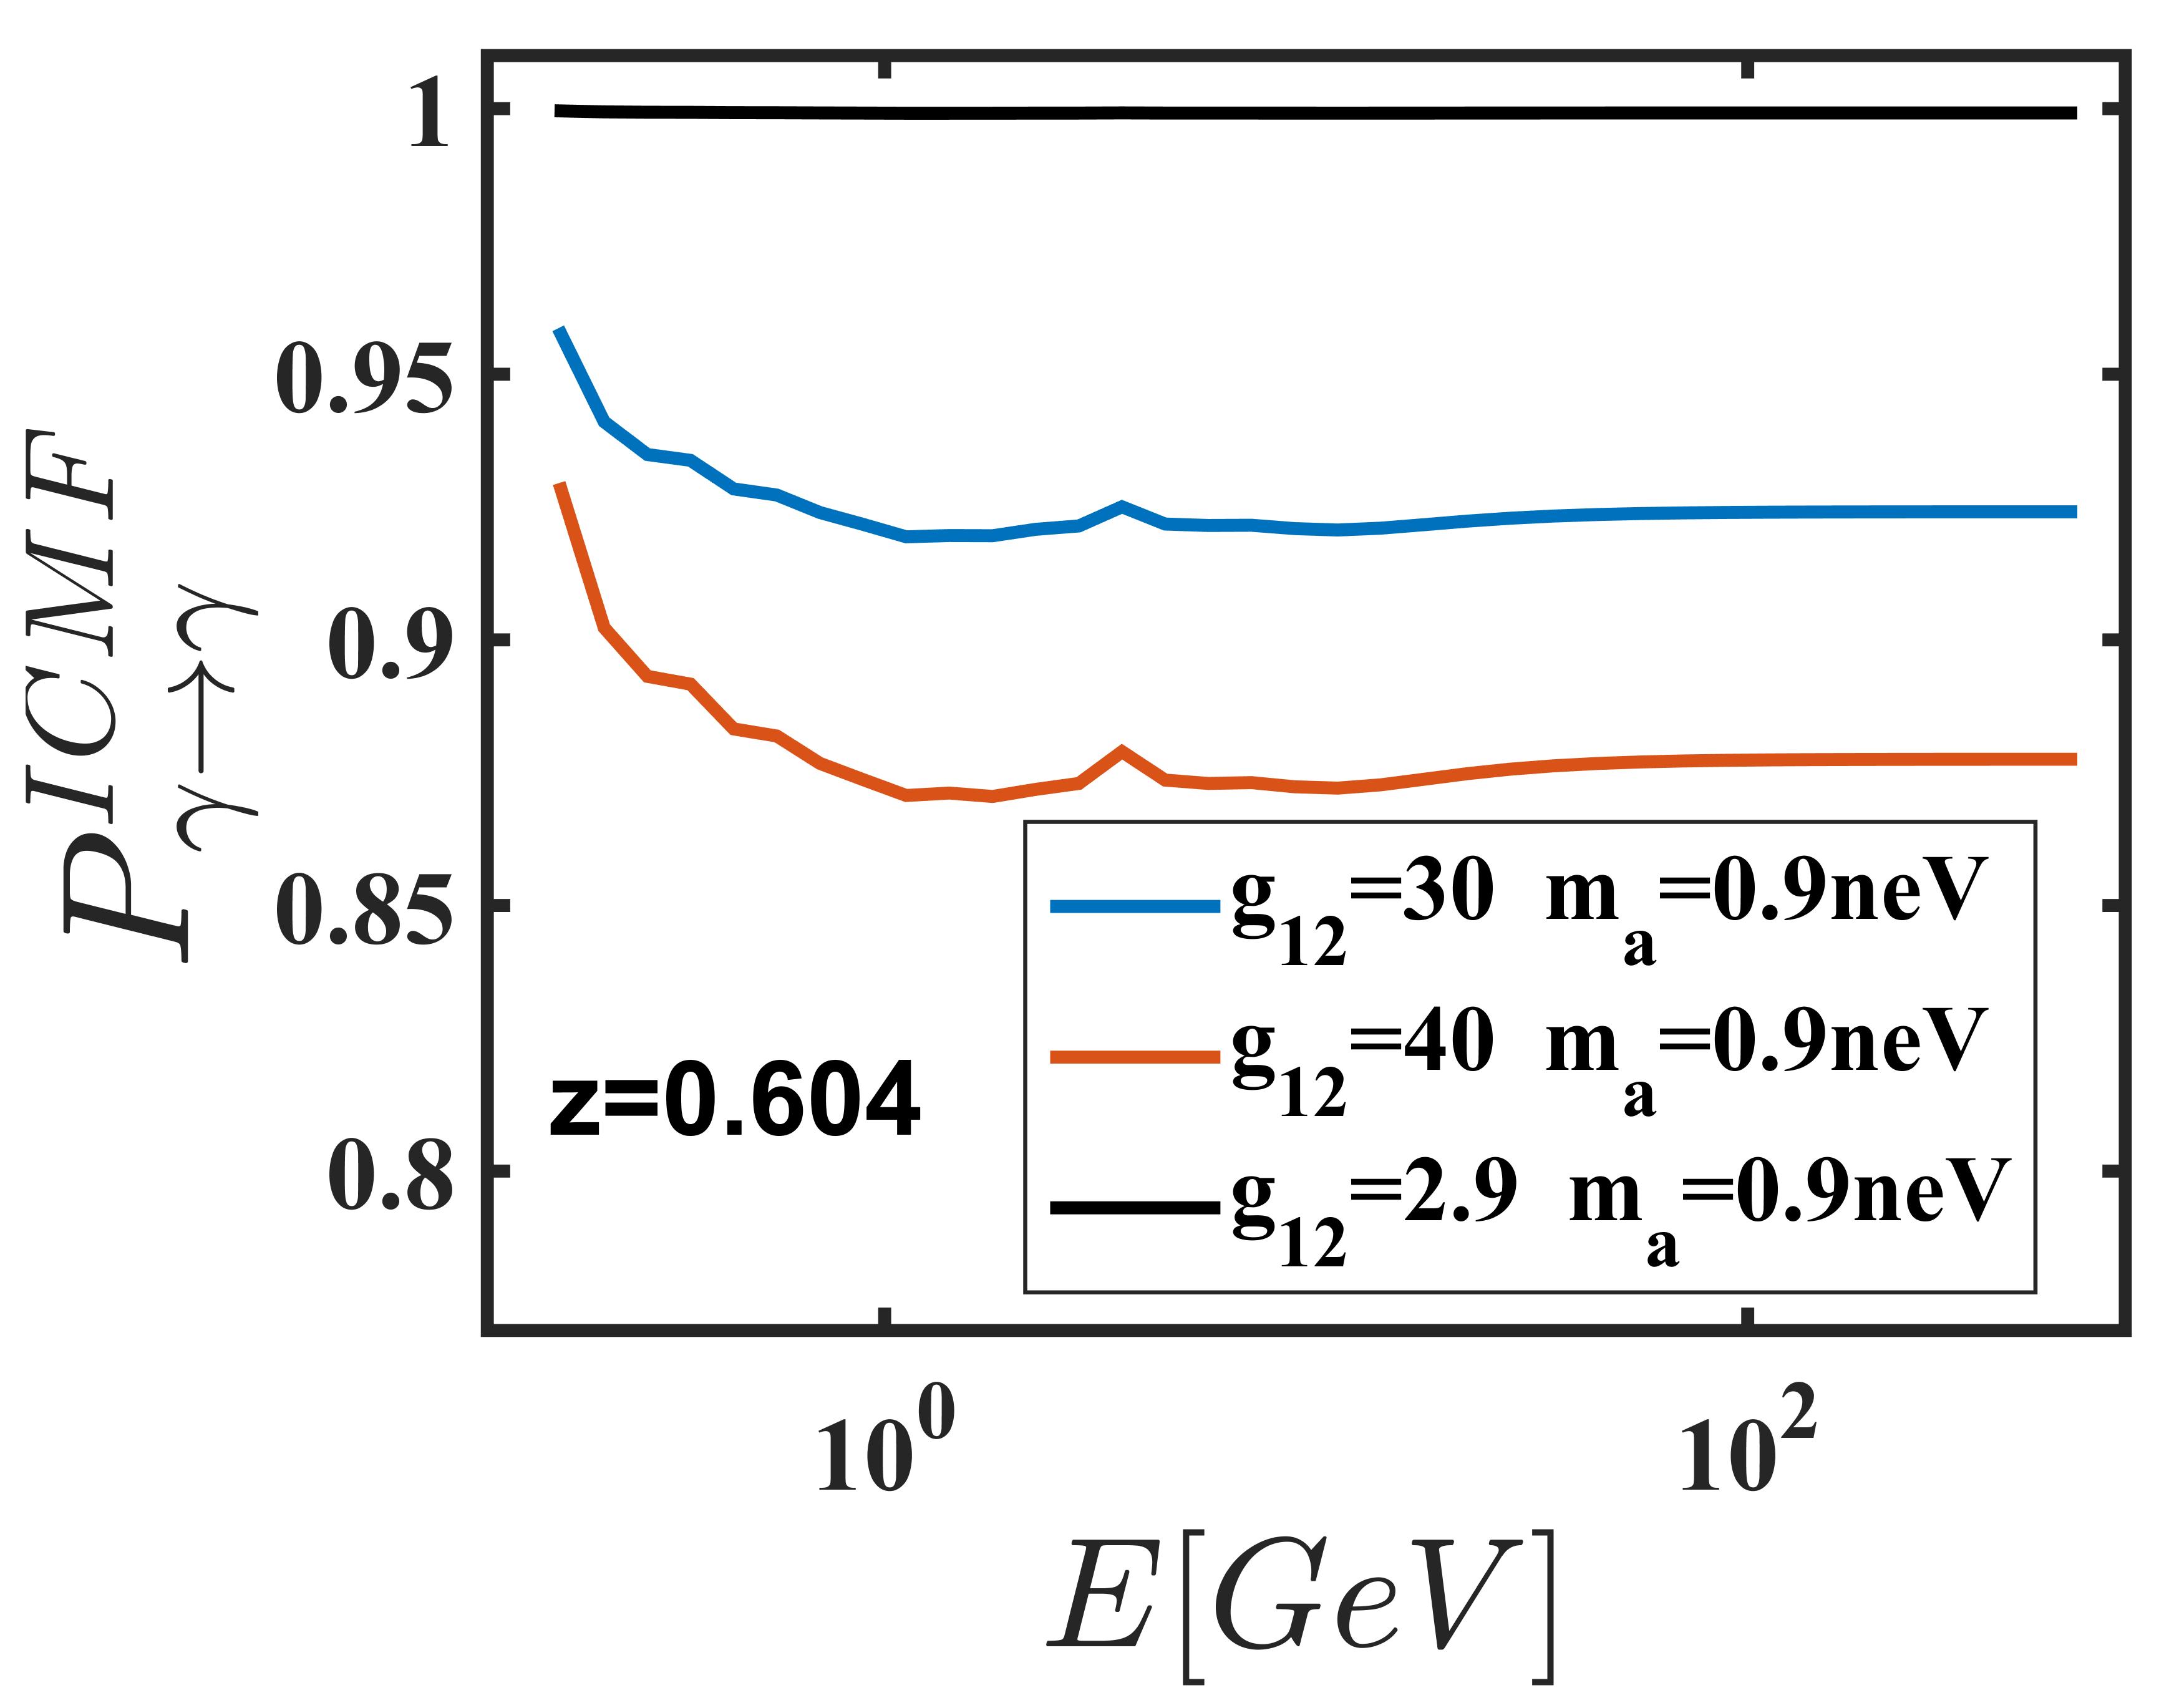
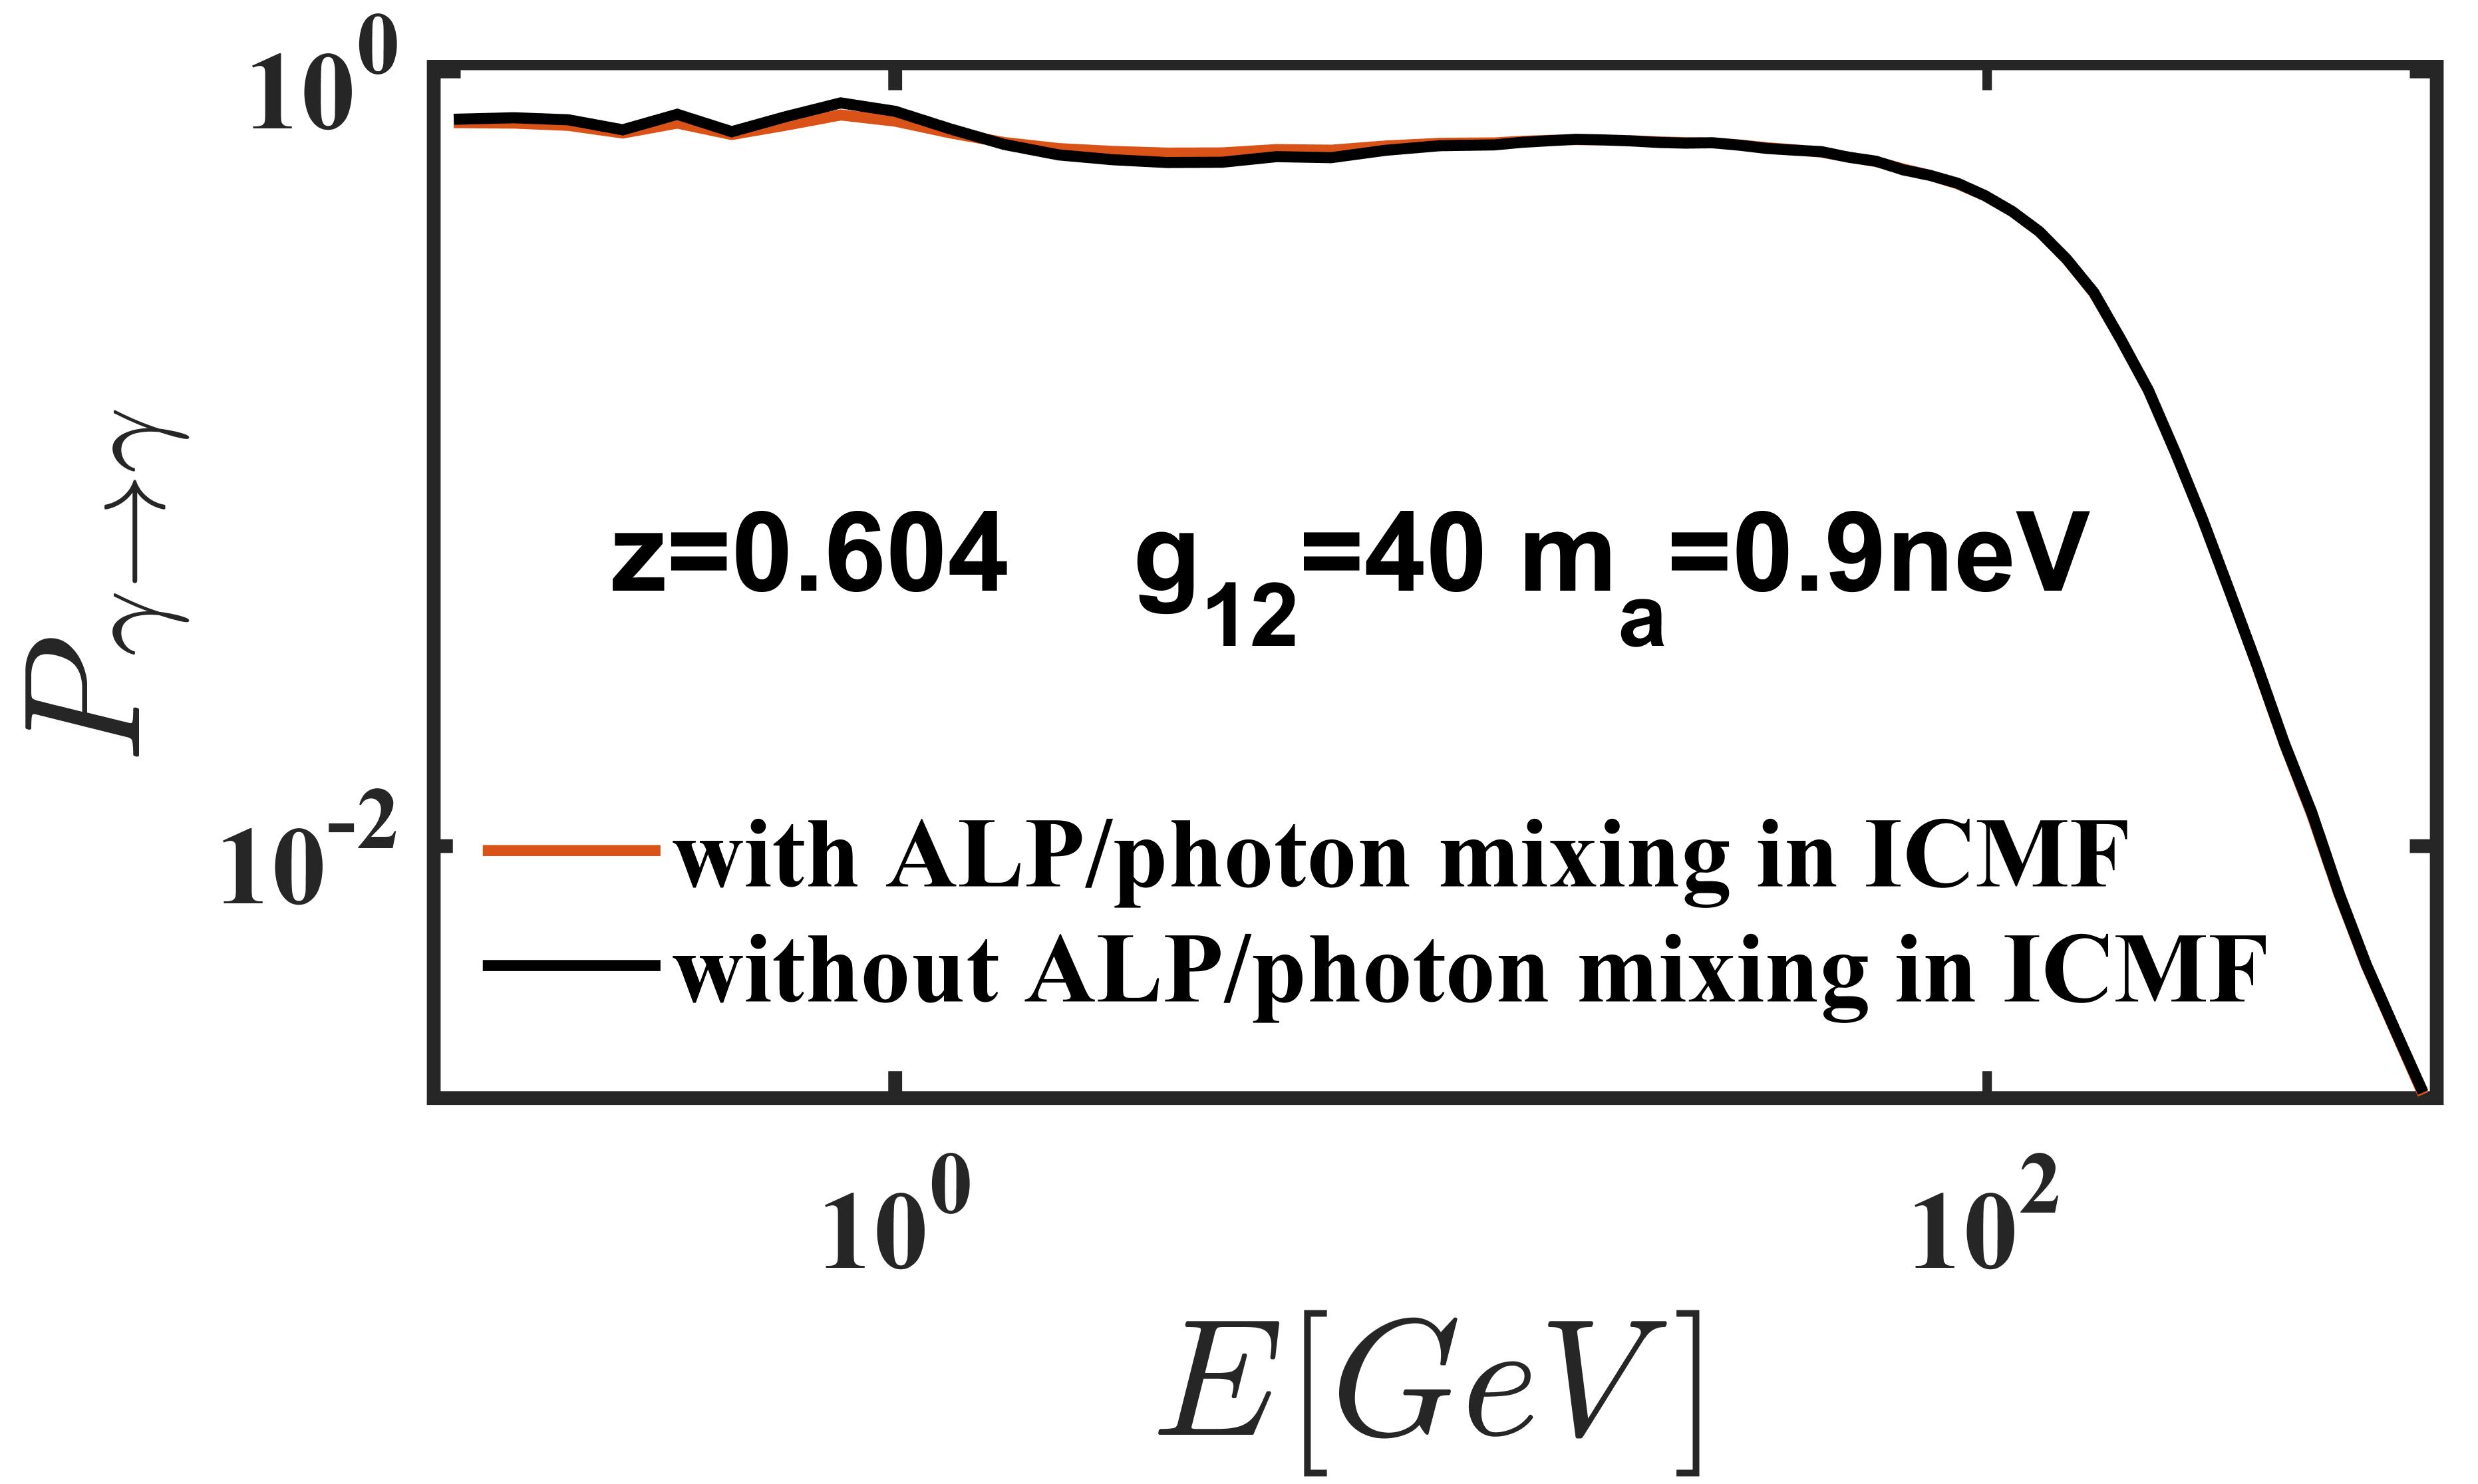
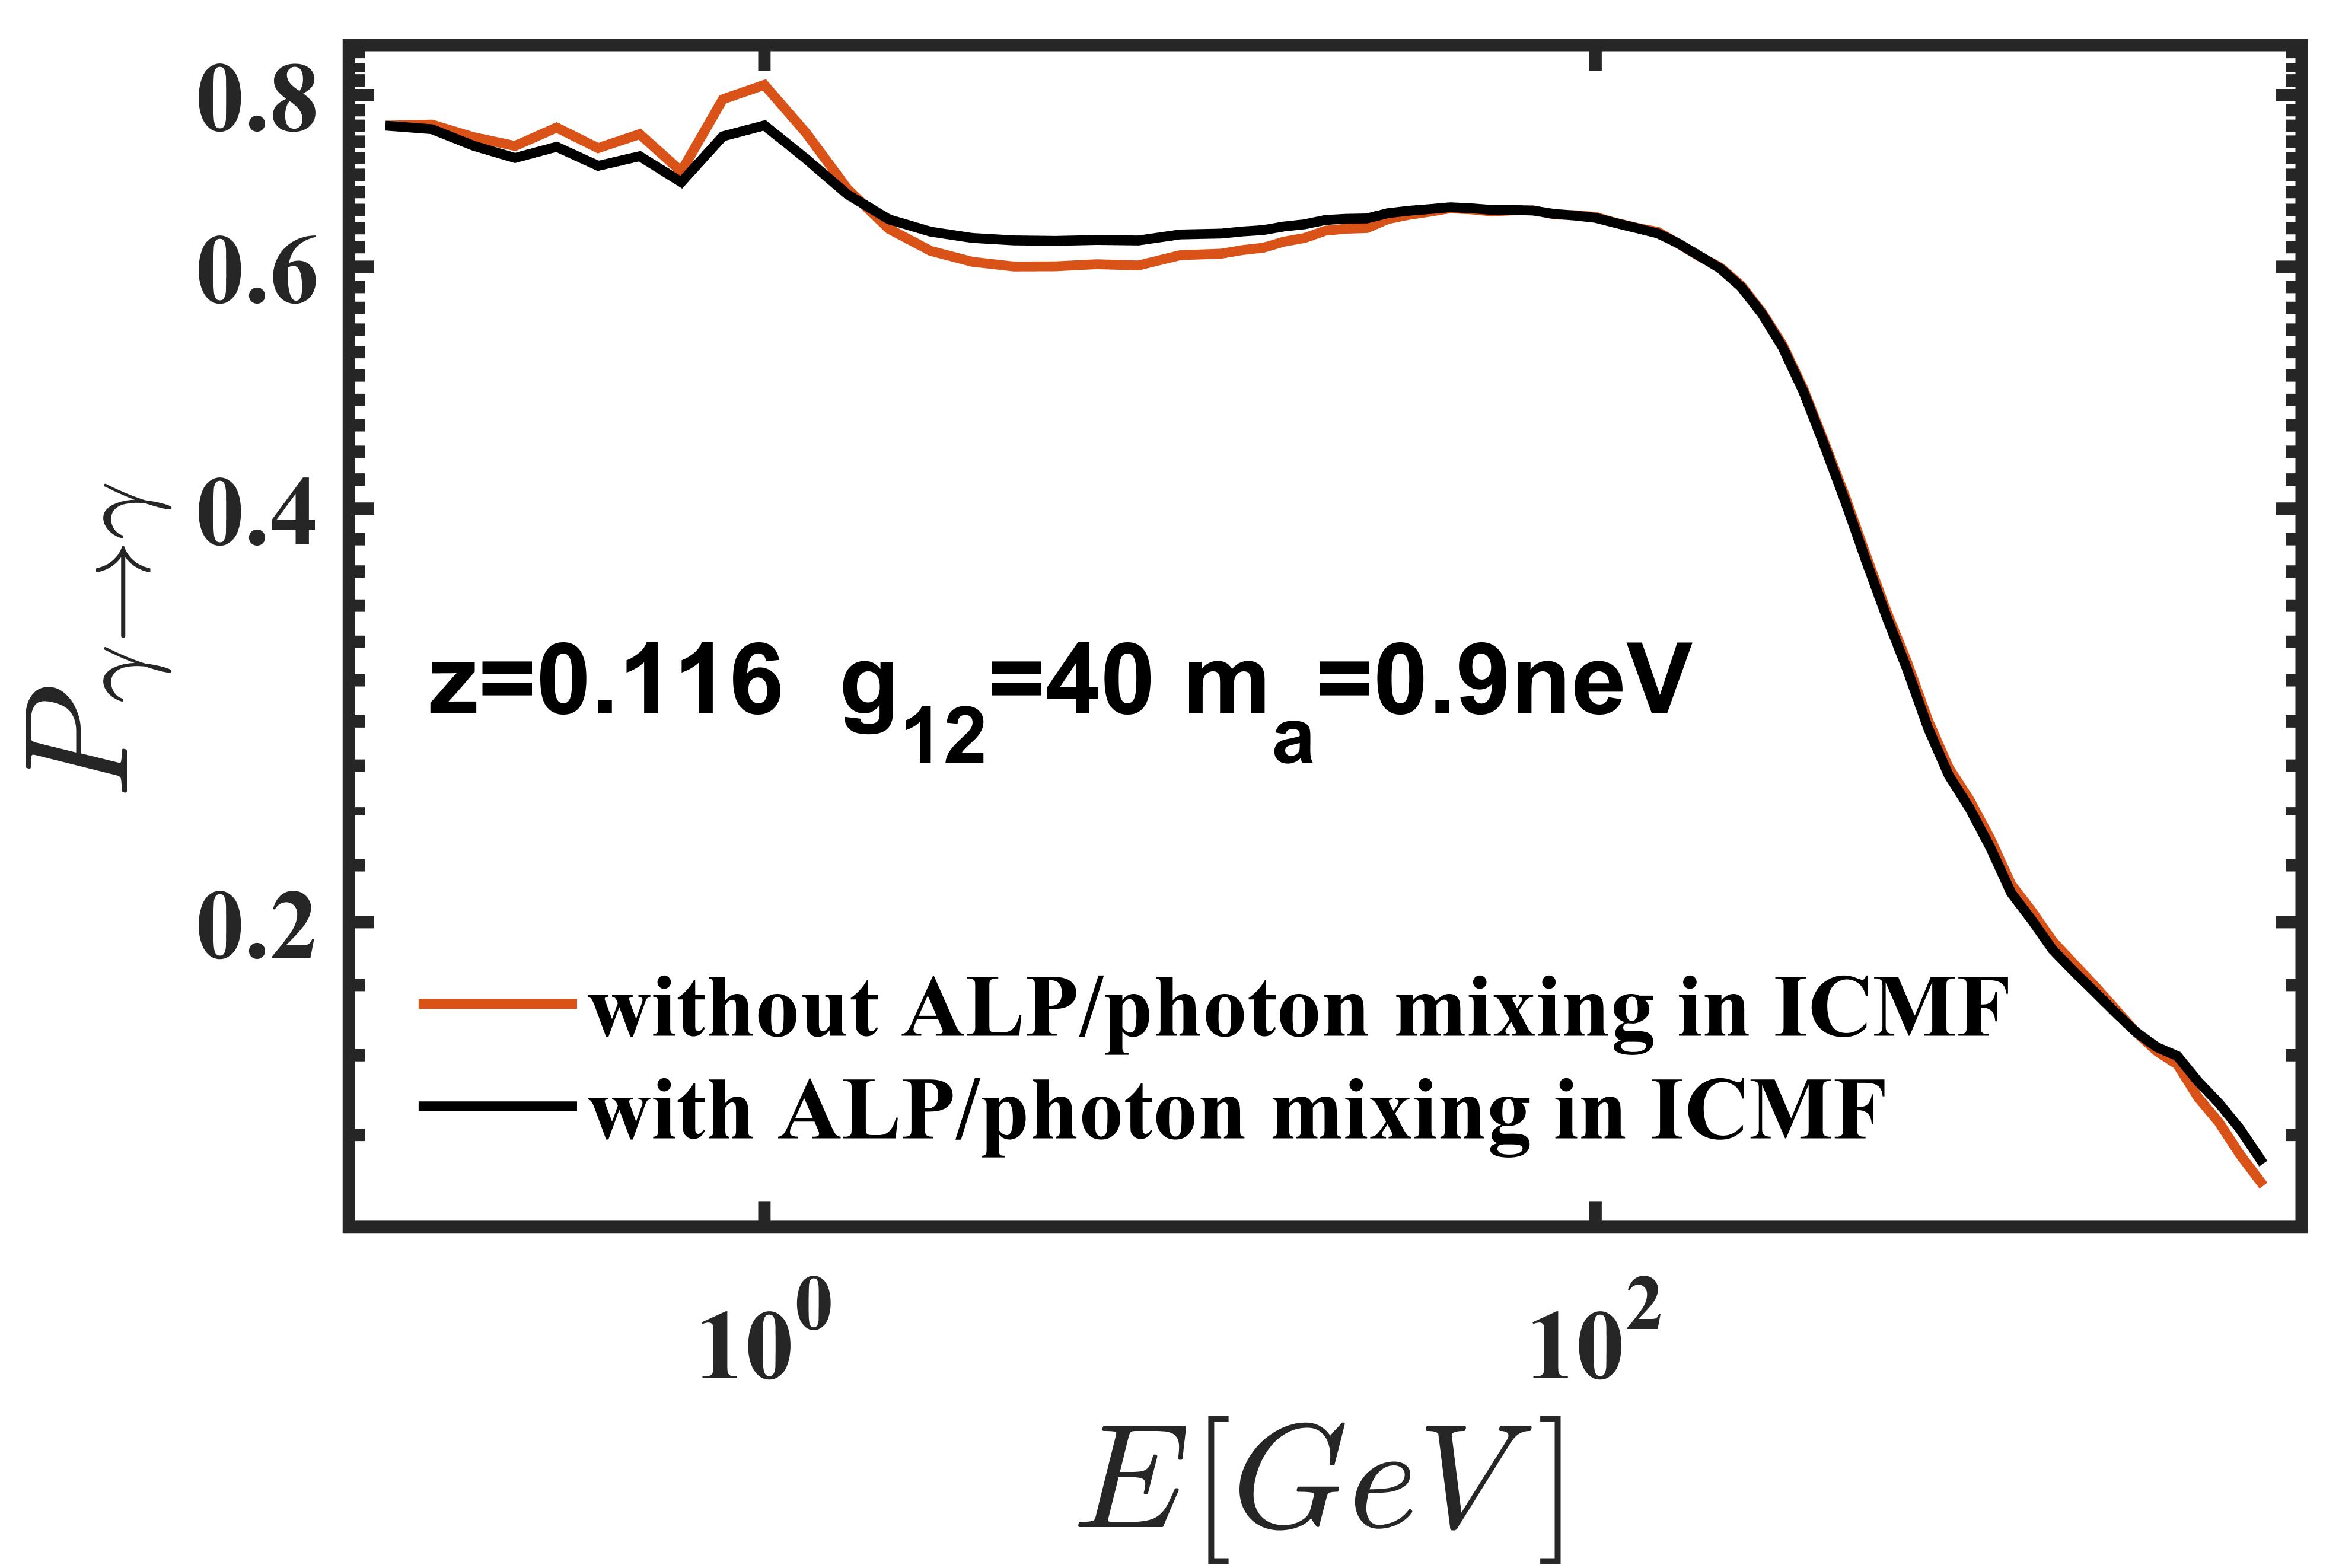
Though the source PKS 1424+240 in our sample may reside in an intermediate cluster Rovero2016 , its ICMF remains poorly known and the relevant parameters cannot be determined by insufficient information about the cluster environment. Therefore, the fiducial, corresponding to a small cluster, model parameters of Table 1 in Ref. Meyer2014 are adopted for all the sources in our sample except . Here, we self-consistently take kpc that is resulted from the calculation with the turbulence spectrum Meyer2014 . Then, the conversion probability is small and even negligible for . This can be roughly proved with Eq. 8. Since the radius kpc for a typical value, the average transversal components in the whole region is about G for G, and the coupling constants , these parameter values lead to . This can also be verified through numerical calculation and is shown in Fig. 3. The photons converted to the ALPs are less than 10% when , and the affection of ALP/phothon mixing in this region on the photon survival probability over the entire path is smaller. Even if considering the value of the most significant mixing probability , the deviation in caused by omitting the ALP/photon mixing in this region is less than 5% in VHE band. So in order to reduce the number of free parameters, we neglect the conversion in this region for .
IGMF—FMs of polarized extragalactic sources Blasi1999 and CMB observations Planck2016 give the lowest upper limits on IGMF on the largest cosmological scales Montanino2017 , i.e. the average field strength of the IGMF with a coherence length (1 Mpc) is (1 nG) Pshirkov2016 . According to Eq. 10 and the present constraints on the ALP-parameter space from other observations Montanino2017 , the conversion in the IGMF with a cell-like structure Angelis2013 is not important to reduce the cosmic opacity. However, a more realistic treatment for the IGMF have been proposed by Montanino et al. Montanino2017 , i.e., the IGMF is obtained from large-scale cosmological simulations produced with the MHD code ENZO Bryan2014 . Such simulated IGMF () would enhance to G in the large scale filaments of cosmic matter so that an efficient conversion could be achieved for ALP parameters that are not excluded by observations Montanino2017 .
In this work, we use this type simulated IGMF, and 98 column data of along the random line of sights up to z=1 are obtained from the web side of Vazza Vazzaweb . These line of sights are extracted from a (comoving) volume simulated with cells and dark matter particles (for a co-moving resolution of 83.3 kpc/cell). In their cosmological simulation, the magnetic field is initialized to =1 nG (comoving) at =50, and is assumed to be uniform in all directions. Thus, we treat the IGMF as a turbulent field as in “cell” model, but the size of each cell or domain equal to the simulation resolution of 83.3 kpc/cell.
We calculate the mean free path of -ray photon in the nth-cell by , where is the optical depth of Glmore EBL (see Fig. 1) and its combination with CIBER data (Fig. 1), respectively. We take the lower bound of the data with systematic error and one statistical error in each bin, see Fig. 1. Even so, this lowest IR intensity of CIBER measurements can be in tension with the constraints inferred by -ray observations Kori2017 . Fig. 2 show photon survival probabilities corresponding to the combined CIBER and Gilmore EBL(green curve), the Gilmore EBL (purple curve). The red-shift evolutions of the CIBER IR background due to evolutions of sources are calculated, assuming the evolution factor , with the method in Ref. Biteau2015 which is effective until . Note that the most high-red-shift source PKS1424+240 in our sample just has a red-shift .
The QED vacuum polarization terms and plasma effect terms are small compared to the other ones, hence they are not considered. At the highest energy band, the effect of CMB photon scattering is important Dobrynina2015 ; Montanino2017 and must be considered. We have 98 random magnetic field samples run along the line of sights extracted from large-scale cosmological simulation so that we can simulate 98 random realizations of the turbulent field.
The photon survival probability in this region is calculated after carrying out 98 Monte Carlo simulations, see Fig. 2, for =0.604. In order to obtain the total probability below, we need to calculate the probability the photon converse to the ALP with state , , and that ALP converse to ALP, , in advance.
GMF—We model the galactic magnetic field with the regular component of magnetic field presented by Jansson and Farrar Jansson2012 . The turbulent component is not considered here, as the typical coherence length is far smaller than the photon-ALP oscillation length. Neglecting the plasma effect, we calculate the photon survival probability under this magnetic-field structure. Fig. 2 shows the curve of for and the conversion is puny in this condition. For a significant conversion in this region, we could roughly constraint the coupling constant determined from , that is .
The photon survival probability on the whole path from the source to detector is
| (11) | ||||
where , , , , and . When neglecting the cluster mixing, we have .
Fig. 2 reveals the conversion in jet dominates at HE, whereas the conversion in jet and in extragalactic media together contributes to the total conversion at VHE for and . The critical energy of ALP/photon oscillation in jet is at HE due to the large GMF, whereas that in IGMF is at VHE. Thus the ALPs converted from photons at HE cannot convert back to photons so that abundant photons at HE lost, and the net effect is a hardening in the observed HE-VHE spectrum.
III.2 Conversion scenarios
Broadly speaking, two complementary ALP/photon conversion scenarios for enhancing transparency of the VHE universe have been proposed Troitsky2016 ; Horn2012 ; Montanino2017 : (a) photons convert to ALPs in the gamma-ray sources and then back-conversion happens in GMF, e.g. Ref. Simet2008 , (b) the photon/ALP oscillations take place in IGMF, e.g. Ref. Angelis2007 ; Angelis2013 . We will mainly investigate the photon/ALP oscillations which in turn take place in JMF, IGMF, and GMF along the way of the ALP/photon beam. In this scenario, the ALP mass is limited to for an efficient conversion with and in IGMF. We take the lower limit of as 0.1 neV, which is small enough and no essential effect would be on the conversion probability for smaller mass. Due to the observation constraints on the ALP parameter space Montanino2017 , the coupling constant is limited to for . Nevertheless, we consider the space of coupling constant , for which the conversion in ICMF can be neglected. This parameter space have not been excluded by CAST CAST2017 and can be probed by the future IAXO experiment.
For these ALP parameters, substantial photons at HE and VHE can convert to ALPs in JMF, and it always means a reduction of the photon flux, although a part of these ALPs may convert back to photons in IGMF or GMF. The photons or ALPs at HE can reach MW galaxy almost without converting or damping in IGMF. Whereas the photons or ALPs above the critical energy (500 GeV) would mix or be damped due to the conducing reaction during the propagation in IGMF: , , , , or , , , , . We can show that the probability is sensitive to the coupling constant and the distance of propagation. When is not large enough (e.g., , z0.3), increases with . But when is large enough, stays the same (saturation) or decreases. This is because the process of becomes more and more important as the get larger, and the process of would become significant when is large enough. The case for is similar, namely that increases with and then becomes stable when gets large enough due to the transition of the dominant process from and to .
If the conversion in GMF is insignificant, while, for , the VHE ALP/photon oscillation in IGMF reach or is close to saturation after a distant propagation (e.g., ) so that the conversion for VHE photons in GMF is subordinate to that in IGMF. Therefore, for a rough estimate we neglect the conversion in the GMF and the survival probability for VHE photons could be simplified as
| (12) |
The variation of function at VHE is dominated by and , since the conversion in JMF is always sufficient and is relatively stable. Therefore, increases with and then reach an extremum when is large enough. For a higher z and considered, the corresponding to the extremum may be required to be lower. Moreover, for our samples with z, we could take most of the larger values of (the values of for ) although we consider only the ALP parameters space .
In a word, a part of emitted -rays photons convert to ALPs in JMF and then only some of these ALPs at HE convert back to photons in GMF; whereas the ALP/photon above the critical energy (500 GeV) could continue to oscillate in IGMF, where the processes of and could allow the original TeV photon to escape absorption by the EBL, so that the photon flux observed toward the highest energy could be enhanced relative to that without ALP. This mechanism could shape a harder spectra. This conversion pattern is similar to the conversion scenario (b).
We consider the complementary conversion scenario (a) now. If we consider larger ALP-parameter values rather than limiting to the region , e.g., allowing and , the conversion for TeV photons taking place in the source and in the Milky Way would be dominant due to inefficient oscillations in intergalactic space (the critical energy is too high). Furthermore, the resultant simulated IGMF could be weaker if the magnetic field is initialized to nG at =50 in the large-scale cosmological simulations Vazza2017 . In this case, the conversion pattern (a) could be dominant although the coupling constant reaches down to for and nG. This scenario with a negligible conversion in IGMF will be discussed in Sec. V.
IV analyzing the Fermi-LAT and IACTS data
We build four absorption models about the total photon survival probability from the source to the earth. (i) it only involves Gilmore EBL (refer to as GEBL model below); (ii) it includes Gilmore EBL combined with CIBER “excess” (refer to GC model below); (iii) it includes Gilmore EBL with/without CIBER “excess”, taking into account the ALP/photon oscillation (refer to GCA/GA model below). Each of the four models together with an assumed-intrinsic spectrum will be used to fit 13 observed BL Lac objects (BL Lacs) spectra at high energy (100 MeV E 300 GeV, HE) and VHE. In order to test CIBER EBL and ALP, we need to compare the goodness-of-fit of four theoretical spectra based on the four absorption models.
| Source | Redshift | Experiment(VHE Obs. Period) | Energy(GeV) | lon/lat | function |
|---|---|---|---|---|---|
| PKS 2155-304 | 0.116 | Fermi-LAT+HESS(2008) HESS215509 | 0.28-3340 | 17.7/-52.3 | LP |
| PKS 2155-304 | 0.116 | Fermi-LAT+HESS(2013) Sanchez2015 | 0.15-3180 | 17.7/-52.3 | LP |
| 1ES 0229+200 | 0.14 | Fermi-LAT+HESS(2005-2006) Vovk2012 ; HESS2007 | 8.59-11500 | 153.0/-36.6 | LP |
| 1ES 0229+200 | 0.14 | Fermi-LAT+VERITAS(2009-2012) Vovk2012 ; VERITAS2014 | 8.59-7640 | 153.0/-36.6 | PL111For some ALP parameter values in the GCA model and all parameter values in the GA model, the best-fitting function is LP in the models with ALP. It is worth emphasizing that for the best-fitting ALP values (=0.1 neV and =4.9) of the global fit of all the spectra in the GCA model the chosen function is PL. |
| 1ES 1218+304 | 0.182 | Fermi-LAT+VERITAS(2008-2009) Taylor2011 ; VERITAS1218 | 0.67-1870 | 186.2/-82.7 | PLC |
| 1ES 1101-232 | 0.186 | Fermi-LAT+HESS(2004-2005)Belikov2011 ; Aharonian2007 | 1.62-2940 | 273.2/33.1 | PL |
| 1ES 0347-121 | 0.188 | Fermi-LAT+HESS(2006) Tanaka2014 ; HESS0347 | 1.69-2910 | 201.9/-45.7 | PL |
| 1ES 1011+496 | 0.212 | MAGIC(2014) MAGIC2016 | 79.4-3060 | 165.5/52.7 | PLC |
| 1ES 0414+009 | 0.287 | Fermi-LAT+HESS(2005-2009) HESS0414 | 0.17-1120 | 191.8/-33.2 | PL |
| OT081 | 0.322 | Fermi-LAT+HESS(2016) Schussler2017 | 0.17-1020 | 34.9/17.7 | LP |
| PKS 0477-439 | 0.343? | Fermi-LAT+HESS(2009-2010) Fermi2010 | 0.17-2444 | 248.8/-39.9 | LP |
| PKS 1424+240 | 0.604 | Fermi-LAT+VERITAS(2009) VERITAS2014a | 0.185-515 | 29.5/68.2 | LP |
| PKS 1424+240 | 0.604 | Fermi-LAT+VERITAS(2013) VERITAS2014 | 0.241-530 | 29.5/68.2 | LP |
IV.1 Spectra selection
Blazars are a subclass of active galactic nuclei (AGN) and their jet are directed toward us. When the broad emission lines in their optical spectra is weak, this blazar is called a BL Lac object, i.e., Urry1995 . BL Lacs has a broad-band spectral energy distribution (SED) and are the dominant extragalactic TeV sources. So far about 57 TeV BL Lacs have been detected by IACTs TeVCat . In this study, we only consider the BL Lac spectra that satisfy the following criteria: 1. the highest energy beyond 800 GeV after the redshift correction; 2. the redshift of sources is relatively certain and larger than 0.1. 3. the observations at HE and VHE are simultaneous, or the source did not exhibit obvious variability in the -ray regime. 4. have at least 2 data points at HE and 5 at VHE.
Thirteen spectral measurements of 10 BL Lacs are chosen, which are widely distributed on a redshift scale of 0.1 to 0.61. Except for 1ES1011+496, all spectra combine the Fermi-LAT data at HE and the IACTs data at VHE. The data quality is high for 1ES1011+496 as the data at HE-VHE band is only from MAGIC. Given its high redshift and have sufficient spectral measurements around TeV, PKS 0477-439 is chosen despite the fact that its redshift is not completely certain (z=0.343, 97%) Muriel2015 . 1ES 0229+200, 1ES 1101-232, 1ES 0347-121 and PKS 1424+240, may be hard spectrum sources with an intrinsic photon index HESS2007 ; Aharonian2007 ; HESS0347121 ; Furniss2013 . PKS 1424+240 is one of the most distant currently known VHE -ray emitter and its red-shift was confirmed in 2017 Paiano2017 . In Table 1, we summarize the spectra including references. Except for 1ES 1101-232(2004) and 1ES 0229+200(2005), the Fermi-LAT data and IACTs data in each spectrum were measured (quasi) contemporaneously. We note that no significant variation of the VHE -ray flux was found in 1ES 0229+200 during its observed period of 2004 and in 1ES 1101-232(2005) HESS2007 ; Aharonian2007 .
IV.2 Intrinsic spectra and method
Functions for the intrinsic spectrum—There are usually three functions used to fit intrinsic spectrum of blazar: power-law (PL), log-parabola (LP), and power-law with exponential cut-off (PLC). The two-parameter PL spectrum where is the photon spectral index and it is constrained by the particle acceleration theory to , is the flux normalization, and is the reference energy. The LP spectrum have a nonzero spectral curvature with the additional curvature parameter , and also . We describe the PLC spectrum with 3 free parameters , where is the cut-off energy. The theoretical observed spectra are predicted by functions of photon survival probability and the intrinsic spectra
| (13) |
where =exp denotes photon survival probability only under the absorption of the Gilmore EBL, =exp presents the absorption of the combined Gilmre and CIBER EBL, and is equal to with/without CIBER EBL. X represents PL, LP or PLC. The model with ALP have two additional free parameter, i.e., and , relative to the other two models.
Fitting—For any given observed spectrum (HE+VHE) and absorption model, e.g. for PKS 1424+240(2009) and with given and , we need to try fitting the observed spectrum with the three theoretical spectra respectively, and the function , e.g. , will be chosen among the four functions when its theoretical spectrum, e.g. , achieves the best fit (according to average chi-square value per degree of freedom) HESS2013 ; Biteau2015 .
We perform a fit to the observed spectra with the four theoretical spectra respectively, minimizing the function which allows to quantify the goodness of fit and obtaining the best-fitting parameters including those of the intrinsic spectra and the ALP parameters in the GCA/GA model. In this process, the ALP parameters for every spectrum-fitting are in common and in the parameter region . It can be probed by the planed IAXO experiment and the part of is outside the excluded region constrained by gamma-ray observations (SN1987A and Fermi/LAT NGC1275).
Hypotheses test and significance level—In order to compare the fitting results from four different models and find the best model, we built the following hypotheses:
-
(i)
: the CIB is entirely explained by the Gilmore EBL model and fit with function .
-
(ii)
: the excess CIBER EBL is a new EBL component and no-ALP fit with function .
-
(iii)
: the excess CIBER EBL is/isn’t a new EBL component and ALP exist, fit with functions .
Beside testing vs and , we will also test vs to study the effect of ALP/photon coupling. Firstly, we test the hypotheses by comparing the statistic of minimum among different models. If the statistic of alternative hypotheses is smaller, then we will construct F-test statistic to calculate the significance level of rejecting null hypotheses, that is:
| (14) |
where denote the sample size, and are the number of freedom parameters for the null hypothesis and alternative hypothesis respectively. This statistic follows the -distribution with degrees of freedom in the denominator and degrees of freedom for the summed chi-squares in the nominator Majumdar2018 .
The procedure we perform for the conversion scenario a) with negligible oscillation in IGMF will be presented in the subsection D of Sec. V.
V Tesults and discussion
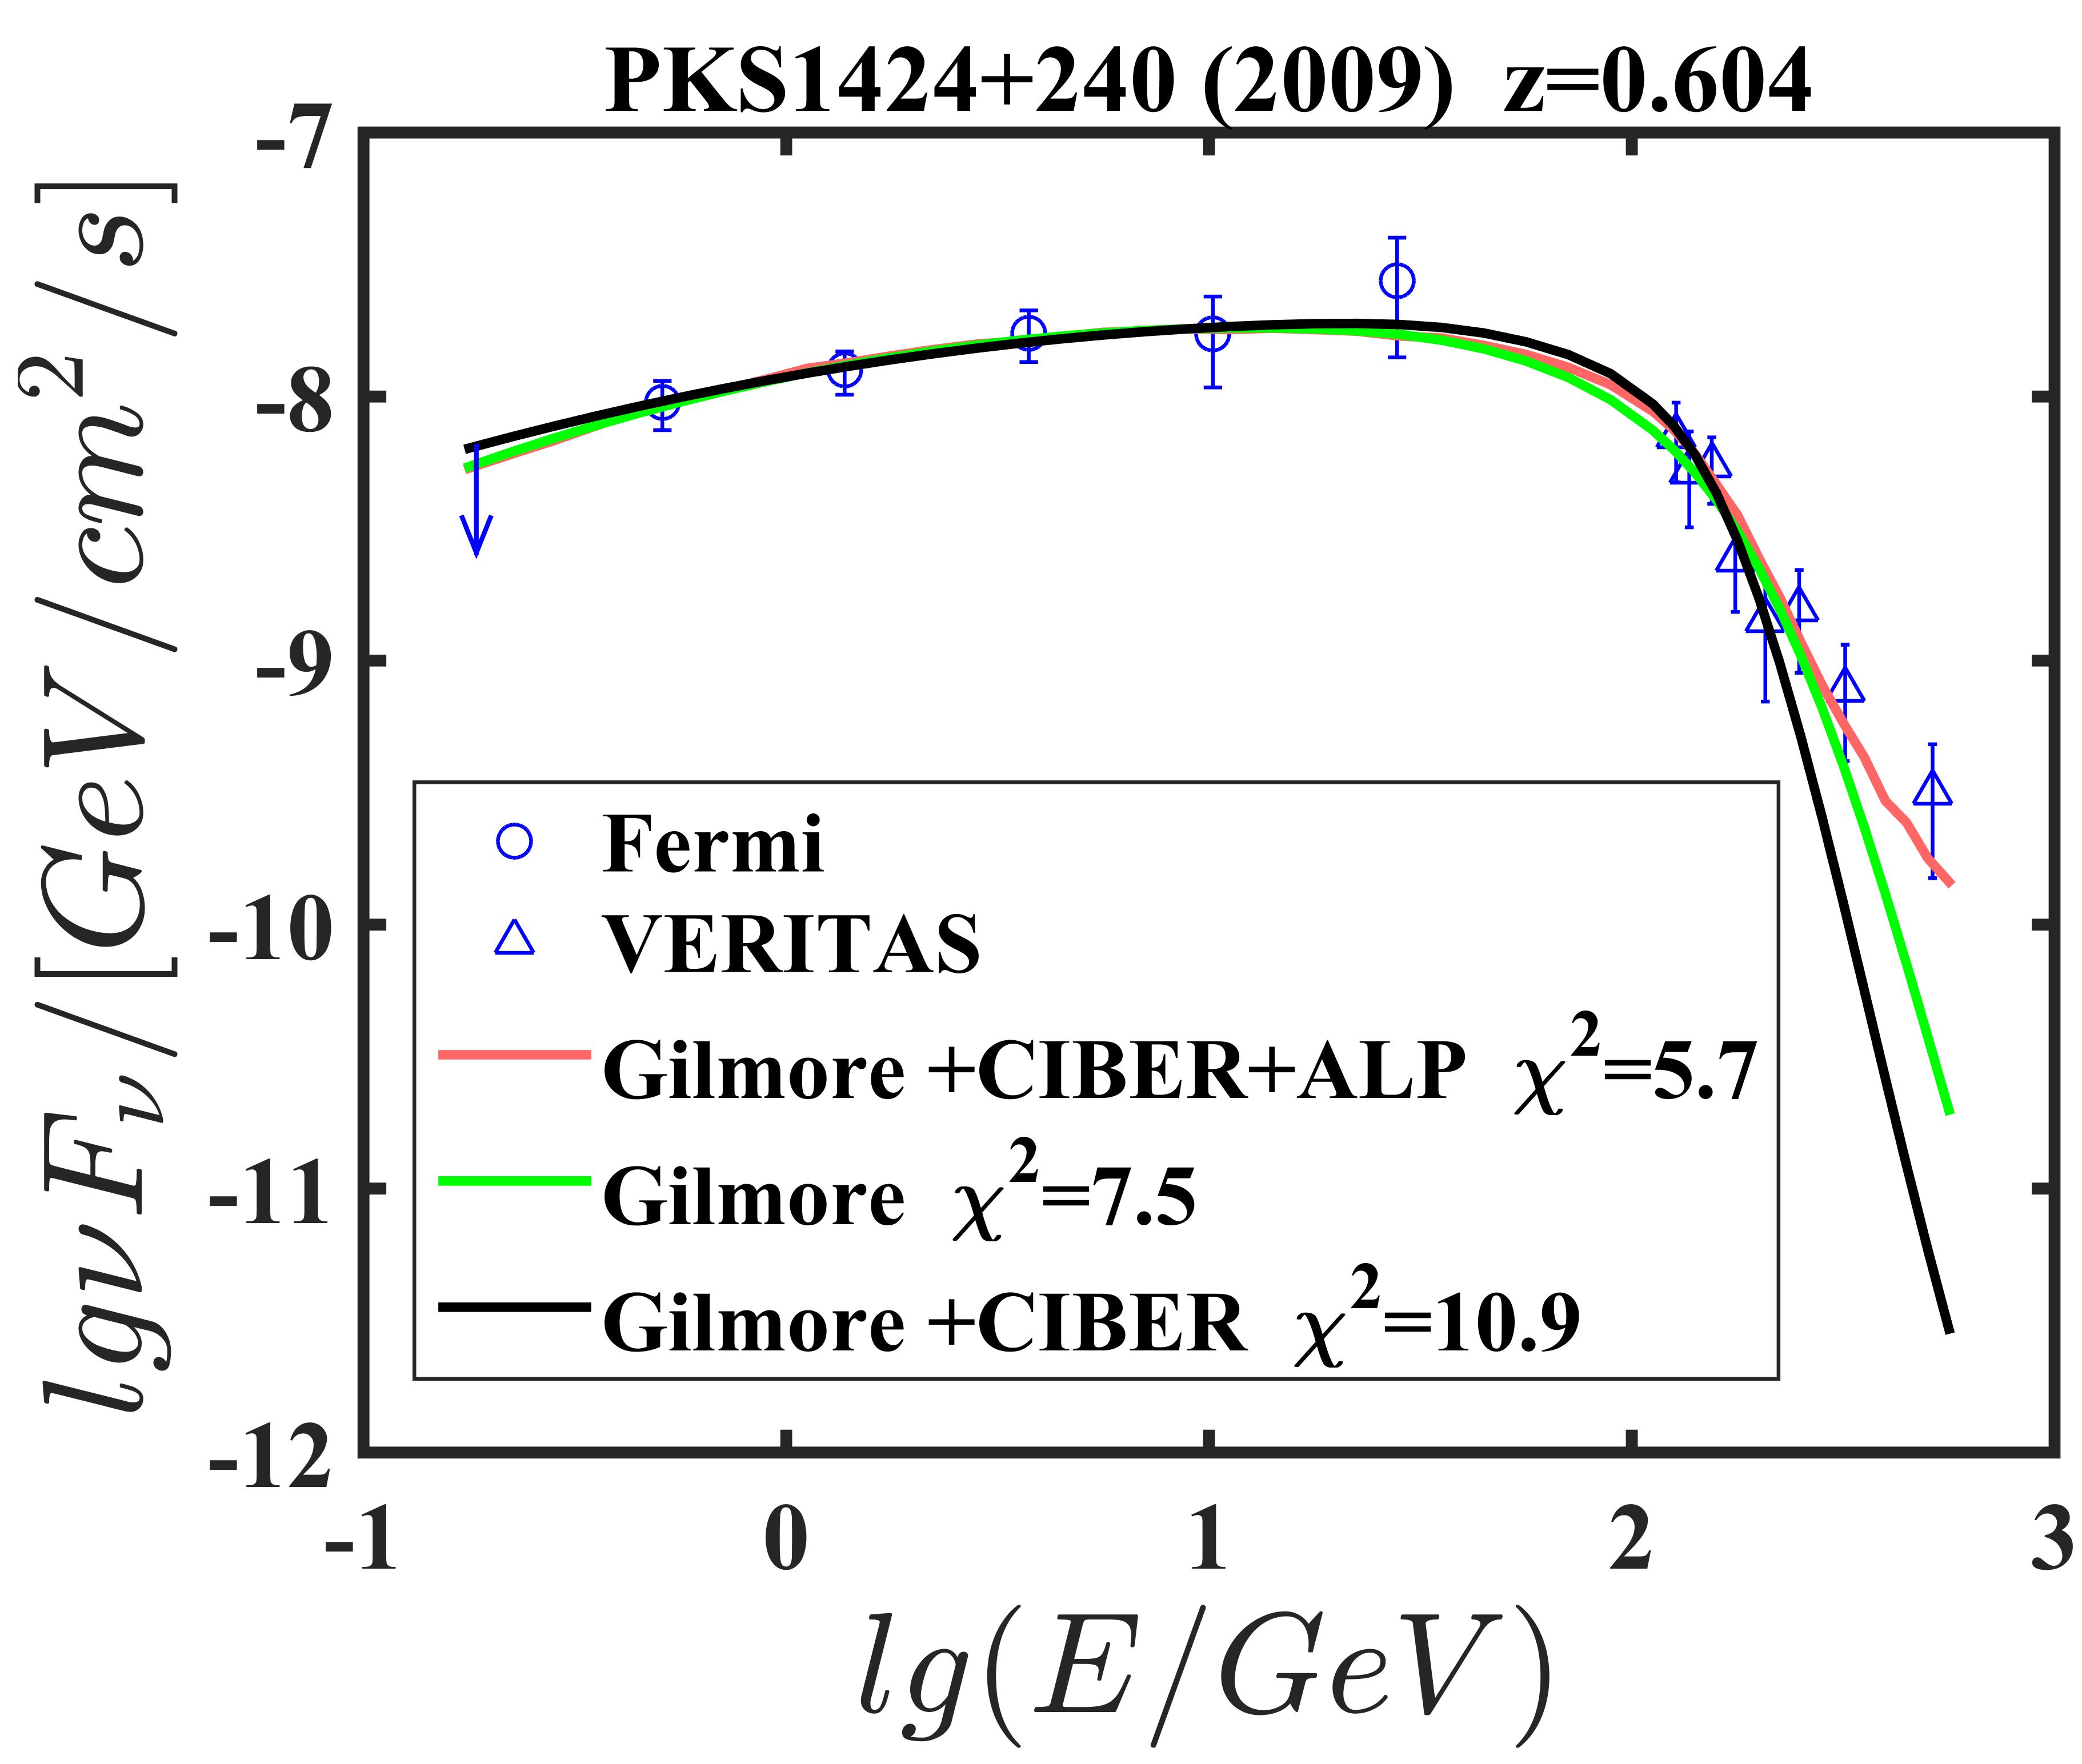
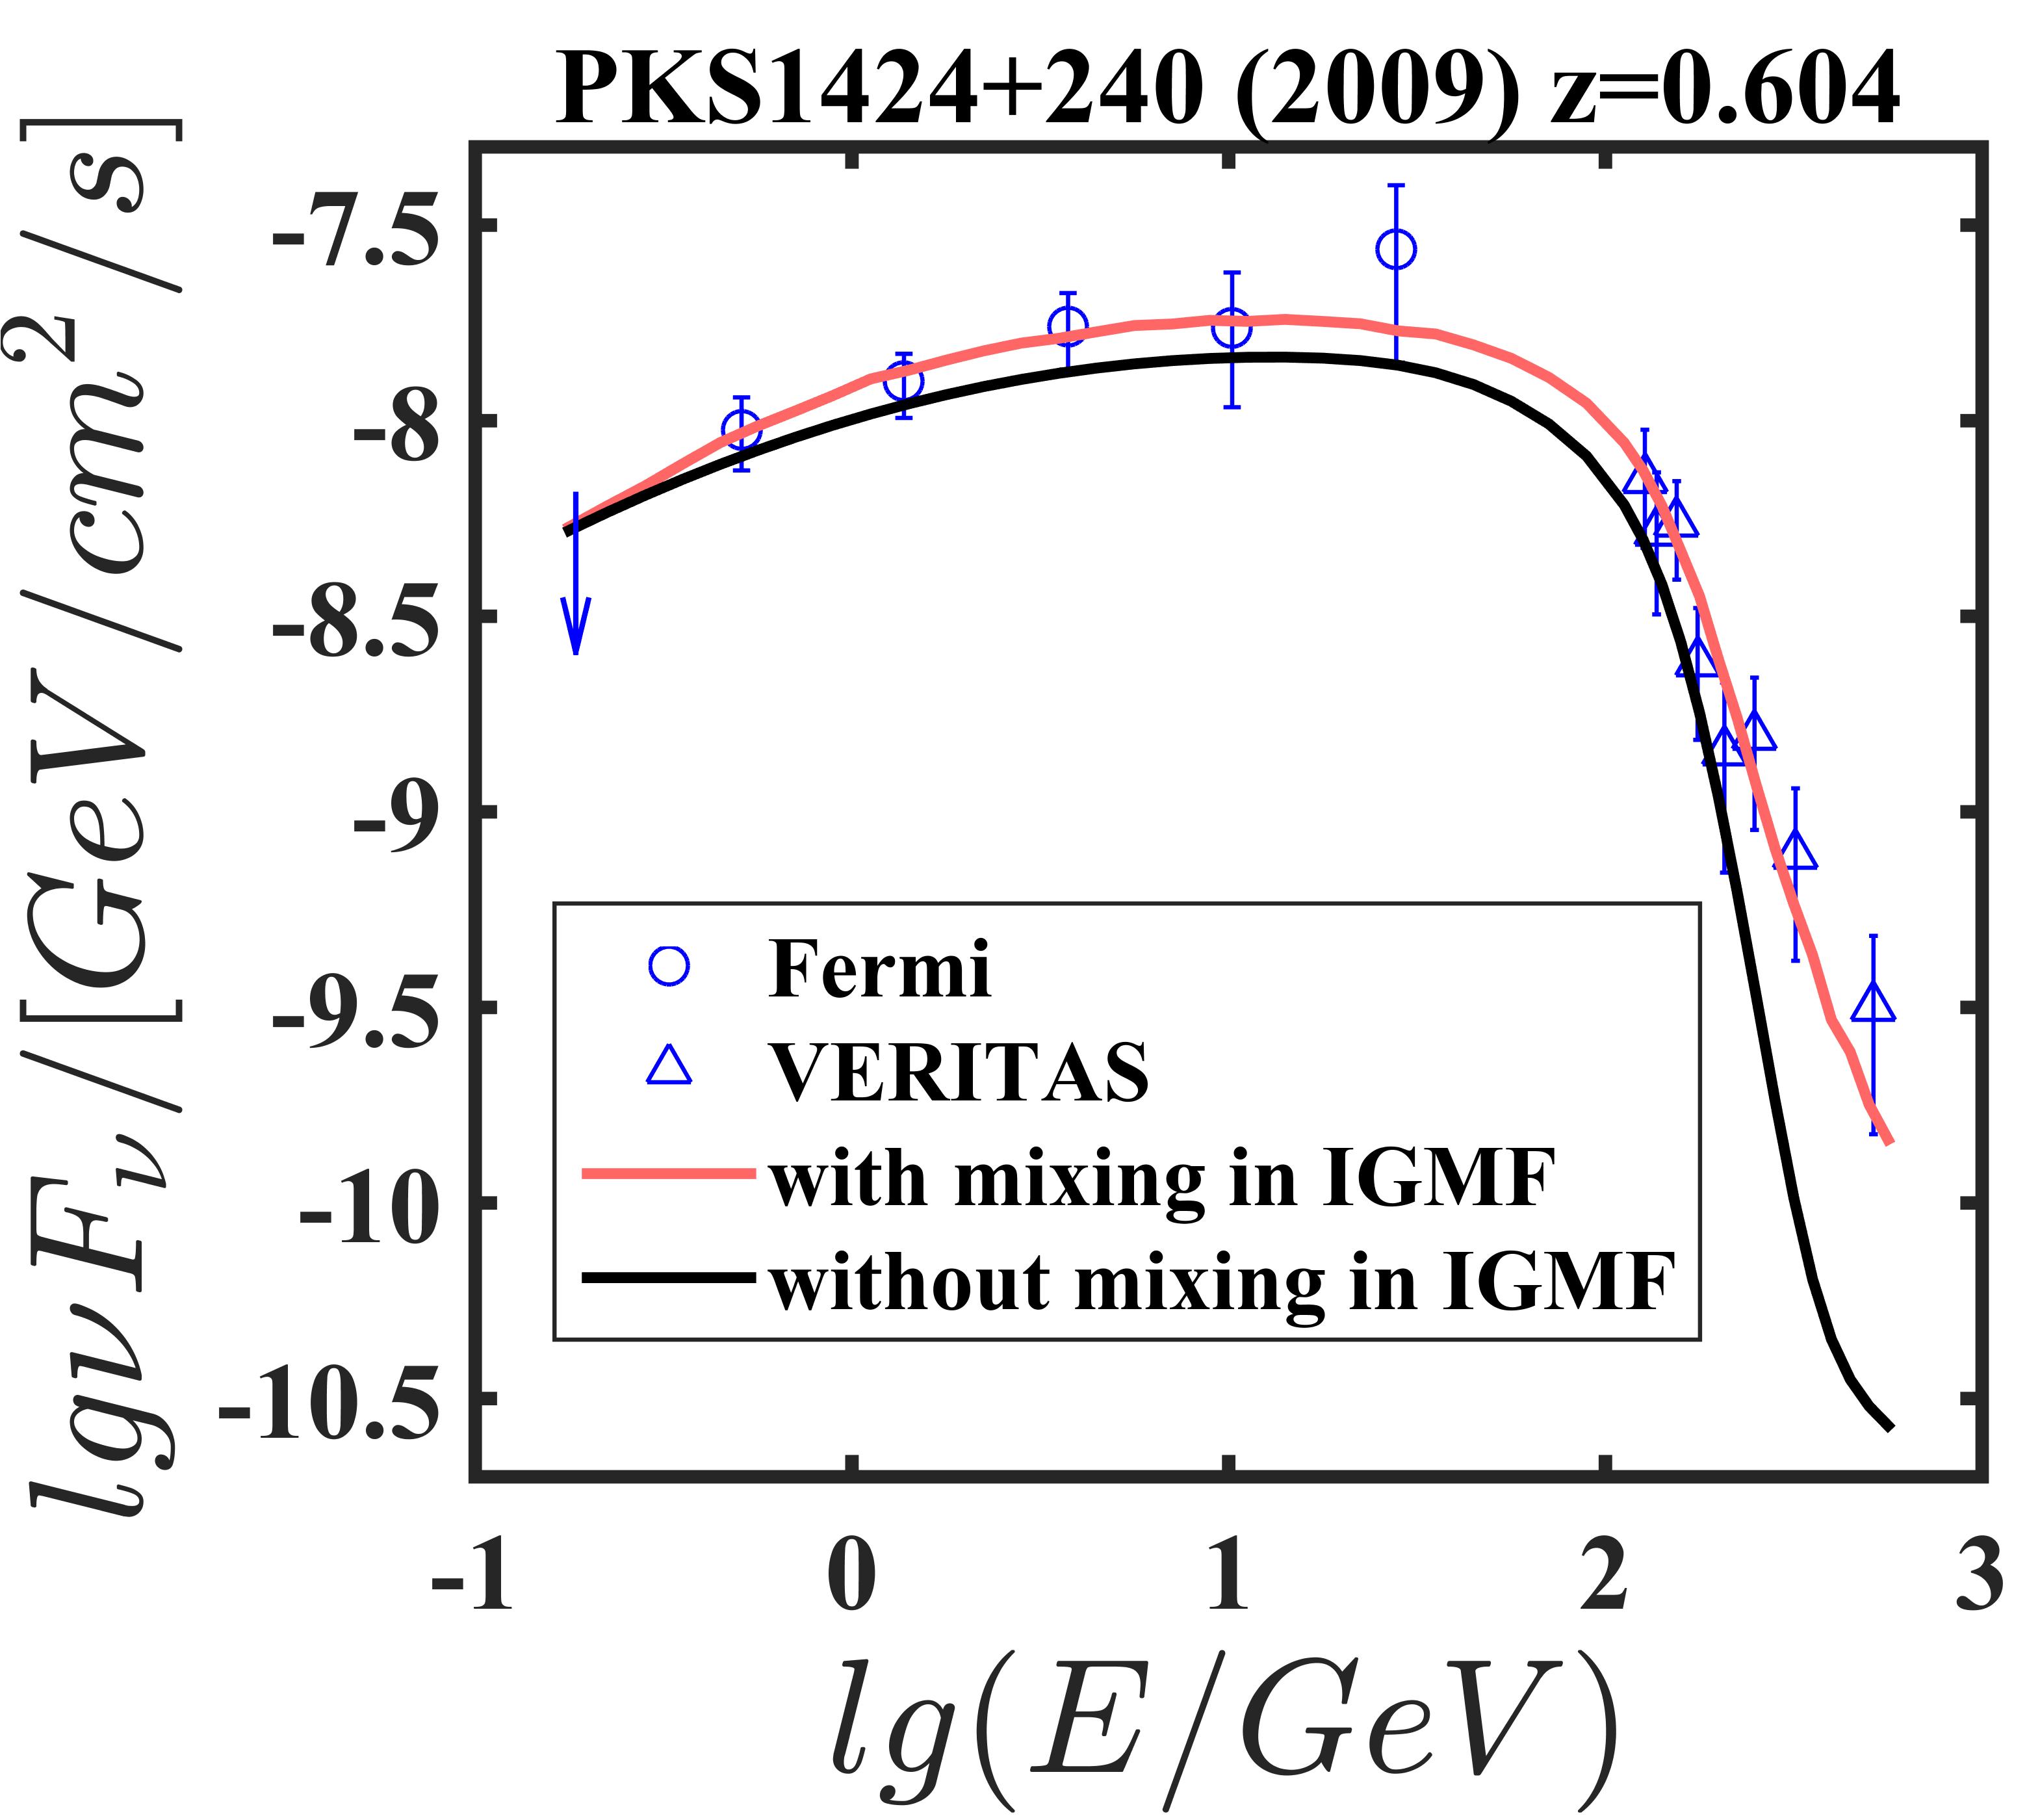
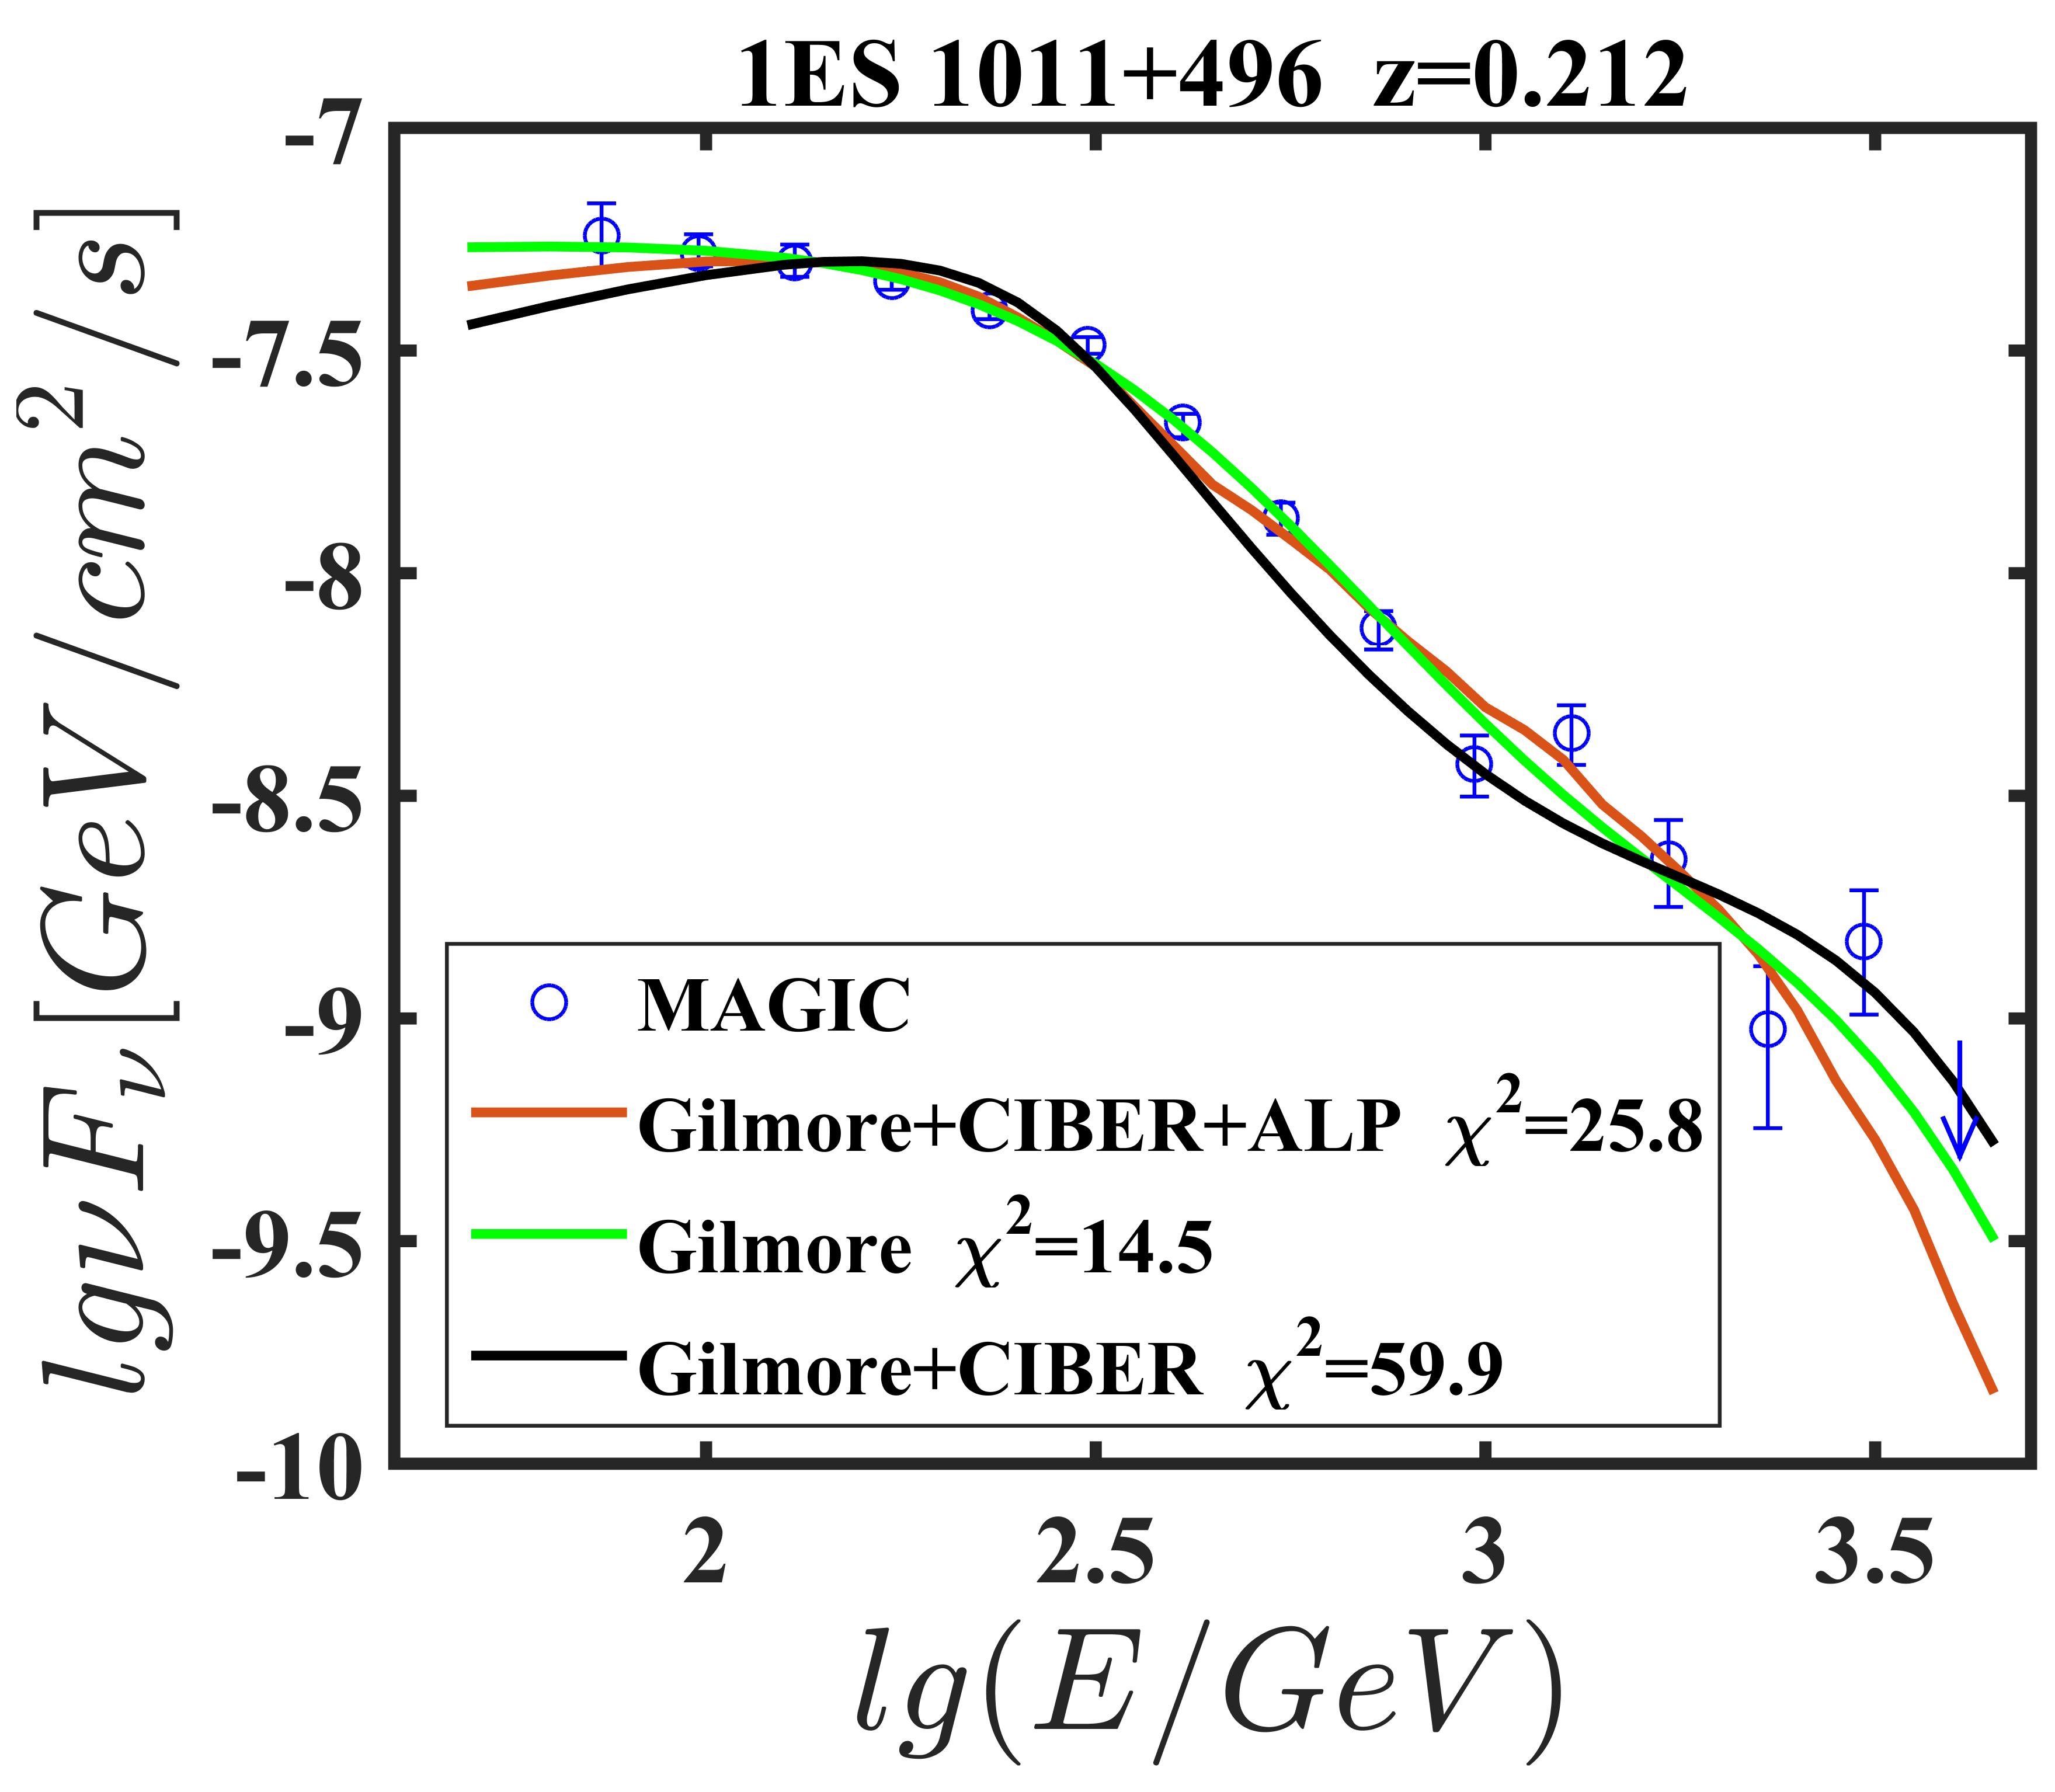
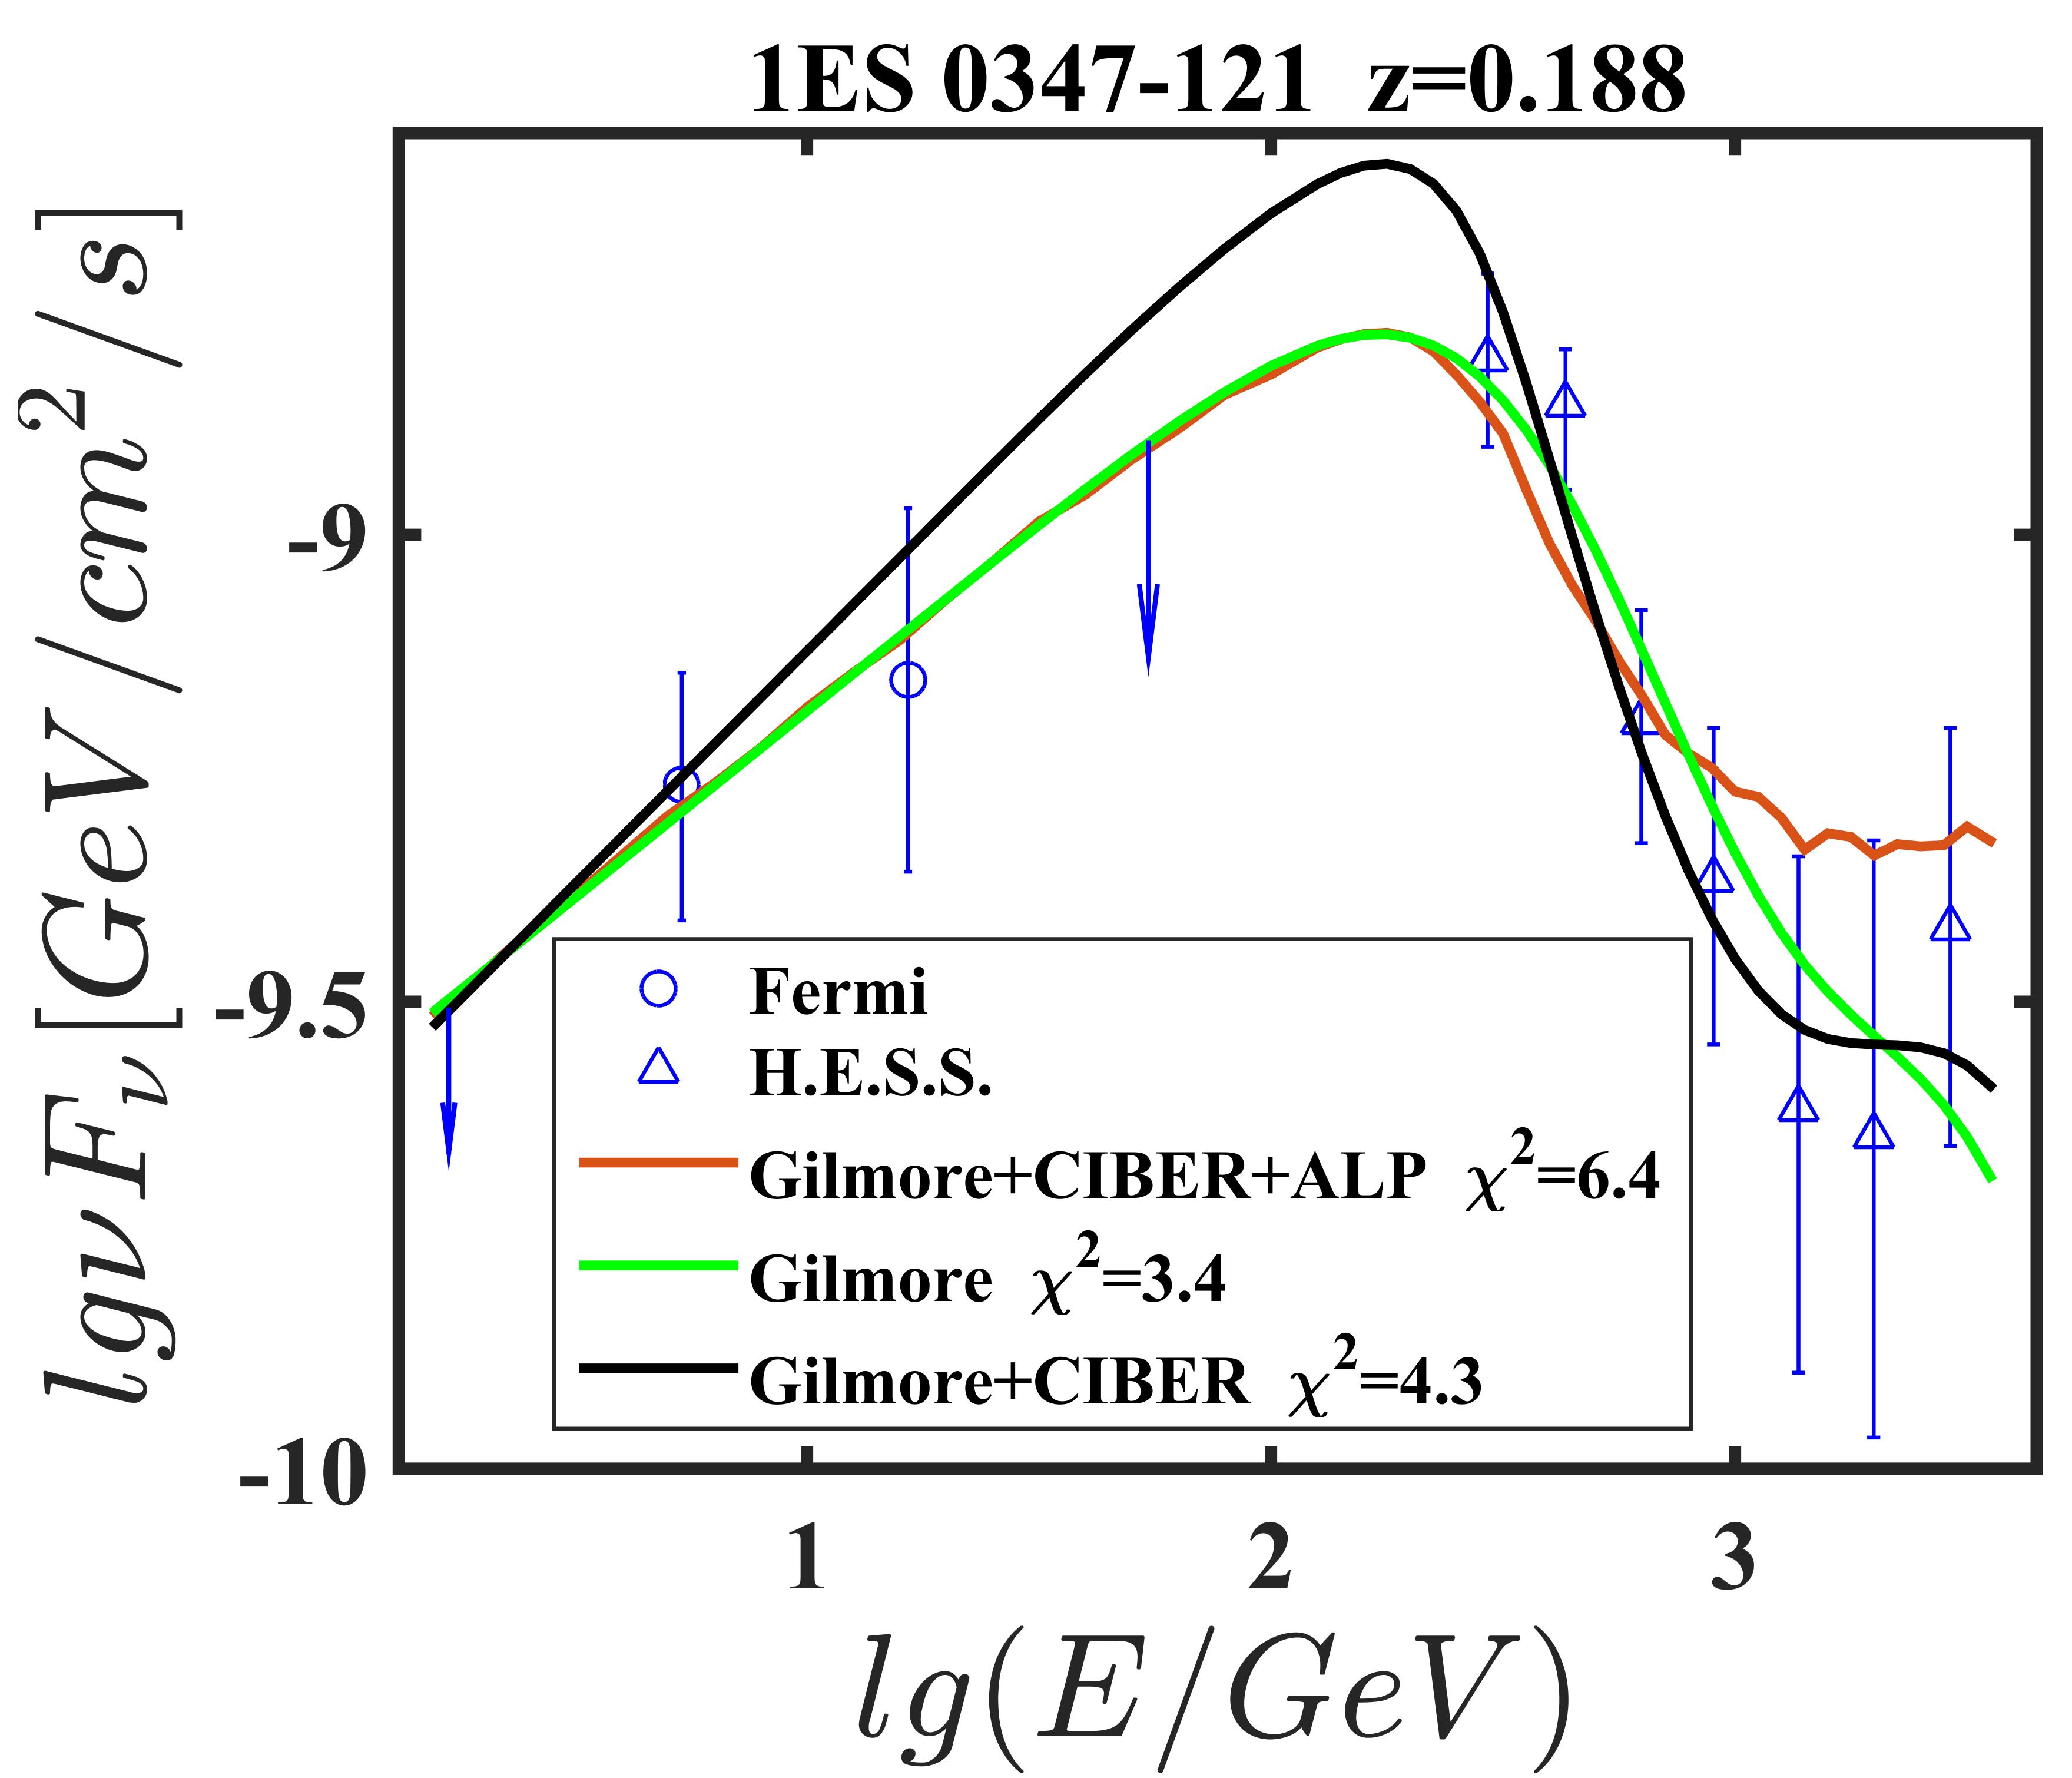
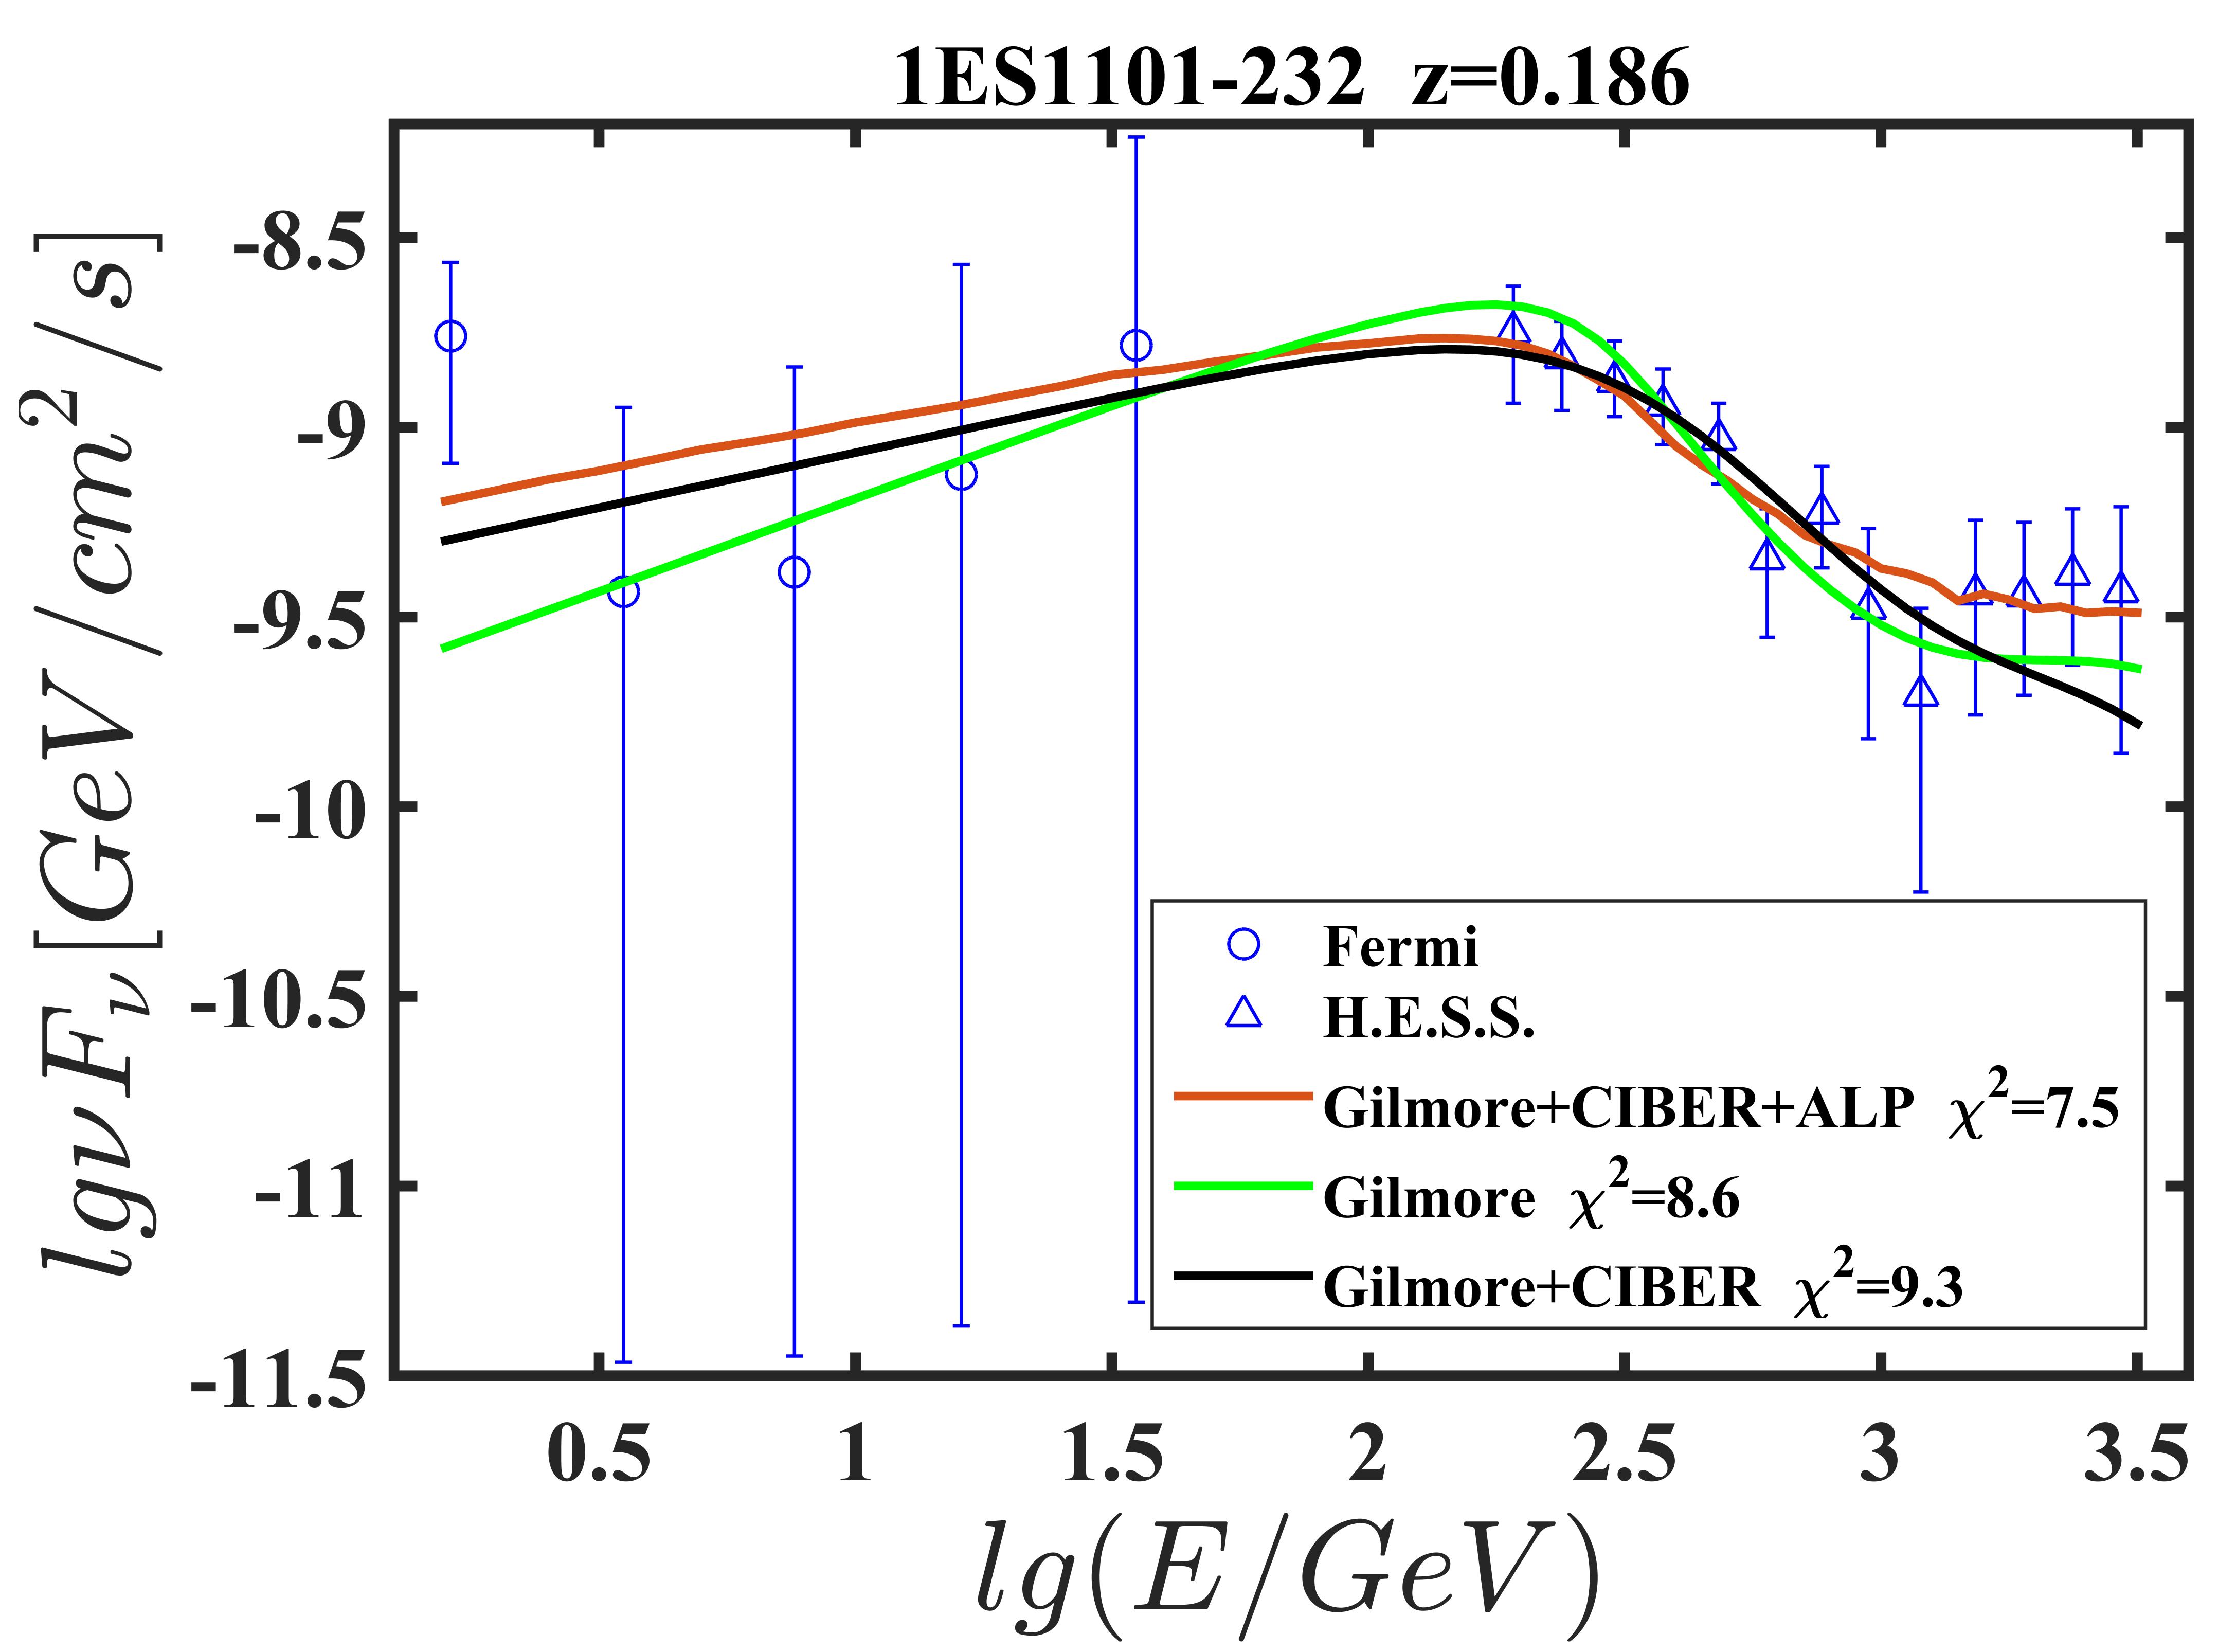
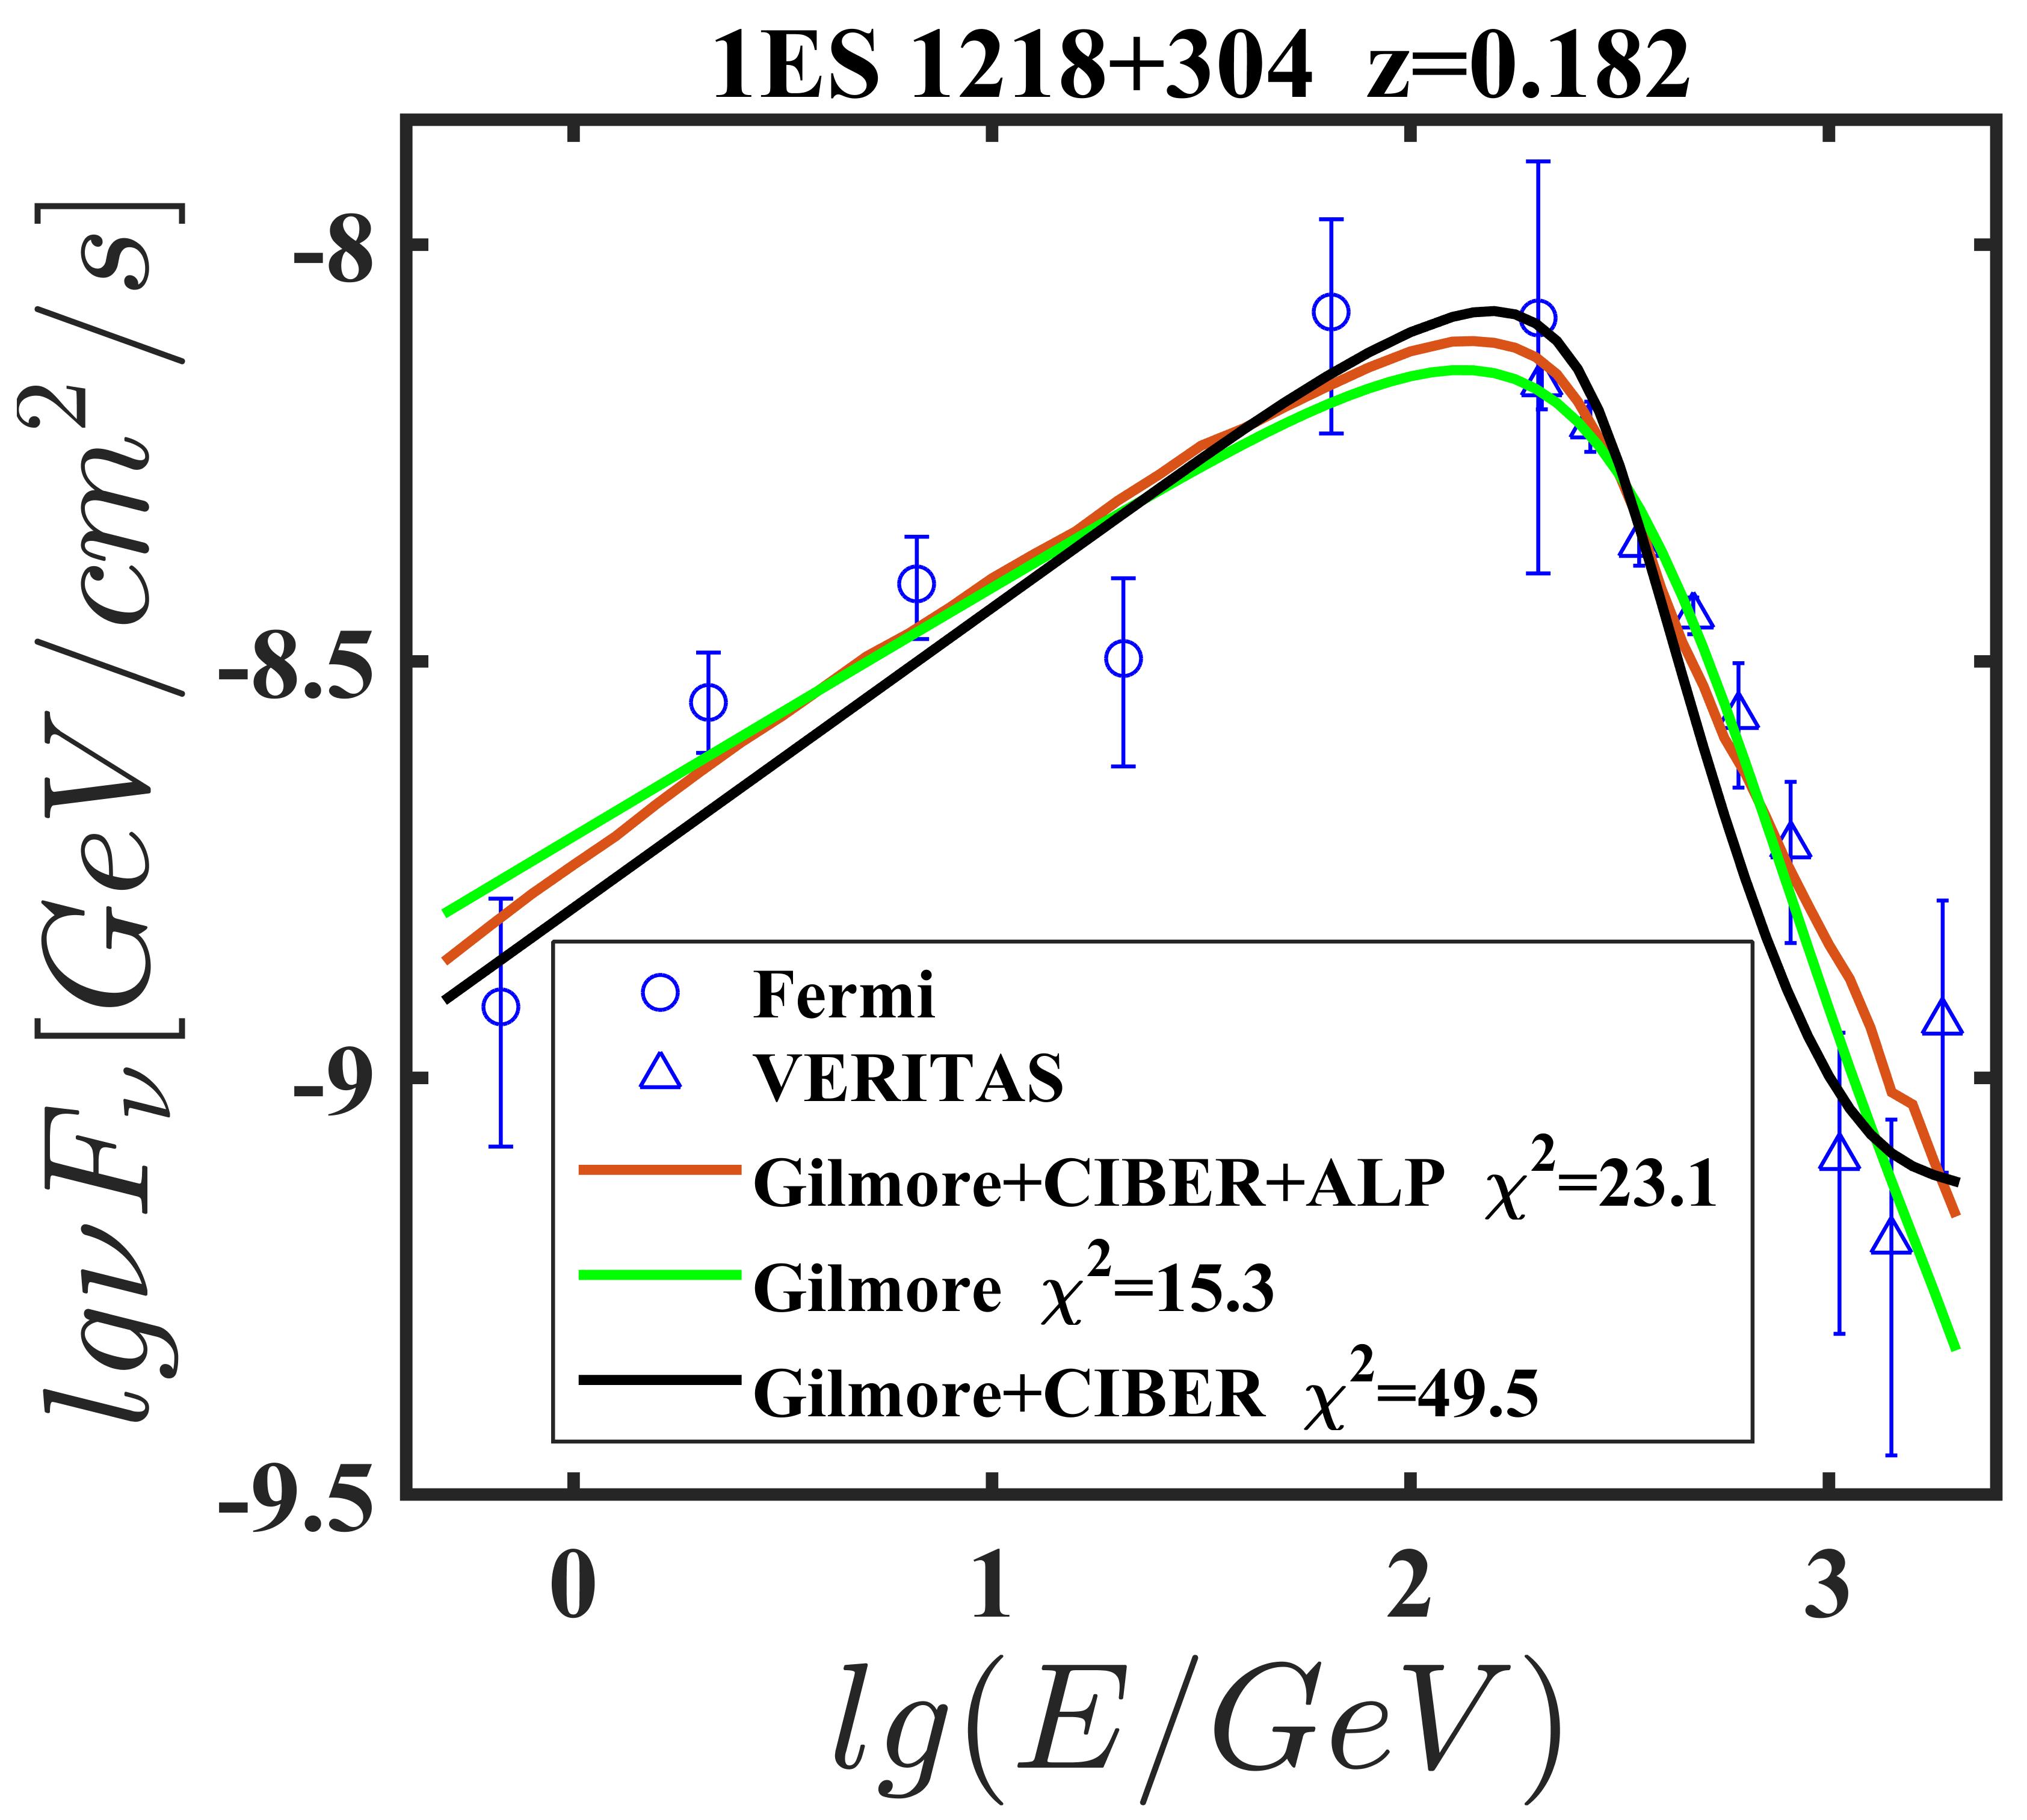
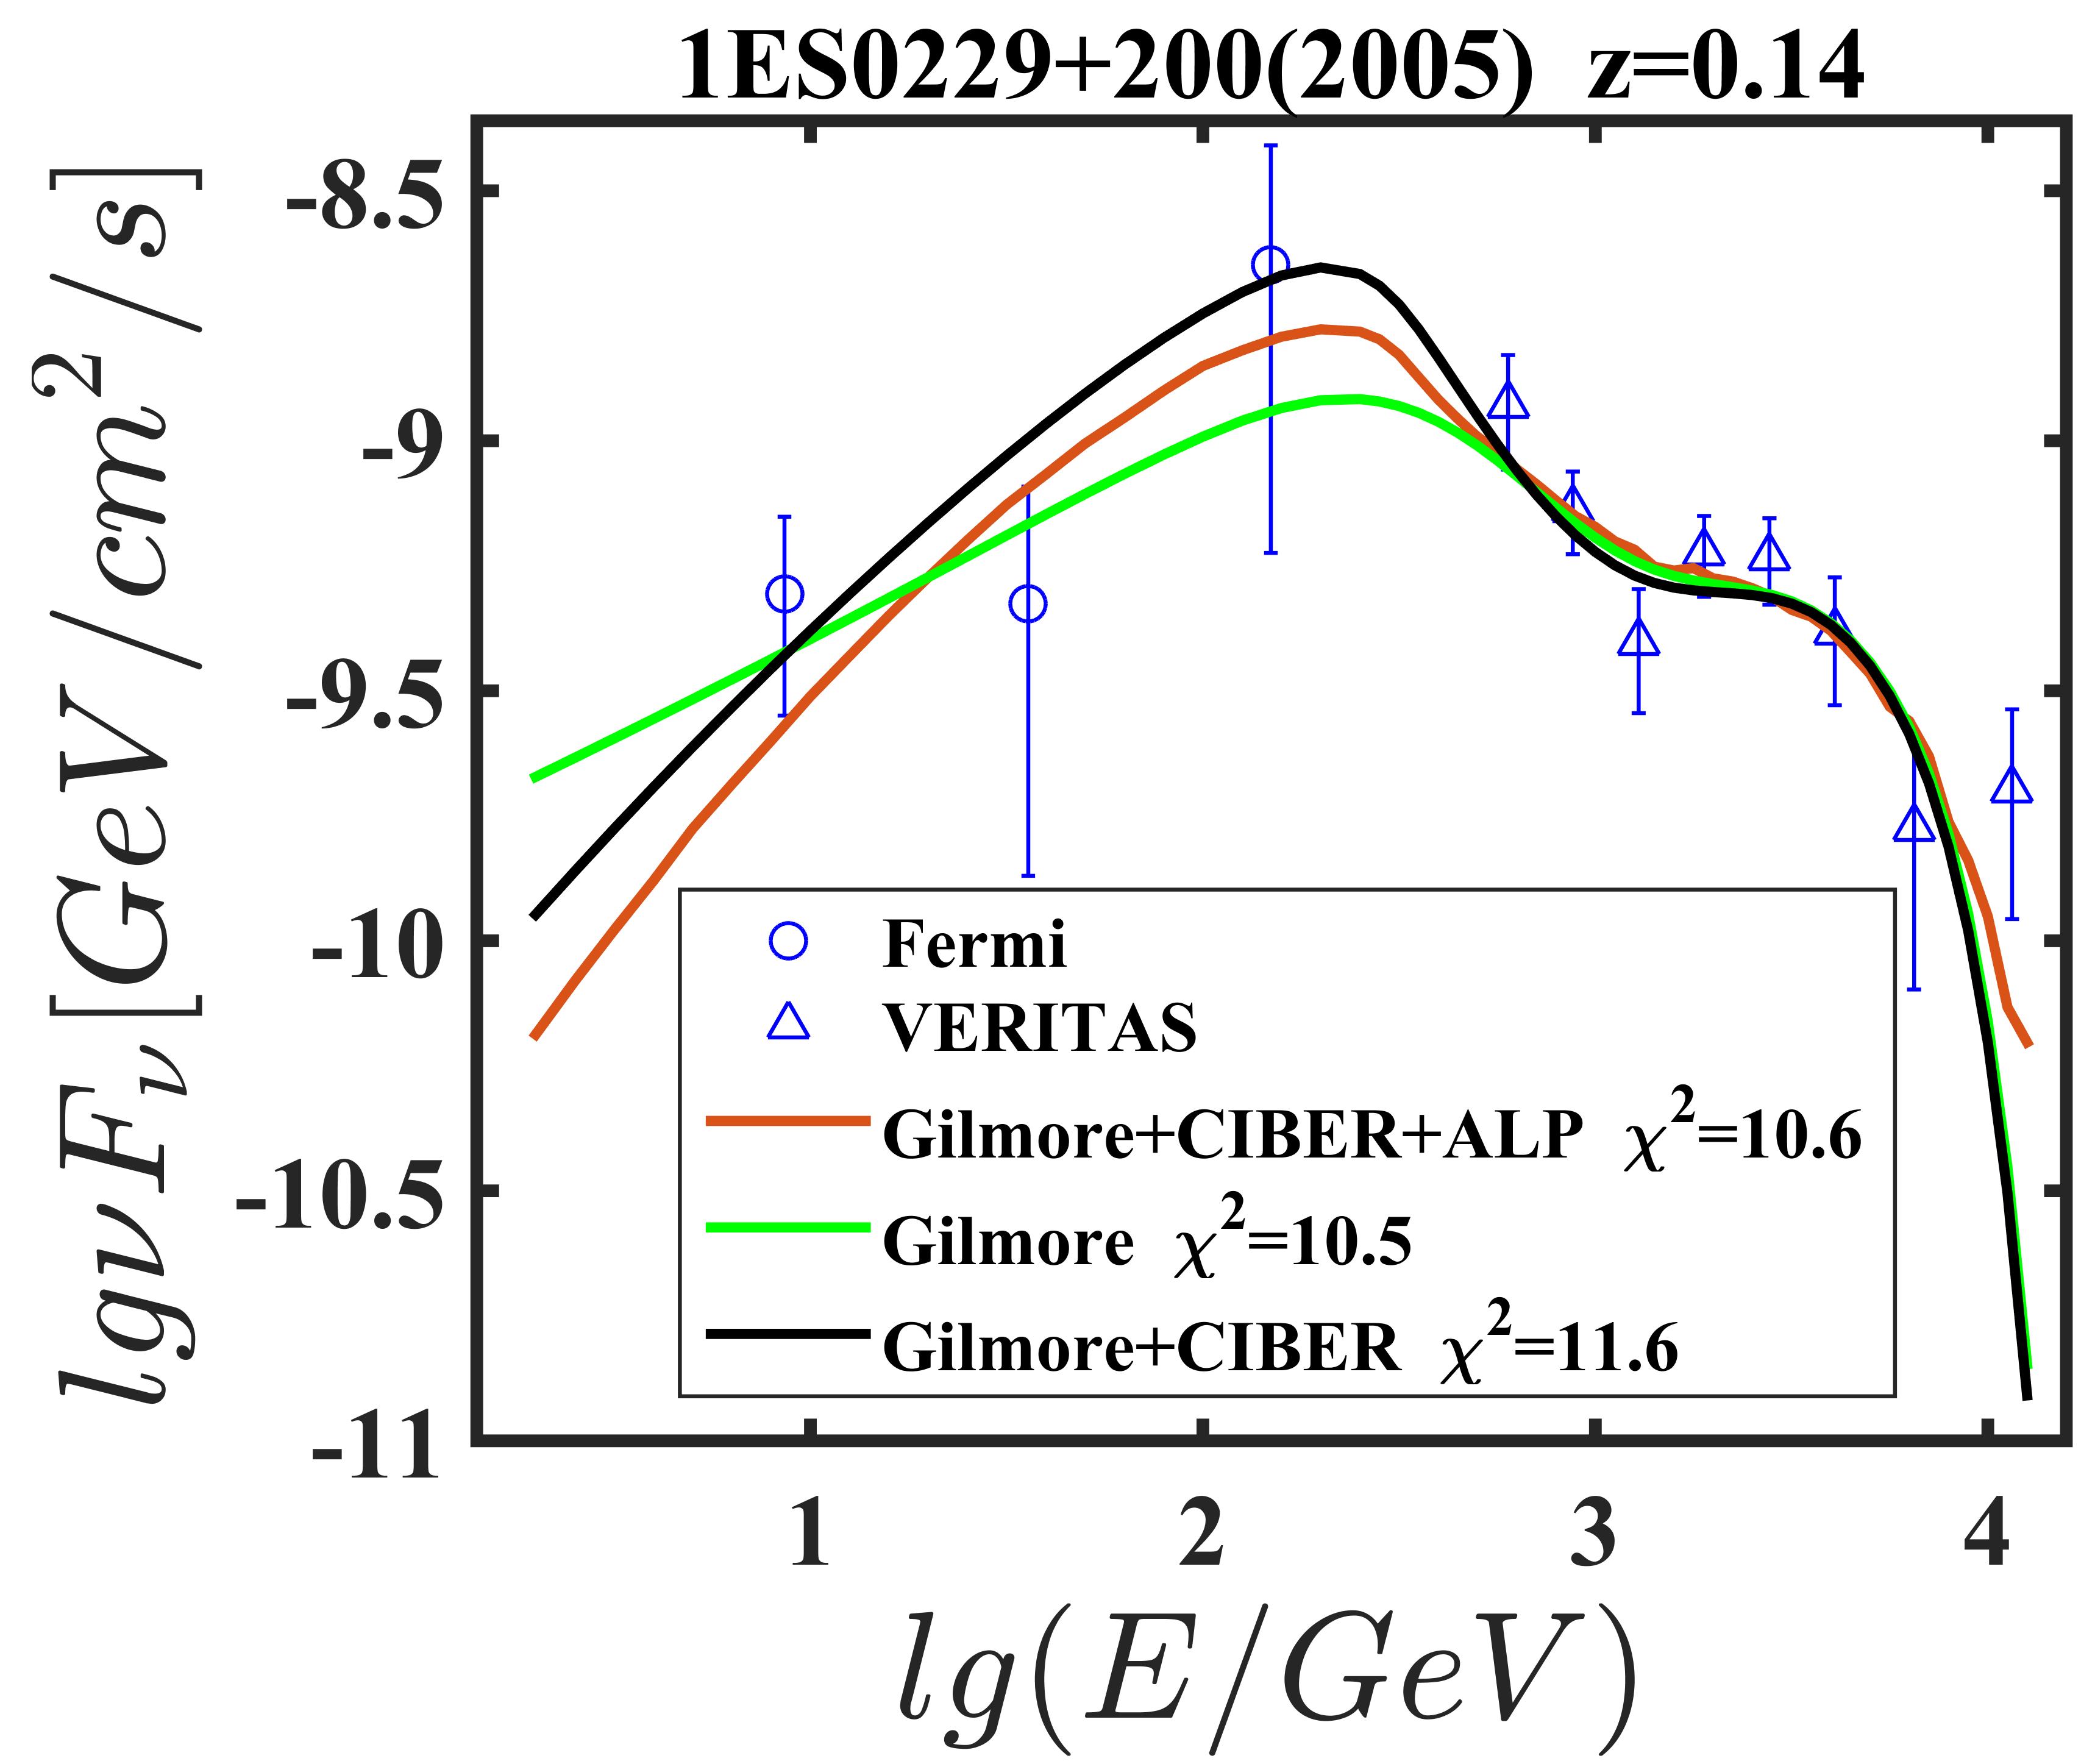
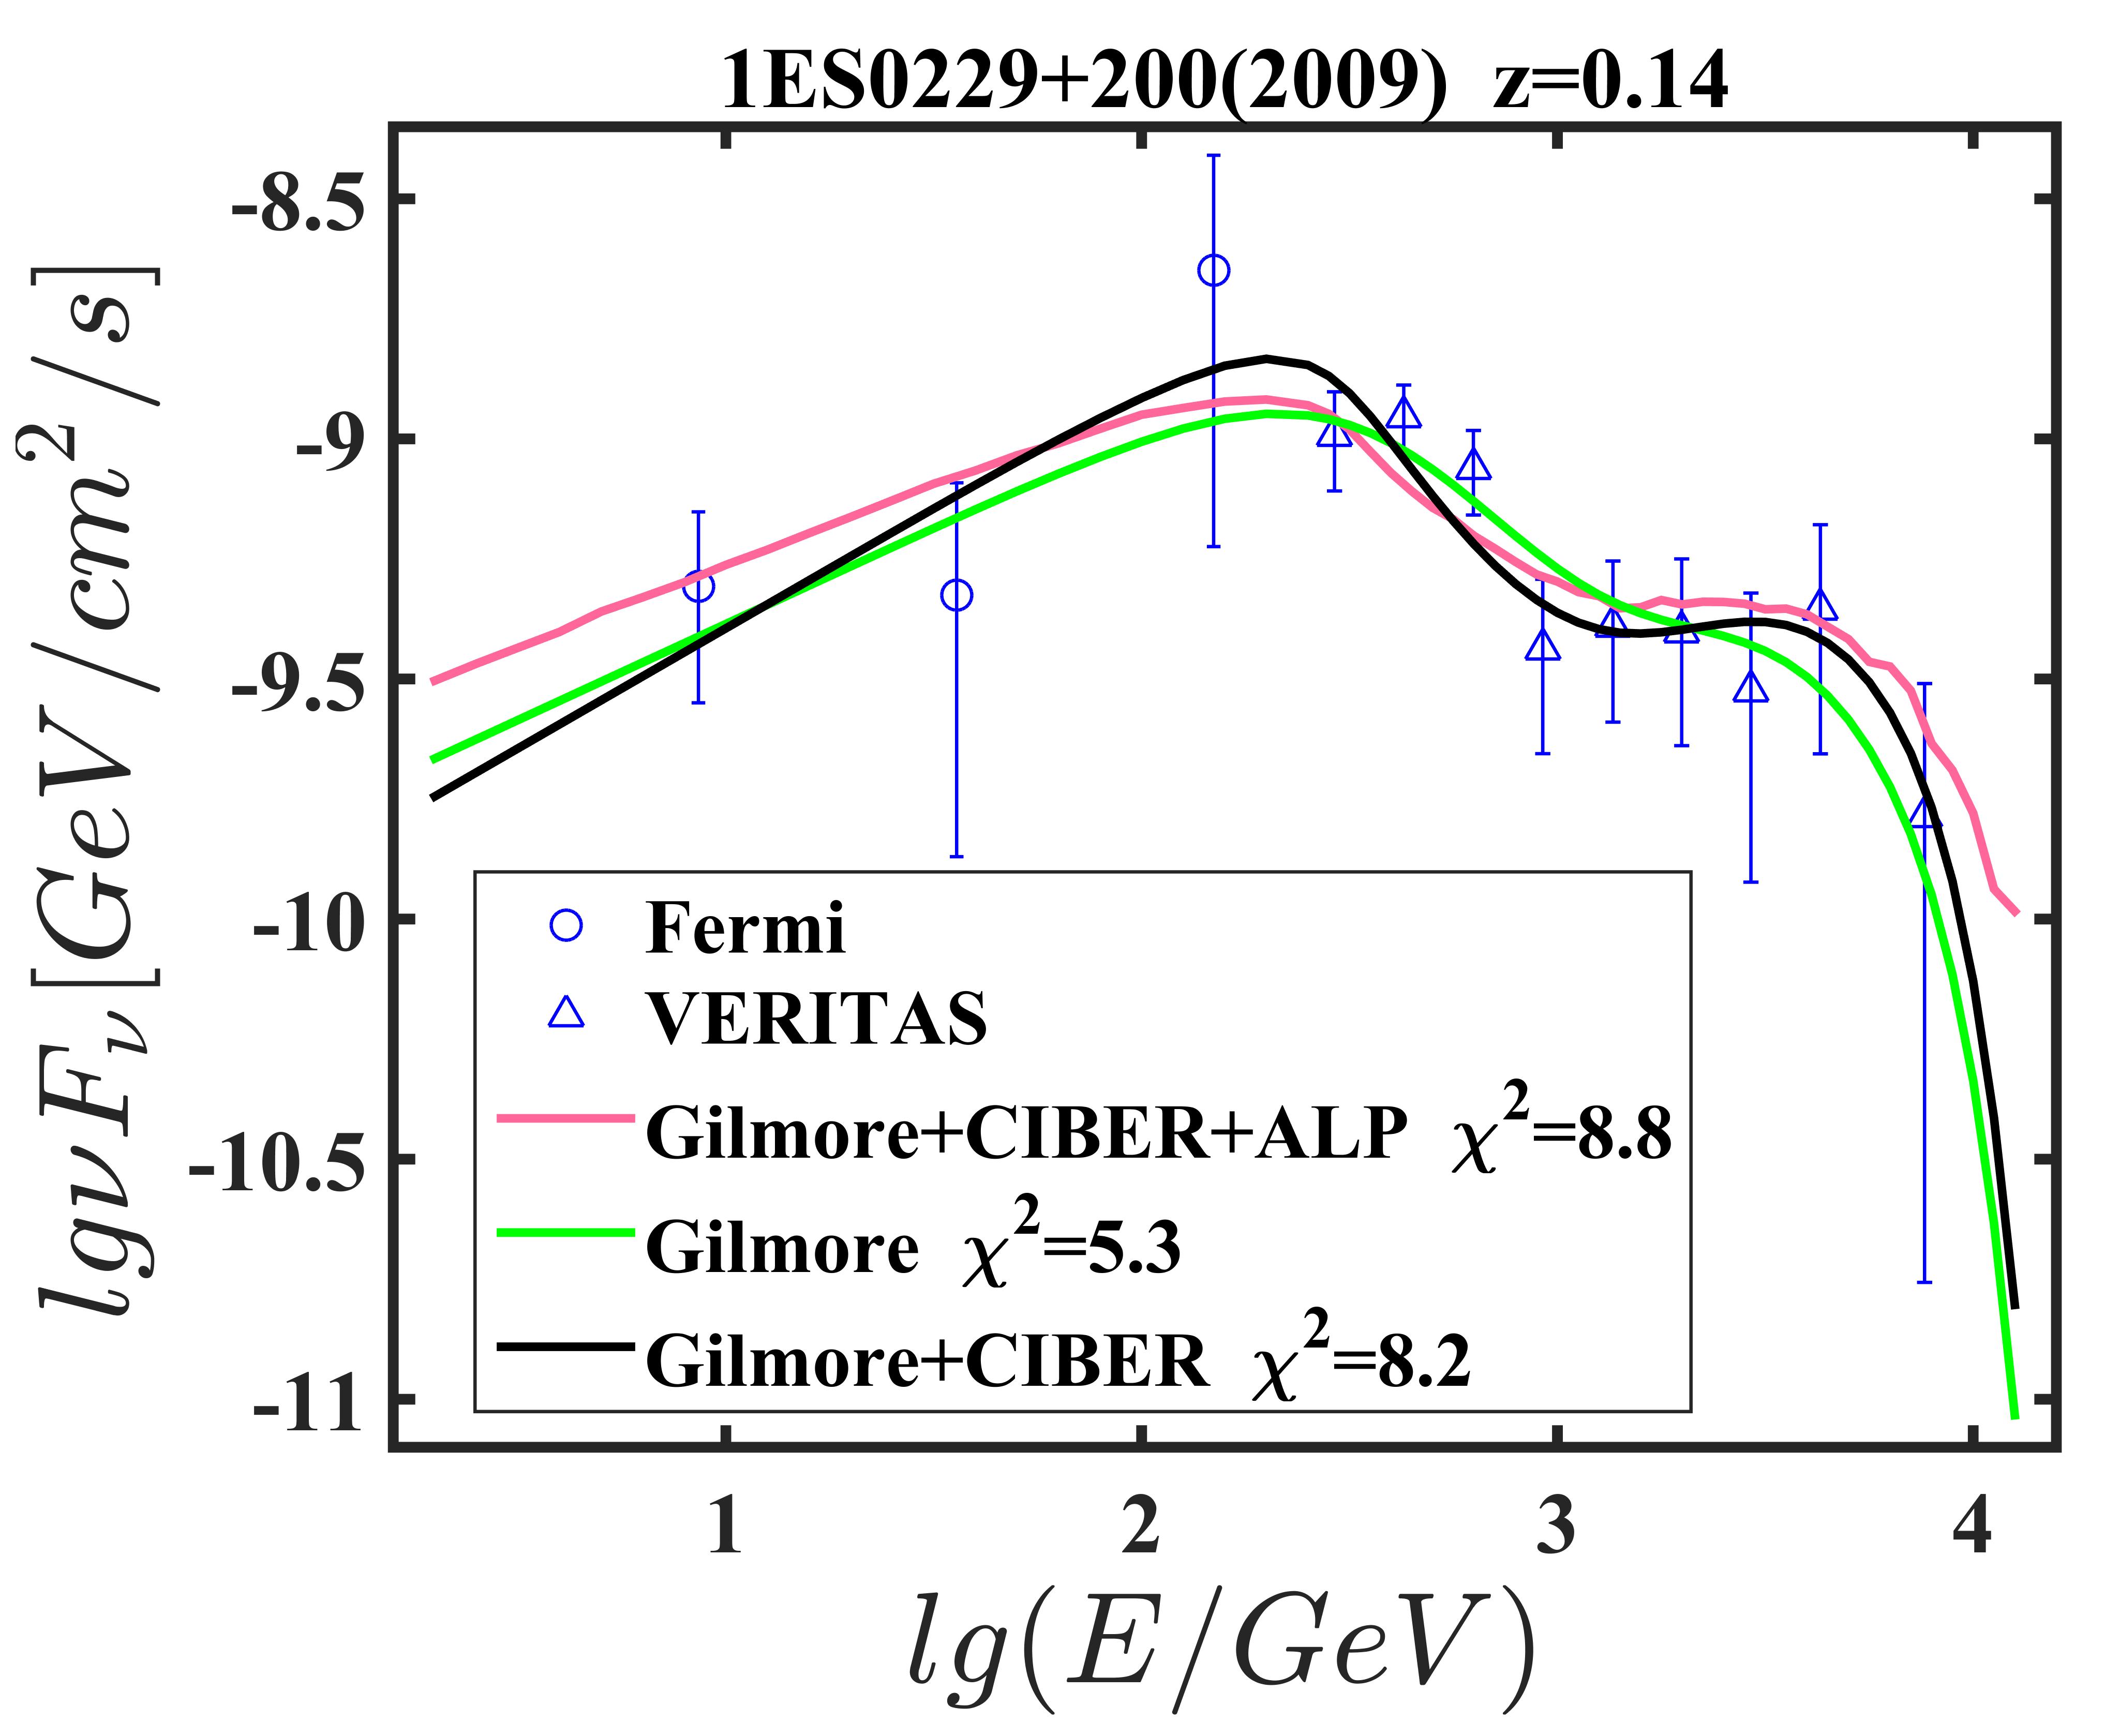
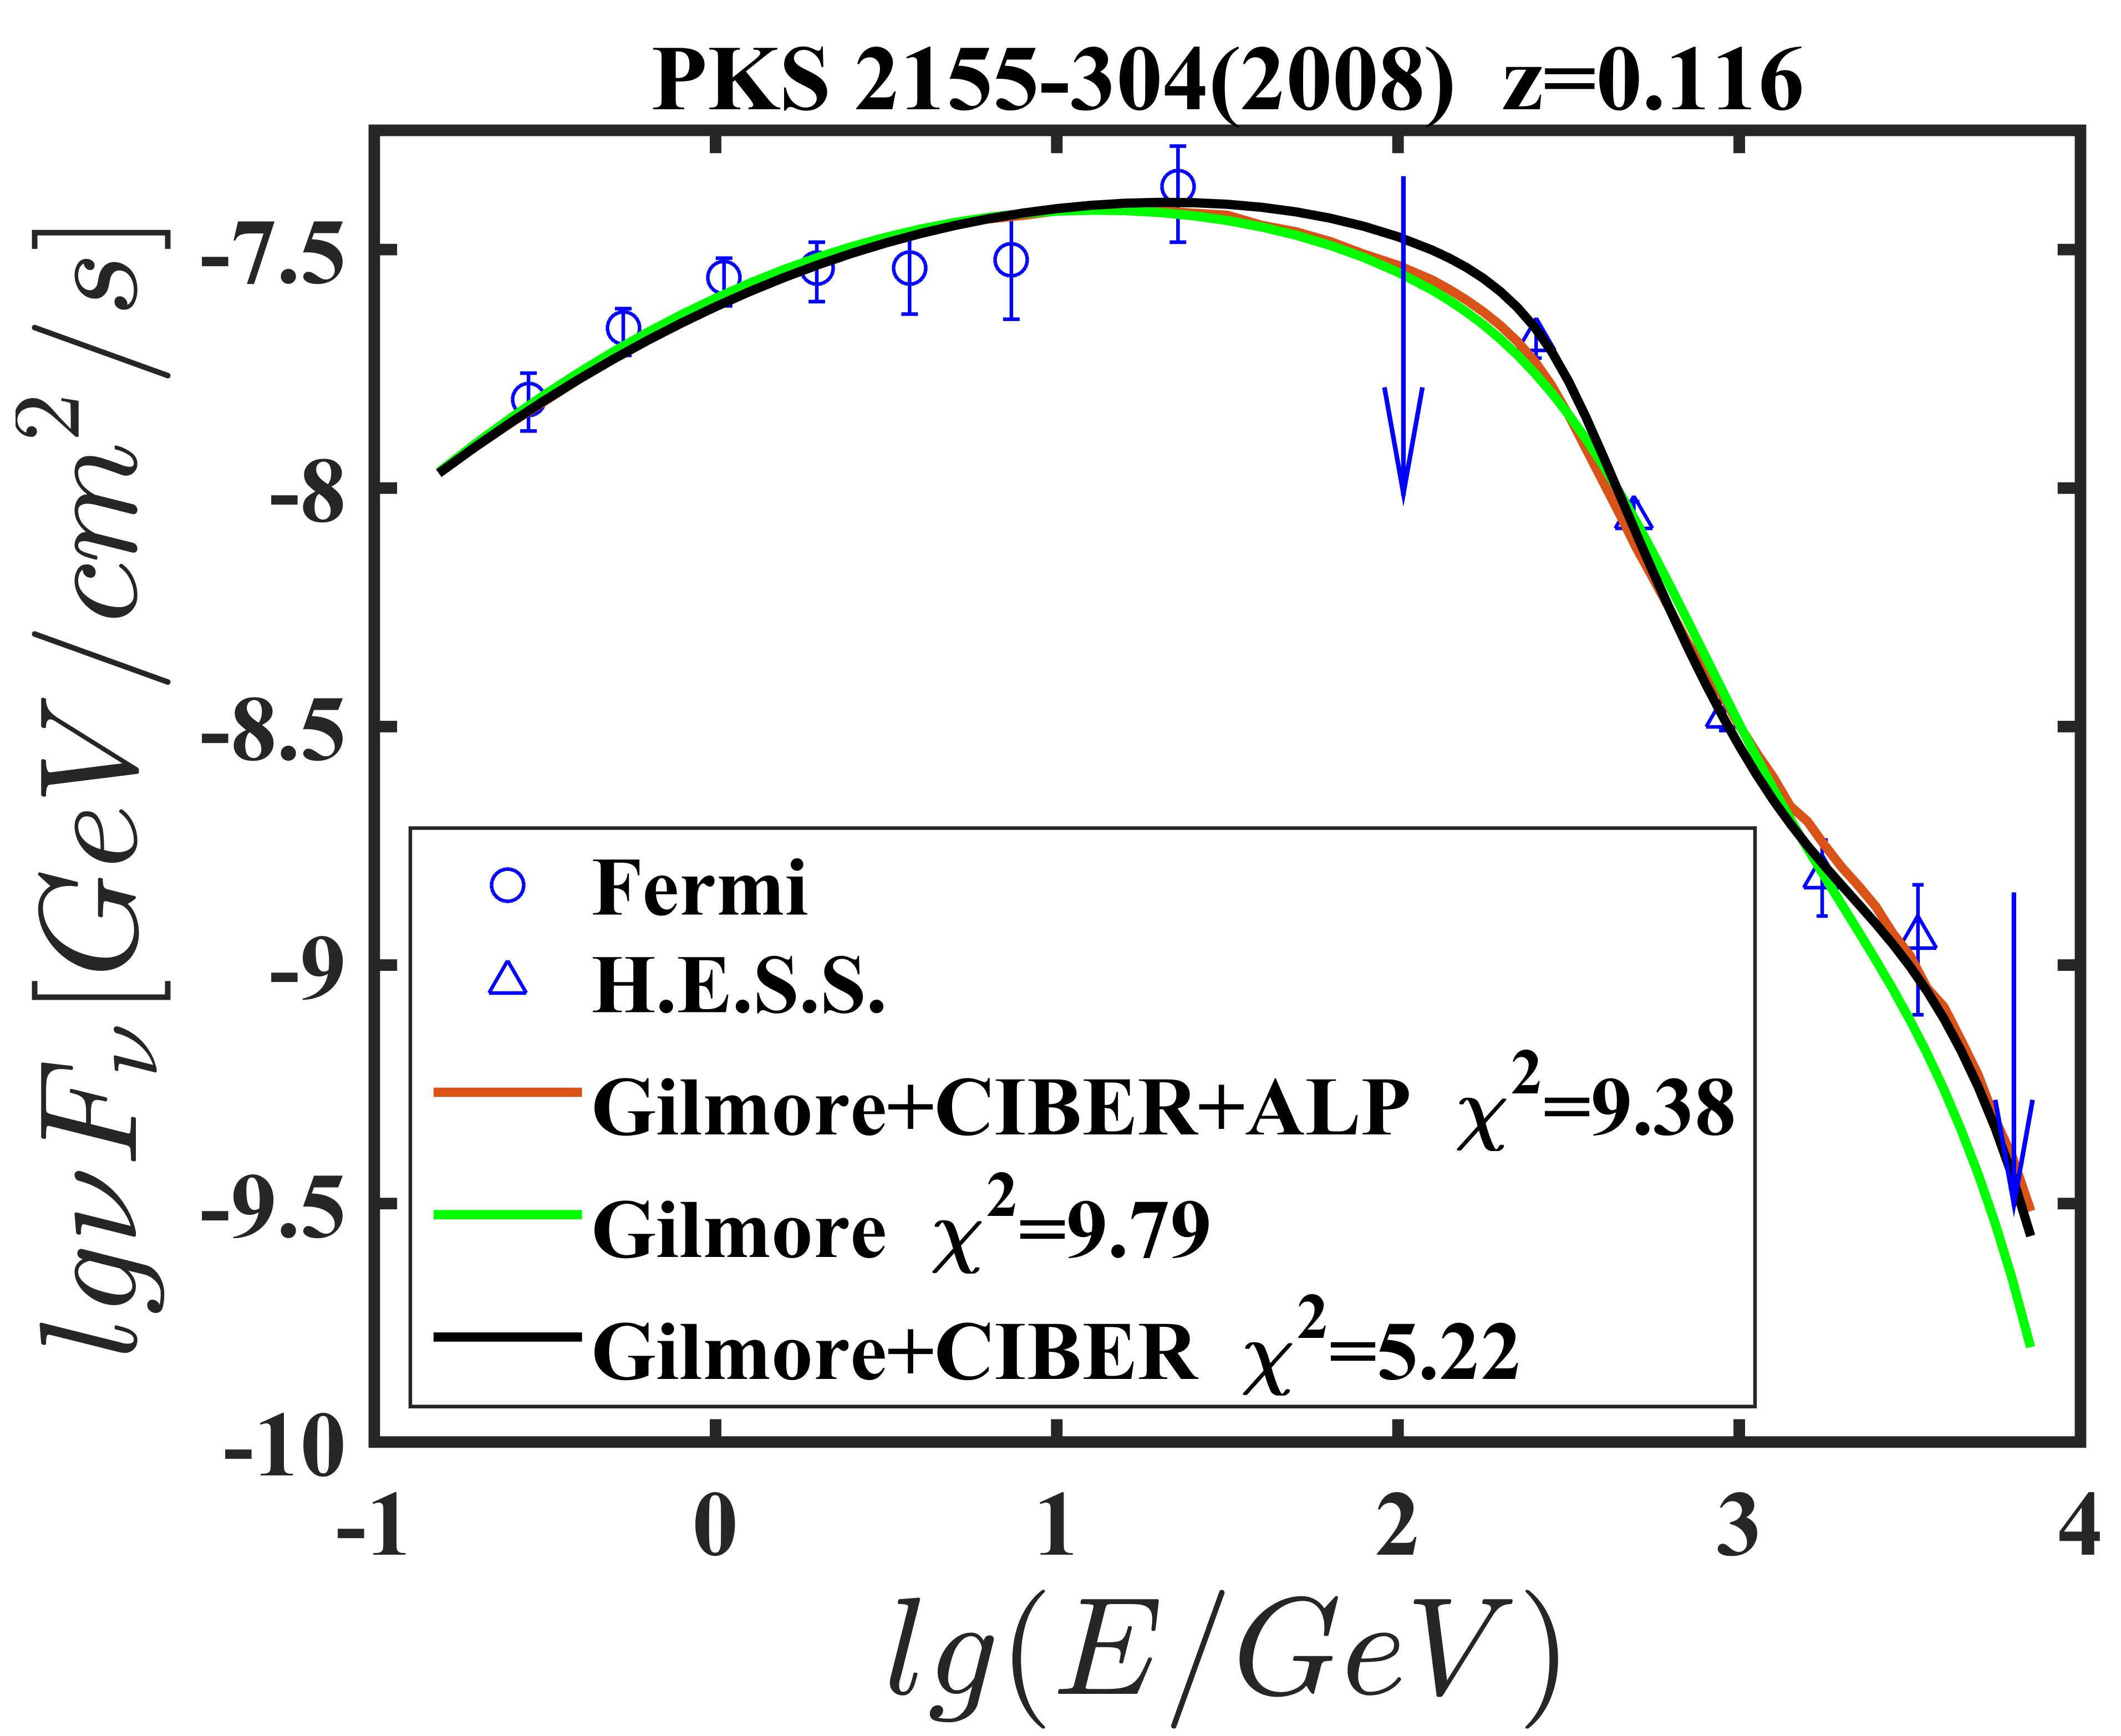
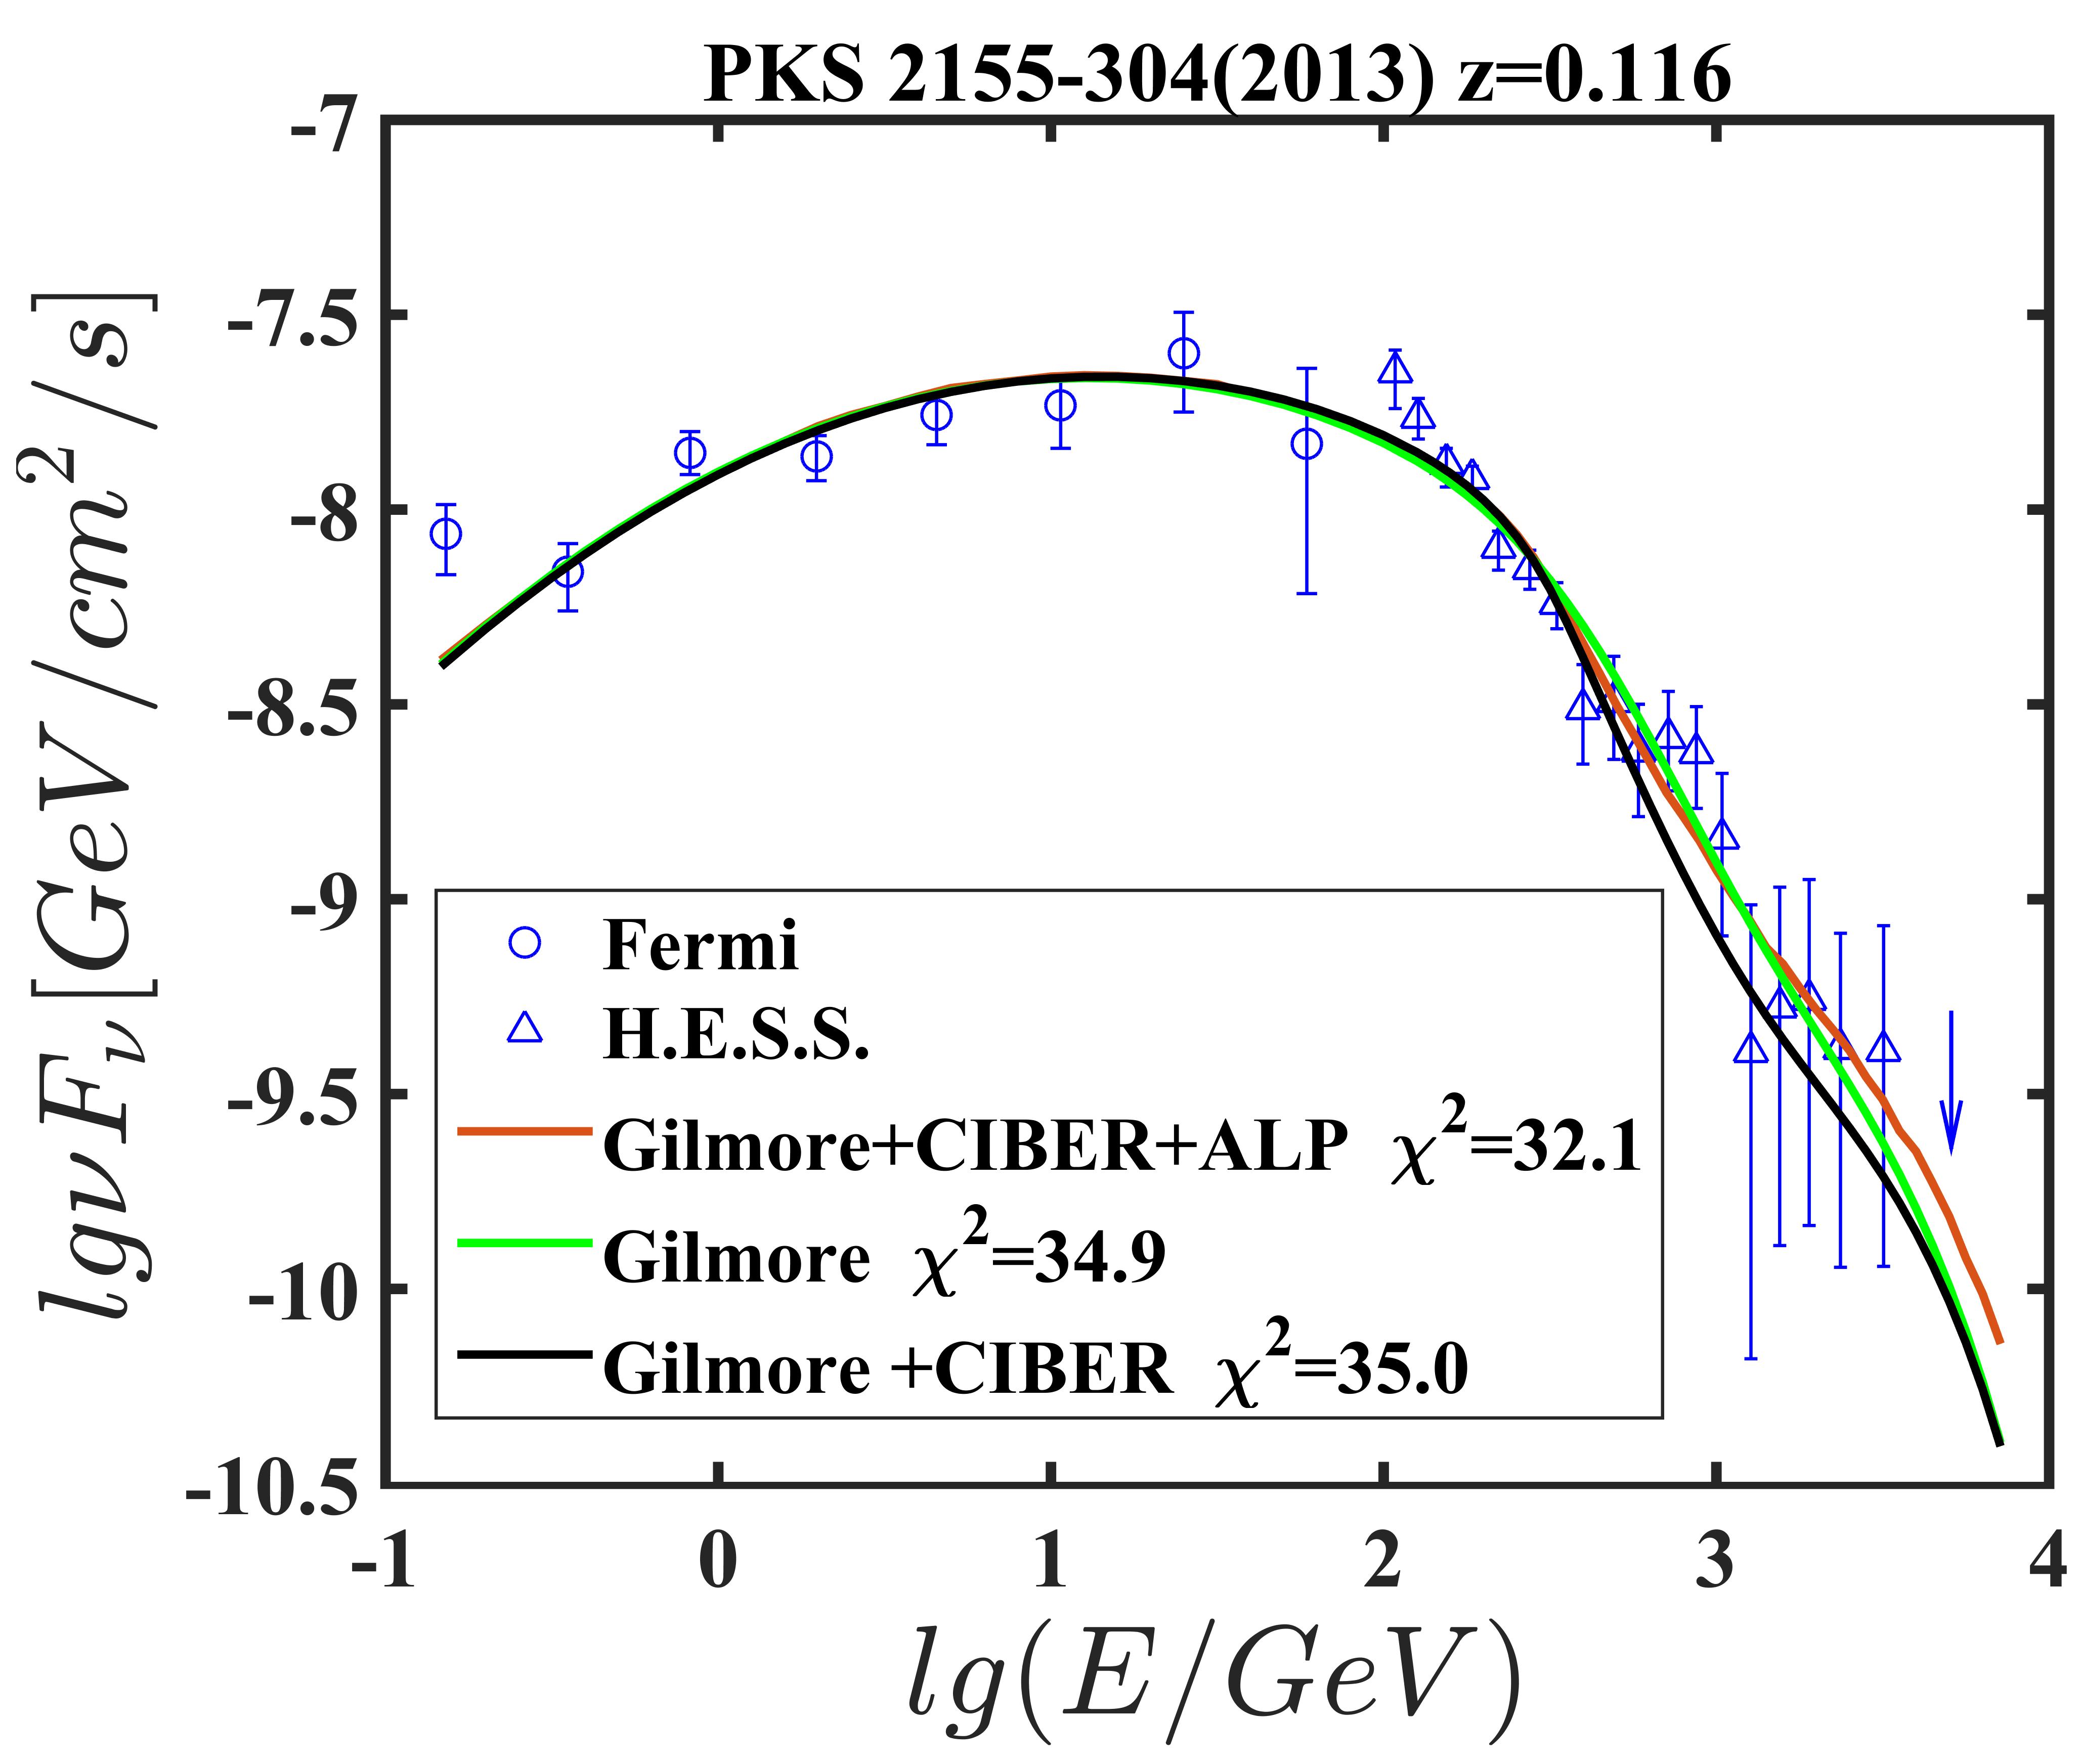
The results (for the conversion scenario including IGMF) of the spectral analysis and fitting of the four models to the spectral points, are summarized in the last column of Table 1, Fig. 4, Table 2, Fig. 5 in Appendix A.
The last column of Table 1 gives the chosen models for the intrinsic spectrum. The four absorption models almost have the same form of the best fitting intrinsic functions for each observed spectrum. This reduces the effect due to the different of intrinsic spectrum on the comparison of the absorption models.
V.1 The best-fitting theoretical spectra
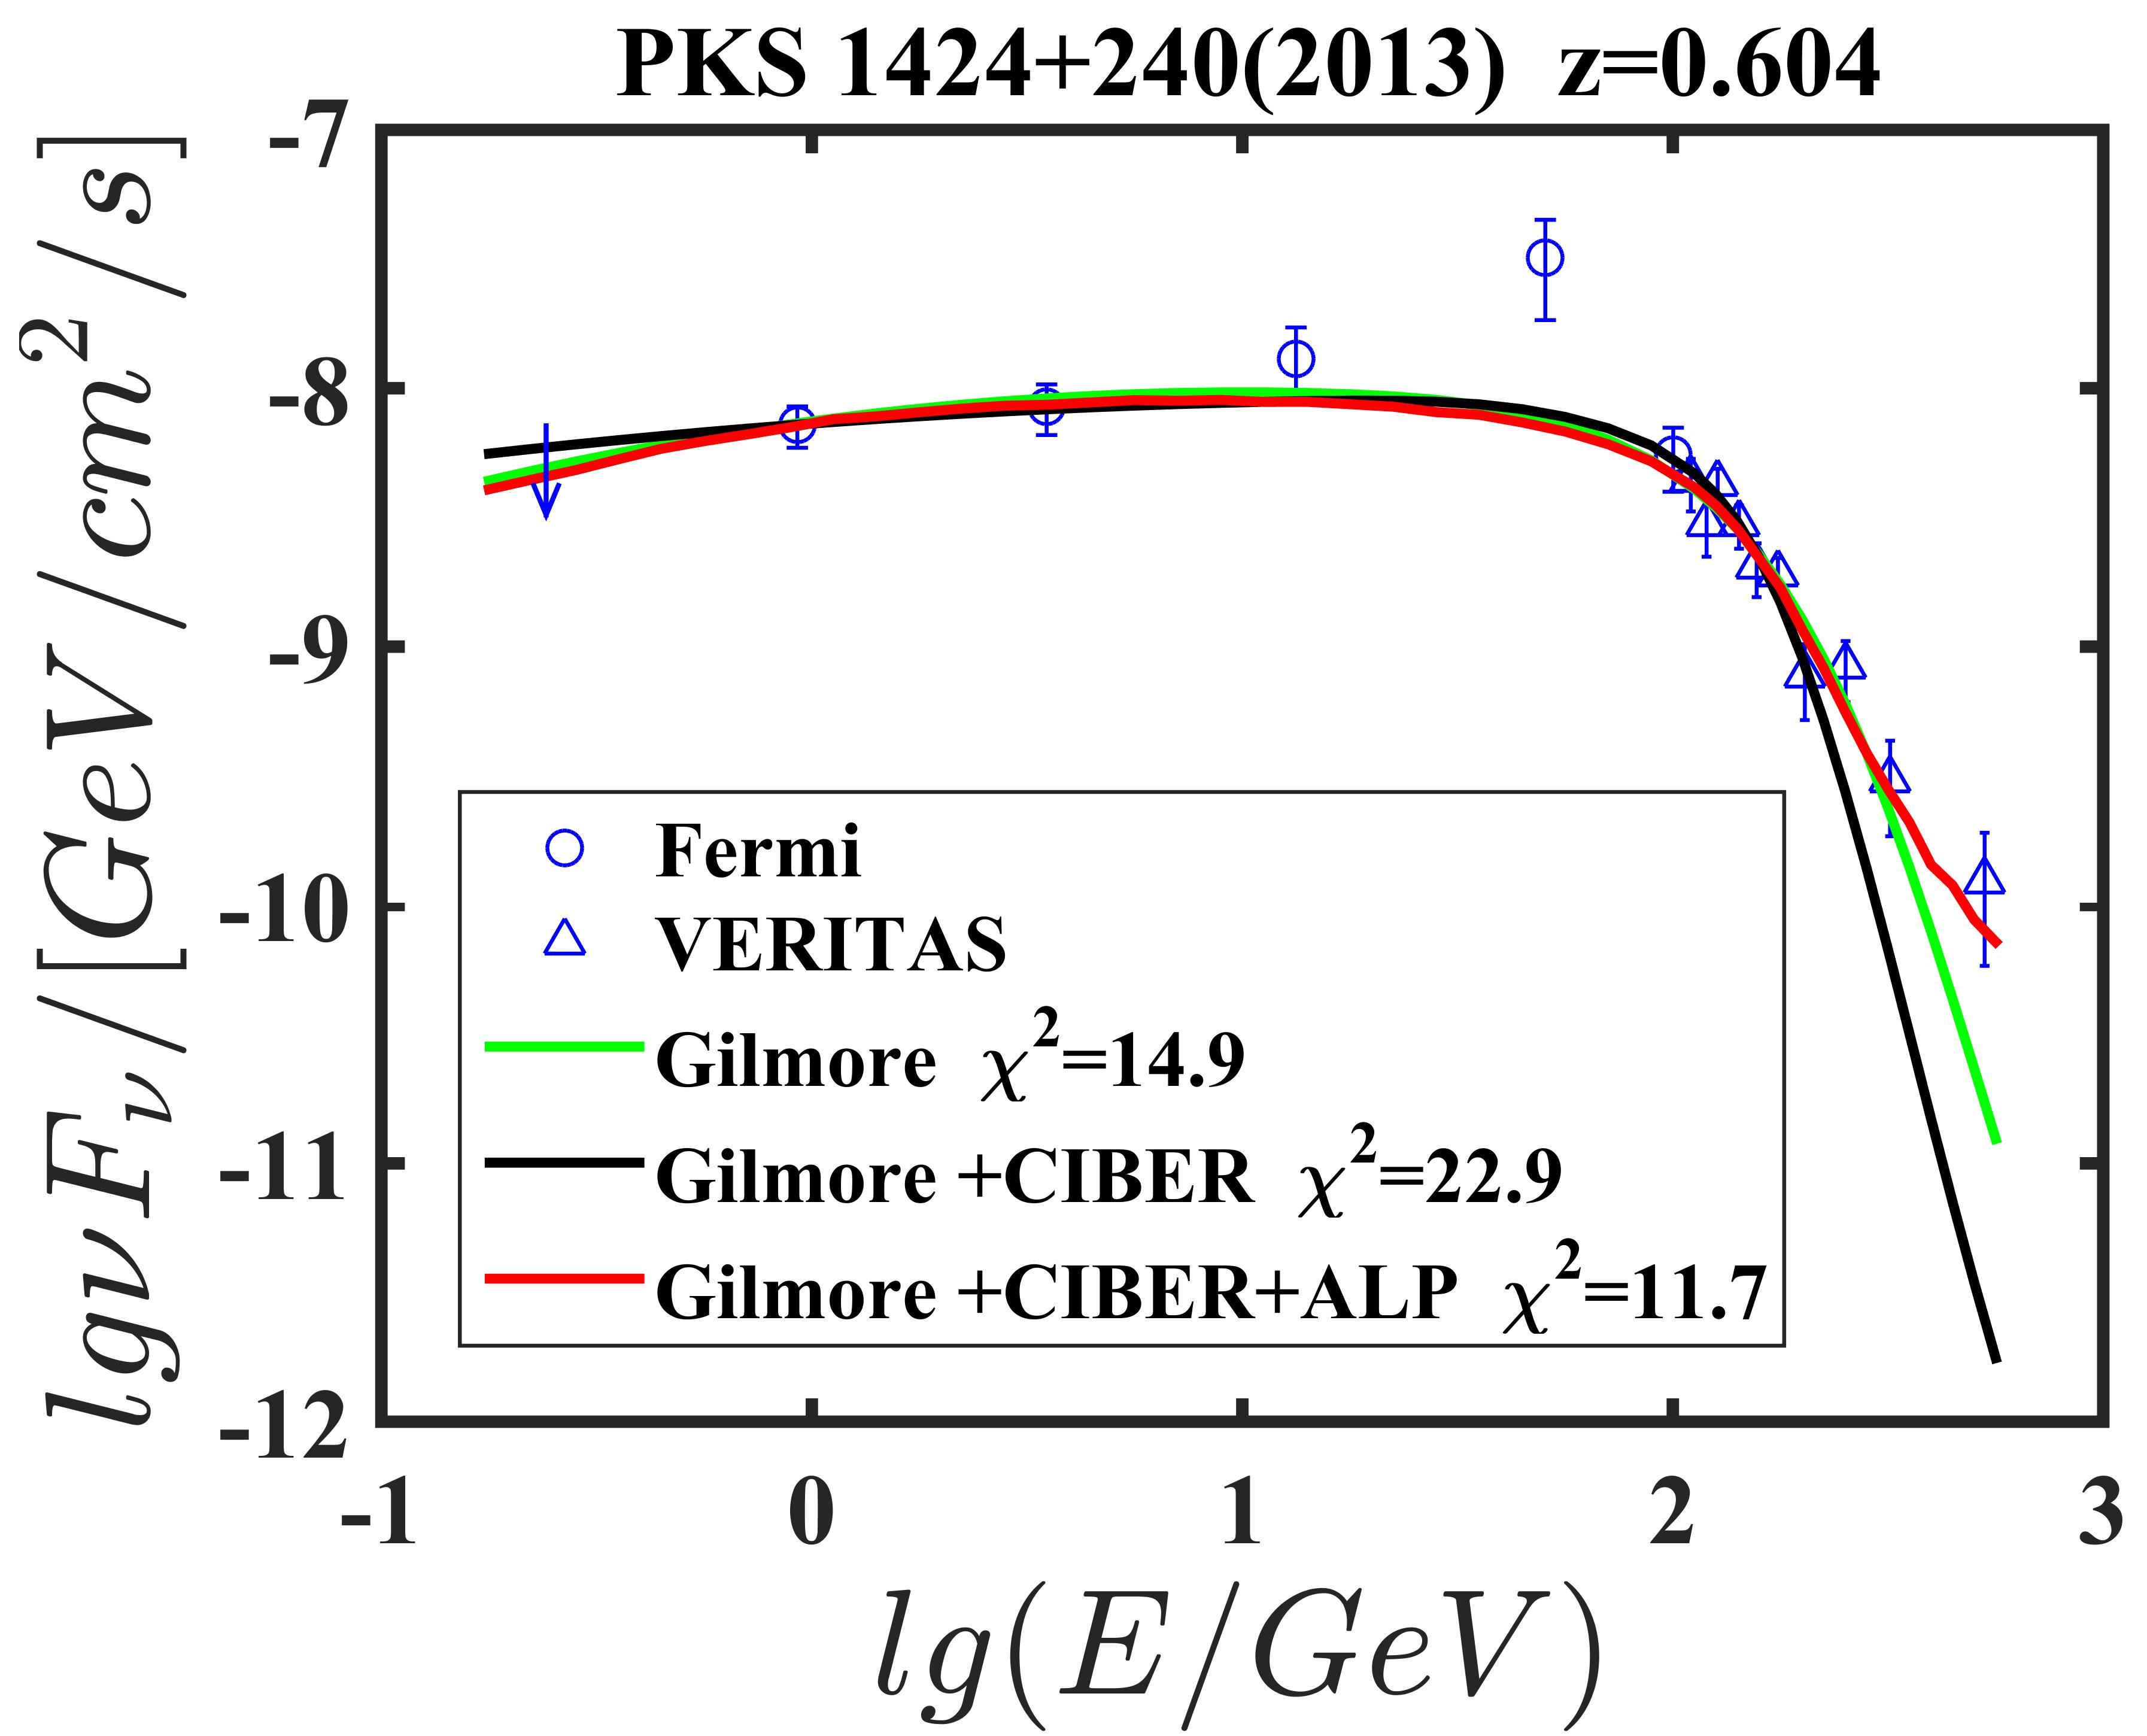
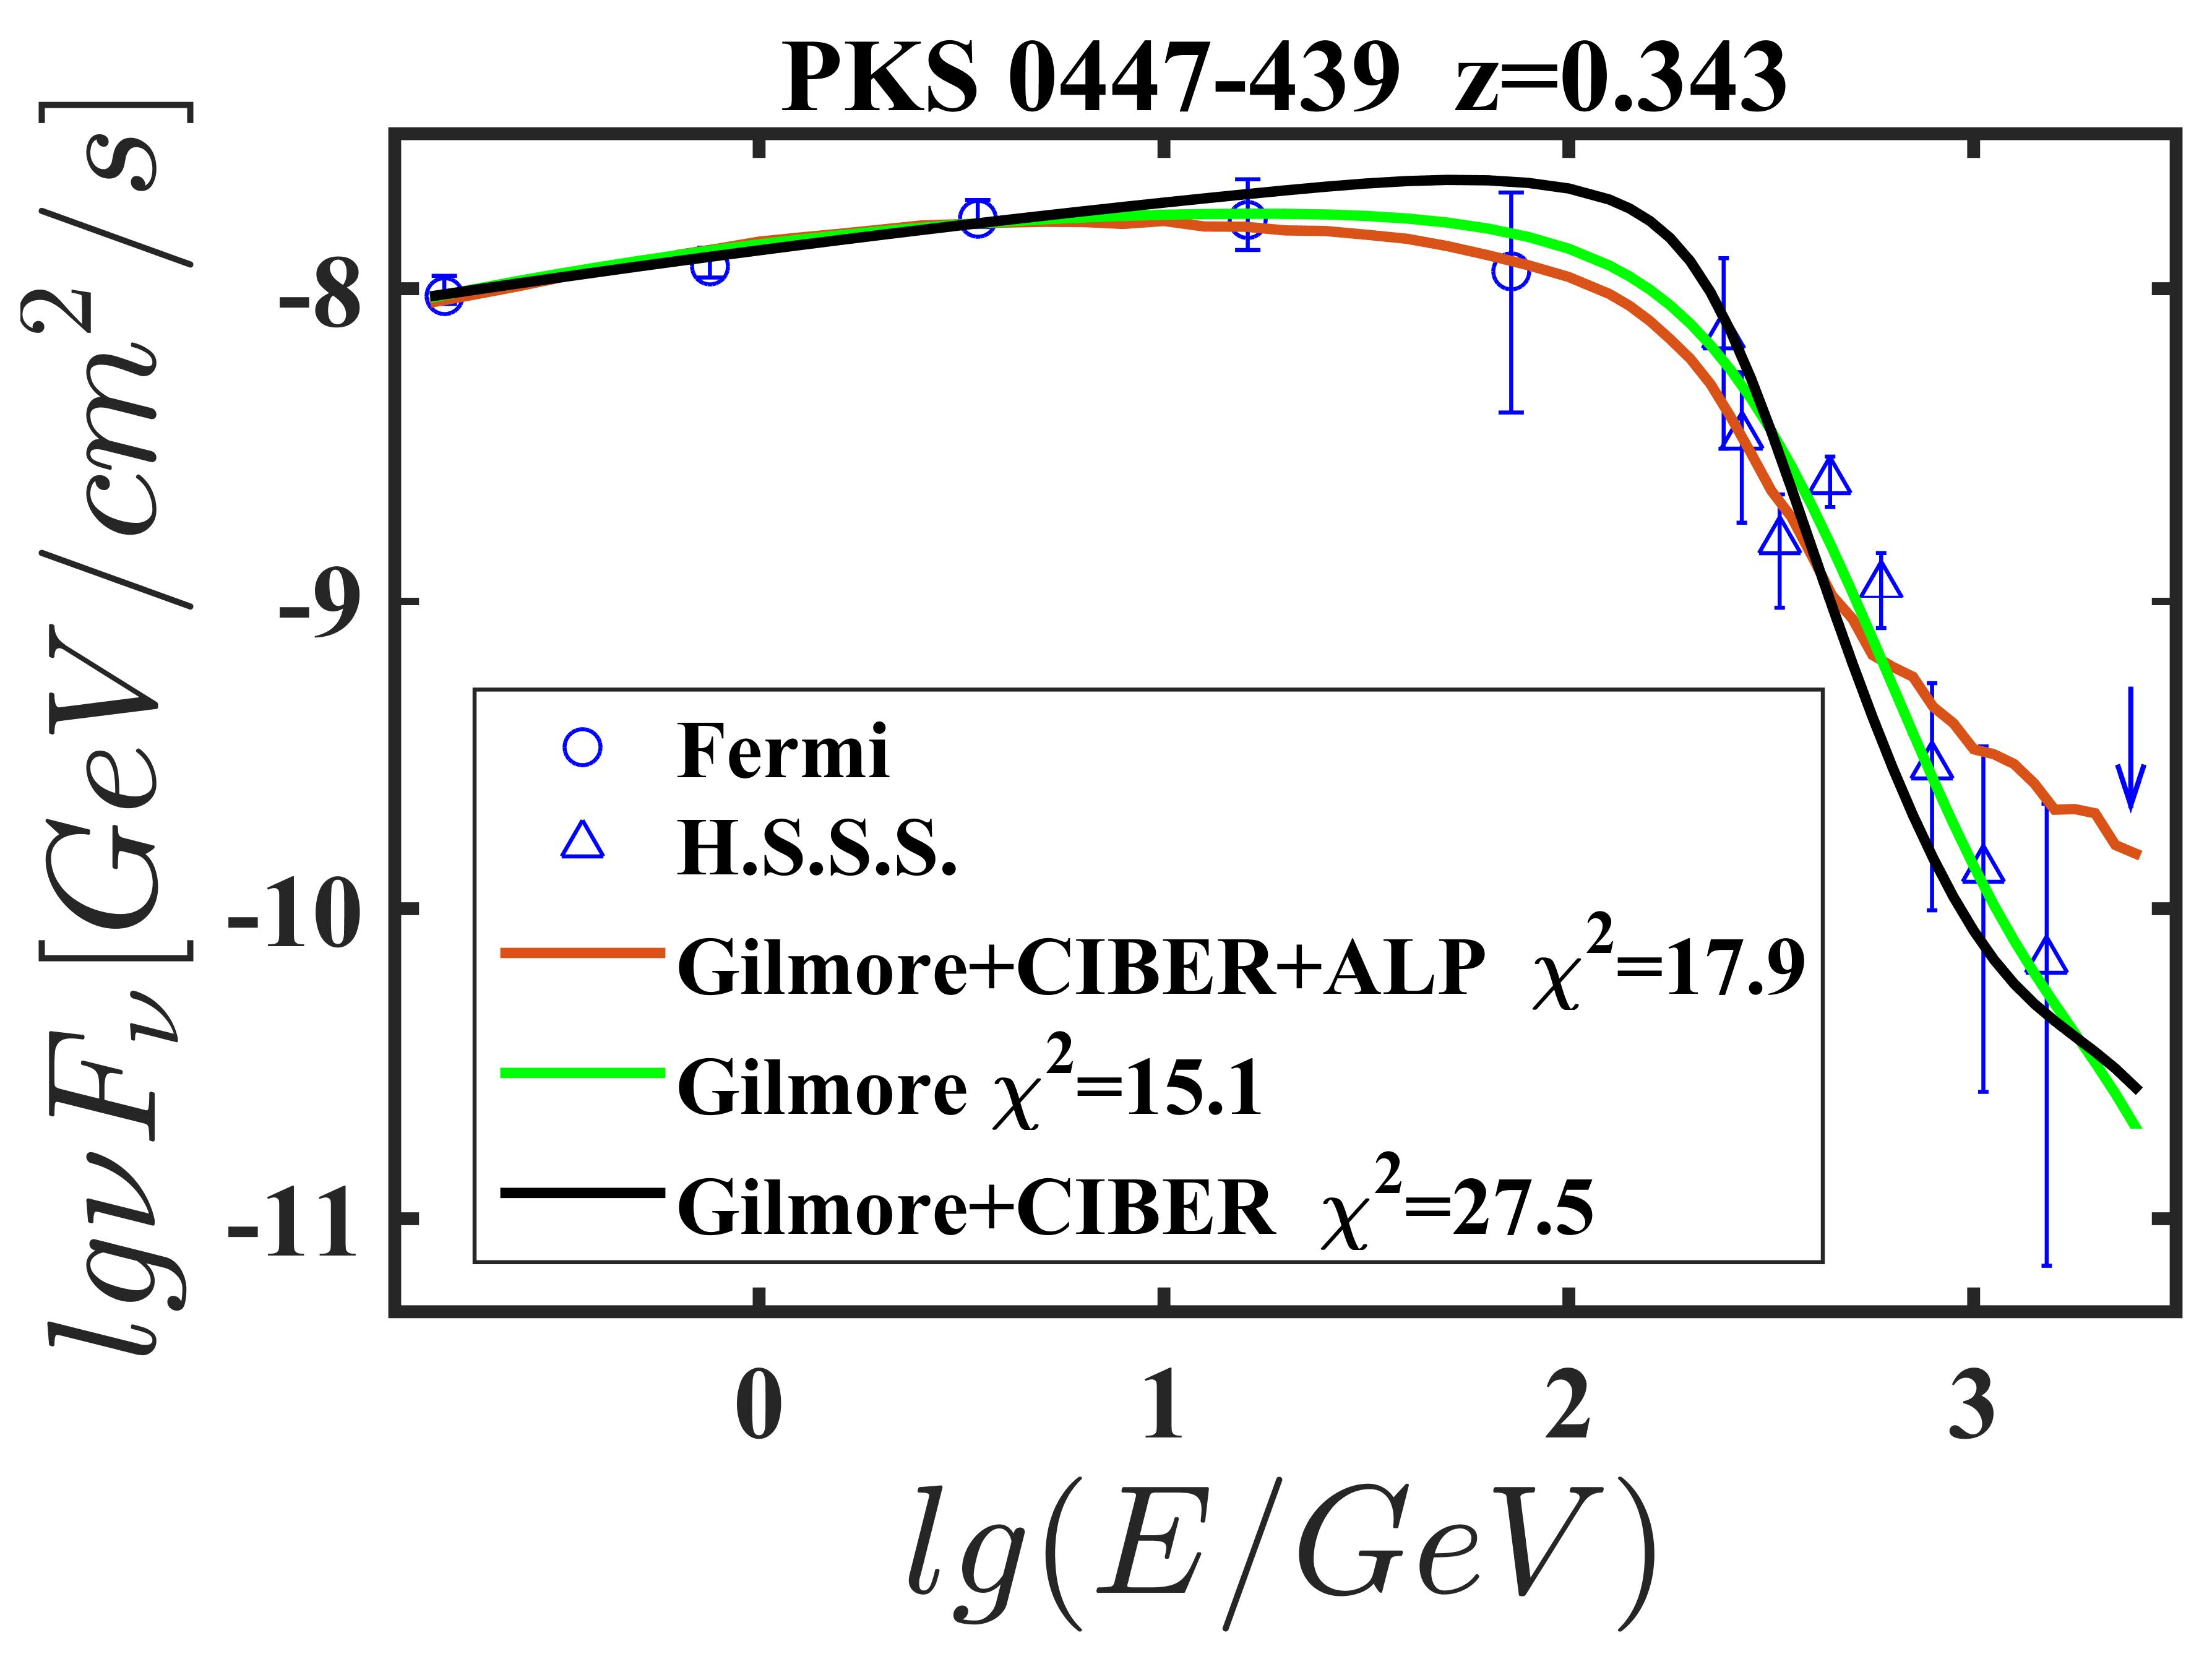
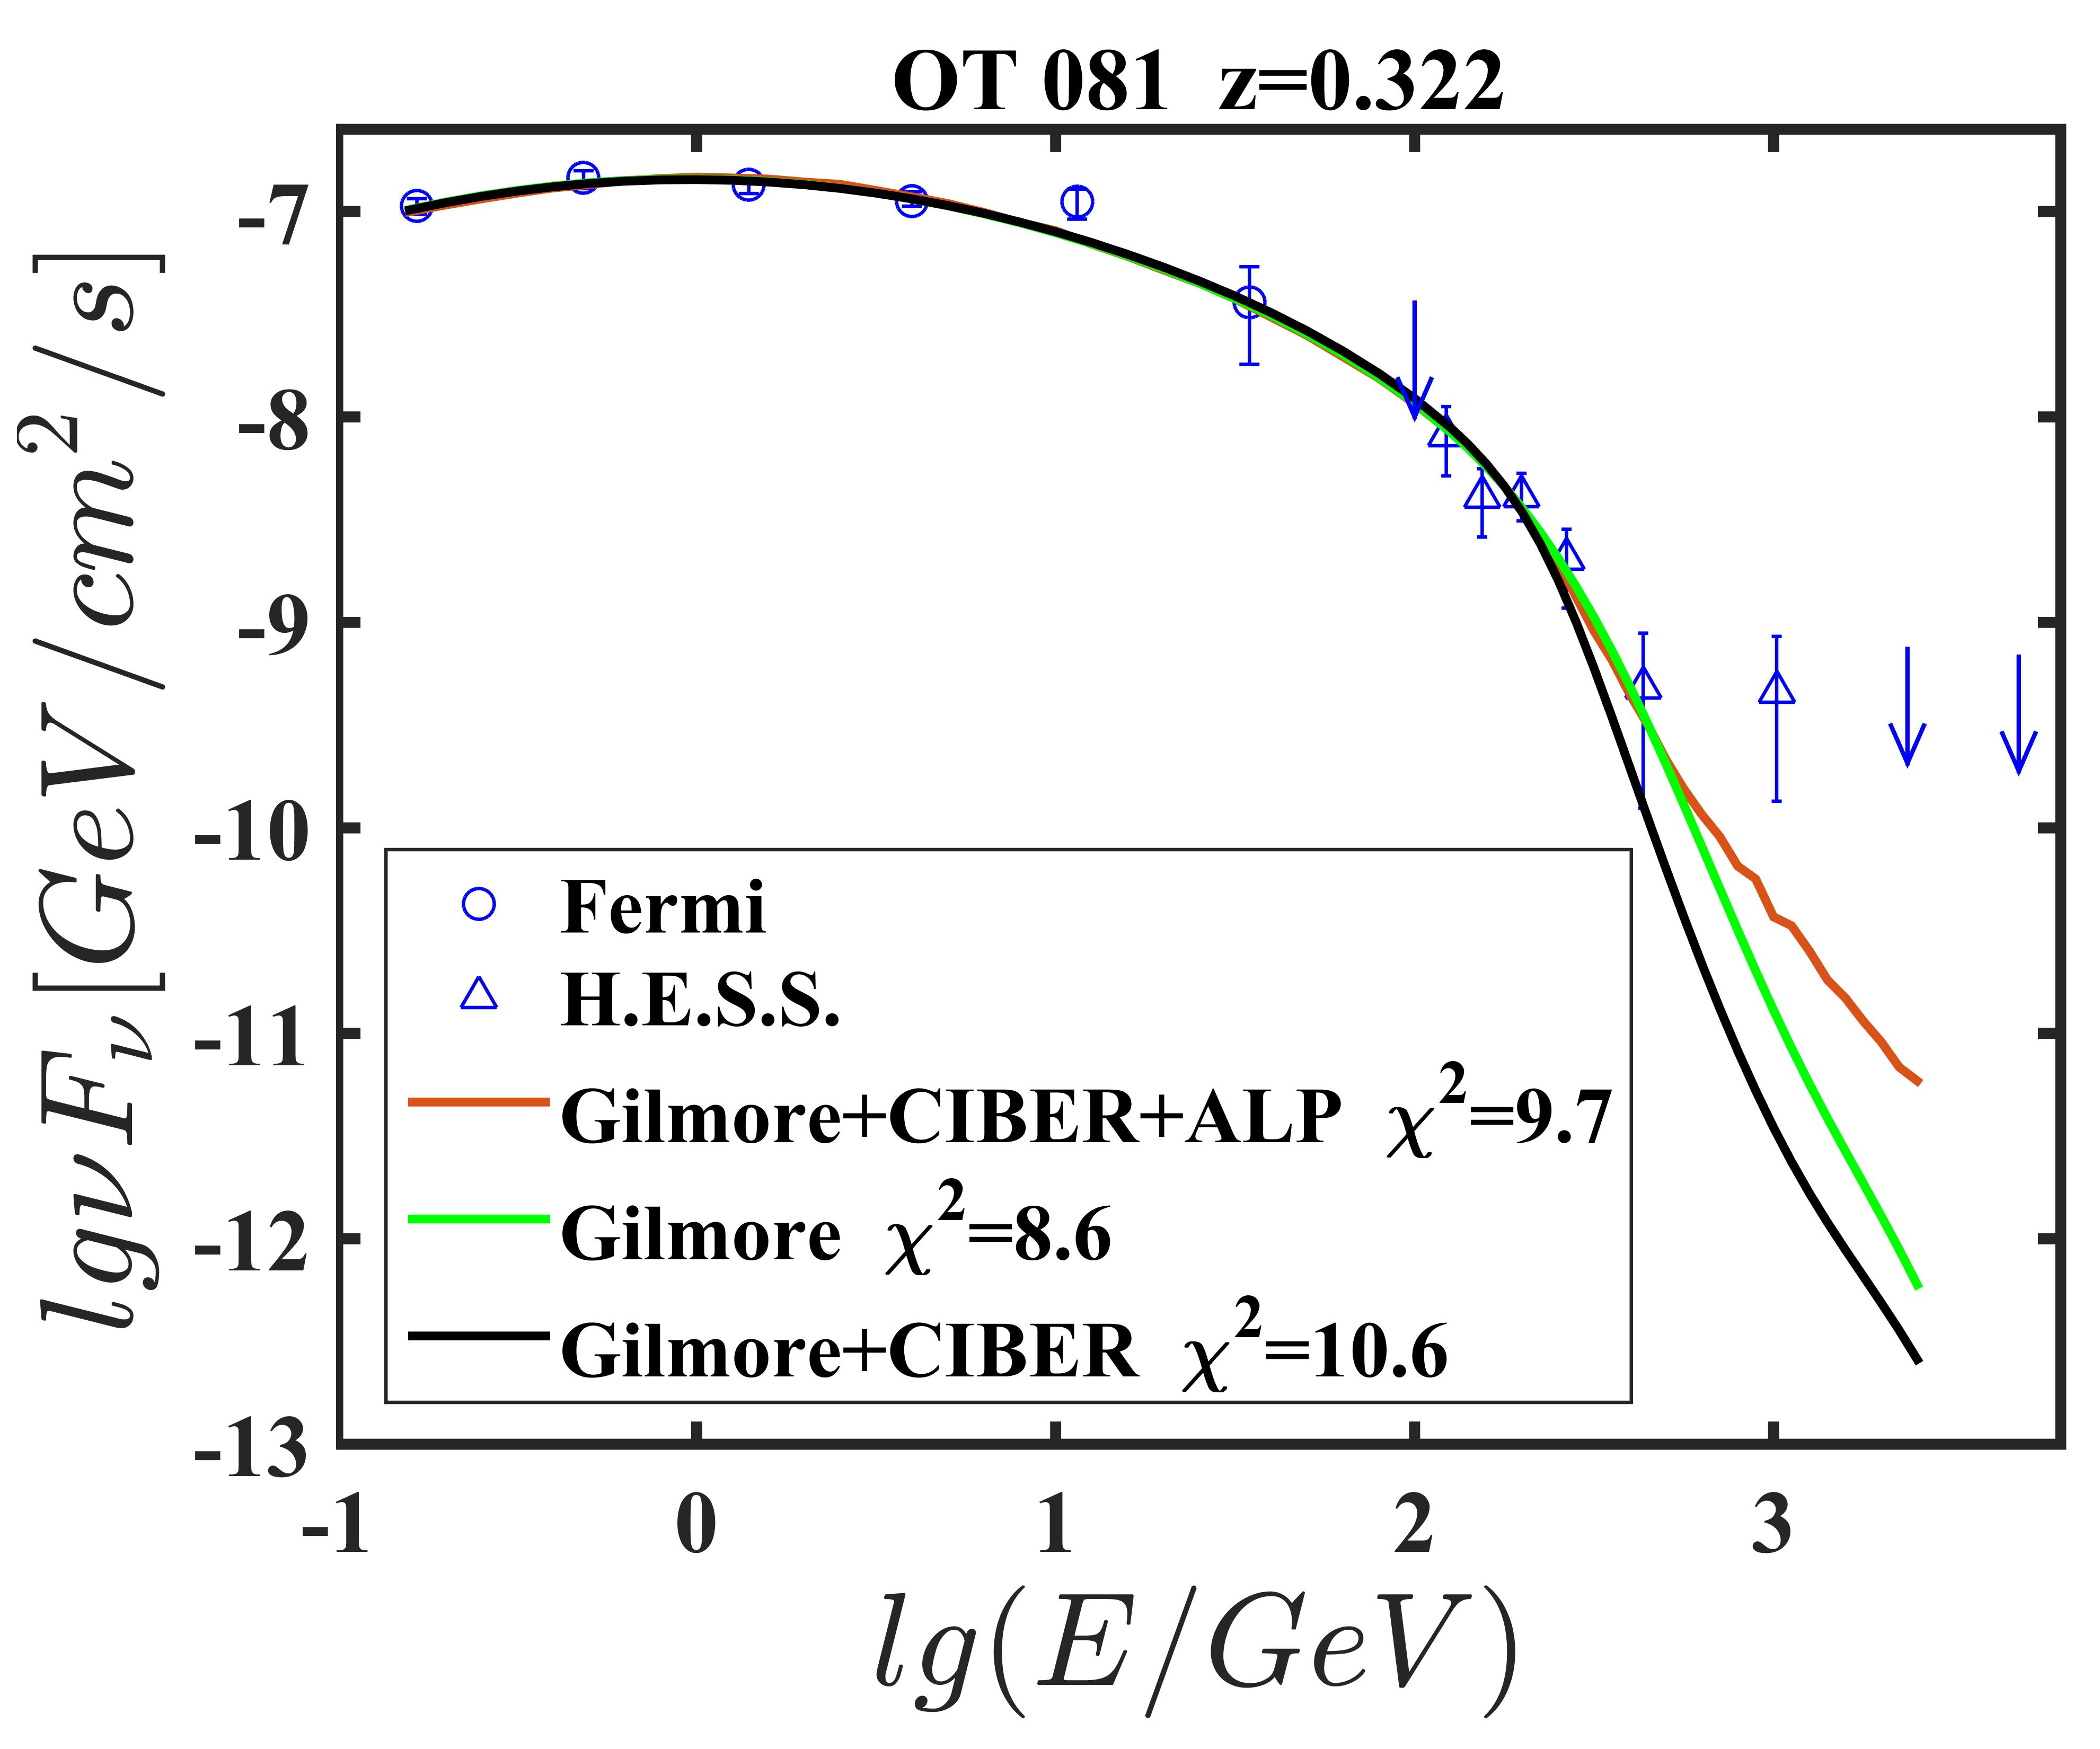
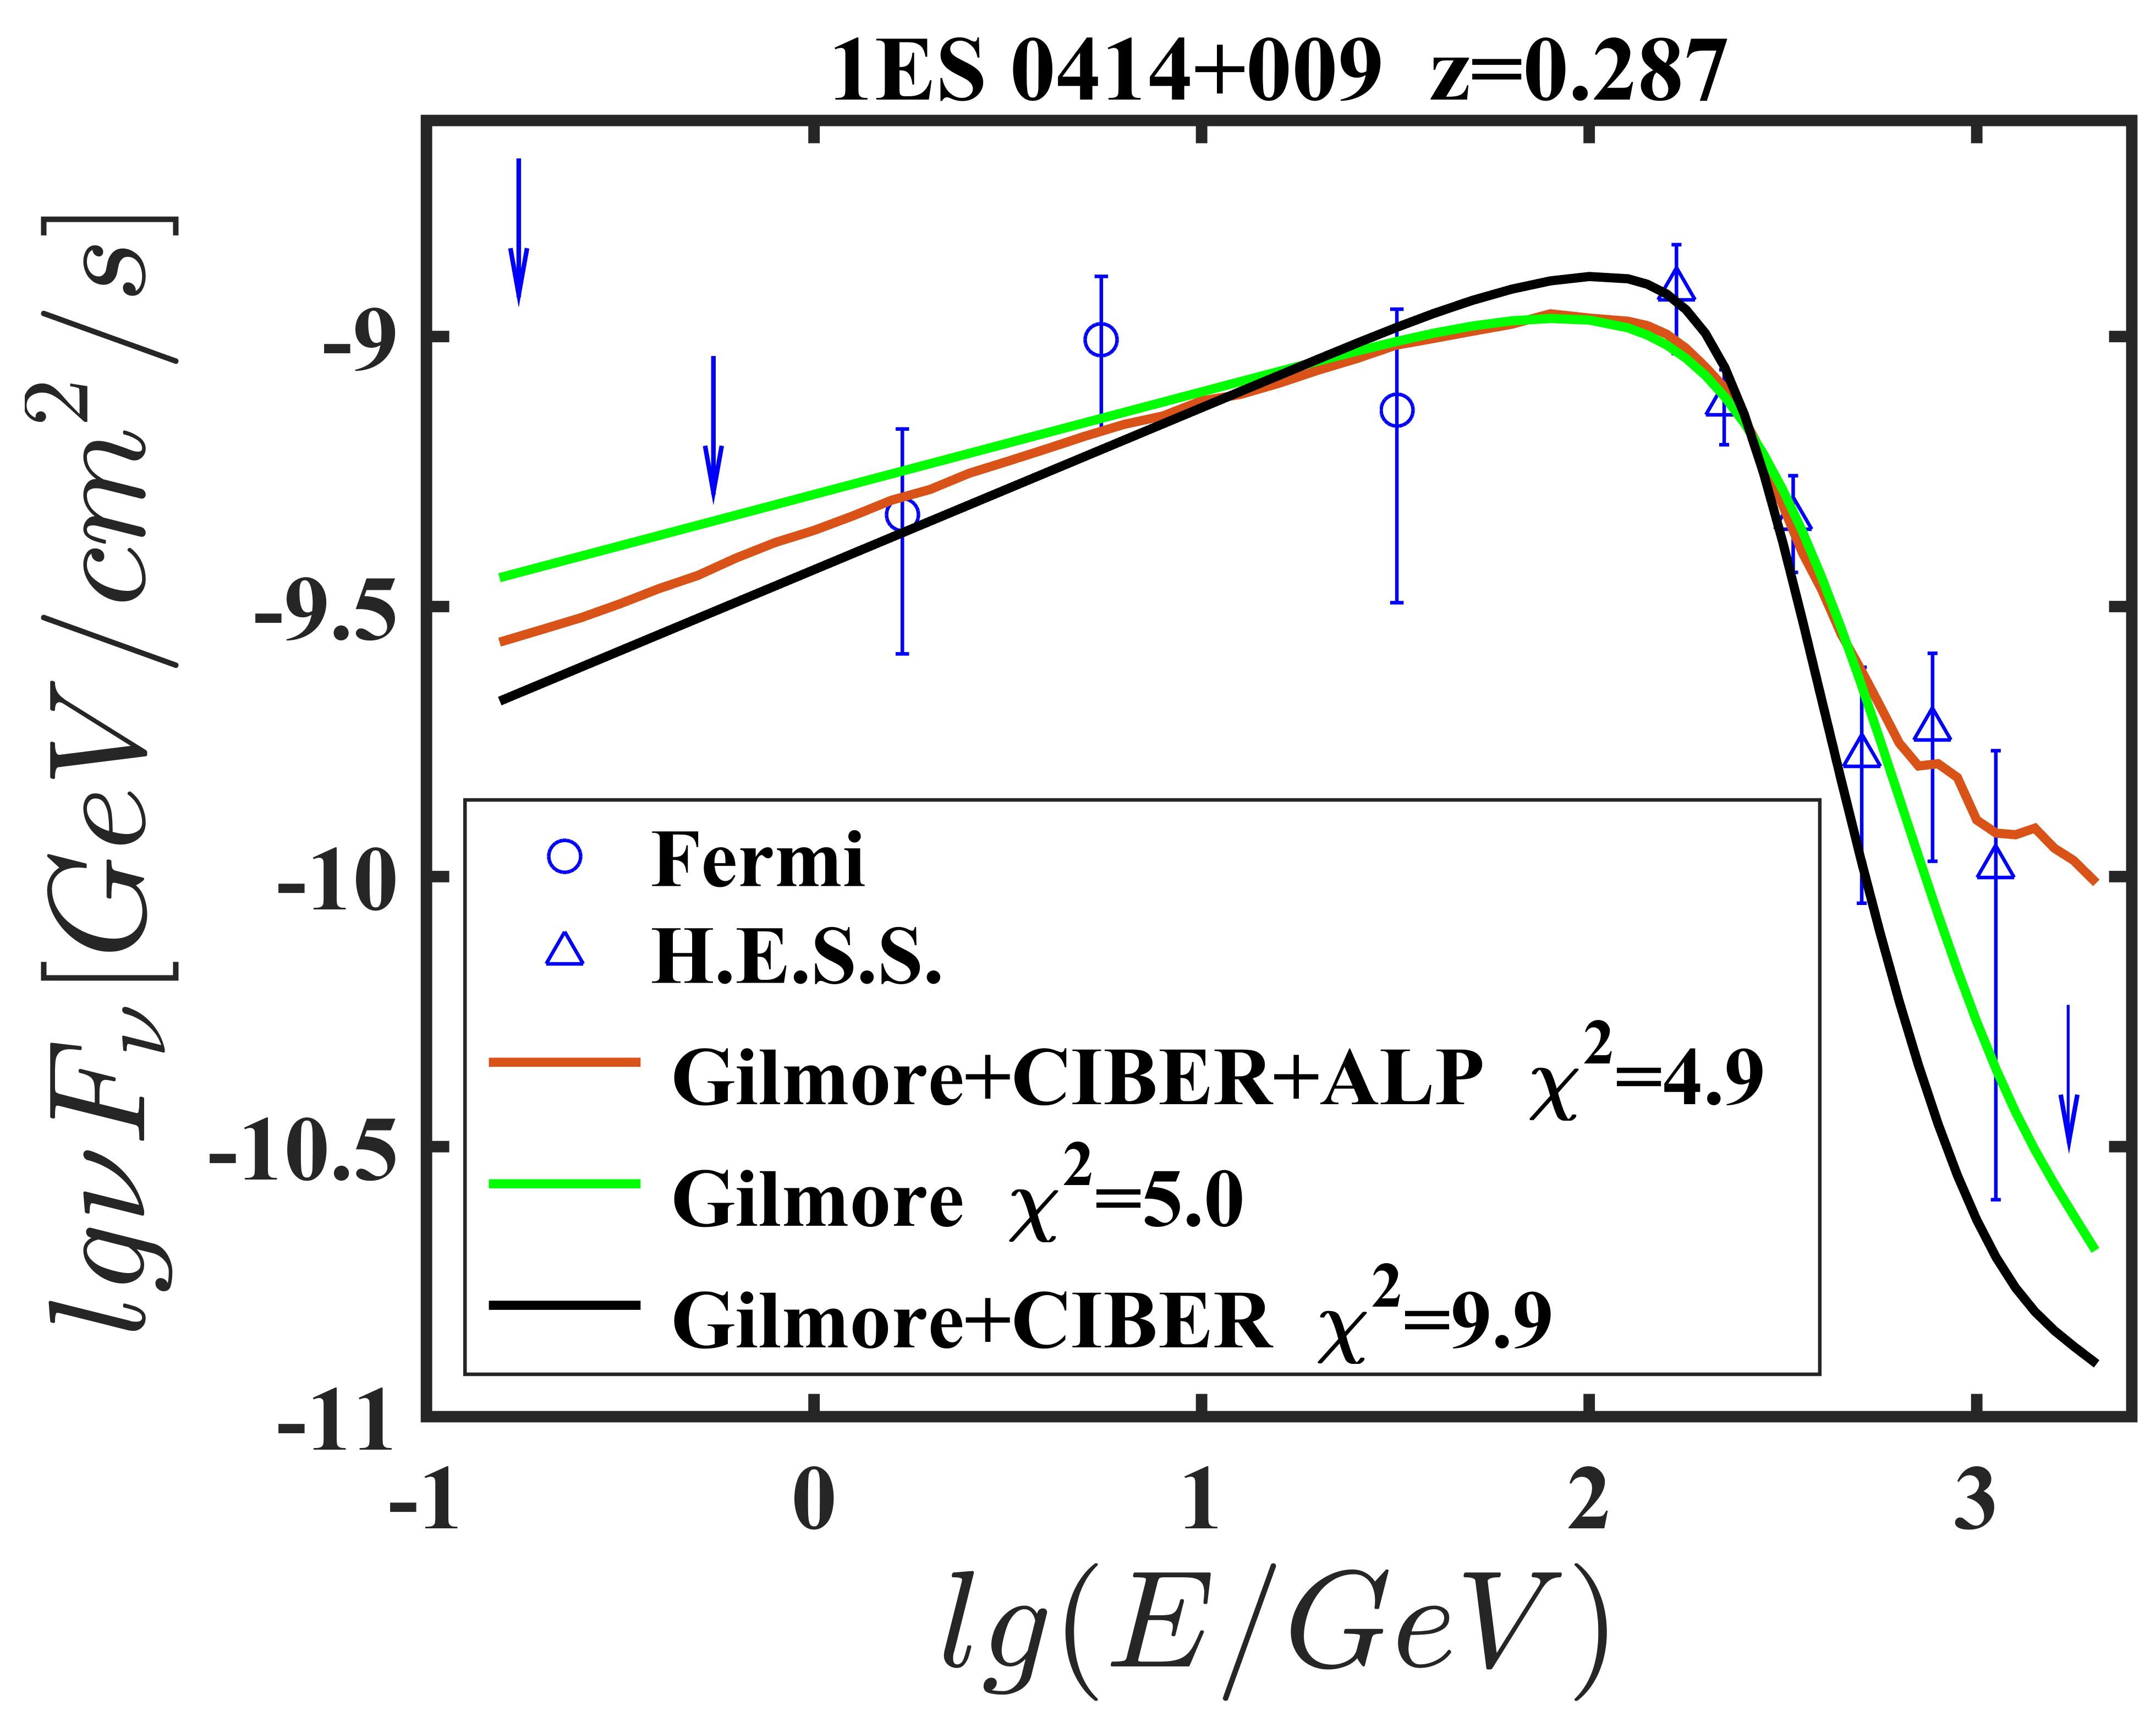
Fig. 4 (left) shows the SED of PKS 1424+240(2009), overlaid with the three best-fitting spectra according to Eq.(13): GEBL (green line), GC (black line) and GCA(red line). Fig. 4 (right) reveals that the ALP/photon conversion in extragalactic medium plays an important role in shaping the harness of theoretical spectrum at VHE. Obviously the GC model cannot fit the VHE spectrum well, and the GCA model achieve an acceptable fitting. This improvement to the goodness of fit () can be reflected quantitatively from the resulting : achieve with relative to that from GC model spectrum. Upon closer inspection of the SED, the improvement is a result of photon/ALP conversion in jet and extragalactic space during the beam propagation, where a part of HE photons damping due to the conversion but partial VHE photons avoid to be absorbed by the EBL soft photons and lead to a hard spectrum at VHE. A similar situation can be seen in Fig. 5 except for the spectra 1ES 0347-121 , 1ES 0229(2009) and PKS 2155-304(2008). In these spectra the goodness of fit can not be improved for =0.1 neV and =4.9. Note that, this modification by the photon/ALP mixing is directly linked to the strength of the transversal magnetic field along the line of sight and the jet parameters.
For 1ES 1011+496 and 1ES 1218+304, the theoretical spectra can not fit the observed spectra well even though the goodness of fit is significantly improved in comparison to the GC model. As a result, these two sources contribute about a third of the of the models including CIBER EBL, see Table 2. This is mainly because the effect of excessive absorption on the spectra at hundreds of GeV by the CIBER EBL photon can not offset effectively through the photon/ALP mixing. It is worth emphasizing that the data quality of these sources is relatively high.
Compare to the GEBL model, the GCA model spectra achieve a significant better fit to only three spectra, i.e. PKS 1424+240, 1ES 1101-232, and the former achieve a acceptable fit for each spectrum, see Fig. 4 and Fig. 5.
| Source | significance | ||||
| PKS 2155-304(2008) | 9.81(9) | 5.22(9) | 5.74(9) | 10.50(9) | - |
| PKS 2155-304(2013) | 34.96(23) | 34.96(23) | 32.13(23) | 34.23(23) | - |
| 1ES 0229+200(2005) | 10.48(8) | 11.60(8) | 10.56(8) | 10.74(8) | - |
| 1ES 0229+200(2009) | 5.30(10) | 8.20(10) | 8.80(10) | 5.11(9)111The best-fitting intrinsic spectrum is LP in this model while other models choose PL, so that the DOF here is 9, not 10. | - |
| 1ES 1218+304 | 15.24(12) | 49.52(12) | 23.10(12) | 16.10(12) | - |
| 1ES 1101-232(2004) | 8.64(16) | 9.28(16) | 7.42(16) | 8.12(16) | - |
| 1ES 0347-121 | 2.94(7) | 3.78(7) | 6.35(7) | 4.00(7) | - |
| 1ES 1011+496 | 14.52(11) | 59.84(11) | 25.74(11) | 18.09(11) | - |
| 1ES 0414+009 | 4.97(7) | 9.87(7) | 4.10(7) | 5.05(7) | - |
| OT081 | 8.55(9) | 10.62(9) | 9.66(9) | 7.63(9) | - |
| PKS 0477-439 | 15.10(10) | 27.50(10) | 17.84(10) | 12.96(10) | - |
| PKS 1424+240(2009) | 7.50(10) | 10.90(10) | 5.68(10) | 4.96(10) | - |
| PKS 1424+240(2013) | 14.88(12) | 22.92(12) | 11.70(12) | 13.20(12) | - |
| Combined | 152.89(144) | 264.21(144) | 168.82(142) | 151.29(141) | 7.60 |
| 1.06 | 1.83 | 1.19 | 1.07 | - |
V.2 the best model
The combined data of the resulting minimum value is calculated and the hypotheses and is tested with the statistic , see Table. 2. The overall fit is improved from the combined minimum to . The maximal statistical significance under the hypotheses is corresponding to the best-fitting values of =0.1 neV and =4.9, and the minimum one approaches for the worst-fitting values =2.5 neV and =10. Therefore, the hypothesis can be rejected at 95% C.L.
The GA ()and GCA () model can fit the observations well overall with =1.07 and =1.19 respectively, see Table. 2. But both of them are larger than that (=1.06) from the GEBL model (). Therefore, we accept the null hypothesis for any values in the region . This result demonstrates that the gamma-ray observations of distant blazars prefer the null hypothesis , i.e., the Gilmore EBL model.
If we only considered the hard spectra PKS 1424+240 and 1ES 1101-232, almost the entire region is favored at 95% C.L. with respect to the hypothesis. However, as pointed out by Biteau et al. Biteau2015 , it is possible that the so called spectral hardness or even upturn at the highest energy appeared in some special blazars is resulted from leaving out the systematical uncertainty in the analysis. If taking it into account in the calculation of , the theoretical spectra with GEBL should fit the observations better.
V.3 Discussion
In this subsection, we will mainly discuss the ALP/photon conversion (a) introduced above, the minimal CIBER EBL, reasonableness about testing the lower bound of the nominal CIBER EBL, other possible solutions to the tension among the observational data, systematic uncertainties and data quality.
| Source | 111Here, the lower limit of two statistical uncertainty and a systematic error of the CIBER data are taken as done with Ref. Kori2017 , so the resultant has small difference with the case a statistical uncertainty is adopted in Table 2. | significance | |||
| minimum CIBER | |||||
| PKS 2155-304(2008) | 4.86(9) | 4.62(9) | 13.16(9) | 34.50(23) | - |
| PKS 2155-304(2013) | 34.96(23) | 30.03(23) | 31.50(23) | 4.77(9) | - |
| 1ES 0229+200(2005) | 10.96(8) | 9.60(8) | 10.50(8) | 11.52(8) | - |
| 1ES 0229+200(2009) | 7.00(10) | 7.68(10) | 6.72(9)222The best-fitting intrinsic spectrum is LP in this model while other models choose PL, so that the dof here is 9, not 10. | 5.70(9) | - |
| 1ES 1218+304 | 42.24(12) | 39.90(12) | 17.90(12) | 22.68(12) | - |
| 1ES 1101-232(2004) | 8.64(16) | 8.16(16) | 7.42(16) | 7.52(16) | - |
| 1ES 0347-121 | 3.43(7) | 3.40(7) | 6.35(7) | 4.06(7) | - |
| 1ES 1011+496 | 50.82(11) | 63.00(11) | 15.21(11) | 29.37(11) | - |
| 1ES 0414+009 | 9.38(7) | 6.80(7) | 3.40(7) | 6.79(7) | - |
| OT081 | 10.44(9) | 9.66(9) | 7.98(9) | 10.53(9) | - |
| PKS 0477-439 | 26.80(10) | 24.00(10) | 20.00(10) | 23.30(10) | - |
| PKS 1424+240(2009) | 10.07(10) | 8.16(10) | 4.24(10) | 9.70(10) | - |
| PKS 1424+240(2013) | 21.84(12) | 12.8(12) | 11.50(12) | 18(12) | - |
| Combined | 241.83(144) | 224.23(142) | 151.63(141) | 188.44(144) | 2.60 |
| 1.68 | 1.58 | 1.08 | 1.31 | - |
In the conversion scenario (a), the ALP/photon conversion in IGMF is negligible, whereas the conversion in ICMF would be taken into account so that more free parameters will be introduced. Nevertheless, for simplicity, we do not consider the structure of magnetic fields in the source, i.e., the magnetic fields are assumed to be homogeneous in the jet and in the cluster, thus the relevant conversion probability that the emitted gamma-ray photons are converted to ALPs can be calculated simply by Eq. 9. The size of conversion region of source is assumed to be 10 kpc and the magnetic field , which can satisfy the Hillas criterion for accelerating the ultrahigh-energy cosmic rays Kori2017 ; Hooper2007 . For an efficient conversion under this assumption, we consider the ALP-parameters region . The upper limit of are given by the constraints of the CAST experiment CAST2017 . The lower limit of is result from Eq. 10 in the condition of an inefficient conversion in IGMF for and the constrained by -ray Fermi2016 observations. Since the phase of the sine function in Eq. 9 is larger than 1 rad for the considered , and r, i.e., , we take the average value for the square of the sine function to smear out the rapid-oscillatory features of the probability function Kori2017 ; Hooper2007 .
As done above, we perform a combined global fit to the spectra with the GCA and GA model without taking into account the conversion in IGMF. The results are shown in Table 3. The goodness of fit between the models including CIBER EBL is improved only with a maximal significance of due to the introduction of ALP. The minimum (1.08) and (1.58) are larger than those (1.07 and 1.19) of the models taking into account the conversion in IGMF respectively. Therefore the observations for our sample are in favor of the conversion scenario with IGMF between the two mechanisms for the GC model. The goodness of fit with ALP is also inferior to that with Gilmore EBL model. So we still accept the null hypothesis . Part of the reason for this difference is that the rapid-oscillatory features of the probability function for the conversion in JMF are smeared out.
Compared to Ref. Kori2017 , the values of fitting to the spectrum of 1ES 1101-232 with ALP-relevant model are comparable ( 0.6, for and ), even though we consider the structure of GMF.
The tension between the minimal CIBER EBL and the gamma-ray spectra is worth to be discussed. We take average of the data and test it. The minimum is 1.31, see Table 3, and is larger than those of the GEBL and models with ALP. It is mainly in tension with the observations of 1ES 1218+304, 1ES 1011+496 and PKS 0447-439. The minimal CIBER EBL has been recently studied by Ref. Korochkin2019 .
Reasons about testing the lower bound of the nominal CIBER EBL. The best-fit value of locates at the edge of the excluded region by observations. If we take the average value, then the higher value would be required to offset the increased EBL absorption, and the best-fit would fall into the excluded region. On the other hand, the absorption curve around 1 TeV would become more concave. As a result, the challenge for the ALP/photon coupling mechanism to explain the observation or mimic the absorption function of GEBL model successfully would increase greatly. The relation hints higher CIBER EBL is not preferred by the coupling mechanism. Therefore testing the lower bound could largely represent the whole nominal CIBER EBL to draw a consistent conclusion.
An alternative and possible explanation for the spectral hardening (e.g. PKS 1424+240 Zheng2013 , 1ES 1101-232 Essey2013 ; Cerruti2017 ) is the “hadronic cascade model”, in which an additional -ray emission component due to the interactions of EBL or CMB photon with proton Cosmic Rays originating from the blazar along the line of sight lead to the spectral hardening toward the highest energy Essey2010 ; Dzhatdoev2017 . However, it is only appropriate for some special sources with and long time variability Prosekin2012 ; Galanti2015 , thus the combination of this mechanism and CIBER EBL cannot explain the -ray observations of all the blazars. Another model beyond traditional physics is lorentz invariance violation (LIV). But it may lead to a significant reduction of the - opacity for photons with energies 10 TeV and can only explain the observed spectra of some special blazars Abdalla2018 ; Tavecchio2016 ; Jacob2008 .
We discuss the sources of systematic uncertainties of the study now. The photon survival probability are sensitive to the jet parameters and , thus the uncertainties of these values have a significant impact on the total systematic uncertainties of the relevant result, mainly the best-fit ALP parameters. Therefore we do not aim at constraining the ALP parameters. The values of these jet parameters can be constrained in principle with multi-frequency observations and theoretical models.
The uncertainty resulted from the choice of intrinsic spectral models and the uncertainty of the observed data from the telescope, e.g. energy calibration, have an important contribution to the error of the result. The choice of the observed spectra included in the sample is biased by the criteria (e.g. the highest intrinsic energy GeV) thus selecting preferentially objects with hard spectra, e.g. the three hard spectra PKS 1424+240 and 1ES 1101-232. Some of them are usually hard to explain by the traditional absorption model e.g. Refs. Abdalla2018 ; Aharonian2007 ; Essey2012 and seem to prefer the model with ALP. As a result, the sample is biased towards hypothesis (with ALP) compared to . However this bias should not change our conclusion, as it prefers the hypothesis instead.
It is not enough for 98 random realizations to reduce the uncertainty effectively in the stochastic simulation. But the curves of theoretical spectra at VHE almost displayed a smooth shape, which illustrates the mean of 98 realizations have already closed to convergence.
The data quality is important for our study. Few of the for the individual spectrum is less than 0.5, e.g. for 1ES 0347-121, which usually means the model have over-constrained for this spectrum. The cause for this problem lies in fewer data points and larger data uncertainty overall. To eliminate this adverse effect, we analyze the 13 spectra on the whole leading to the combined and a robust result . Moreover, though our result suggests that we have no need to introduce the ALP and support the recent EBL model, it is based on our sample that partly reflects the ability of current instrumental measurement. The upcoming telescopes, e.g. CTA and LHAASO, would provide more high quality data including that from more distant sources. Our results would be further tested in the future with more precise data and information on intrinsic physic of the source such as the intrinsic spectrum and the magnetic field structures of jet.
VI summary and conclusion
ALP is expected to potentially resolve the tension between the VHE -ray observations of distant blazars and the CIBER EBL Kori2017 , see Fig. 1. We aim to probe whether the excess radiation of CIBER is a new EBL component, in the background that the recent EBL models are repeatedly tested in many literatures and are generally agreed with the -ray observations, see e.g., Refs. Fermi2012 ; Gong2013 ; HESS2013 ; VERITAS2015 ; Biteau2015 ; MAGIC2016 ; Armstrong2017 ; Desai2019 . Hence, we build four absorption models, i.e., GCA (Gilmore EBL+CIBER+ALP), GA (Gilmore EBL+ALP), GC (Gilmore EBL+CIBER) and GEBL (Gilmore EBL).
In the model including ALP, the ALP/photon beams cross four magnetic-field regions on their propagation path up to Earth: jet, intra-cluster, extragalactic space and MW galaxy, see Fig. 2. For an efficient conversion at VHE in IGMF and due to the observation constraints on ALP parameter space Montanino2017 , we consider the ALP parameter range for which the conversion in intra-cluster could be neglected, see Fig. 3. The conversion, in IGMF obtained from large-scale cosmological simulations and in large scale coherent JMF, is important to shape the hardness of spectrum at VHE, see Fig. 2 and Fig. 4.
A combined global fit is performed to the observed spectra with the absorption models together with the chosen intrinsic spectra, minimizing the . Three types of the best-fitting spectra are show in Fig. 4 and Fig. 5. The hypotheses involving the four absorption models are tested based on their combined minimum of the 13 spectra. The goodness of fit for the GC model can be improved with a significance of if and , see Table 2. However, the goodness of fit either given by the GCA model or GA model is still inferior to that with GEBL, i.e. .
We also discuss the complementary conversion scenario: the ALP/photon conversion occurs in the gamma-ray source where the magnetic fields in the blazar jet and intra-cluster are treated as homogeneous and in one zone, and then back-conversion occurs in the Milky Way. We find the maximum improvement to the goodness of fit after introducing the ALP/photon mixing mechanism is significant with 2.6 , which is inferior to that in the scenario involving the IGMF, see Table 3. The goodness of fit from the GEBL model is also the best among the four models.
Though four of the sample are traditional hard spectra so that the sample selection is biased toward the model with ALP, the result more prefer the GEBL model overall instead. Other possible mechanisms for explaining the spectral harding such as LIV and hadronic cascade of cosmic rays are unlikely generally compatible with the TeV -ray observations of extragalactic sources under the absorption of CIBER EBL.
We conclude that the ALP/photon mixing mechanism can effectively alleviate the tension between the -rays observations and the CIBER data. In particular, the spectra of PKS 1424+240 and 1ES 1101-232 are best explained by this mechanism if the systematic uncertainties on the measured flux are neglected. However, the Gilmore EBL attenuation can, on the whole, explain the -ray observations of our samples, and it is more consistent with the observations than the model including ALP under our magnetic scenario. Hence, in a statistical sense, assuming the existence of the ALP to alleviate the tension is not required, and the CIBER excess over the EBL models is less likely to be a new EBL component.
The upcoming CTA and LHAASO would provide more precise data on VHE -rays from distant blazar. On the other hand, detecting the NIR EBL by an instrument in deep space where zodiacal light foreground is absent or with precise multi-band fluctuation measurements would be possible in the future CIBER2017 . These two improvements will help to clarify the uncertainties related to the origin of CIBER EBL and test our conclusion.
Acknowledgements.
We thank anonymous referees for useful comments and suggestions. The author is indebted to F. Vazza for supplying the data sets of simulated extragalactic magnetic fields. We thank Y. F. Liang for comments on an earlier version of the draft. W.P.L. acknowledges support from the National Key Program for Science and Technology Research and Development (2017YFB0203300), the National Key Basic Research Program of China (No. 2015CB857001), and the NSFC Grant 11473053. P.H.T is supported by the National Natural Science Foundation of China (NSFC) Grants 11633007, 11661161010, and U1731136. W.S.Z. is supported by the NSFC Grant 11673077 and 11733010.References
- (1) M, G, Hauser and E, Dwek, Annu. Rev. Astron. Astrophys. 39, 249 (2001).
- (2) K. Sano, K. Kawara, S. Matsuura et al., Astrophys. J. 811, 77(2015).
- (3) K. Sano, S. Matsuura, K. Tsumura et al., Astrophys. J. 818, 72(2016).
- (4) T. Matsumoto, M. G. Kim, J. Pyo, and K. Tsumura, Astrophys. J. 807, 57(2015).
- (5) K. Tsumura, T. Matsumoto, S. Matsuura et al., Publ. Astron. Soc. Jan. 65, 121(2013).
- (6) S. Matsuura, T. Arai, J. Bock et al., Astrophys. J. 487, 837(2017).
- (7) R. C. Keenan, A. J. Barger, L. L. Cowie et al., Astrophys. J. 723, 40(2010).
- (8) A. Franceschini, G. Rodighiero, and M. Vaccari, Astron. Astrophys. 487, 837 (2008).
- (9) A. Dominguez, J. R. Primack, D. J. Rosario et al., Mon. Not. R. Astron. Soc. 410, 2556(2011).
- (10) T. M. Kneiske and H. Dole, Astron.Astrophys. 515, A19 (2010).
- (11) J. D. Finke, S. Razzaque, and C. D. Dermer, Astrophys. J. 712, 238 (2010).
- (12) R. C. Gilmore, R. S. Sommerville, J. R. Primack et al., Mon. Not. R. Astron. Soc. 422, 3189 (2012).
- (13) F. W. Stecker, S. T. Scully, M. A. Malkan, Astrophys. J. 827, 6(2016).
- (14) A. I. Nikishov, Sov. Phys. JETP 393, 14(1962).
- (15) F. Aharonian et al. (H.E.S.S. Collaboration), Nature(London) 440,1018(2006).
- (16) E. Dwek and A, Kusenko, Astropart. Phys. 43, 112 (2013).
- (17) L. Costamante, Int. J. Mod. Phys. D. 22, 1330025 (2013).
- (18) J. Albert et al. (MAGIC Collaboration), Science. 320, 1752 (2008).
- (19) M. Ackermann et al. (Fermi-LAT Collaboration), Science. 338, 1190(2012).
- (20) D. Horns and M. Meyer, J. Cosmol. Astropart. Phys. 02, 033 (2012).
- (21) W. Essey and A. Kusenko, Astrophys. J. Lett. 751, L11 (2012).
- (22) G. Rubtsov and S. Troitsky, JETP Lett. 100, 355(2014).
- (23) G. Galanti, M. Roncadelli, A. D. Angelis et al., arXiv:1503.04436.
- (24) A. Korochkin, G. Rubtsov, and S. Troitsky, arXiv:1810.03443.
- (25) J. Biteau and D. A. Williams, Astrophys. J. 812, 60(2015).
- (26) A. Dominguez and M. Ajello, Astrophys. J. Lett. 813, L34(2015).
- (27) A. M. Olaizola, A. Domínguez, V. F. Ramazani et al., PoS. 604, ICRC(2017).
- (28) H. Abdalla et al. (H.E.S.S. Collaboration), Astron. Astrophys. 606, A59 (2017).
- (29) W. Zhong, W. G. Liu, and Y. G. Zheng, Astrophysics. Space Sci. 363, 179 (2018).
- (30) S. Abdollahi et al. (Fermi-LAT Collaboration), Science. 362, 1031(2018).
- (31) A. Desai, K. Helgason, M. Ajello et al., arXiv:903.03126.
- (32) E. Pueschel,ICRC(2019)arXiv:1908.04163.
- (33) V. A. Acciari et al. (MAGIC Collaboration), Mon. Not. R. Astron. Soc. 486, 3(2019).
- (34) H.Abdalla and M. Bottcher, Astrophys. J. 835, 237(2018).
- (35) Y. Gong and A. Cooray, Astrophys. J. Lett. 772, L12(2013).
- (36) A. Abramowski et al. (H.E.S.S. Collaboration), Astron. Astrophys. 550, A4 (2013).
- (37) A. U. Abeysekara et al. (VERITAS Collaboration), Astrophys. J. 815, L22(2015).
- (38) M. L. Ahnen et al. (MAGIC Collaboration), Astron. Astrophys. 590, A24 (2016).
- (39) T. Armstrong, A. M. Brown, and P. M. Chadwick, Mon. Not. R. Astron. Soc. 470, 4089(2017).
- (40) O. E. Kalashev, A. Kusenko, and E. Vitagliano, Phys. Rev. D. 99, 023002 (2019).
- (41) K. Kohri and H. Kodama, Phys. Rev. D. 96, 051701(R)(2017).
- (42) J. Jaeckel and A. Ringwald, Annu. Rev. Nucl. Part. Sci. 60, 405(2010).
- (43) G. G. Raffelt and L. Stodolsky, Phys. Rev. D. 37, 1237(1988).
- (44) A. De Angelis, M. Roncadelli, and O. Mansutti, Phys. Rev. D. 76, 121301(R)(2007).
- (45) A. Mirizzi and D. Montanino, J. Cosmol. Astropart. Phys. 12, 004(2009).
- (46) A. Dominguez, M. A. Sanchez-Conde, and F. Prada, J. Cosmol. Astropart. Phys. 11, 020(2011).
- (47) A. De. Angelis, G. Galanti, and M. Roncadelli, Phys. Rev. D. 87, 109903(E) (2013).
- (48) M. Meyer, D. Horns, and M. Raue, Phys. Rev. D. 87, 035027 (2013).
- (49) S. Troitsky, Phys. Rev. D. 93, 045014 (2016).
- (50) F. Tavecchio, M. Roncadelli, and G. Galanti, Phys. Lett. B. 744, 375 (2015).
- (51) R. Xue, D. Luo, Z. R. Wang et al., Mon. Not. R. Astron. Soc. 463, 3038 (2016).
- (52) D. Montanino, F. Vazza, A. Mirizzi et al., Phys. Rev. Lett. 119, 101101 (2017).
- (53) L. A. Anchordoqui,arXiv:1807.09645.
- (54) A. De Angelis, M. Roncadelli, and O. Mansutti, Phys. Lett. B. 659, 847(2008).
- (55) M. Meyer, D. Montanino, and J. Conrad, J. Cosmol. Astropart. Phys. 09, 003 (2014).
- (56) J. Majumdar, F. Calore, and D. Horns, J. Cosmol. Astropart. Phys. 04, 048 (2018).
- (57) R. A. Bernstein, Astrophys. J. 666, 663(2007).
- (58) L. R. Levenson, E. L.Wright, and B. D, Johnson, Astrophys. J. 666, 34(2007).
- (59) F. Tavecchio, M. Roncadelli, G. Galanti et al., Phys. Rev. D. 86, 085036(E) (2012).
- (60) E. Masaki, A. Aoki, and Jiro Soda, Phys. Rev. D. 96, 043519 (2017).
- (61) E. P. Farina, M. Fumagalli, R. Decarli et al., Mon. Not. R. Astron. Soc. 470, 4089(2015).
- (62) C. Zhang, Y. F. Liang, S. Li et al., Phys. Rev. D, 97, 063009 (2018).
- (63) R. E. Pudritz, M. J. Hardcastle, and D. C. Gabuzda, Space Sci. Rev. 169, 27(2012).
- (64) F. Aharonian et al. (H.E.S.S. Collaboration), Astrophys. J. 696, L2(2009).
- (65) D. A. Sanchez, B. Giebels, D. Zaborov et al., 5th Fermi Symposium: Nagoya, Japan: 20-24 Oct, 2014.
- (66) A. M. Taylor, I. Vovk, and A. Neronov et al., Astron. Astrophys. 529, A144(2011).
- (67) V. A. Acciari et al. (VERITAS Collaboration), Astrophys. J. Lett. 709, 2(2014).
- (68) Y. T. Tanaka, L. Stawarz, and J. Finkeet al., Astrophys. J. Lett.787, 155(2014).
- (69) F. Aharonian et al. (H.E.S.S. Collaboration), Astron. Astrophys. 473, L25 (2007).
- (70) A. Abramowski et al. (H.E.S.S. Collaboration), Astron. Astrophys. 538, A103 (2012).
- (71) F. Schüssler, M. Seglar-Arroyo, M. Arrieta et al., PoS, ICRC(2017).arXiv:1907.11443.
- (72) I. Vovk, A. M. Taylor, D. Semikoz et al., Astrophys. J. Lett. 747, L14(2012).
- (73) F. Aharonian et al. (H.E.S.S. Collaboration), Astron. Astrophys. 475, L9 (2007).
- (74) E. Aliu et al. (VERITAS Collaboration), Astrophys. J. 782, 1 3(2014).
- (75) A. V. Belikov, L. Goodenough, and D. Hooper, Phys. Rev. D. 83, 063005 (2011).
- (76) F. Aharonian et al. (H.E.S.S. Collaboration), Astron. Astrophys. 470, 475 (2007).
- (77) F. Aharonian et al. (H.E.S.S. Collaboration), Astron. Astrophys. 473, L25 (2007a).
- (78) W. Essey, A, Kusenko, Astropart. Phys. 57, 30 (2013).
- (79) A. A. Abdo et al. (Fermi-LAT Collaboration), Astrophys. J. 726, 43(2010).
- (80) S. Archambault et al. (VERITAS Collaboration), Astrophys. J. 785, L16(2014).
- (81) L. Feretti, G. Giovannini, F. Govoni et al., Astron. Astrophys. Rev. 20, 54 (2012).
- (82) M. Ajello et al. (Fermi-LAT Collaboration), Phys. Rev. Lett. 116, 161101(2016).
- (83) A. C. Rovero, H. Muriel, C. Donzelli et al., Astron. Astrophys. 589, A92 (2016).
- (84) H. Muriel, C. Donzelli, A. C. Rovero et al., Astron. Astrophys. 574, A101(2016).
- (85) P. Blasi, S. Burles, and A. V. Olinto, Astrophys. J. 514, L79(1999).
- (86) P. A. R. Ade et al. (Planck Collaboration), Astron. Astrophys. 594, A19(2016).
- (87) M. S. Pshirkov, P. G. Tinyakov, and F. R. Urban, Phys. Rev. Lett. 116, 191302(2016).
- (88) G. L. Bryan et al. (ENZO Collaboration), Astrophys. J. Suppl. Ser. 211, 19(2014).
- (89) see https://cosmosimfrazza.myfreesites.net/radio-web.
- (90) A. Dobrynina, A. Kartavtsev, and G. Raffelt, Phys. Rev. D. 91, 083003 (2015).
- (91) R. Jansson and G. R. Farrar, Astrophys. J. 757, 14(2012).
- (92) C. M. Urry and P. Padovani, Publ. Astron. Soc. Jan. 107, 803(1995).
- (93) see http://tevcat.uchicago.edu/.
- (94) A. Furniss,D. A. Williams,C. Danforth et al., Astrophys. J. Lett. 768, L31(2013).
- (95) S. Paiano, M. Landoni, R. Falomo et al., Astrophys. J. 837, 144(2017).
- (96) A. Korochkin, A. Neronov, and D. Semikoz, arXiv:1906.12168.
- (97) Y. G. Zheng and T. Kang, Astrophys. J. 764, 113(2013).
- (98) W. Essey, A, Kusenko, Astrophys. J. 33, 81 (2010).
- (99) M. Cerruti, W. Benbow, X. Chen et al., Astron. Astrophys. 606, A68 (2017).
- (100) T. A. Dzhatdoev, E. V. Khalikov, A. P. Kircheva et al., J. Phys.: Conf. Ser 798, 012002(2017).
- (101) http://physics.ucsc.edu/joel/EBLdata-Gilmore2012.
- (102) F. Tavecchio and G, Bonnoli, Astron. Astrophys. 585, A25 (2016).
- (103) U. Jacob and T. Piran, Phys. Rev. D. 78, 124010(2008).
- (104) O. Menaa and S. Razzaque, J. Cosmol. Astropart. Phys. 11, 023 (2013).
- (105) M. Simet, D. Hooper and P. D. Serpico, Phys. Rev. D. 77, 063001 (2008).
- (106) D. Hooper and P. D. Serpico, Phys. Rev. Lett. 99, 231102 (2007).
- (107) V. Anastassopoulos et al. (CAST Collaboration), Nature. Phys. 13, 584(2017).
- (108) K. A. Hochmuth and G. Sigl, Phys. Rev. D. 76, 123011 (2007).
- (109) F. Vazza, M. Brüggen, C. Gheller et al., Class. Quantum. Grav. 34, 234001(2017).
- (110) A. Prosekin, W. Essey, A. Kusendo and F. Aharonian, Astrophys. J. 757, 183(2012).
Appendix A fitting Results for the other 12 spectra
