Analysis of Cardiovascular Changes Caused by Epileptic Seizures in Human Photoplethysmogram Signal
Abstract
Objectives: This study examines human Photoplethysmogram (PPG) along with Electrocardiogram (ECG) signals to study cardiac autonomic imbalance in epileptic seizures. The significance and the prevalence of changes in PPG morphological parameters have been investigated to find common patterns among subjects. Alterations in cardiovascular parameters measured by PPG/ECG signals are used to train a neural network based on LSTM for automatic seizure detection. Methods: Electroencephalogram (EEG), ECG, and PPG signals from 12 different subjects ( 8 males;4 females;age 34.3 13.8) were recorded including 57 seizures and 101 hours of inter-ictal data. 12 PPG features significantly changing due to epileptic seizures were extracted and normalized based on a proposed z-score metric. 7 feature are heart rate variability related and 5 features hemodynamic related. Results: A consistent pattern of ictal change was observed for all the features across the subjects/seziures. The proposed seizure detector is subject independent and works for both nocturnal and diurnal seizures. With an average of 0.52 false alarms per hour, positive predictive value of and sensitivity of , the new proposed hemodynamic based seizure detector shows improvement over the the heart rate variability based detector. Conclusion: The cardiac autonomic imbalance due to seizure manifests itself in variations of peripheral hemodynamics measured by PPG signal, suggesting vasoconstriction in limbs. These variations can be used on a consumer seizure detecting devices with optical sensors for seizure detection. Significance: The stereotyped pattern is common among all the subjects which can help understand the mechanism of cardiac autonomic imbalance induced by epileptic seizures.
Autonomic nervous system, Photopletysmogtam, Electrocardiogram, Epileptic seizures.
1 Introduction
Epilepsy is a chronic disease affecting more than
50
million people world wide [1]. In majority of
patients, the seizures are controlled using medication; however,
one-third of
the patients still do not respond to treatments and
continue to have
seizures. Although epilepsy is considered a
neurological disorder, several studies have reported autonomic
imbalance and cardiovascular dysfunction during ictal and postictal
period [2]. In fact, Sudden Unexpected Death in
Epilepsy (SUDEP) has been attributed to cardiovascular and pulmonary
dysfunction induced by uncontrolled seizures [3].
Recently,
epilepsy is considered as a set of coexisting comorbids,
where
Electroencephalography (EEG) abnormal waves can be preceded by other
extracerebral
manifestations [4].
A
personal diary of seizures plays a key role in clinical
diagnosis
and research. However, keeping a report of the seizures is
not
trivial, especially for patients who have seizures during sleep
[5]. In addition, since the patient may lose consciousness
during a seizure, timely intervention by a caregiver may be
required.
In order to have an accurate record of seizures and
identify the overlapping symptoms, new seizure detecting devices have
adopted multimodal data fusion techniques incorporating small sensors
such as
electrodermal[6, 7], accelorometer [8], electromyogram [9], and electrocardiogram (ECG)
[10, 11, 12, 13, 14]. The use of multimodal sensors
facilitates automatic seizure detection without using bulky and
uncomfortable EEG caps. However, the performance of these techniques are dependent on the seizure type [11]. Specifically electrodermal, accelorometer, and electromyogram sensors are used for generalized tonic-clonic seizures and their performance degrades for partial seizures.
Ictal tachycardia is the most prevalent autonomic imbalance
manifestation observed in 82% of seizures [15].
Ictal tachycardia
happens as a result of increase in sympathetic
tone. However, in less
than 5% of cases, parasympathetic activity
can also predominate,
leading to bradycardia
[16]. Studies suggest a consistent and
stereotyped
progression of autonomic dynamics leading to heart rate
variability (HRV) during and even before the
seizure onset [17].
The HRV due to autonomic imbalance has been
exploited for seizure prediction a few seconds before the seizure
onset [18]. In general, the HRV-based seizure detectors perform poorly in terms of high false alarm rates and low sensitives compared to EEG-based detectors [10]. Besides heart rate variability, other less
prevalent cardiac conduction
abnormalities are inconsistent with
respect to age, laterization,
and seizure foci. Abnormalities such
as atrial fibrillation, bundle
branch block, atrial premature
depolarization, asystole, and
ST-segment elevation have also been
reported in total of less than
14% of investigated cases and were not used for seizure detection
[2].
In addition to cardiac conduction
abnormalities, the excess
release of catecholamines during seizure
will influence the vascular
function and hemodynamics.
Catecholamines such as norepinephrine are types of
neurotransmitters released to act as
anticonvulsant in ictal phase
[19]. These
neurotransmitters are responsible for a
series of autonomic responses
such as blood flow manipulation. The
blood perfusion is controlled by
constriction and dilation of the
vessels performed by muscle cells
present in the blood vessel wall.
These cells are abundant with alpha
adrenegric receptors that are
the targets of neurotransmitters such as
norepinephrine. The release
of norepinephrine calls off the blood from
non-vital organs leading
to a reduction in skin perfusion in limbs. The skin
vasoconstriction
due to release of catecholamines can be measured by
photoplethysmogram (PPG) [21]. PPG is an optical sensor
composed of a light emitting diode and a photo detector. The
reflection of the light from skin captures the volumetric changes of
the blood pulse. Conventionally, PPG signal was used to measure
blood
oxygenation level and heart rate. Recent studies have shown
the
morphology of PPG signal contains valuable information about
the
cardiovascular function, autonomic nervous system (ANS) and its
related
hemodynamics [20, 21, 22]. The blood pressure and vascular compliance affect the morphological features of a PPG pulse. In addition, the HRV features conventionally derived from ECG signal can still be derived using PPG signal and the results of seizure detection is comparable with ECG signal [23].
In this study, an Empatica E4 wristband is used to
capture PPG signals from 12 subjects while they are being monitored in
UCI Medical Center. In addition to PPG, the EEG and the ECG signals are also recorded.
The seizures are marked by a neurologist and the PPG/ECG data is
segmented to have at least one seizure in every four hours of data. Next the ictal changes in morphological features of PPG signal related to ANS is extracted. In addition to HRV-related features which were conventionally derived and used in ECG-based seizure detectors, other ANS-related morphological features of PPG are being analyzed for the first time.
The extracted morphological features from PPG signal is analyzed for
common patterns pre- and post-seizures and show consistent pattern of change in majority of subjects. We proposed a recurrent neural network based on Long Short-Term Memory (LSTM). LSTM architecture can learn long-term temporal dependencies which helps detecting the progression of features leading to seizure. Despite state of art HRV-based detectors which are trained specifically for each subject, our proposed seizure detector is subject-independent and trained generally for all subjects.
The proposed seizure detector keeps the sensitivity up to 92% while reducing the false positive rate to 0.52 times per hour while which is improvement.
This paper is organized as follows: Section 2 explains the extracted PPG features and their physiological interpretation. Section 3 describes the procedure in which the data was recorded and the details of the subjects’ information. In addition, the results of analysis and observations are brought in Section 3. Section 4 brings the proposed seizure detection algorithm. Section 5 concludes the paper.
2 Methods and Material
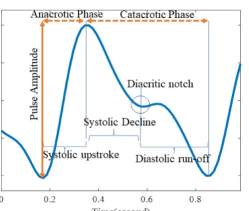
PPG is an optical sensor capturing the skin blood flow using a light emitting diode (LED) and a photo detector. The LED illuminates the skin, and the backscattered light from the surface of the skin changes with respect to blood volume pulse and the blood color. The captured signal represents the arterial pressure as the blood is ejected from the left ventricle, circulates through the vessels, and finally goes back to the right atrium. The PPG signal has a distinct shape that can be separated into anacrotic and catacrotic phases as shown in Fig. 1.
The anacrotic phase consists of the systolic upstroke corresponding to the to acceleration of the aortic blood flow as a result of left ventricular blood ejection. The ascending slope depends on several parameters such as the left ventricular ejection pressure, arterial peripheral resistance, and the arterial compliance and elasticity [24]. The upstroke reaches the maximum arterial pressure point called the systolic point. People with less arterial compliance and elasticity tend to have higher systolic peaks.
The catacrotic phase consists of the systolic decline, the dicrotic notch, and the diastolic run-off. The systolic decline happens when the left ventricular contraction is about to end. The efflux of blood from arteries to veins back to the heart is faster than the influx of the blood from the heart left ventricle. The dicrotic notch happens when the aortic valve closes. There is a sudden increase in arterial pressure after the dicrotic notch. In fact, after the closure of the aortic valve, the blood volume has less space to move and it can only travel toward the peripheral arteries, causing a secondary peak in arterial pressure in diastolic phase due to resistance of peripheral arteries. The dicrotic notch is more slurred in people with a higher arterial compliance. Finally, there is a gradual drop in the arterial pressure in diastolic phase as the blood goes back to the right atrium.
2.1 Data Analysis
In this section the investigated morphological features derived from ECG and PPG data is described along with their physiological interpretation. The temporal and spectral features related to HRV, i.e. HR, SDNN, RMSSD, NN50, LF, HF, and LF/HF, were conventionally derived from ECG signal and are called HRV-related features hence forth. There are 5 other features related to hemodynamics and vascular compliance derived from PPG morphology, i.e. , , PA, PCA1, and PTT. For brevity, these 5 features are called hemodynamic-related features.
2.1.1 Heart Rate (HR)
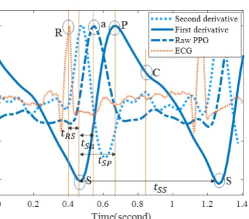
Heart rate is estimated using the time between troughs of consecutive PPG pulses. Representing the pulse width by as shown in Fig. 2, heart rate is defined as the reciprocal of the pulse width as:
| (1) |
In addition to heart rate, there are other temporal and spectral parameters extended from heart rate which have been conventionally used as bio-markers of ANS dynamics and can be extracted from PPG signal as follows [23]:
-
•
SDNN: SDNN is the standard deviation of pulse widths and is defined as:
(2) where is the expectation denotation and is the mean value of the pulse widths.
-
•
RMSSD: RMSSD is the root mean square of the expected value of squared differences of successive pulse widths and is defined as:
(3) where represents the pulse width.
-
•
NN50: NN50 is the number of successive pulses with more than difference in their widths.
-
•
: is the power spectral density of heart rate in low frequency band (0.04-0.15 Hz) and normalized to the total spectral power of heart rate.
-
•
: is the power spectral density of heart rate in high frequency band (0.15-0.4 Hz) and normalized to the total spectral power of heart rate.
-
•
LF/HF: LF/HF is the ratio of power spectral density of heart rate between the low and high frequency band.
2.1.2 Pulse Amplitude (PA)
PA is defined as the height of the PPG signal, which is measured by the vertical distance between the diastolic trough to the systolic peak of the next pulse as shown in Fig. 1. PA is directly related to cardiac volume stroke, vascular distensibility, and vascular resistance [25]. In case of hypovolemia and dehydration, the left ventricular volume stroke is small and the PA goes low. In addition, in case of vasoconstriction in peripheral arteries where the vascular resistance of peripheral arteries goes high, a reduction in the PA is observed [28, 27]. PA is also related to arterial compliance and elasticity. Compliance is the ability of blood vessel wall to distend in response to changes in blood pressure. People with lower arterial compliance tend to have a higher PA [25].
2.1.3 Normalized Crest Time ()
The crest time is the time between the start point of systolic upstroke (denoted by S in Fig. 2) and the systolic peak (denoted by P in Fig. 2) and is represented by . Disregarding the fact that is expected to reduce due to tachycardia, normalizing the crest time with respect to pulse width reveals an increase in ictal and post-ictal phase. In fact, regardless of ictal reduction in crest time, the increase in normalized crest time () yields information about vasoconstriction and vascular resistance in limbs during seizure. The normalized crest time is defined as:
| (4) |
2.1.4 Normalized Pulse Transmit Time (PTT)
Pulse transmit time is the time it takes from the onset of the left ventricle depolarization to the time the blood reaches the peripheral arteries and is measured as the interval between the R peak in ECG signal and the next PPG trough as shown by in Fig. 2 [29]. The pulse transmit time is related to pulse wave velocity or the speed of blood flow in arteries. The pulse wave velocity itself is a function of blood density, arterial dimension properties such as vessel thickness and arterial diameter, and blood pressure [28]. The normalized pulse transmit time is defined as follows:
| (5) |
2.1.5 Maximum Velocity and its Normalized Time ( )
The point of maximum upstroke slope in systolic phase denoted by peak in the first derivative waveform represents the maximum velocity in PPG pulse Fig. 2. This maximum slope depends on the blood viscosity, arterial pressure and vascular resistance. In addition the normalized maximum slope time is defined as:
| (6) |
2.1.6 Principle Component from the Second Derivative of PPG (PCA1)
The second derivative of the PPG pulse shape (SDP) is a measure of blood flow acceleration in vessels. The fiducial points of the second derivative waveform are related to arterial stiffness and arterial pressure [30]. In this study, the raw PPG data is segmented into PPG pulses. Each PPG pulse starts from the diastolic trough and ends in the diastolic trough of the next pulse as shown in Fig. 2. After calculating the second derivative of each pulse shape, the dominant shape of the second derivative of the pulses in inter-ictal phase (baseline) is derived using principle component analysis (PCA). All the PPG pulses occurring before 15 minutes prior to the seizure onset and after 5 minutes post-seizure offset are considered as baseline [18]. The shapes of the SDP in ictal phases are compared to the principle components of the baseline using subspace projection. In order to be able to apply PCA to the second derivative of PPG pulse shape, the data samples are interpolated such that the PPG pulses have the same number of samples denoted by . Let us represent the pulse as a vector and its second derivative as the baseline acceleration vector . Stacking all the baseline acceleration vectors, the baseline acceleration matrix is formed as:
| (7) |
where is the total number of baseline pulses. An eigenvalue decomposition of its covariance is as follows;
| (8) |
where is the transpose of and is the matrix of eigenvectors with being the eigenvector. is an diagonal matrix of eigenvalues. The eigenvectors corresponding to the major eigenvalues contain the dominant shape of the baseline acceleration waveform. In order to compare the ictal SDP shape with baseline, we adopted a subspace projection approach as explained in the following. Let us represent the ictal PPG pulses and their second derivatives by vectors and , where is the index of ictal pulse. In order to quantify the deviation of each acceleration waveform from the baseline, the subspace projection of with the subspace spanned by the principle components in Eqn. (8) is derived as follows:
| (9) |
where is the first principle component of baseline SDP and is the index of the ictal pulse.
3 Data Collection and Analysis
3.1 Data Collection
A total of 12 subjects (8 males and 4 females with a mean age of 33.64 13.3) were recruited among the patients with refractory epilepsy who underwent long-term extra-cranial monitoring admitted to University of California Irvine Medical Center (UCIMC). The informed consents were obtained before the start of the monitoring as required by the Institutional Review Boards of University of California, Irvine. The 20-channel surface EEG data and one-lead ECG data (Lead II) were continuously recorded as a standard of care procedure with sampling rate of 500 Hz (The Nihon Kohden JE-921, paired with the QI-123A LAN converter). Our study also involved collection of PPG data recorded simultaneously by Empatica E4 with 64 Hz of sampling frequency. The PPG data collected the blood pulse from the left ankle of the subjects. The subjects were laying on a bed while being monitored to reduce the motion artifact. The seizure onset time and foci were extracted by a clinical neurophysiologist based on the revision of the EEG data. A total of 60 seizures were recorded where 3 seizures were withdrawn from the analysis due to extensive noise in PPG data. Table 1 represents the subjects’ clinical information including the age and the seizure onset zone.
| Patient | Sex | Age | Seizure type | Origin | Number of seizures | Medication | hour:min |
|---|---|---|---|---|---|---|---|
| 1 | Male | 27 | Partial | Unknown | 1 | Clonazepam, Depakote | 2:0’ |
| 2 | Female | 26 | Generalized | - | 1 | Topiramate, Lamictal | 1:30’ |
| 3 | Male | 27 | Partial | Left Frontal, Left Temporal | 17 | Keppra, Vimpat | 19:0’ |
| 4 | Male | 23 | Partial | Right Frontal, Right Temporal | 7 | Trileptal | 23:21’ |
| 5 | Male | 58 | Partial | Left Temporal | 1 | Keppra, Levetricateram | 5:0’ |
| 6 | Female | 50 | Partial | Right Temporal | 12 | Clonazepam, Levetricateram | 16:0’ |
| 7 | Male | 25 | Partial | Right Frontal, | 5 | Trileptal, Zonisamide | 10:41’ |
| 8 | Female | 33 | Partial | Left Temporal, Left Parietal | 1 | Phenytoin | 4:0’ |
| 9 | Male | 27 | Partial | Right Temporal, | 1 | Lamictal, Clonazepam, Depakote, Mirtazapine | 4:0’ |
| 10 | Male | 25 | Partial | Left Occipital, Left Parietal | 1 | Zonisamide | 4:0’ |
| 11 | Male | 59 | Partial | Left Temporal | 9 | Keppra, Topiramate | 21:0’ |
| 12 | Female | 21 | Partial | Left Frontal | 1 | Zonisamide, Phenytoin | 2:0’ |
| Seizure Number | S1 | S2 | S3 | S4 | S5 | S6 | S7 | S8 | S9 | S10 | S11 | S12 | S13 | S14 | S15 | S16 | S17 | S18 | S19 |
|---|---|---|---|---|---|---|---|---|---|---|---|---|---|---|---|---|---|---|---|
| Patient number | P1 | P2 | P3 | P3 | P3 | P3 | P3 | P3 | P3 | P3 | P3 | P3 | P3 | P3 | P3 | P3 | P3 | P3 | P3 |
| Duration(sec) | 110 | 70 | 60 | 78 | 117 | 113 | 42 | 46 | 56 | 40 | 63 | 175 | 37 | 102 | 81 | 297 | 19 | 85 | 59 |
| Seizure Number | S20 | S21 | S22 | S23 | S24 | S25 | S26 | S27 | S28 | S29 | S30 | S31 | S32 | S33 | S34 | S35 | S36 | S37 | S38 |
| Patient number | P4 | P4 | P4 | P4 | P4 | P4 | P4 | P5 | P6 | P6 | P6 | P6 | P6 | P6 | P6 | P6 | P6 | P6 | P6 |
| Duration(sec) | 39 | 84 | 93 | 71 | 98 | 104 | 61 | 79 | 94 | 91 | 201 | 156 | 49 | 42 | 35 | 35 | 36 | 47 | 48 |
| Seizure Number | S39 | S40 | S41 | S42 | S43 | S44 | S45 | S46 | S47 | S48 | S49 | S50 | S51 | S52 | S53 | S54 | S55 | S56 | S57 |
| Patient number | P6 | P7 | P7 | P7 | P7 | P7 | P8 | P9 | P10 | P11 | P11 | P11 | P11 | P11 | P11 | P11 | P11 | P11 | P12 |
| Duration(sec) | 59 | 36 | 31 | 39 | 32 | 39 | 28 | 265 | 13 | 54 | 44 | 48 | 71 | 45 | 37 | 61 | 29 | 38 | 72 |
3.1.1 Timing Synchronization
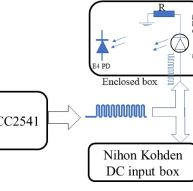
Since the EEG/ECG data and the PPG data are recorded from separate devices, the time offset and the drift noise present in the clocks of the two devices will cause timing error in recording events. In order to synchronize the events in Nihon Kohden EEG recording machine and the Empatica E4 PPG recording device, we designed an apparatus that generates time stamps twice during each recording session. The time stamp is a sequence of 10 square pulses with a pulse width of 1 second and duty cycle of 50%. The Nihon Kohden JE-921 has an analog input box that enables the collection of an external analog signal [31]. The designed synchronizer feeds the analog input port of Nihon Kohden with the sequence square pulses (5 volts of pulse amplitude). At the same time, the E4 device is placed in front of a green LED which is fed with the same sequence of pulses. As a result, the LED blinks with a frequency of 1 Hz and duty cycle of 50%. The photo detector embedded in E4 captures the LED flashes as the time stamp. The time stamp is generated two times, once initially before attaching the E4 to the subject’s left ankle and once again at the end after detaching it from the subject’s body. Fig. 3 shows the block diagram of the synchronization apparatus. Once the recording session is finished, the timing is tuned by maximally aligning the time stamps captured by E4 photo detector and Nihon Kohden analog input box.
3.2 Preprocessing
After synchronizing the PPG and EEG data, a neurologist marked the seizure onset and offset times based on the EEG waveform and video recordings. A total of 60 seizures were recognized among 12 subjects. Next, both PPG and EEG data were clipped so that it includes the seizure incidents as well as 2 hours of baseline before the seizure onset and 2 hours of data after the seizure offset. Thus, there is at least one seizure occurring in every 4 hours of the data. In case there are multiple seizures occurring close to each other(within less than 2 hours), the data is clipped such that it includes 2 hours of baseline before the first seizure and 2 hours of baseline after the last seizure. The clipped data was preprocessed to reject motion artifact and used for analysis in this study.
3.2.1 Artifact Rejection
The PPG waveform is susceptible to motion artifact and can be completely obscured by noise. In order to reject noisy PPG pulses, the criteria introduced in [32] is employed. A clean PPG pulse should consist of a monotonically increasingly systolic upstroke followed by a diastolic descent. According to [32] the diastolic fall-off in a clean PPG pulse should not include more than two distinct notches. The PPG pulses with two, one, or zero dicrotic notches are considered clean. The artifactual parts are rejected in two phases. First, the algorithm proposed in [32] automatically marks the PPG troughs and detects the artifacts. In the second phase, an expert visually inspects the PPG data and manually removes any missed artifact and rejects the false positives. After the noise rejection, two seizures from subject 8 and one seizure from subject 11 were eliminated due to excessive amount of noise. Table 1 shows the duration of the clipped data for each specific subject. Table 2 demonstrates the duration of the seizures being used for analysis. A total of 57 seizures were used for analysis.
3.2.2 Feature Analysis
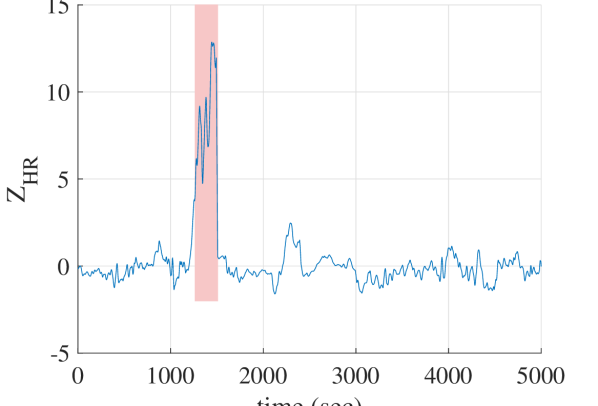
The morphological features were extracted from PPG data as defined in Section 2. Each feature forms a time series derived from the PPG pulses over time, where the individual samples belong to the feature values from each specific pulse. In order to compare the changes in the features in time, each time series is segmented into non overlapping windows of 5-minutes length. Next, the z-score of each feature sample is derived separately for every 5-min segment based on the standard deviation and the mean value from its previous segment. For instance, let us denote the mean and the standard deviation for the heart rate in the segment as and . For one individual detected PPG pulse inside segment, the heart rate is denoted as implying that the pulse belongs to the segment. Next the z-score for HR feature in this pulse is derived as follows:
| (10) |
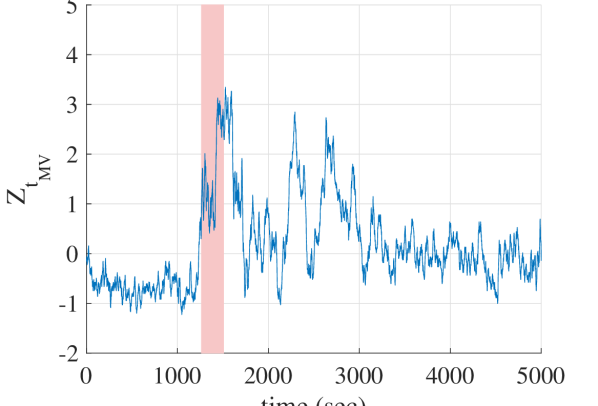
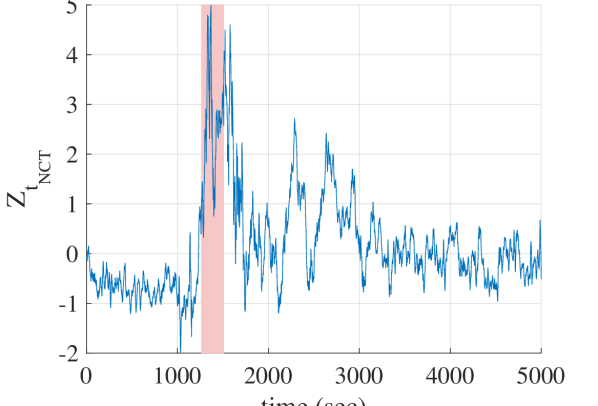
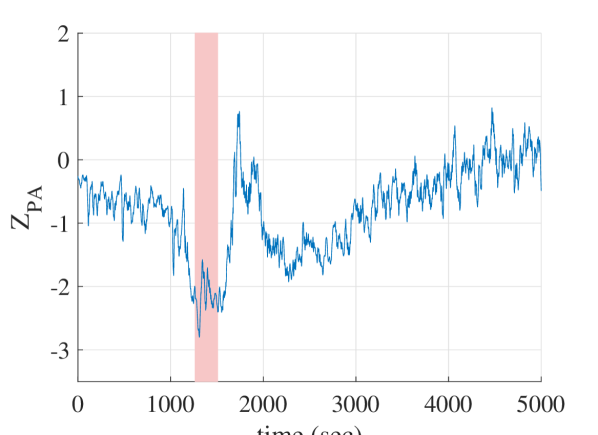
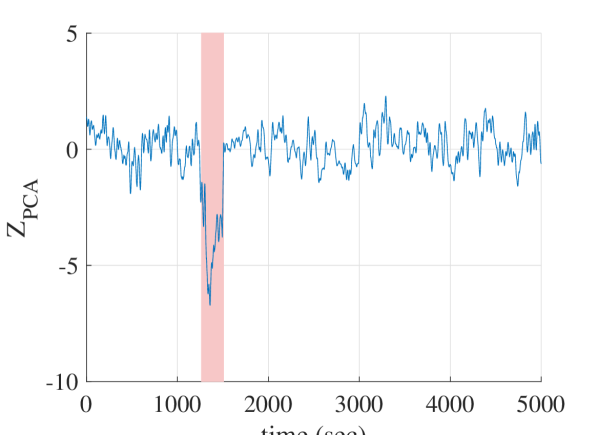
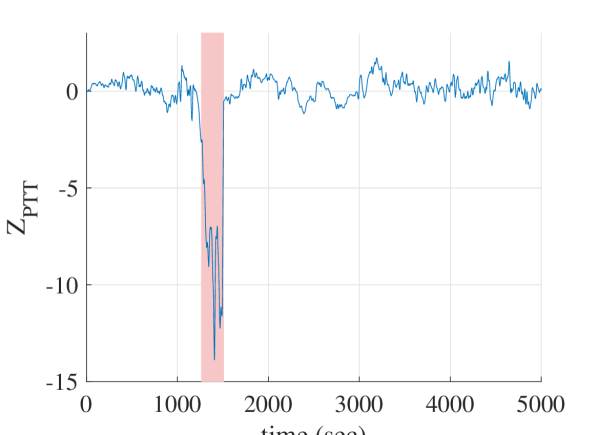
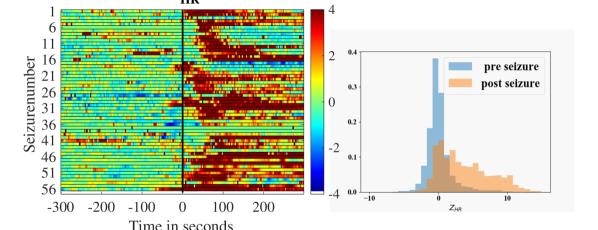
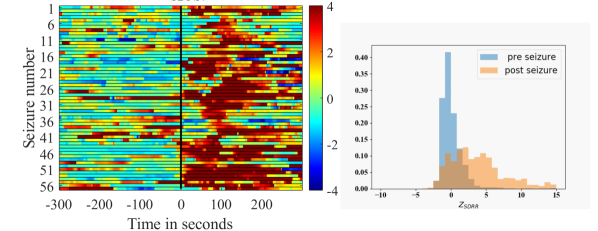
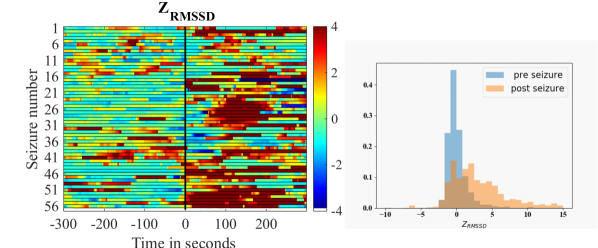
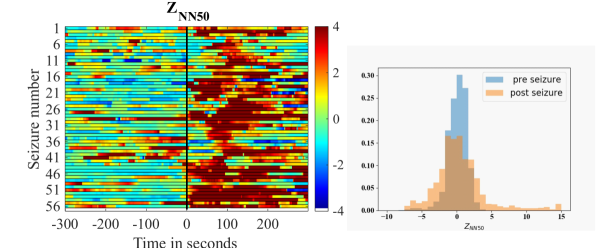
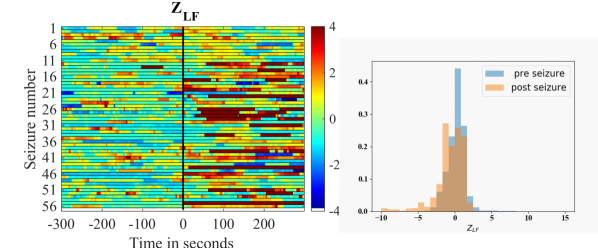
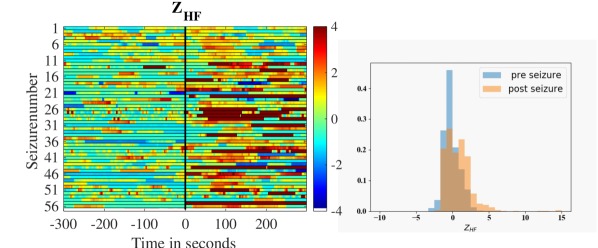
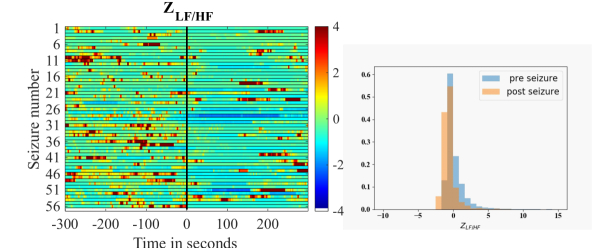
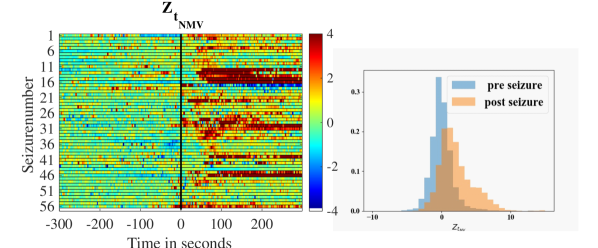
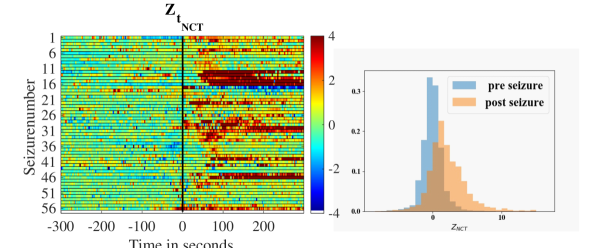
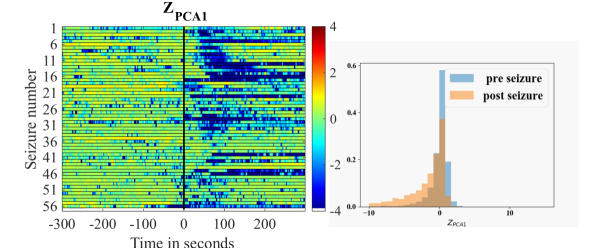
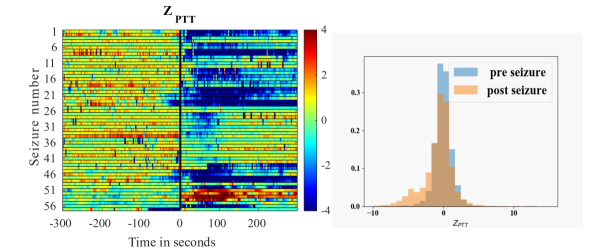
where and are the mean and standard deviation from the previous segment. Normalizing the feature values based on the previous mean and standard deviation signifies the changes of these parameters over time. Let us denote the z-scores derived accordingly for all the hemodynamic-related features by , , , , and . Fig. 4 depicts the variations of z-scores derived for the hemodynamic-related features in the first seizure of subject 6. According to Fig. 4, the heart rate, normalized crest time, and normalized maximum velocity time experience a significant increment after the seizure onsets, while the pulse amplitude, pulse transmit time, and the first principle coefficient encounter significant decrements. In order to be able to see the patterns of changes in all the recorded seizures, Fig. 5(l) demonstrates the z-scores derived for all the features. Comparing the z-scores for all the features pre- and post seizure shows a consistent pattern of changes across all the seizures. In Fig. 5(l), the middle black lines placed at zero time is when the seizure onsets happen. The negative time values on x-axis are the 5-minute segments prior to seizures and the positive time values demonstrate the 5-minute post seizure onset segments. The y-axis shows the seizure numbers and the color codes represent z-score values between and 4, where the highlighted parts mean a higher z-score. In addition, the probability distribution functions (pdf) of the derived z-scores for pre- and post-seizures are also depicted. The blue diagram represents the z-scores derived using the data in the 5-minute pre-seizure periods for all the 57 seizures. The orange diagrams depict the pdfs of z-scores for all 57 post seizure onset features. In order to quantify the significance of the variations, we adopted one-way Analysis of variance (ANOVA) with the z-scores from interictal as the baseline and a 5-minutes of data after the seizure onset. Table 3 shows the percentage of seizures with significant changes after the seizure onset as well as the percentages of significant increases and decreases.

.
| Feature | HR | SDNN | RMSSD | NN50 | LF | HF | LF/HF | |||||
|---|---|---|---|---|---|---|---|---|---|---|---|---|
| Percentage of Significant Seizures | 94.6% | 92.8% | 94.6% | 89.4% | 52.2% | 42.1% | 52.2% | 84.2% | 84.2% | 87.7% | 66.6% | 68.7% |
| Percentage of Significant Increase | 94.6% | 92.8% | 94.6% | 89.4% | 50.8% | 42.1% | 0% | 84.2% | 84.2% | 0% | 0% | 8.7% |
| Percentage of Significant Decrease | 0% | 0% | 0% | 0% | 1.4%% | 0% | 52.2% | 0% | 0% | 87.7% | 66.6% | 60% |
4 Seizure Detection
The entire data set consists of 102 hours and 30 minutes of recording among which a total of 1 hour and 9 minutes is in ictal phase. In order to quantify the performance, we adopted three metrics of sensitivity, Positive Predictive Value (PPV), and False Alarm Rate (FAR). The sensitivity is defined as:
| (11) |
where and are true positives and false negatives, respectively. The FAR is the number of erroneously detected seizures per hour. The PPV is the ratio of true positives over all the issued alarms and is defined as:
| (12) |
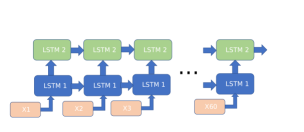
where is the false positives rate. In order to avoid overfitting, we randomly excluded a continuous segment of 2-hours inside the total of 102 hours 30 minutes data as the testing data. The remaining data is used for training the model. This random selection was repeated 20 times and the model was trained using the obtained training set. The overall performance is obtained by averaging over the sensitivity, PPV, and FAR from every repetition. We adopted a two layer LSTM neural network architecture. LSTM is able to capture long-term dependencies which helps identifying the temporal progression of PPG features in epilepsy.
4.1 LSTM Architecture
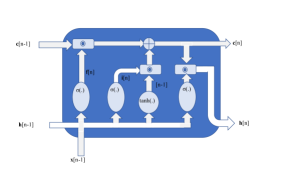
The goal of automatic seizure detector is to classify windows of input data into two labels of seizure and non-seizure. The stream of z-scores for each feature forms a time series. A sliding window method was employed to subsegment the time series into windows of 60 samples. Fig. 6 shows the proposed architecture for the LSTM model. The LSTM architecture is composed of LSTM cells where each cell is fed with the hidden state and the cell state from the previous cells in time. Our proposed LSTM architecture contains two layers of 60 cells. A dropout was applied to the first layer to avoid over fitting. The Adam optimizer was used for training the architecture. Fig. 6 (a) shows the equations governing each cell, where h[n] and c[n] are the hidden state and the cell state corresponding to time . and are the weight matrices and the bias vectors. The hidden state is dependent on the input vector, the previous hidden state and the cell state. The vector decides whether to use the input and the past hidden state to update the cell state . The vector decides wether to use the past cell state to update the cell state. The equations governing the LSTM cells are as follows:
| (13) |
where is the element-wise multiplication.
4.2 HRV-related versus hemodynamic-related features
Conventional seizure detection algorithms, derive the HRV-based features from ECG signal and use them for seizure detection. In this work, the HRV-related features were extracted from PPG signal, i.e. HR, SDNN, RMSSD, NN50, , , and LF/HF. In addition to the HRV-related features, 5 other PPG features were studied which are known to be related to vascular compliance and hemodynamics, i.e. , , , , . As it Despite the HRV-related features, all the hemodynamic-related features show consistent patterns of ictal change across majority of the seizures. In order to be able to measure how these hemodynamic-related features are contributing to the improvement of seizure detection, we trained the proposed LSTM architecture twice. First using the 7 HRV-related features, the dimensions of the input vector and the hidden state and cell state for the first layer were 7. The dimensions of the hidden state and the cell state vectors for the second layer were chosen to be 5. The performance results of the trained HRV-based LSTM is brought in table 4. For brevity, this detector is called LSTM7.
Next, the 5 hemodynamic-related features were appended to the input vector, making the input vectors of 12 features in time. The hemodynamic-based LSTM is denoted by LSTM12 in table 4.T he dimensions of the hidden states and the cell states for the first and the second layer were 12 and 5 respectively. As shown in table 4, although our proposed seizure detector is subject independent, our HRV-based detector LSTM7 is showing an improvement in FAR and PPV compared to [14, 13]. The LSTM7 results performance is comparable to [12], considering the fact that the data in [12] is nocturnal, while our data is both nocturnal and diurnal. Adding the 5 hemodynamic-related features in LSTM12 improves the sensitivity to . In addition , the FAR rate have improved from 0.91 to 0.52 which is a improvement.
| work | sensitivity | PPV | FAR | type of seizure | time | subject dependent |
|---|---|---|---|---|---|---|
| [12] | 77.6%% | 30.7% | 0.33 per hour | GTC + partial | nocturnal | Y |
| [13] | 81.9% | 7.9% | 1.97 per hour | GTC+partial | nocturnal+diurnal | Y |
| [14] | 77.1% | 3.25% | 1.24 per hour | GTC+partial | nocturnal+diurnal | Y |
| [23] | 77.1% | 3.25% | 1.24 per hour | GTC+partial | nocturnal+diurnal | Y |
| LSTM based on HRV (LSTM7) | 82% | 26% | 0.91 per hour | GTC+partial | nocturnal+dirunal | N |
| LSTM based on PPG morphological | 92% | 43% | 0.52 per hour | GTC+partial | nocturnal+dirunal | N |
| features (LASTM12) |
5 Conclusion
The automatic seizure detectors using frequency domain features of EEG signals and traditional machine learning techniques such as k-nearest neighbor and Support Vector Machine (SVM) have been extensively researched in literature [33, 34] in the past. Recently, deep neural network techniques have gained attention enabling seizure prediction from pre-ictal EEG patterns with high sensitivity and low FAR [35]. Since the contribution of different channels in seizure detection or prediction performance is patient specific and depends on the seizure onset zone, these models cannot be generally used for every one and require subject-specific sensor selection and optimization techniques to reduce the complexity [36]. In addition, wearing an EEG cap is not feasible for a long-term monitoring of patients leading a normal daily life.
The autonomic nervous system dysfunction induced by epileptic brain activity is easier to detect using extracerebral sensors [37]. In particular, heart rate variability (HRV), accelerometry and Electrodermal Activity (EDA) have gained attention for measuring the autonomic dysfunction. [9, 8]The frequency domain features such as Very Low Frequency (VLF)(0.0033-0.04 Hz), Low Frequency (LF)(0.04-0.15 Hz), and High Frequency (HF) (0.15-0.4 Hz) measure the Sympathetic (SNS) and parasympathetic (PNS) nervous balance [26]. However, recent studies have suggested the LF/HF ratio is a controversial measure of sympatho/vagal balance. Since SNS and PNS activities are nor linearly counterparts, decreasing activity in one does not suggest an increase in the other. In fact, both SNS and PNS are contributing to LF power, whereas HF power is associated with PNS activity [39].
The Catecholamines released as anticonvulsant during epileptic seizures affect the blood circulation and vascular function. The hemodynamics induced by seizures can be measured by PPG sensors. In this study, we investigated six different morphological features in PPG and ECG signal recorded from 12 epileptic subjects. A total of 102 hours and 30 minutes of ictal and inter-ictal data was recorded. The extracted features include heart rate, crest time, maximum velocity time, pulse transmit time, pulse amplitude, and the first principle coefficient derived from the second derivative of PPG pulse shape. Among these features, the crest time, the maximum velocity time, and the pulse transmit time are influenced by the heart rate. In order to eliminate the effect of heart rate, these feature were normalized to pulse width.
All the investigated features showed significant variation in majority of recorded seizures (refer to Table 3). Except for patient number 11, who had a few seizures in which the pulse-transmit time was significantly increased, a consistent pattern across all seizures/subjects was observed. The reduction in pulse amplitude and the increase in normalized crest time suggests an increase in vascular resistance and hypovolemia in limbs induced by vasoconstriction. This is the first time a comprehensive analysis on PPG morphology along with ECG data induced by epilepsy is performed.
References
- [1] G. O. Young, “The Epidemiology of Global Epilepsy,” in Neuroligic Clinics., vol. 34, no. 4, pp. 837-847, Nov. 2016.
- [2] S. Shmuely, M Van Der Lende, R. J. Lamberts, J. W. Sander, R. D. Thijs, “ The Heart of Epilepsy: Current Views and Future Concepts,” in Seizure., vol. 44, pp. 176-183, Jan 2017.
- [3] O. Abdel-Mannan, H. Taylor, E. J. Donner, A. G. Sutcliffe, “A systematic review of sudden unexpected death in epilepsy (SUDEP) in childhood,” in Epilepsy and Behavior, vol. 90, pp. 99-106, 2019.
- [4] R. D. Thijs, “The Autonomic Signatures of Epilepsy: Diagnostic Clues and Novel Treatment Avenues,” in Clinical Autonomic Research, vol. 29, no. 2, pp. 131-133, April. 2019.
- [5] B. Blachuta, Ch. Hoppea, R. Surgesa, J. Stahlb, Ch. E. Elgera, Ch. Helmstaedtera ,“Counting seizures: The primary outcome measure in epileptology from the patients’ perspective,” in Seizure, vol. 29, pp. 97-103, July 2015.
- [6] M. Z. Poh, N. C., Swenson, R. W. Picard, “A wearable sensor for unobtrusive, long-term assessment of electrodermal activity,” in IEEE Trans. on Biomed. Eng., vol.57, no. 5, pp. 1243-1252, 2010.
- [7] M. Z. Poh, T. Loddenkemper, C. Reinsberger, N. C. Swenson, S. Goyal, J. R. Madsen, R. W. Picard, “Autonomic changes with seizures correlate with postictal EEG suppression,” in Neurology, vol. 78, no. 23, pp. 1868-1876, 2012.
- [8] M. Milošević, A. V. de Vel, B. Bonroy, B. Ceulemans, L. Lagae, B. Vanrumste, and S. Van Huffel, “Automated detection of tonic–clonic seizures using 3-d accelerometry and surface electromyography in pediatric patients,” in IEEE journal of biomedical and health informatics, vol. 20, no. 5, pp. 1333-1341, 2015.
- [9] S. Beniczky, I. Conradsen, O. Henning, M. Fabricius, P. Wolf, “Automated real-time detection of tonic-clonic seizures using a wearable EMG device,” in Neurology,vol. 90, no. 5, pp. 428-434, 2018.
- [10] A. V. Westrhenen,, T. D. Cooman, R. H. C. Lazeron, S. Van Huffel, R. D. Thijs, “ Ictal Autonomic Changes as a Tool for Seizure Detection: a Systematic Review,” in Clinical Autonomic Research., vol. 29, no. 2, pp. 161–181, April 2019.
- [11] A. Ulate-Campos, F. Coughlin, M. Gaínza-Lein, I. Sánchez Fernández, P. L. Pearl, and T. Loddenkemper, “Automated seizure detection systems and their effectiveness for each type of seizure,” in Seizure, vol. 40, pp. 88-101, 2016.
- [12] T. D. Cooman, C. Varon, A. Van de Vel, K. Jansen, B. Ceulemans, L. Lagae, S. V. Huffel, “Adaptive nocturnal seizure detection using heart rate and low-complexity novelty detection,” in Seizure, vol. 59, pp. 48-53, 2018.
- [13] T. De Cooman, C. Varon, B. Hunyadi, W. V. Paesschen, L. Lagae, S. V. Huffel, “Online automated seizure detection in temporal lobe epilepsy patients using single-lead ecg,” in International journal of neural systems, vol. 27, no. 07, 2017.
- [14] T. De Cooman, T. W. Kjaer, S. V. Huffel, H. B. Sorensen, “Adaptive heart rate-based epileptic seizure detection using real-time user feedback,” in Physiological measurement, vol. 39, no. 1, 2018.
- [15] K. S. Eggleston, B. D. Olin, R.S. Fisher, “Ictal tachycardia: the head–heart connection,”, in Seizure, vol. 23, no. 7, pp. 496-505, 2014.
- [16] C. P. Monté, C. J. Monté, P. Boon, P., J. Arends, “Epileptic seizures associated with syncope: Ictal bradycardia and ictal asystole,” in Epilepsy and Behavior, vol. 90, pp. 168-171, 2019.
- [17] W. Van Elmpt, T. Nijsen, P. Griep, J. Arends, “ A Model of Heart Rate Changes to Detect Seizures in Severe Epilepsy,” in Seizures., vol. 15, no. 6, pp. 366-375, Sep 2006.
- [18] K. Fujiwara, M. Miyajima, T. Yamakawa, E. Abe, Y. Suzuki, Y. Sawada, M. Kano, T. Maehara, K. Ohta, T. Sasai-Sakuma, T. Sasano, M. Matsuura, E. Matsushima, “Epileptic Seizure Prediction Based on Multivariate Statistical Process Control of Heart Rate Variability Features,” in IEEE Trans. Biomed. Eng., vol. 36, no. 6, 2016.
- [19] P. J. Fitszgerald,“Is Elevated Norepinephrine an Etiological Factor in Some Cases of Epilepsy?,” in Seizures., vol. 19, no. 6, pp. 311-318, Sep 2010.
- [20] C. Karmakar, A. Khandoker, T. Penzel, C. Schobel, M. Palaniswami, “Detection of Respiratory Arousals Using Photoplethysmography (PPG) Signal in Sleep Apnea Patients,” in IEEE Trans. Biomed. Eng., vol. 18, no. 3, pp. 1065-1073, 2014.
- [21] , K. Budidha, P. A. Kyriacou, “Photoplethysmography for Quantitative Assessment of Sympathetic Nerve Activity During Cold Stress,” in Frontiers in Physiology, vol. 9, 2018.
- [22] P. Charlton, P. Celka, B. Farukh, Ph. Chowienczyk, J Alastruey, “Assessing mental stress from the photoplethysmogram: a numerical study.” in Physiological Measurement, vol. 39, 2018.
- [23] K. Vandecasteele, T. D. Cooman, Y. Gu, E. Cleeren, K. Claes, W. V. Paesschen, S. V. Huffel, B. Hunyadi,“Automated Epileptic Seizure Detection Based on Wearable ECG and PPG in a Hospital Environment,” in Sensors, vol.17, no. 10, 2017.
- [24] S. A. Esper SA, M. R. Pinsky, “Arterial Waveform Analysis,” in Best Practice Research Clinical Anaesthesiology., vol. 28, no. 4, pp. 363-380, Dec 2014.
- [25] E. Wowern, G. Östling, P. M. Nilsson , P. Olofsson, “Digital Photoplethysmography for Assessment of Arterial Stiffness: Repeatability and Comparison with Applanation Tonometry,”in PLOS ONE, vol. 10, no. 8, 2015.
- [26] F. Shaffer, J.P. Ginsberg, “ An overview of heart rate variability metrics and norms,” in Frontiers in public health, vol. 5, p. 258, 2017.
- [27] X. R. Ding,Y. T. Zhang, “Photoplethysmogram intensity ratio: a potential indicator for improving the accuracy of PTT-based cufflessblood pressure estimation,” in IEEE Proc. 37th Annu. Int. Conf. Eng. Med. Biol. Soc., Milan, Italy, 2015.
- [28] X.R Ding, Y. T. Zhang, J. Liu, W. X. Dai, H. K. Tsang, “Continuous cuffless blood pressure estimation using pulse transit time and photoplethysmogram intensity ratio,” in IEEE Transactions on Biomedical Engineering, vol. 63, no. 5, pp. 964-972, 2015.
- [29] P. M. Middleton, G. S. Chan, G.S., E. OLone, E. Steel, R. Carroll, B. G. Celler, N. H. Lovell, “Changes in left ventricular ejection time and pulse transit time derived from finger photoplethysmogram and electrocardiogram during moderate haemorrhage,” in Clinical physiology and functional imaging, vol. 29, no. 3, pp.163-169, 2009.
- [30] M. Elgendi, “On the Analysis of Fingertip Photoplethysmogram Signals,” in Current Cardiology Reviews, vol. 8, pp. 14-25, 2012.
- [31] Nihon Kohden Electrode Junction Box JE-921 A/AG Nihon Kohden Inc., available at: ”www.nihonkohden.com”.
- [32] Ch. Fischer, B. Domer, T. Wibmer, T. Penzel, “An Algorithm for Real-Time Pulse Waveform Segmentation and Artifact Detection in Photoplethysmograms ,” in IEEE Journal of Biomedical and Health Informatics, vol. 21, no. 2, 2017.
- [33] A. Sharmila, P. Geethanjali, “DWT based detection of epileptic seizure from EEG signals using naive Bayes and k-NN classifiers,” in IEEE Access vol. 4,pp. 7716-7727, 2016.
- [34] S. Chen, X. Zhang, L. Chen, Z. Yang, “Automatic Diagnosis of Epileptic Seizure in Electroencephalography Signals Using Nonlinear Dynamics Features,” in IEEE Access, vol. 7,pp. 61046-61056, 2019.
- [35] K.M. Tsiouris, V.C. Pezoulas, M. Zervakis, S. Konitsiotis, D.D. Koutsouris, D.I. Fotiadis, “A Long Short-Term Memory deep learning network for the prediction of epileptic seizures using EEG signals,” in Computers in biology and medicine, vol.99, pp. 24-37, 2018.
- [36] N. D. Truong, L. Kuhlmann, M.R. Bonyadi, J. Yang, J., A. Faulks, O. Kavehei, “Supervised learning in automatic channel selection for epileptic seizure detection”, in Expert Systems with Applications, vol. 86, pp.199-207, 2017.
- [37] F. Bahari, F., P. Ssentongo, S.J. Schiff, B.J. Gluckman, “A brain–heart biomarker for epileptogenesis,” in Journal of Neuroscience, vol. 38, no. 39, pp. 8473-8483, 2018.
- [38] P. Ming‐Zher, T. Loddenkemper, C. Reinsberger, N. C. Swenson, Shubhi Goyal, M. C. Sabtala, J. R. Madsen, and R. W. Picard,“Convulsive seizure detection using a wrist‐worn electrodermal activity and accelerometry biosensor,” in Epilepsia,Vol. 53, no. 5, pp. 93-97,2012.
- [39] F. Shaffer, R. McCraty, C.L. Zerr, “A healthy heart is not a metronome: an integrative review of the heart’s anatomy and heart rate variability,” in Frontiers in psychology, vol. 5, p. 1040, 2014.