Effect of variations in the gas mixture compositions on the timing and charge of glass RPC
Abstract
The India-based Neutrino Observatory (INO) is a project aimed at building a large underground laboratory to explore the Earth’s mater effects on the atmospheric neutrinos in multi-GeV range. INO will host a 50 kton magnetized iron calorimeter detector (ICAL) in which Resistive Plate Chambers(RPCs) will be the active detector elements. In ICAL, 28,800 glass RPCs of 2 m 2 m size will be operated in the avalanche mode. A small variation in the compositions of ionizing gaseous medium in the RPC affects its performance. Study of the charge distribution of the RPC at different gas compositions is necessary to optimize the gas mixture.
An RPC made with glass plates of dimension 30 cm 30 cm was operated in avalanche mode with a gas mixture of //. We have studied the performance of these RPCs at the same ambient conditions. The percentages of the or were varied and its effect on the performance of RPC were studied. The study of the charge distribution and time resolution of the RPC signals at different gas compositions is presented in this paper.
1 Introduction
Resistive Plate Chambers (RPCs) have found its applications in the particle physics experiments as well as in medical fields [1, 2]. Most of the high energy experiments prefer the RPCs as tracking detectors because of their excellent position and time resolutions [3]. The India-based Neutrino Observatory (INO) has planned to build an underground laboratory which will house a 50 kton magnetised Iron CALorimeter (ICAL) detector [4]. The ICAL detector aims to determine the neutrino mass hierarchy and to improve the precision bounds on and from the Earth’s mater effects on the atmospheric and propagation. The ICAL will consist of 151 horizontal layers of 5.6 cm thick iron plates interleaved by 4 cm air gaps in which the detector elements will be placed. The Resistive Plate Chambers (RPCs) of dimension 2 m 2 m are chosen as the active detector elements. Three identical modules, each of size 16 m 16 m 14.5 m, will be constructed.
RPCs consist of two parallel plate electrodes of high bulk resistivity () which provide a constant and uniform electric field in the gap between them when a high voltage ( 10 kV) is applied across them. The gap contains a gaseous ionizing medium which is a mixture of R134a (, 95), Isobutane (, 4.5) and Sulphur hexafluoride (, 0.5). Freon acts as a secondary electron quencher with high probability for primary ionization and Isobutane acts as an absorber of UV photons. SF6 is required to control the excess number of electrons in avalanche mode [5]. An incoming charged particle ionizes the gas medium followed by the propagation and multiplication of the -ion pairs, which in turn induces a current signal on external pickup strips [6]. The variations in the gas mixture compositions significantly affects the signal and hence the performance of RPCs. The effect of variation of or on the charge distribution and time resolution of the RPC were studied.
2 Experimental setup
Two glass plates of thickness 3 mm manufactured by Saint-Gobain were cut in 30 cm 30 cm dimensions, pasted with a conductive tape (T-9149) of uniform surface resistance on the outer surfaces, and then used to fabricate an RPC of 2 mm gap. The RPC was operated at 10.4 kV in avalanche mode with a mixture of three gases, viz. R134a (), Isobutane () and Sulphur hexafluoride (). The RPC was sandwiched between two pick-up panels comprising of 10 copper strips each of width 28 mm, separated by a gap of 2 mm. The middle strip was read out to study the performance of RPC.
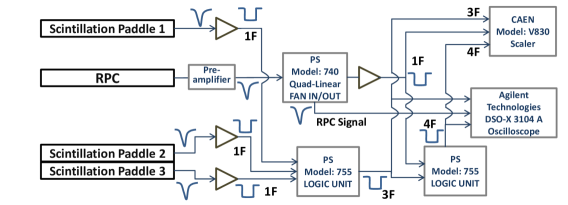
Figure 1 shows the schematic of experimental setup to study the performance of the RPC. A cosmic muon telescope was made using three plastic scintillator paddles P1, P2 and P3 that are arranged vertically one above the other to get a 3-fold coincidence. The dimensions of P1, P2 and P3 in length width thickness are 30 2 1 cm3, 30 3 1 cm3 and 30 5 1 cm3 respectively. The RPC was placed in such a way that the central strip was aligned with the telescope window defined by the paddles. A high voltage was applied across the electrodes of the RPC. The analog signals from the RPC were amplified with a preamplifier, since their amplitude is small in the avalanche mode of operation. The signals from the scintillator paddles and RPC were fed to the Data Acquisition System (DAQ). Scintillator paddle signals were converted to logic signals by a discriminator and ANDed in a logic unit to get the trigger pulse. The amplified RPC analog signal was connected to a linear FAN IN/FAN OUT (FIFO) to get two buffered output signals. One output signal was connected to an oscilloscope to measure the charge and time of the signal, and the other was converted to a logic signal by feeding it to a discriminator with a threshold voltage of -20 mV.
2.1 Calibration of the gas system
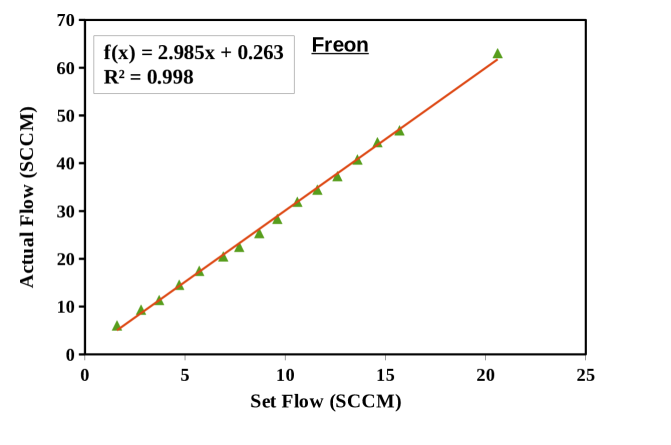
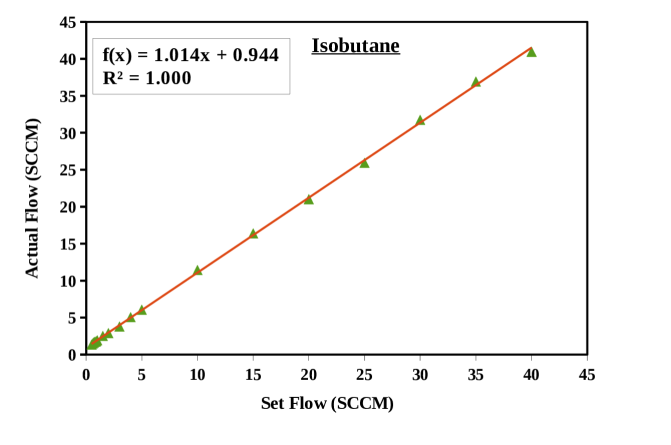
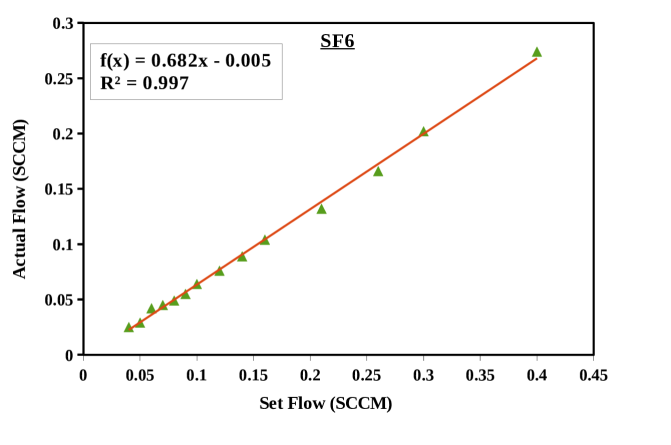
Mixing of the gases in different proportions and their supply to the RPC are executed by an on-line gas mixing and multi-channel distribution system developed by INO team [5]. Mass Flow Controllers (MFCs) are used to control the flow of each gas at its required rate. Therefore, the MFCs were calibrated according to the required flow of the gases in the RPCs. All the MFCs were calibrated by measuring the time taken to reduce the water level in an inverted burette (water downward displacement method). The calibration plots of MFCs corresponding to Freon, Isoutane and SF6 are shown in figure 2. The required proportion of three individual gases in the mixture were determined, and the flow rates were adjusted in the corresponding MFCs according to the calibration.
3 Performance of RPC at different percentages of SF6
SF6 is a strong electronegative gas that captures free electrons. Therefore, addition of small amounts of SF6 ( 0.3 ) significantly reduces the average pulse charge and suppresses the production of streamer signal in the RPCs [7]. To study the effect of variation of SF6 concentration, we have flown the SF6 at different proportions (from 0.3 to 0.8 in steps of 0.1 ) fixing the proportion of at 15 . The charge induced on the copper strip was measured using an oscilloscope (DSO-X 3104 A) which stored the digitized analog pulses. Around 1000 signals were collected for each proportion of SF6, and their charge distributions and time resolutions were studied.
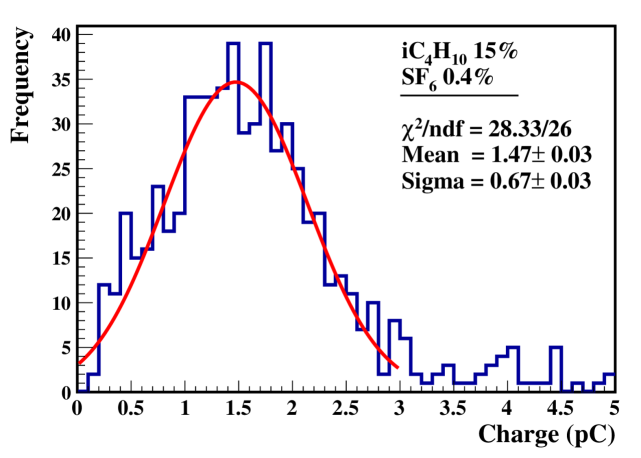
3.1 Charge distribution
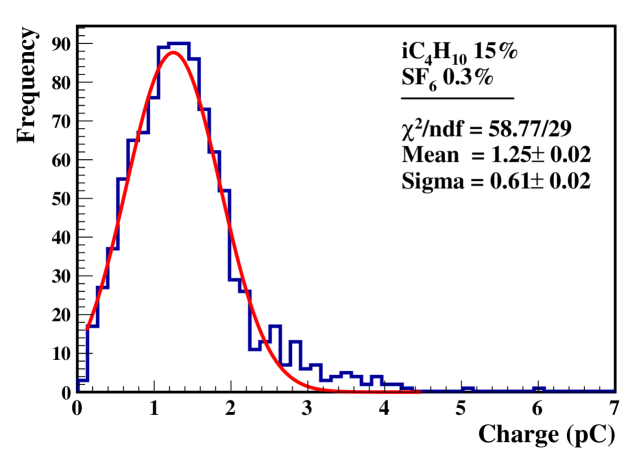
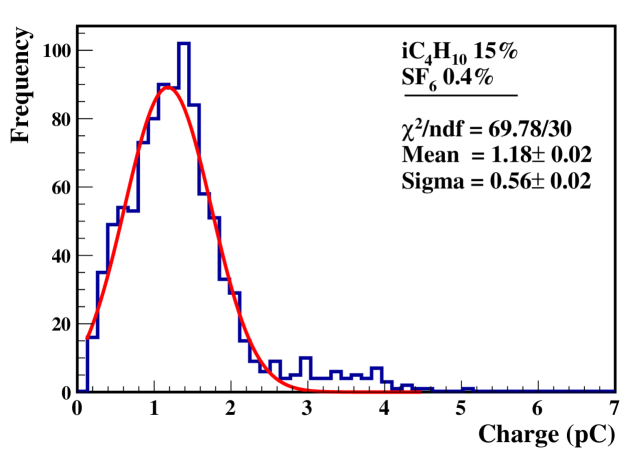
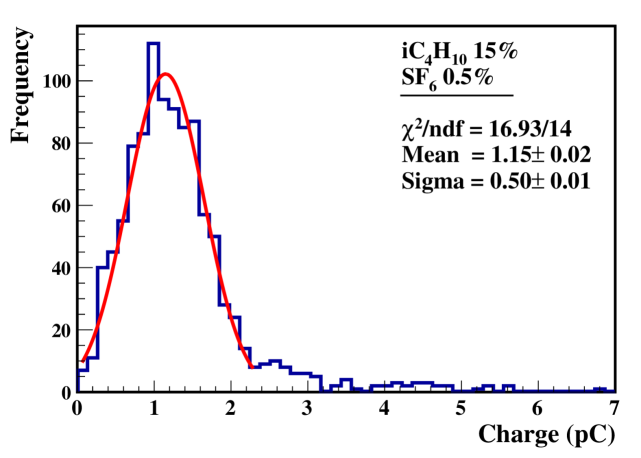
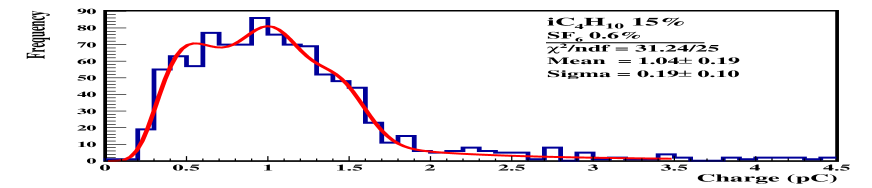
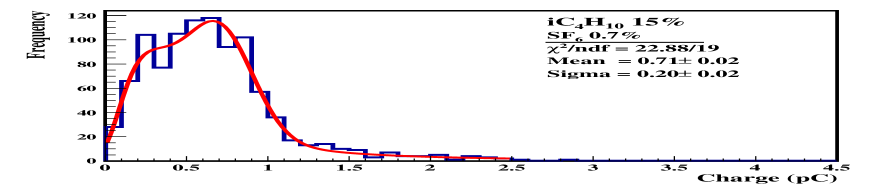
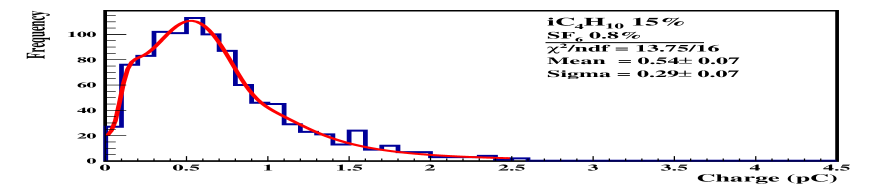
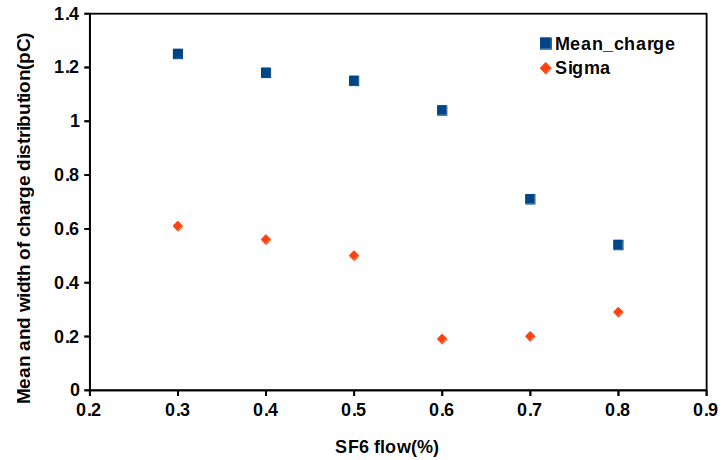
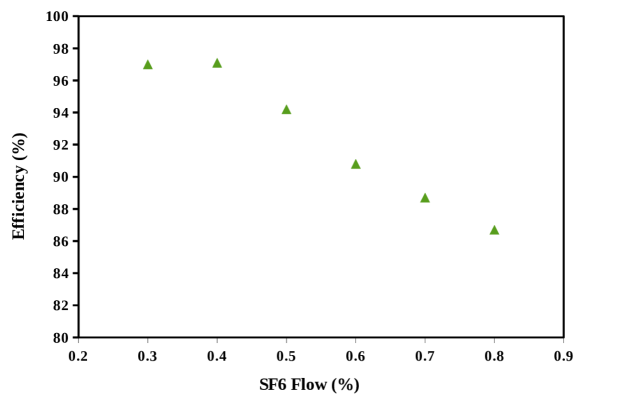
The charge distributions of the avalanche signals collected at same operating voltage for various proportions of SF6 were fitted with Gaussian’s and Landau functions as shown in figure 3. In general we have used Landau function for the rising part of the distribution (0-0.5). This Landau function convoluted with the Gaussian which is used for peak as well as tail part of the distribution. Mean and sigma collected from the combined distribution function. As the concentration of SF6 increases from 0.3 to 0.8 , the charge spectra gets narrower and the peak is shifted to the left side. This indicates that only a lesser number of events induces an adequate amount of charge in the strip at higher concentration of SF6. Thus the mean of the charge distribution decreases with an increase in the SF6 concentration as shown in the figure 4(a). This behaviour is due to the capture of the electrons in the gas gap by SF6 because of its high electron affinity (1.05 0.10 eV) [7, 8]. This reduces the multiplication of electrons in the gas gap. Therefore, the muon events, which cause the production of very less number of primary charge pairs in the gap, would not be able to induce signals above threshold on read-out electrodes on that particular applied high voltage. This results the displacement of working point towards higher field intensity which could increase the noise signals The efficiency on the working point at 10.4 kV is shown in the figure 4(b) which reduced by the addition of SF6 in higher proportions.
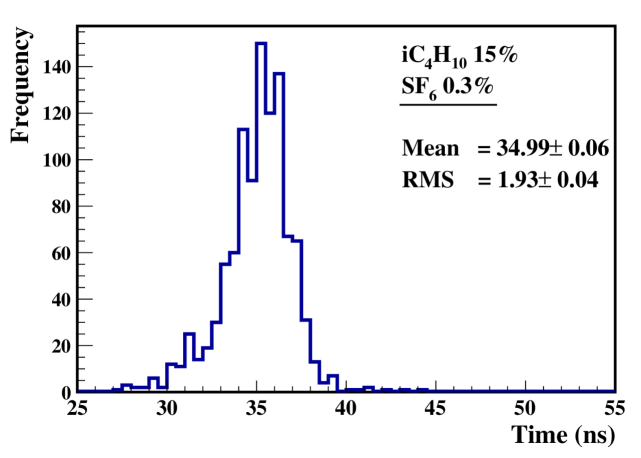
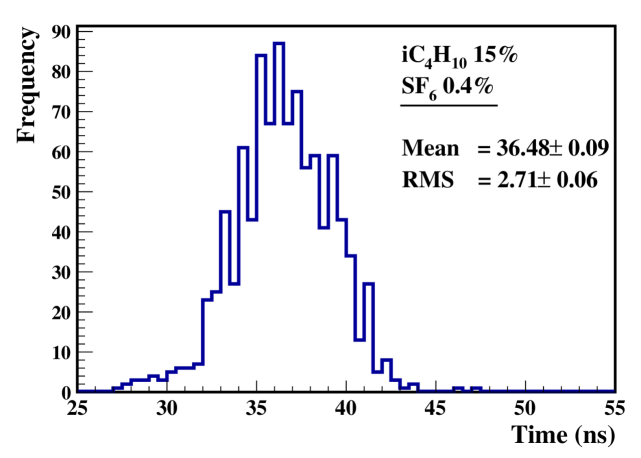
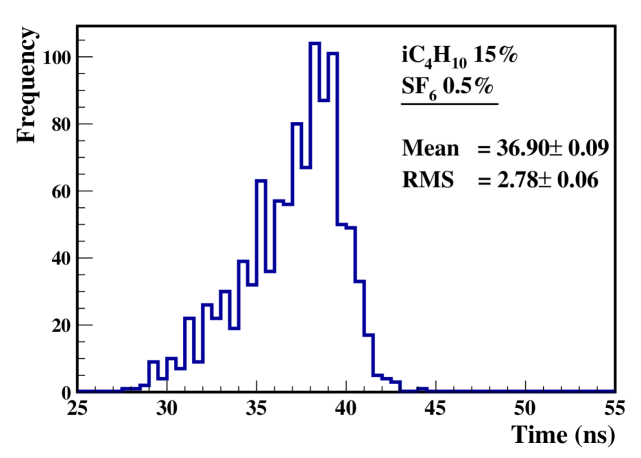
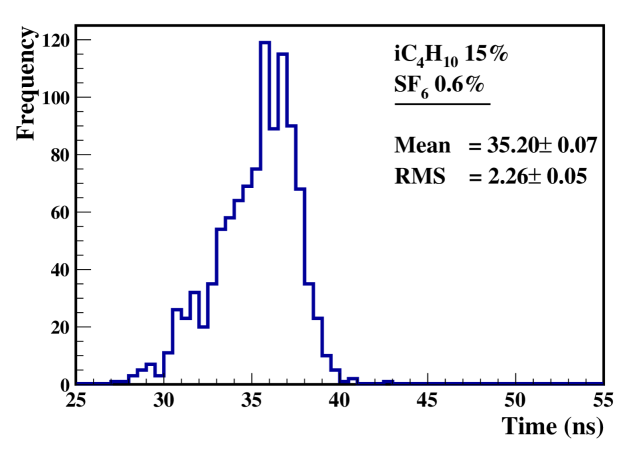
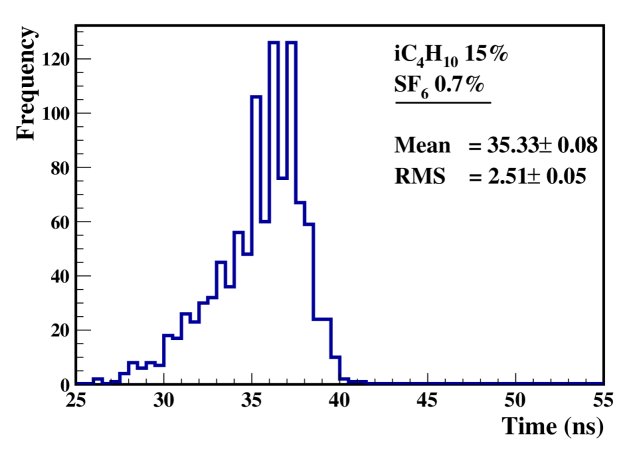
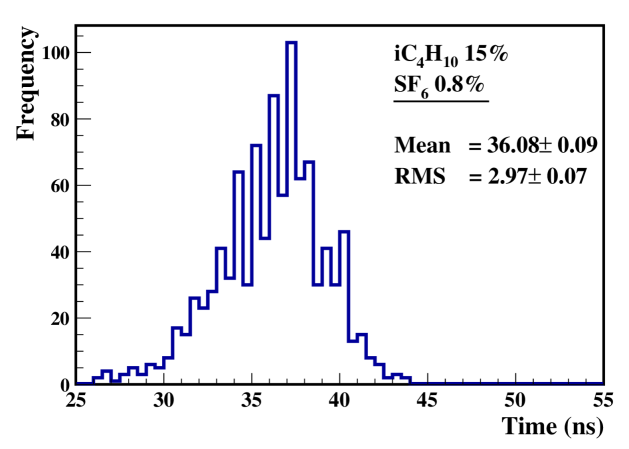
3.2 Time resolution
The time distribution of the signals collected with RPC at different SF6 proportions is shown in figure 5. There was no significant effect on the time resolution of the RPCs by the variation in SF6 concentration.
4 Performance of RPC at different percentages of Isobutane ()
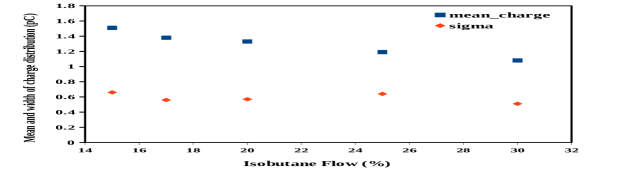
Isobutane molecules act as quenchers by absorbing UV photons in a wide range of energies and thereby reducing the formation of secondary avalanches. The performance of RPC was studied at various proportions of Isobutane keeping SF6 at 0.4 . The charge distributions and time resolutions were measured from 1000 signals collected for each proportion of Isobutane. The dependance of average signal charge and time on the Isobutane concentration is analysed.
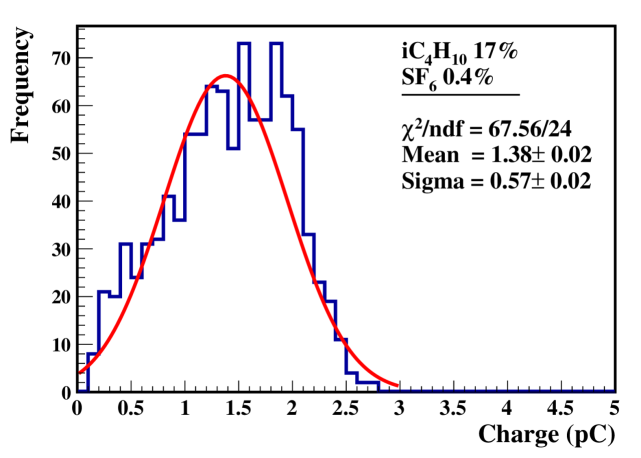
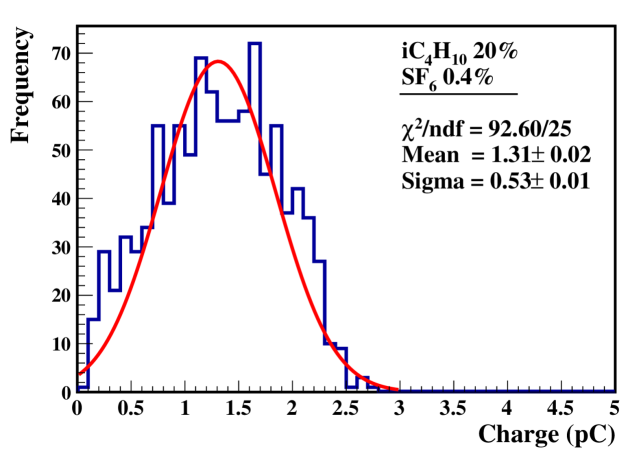
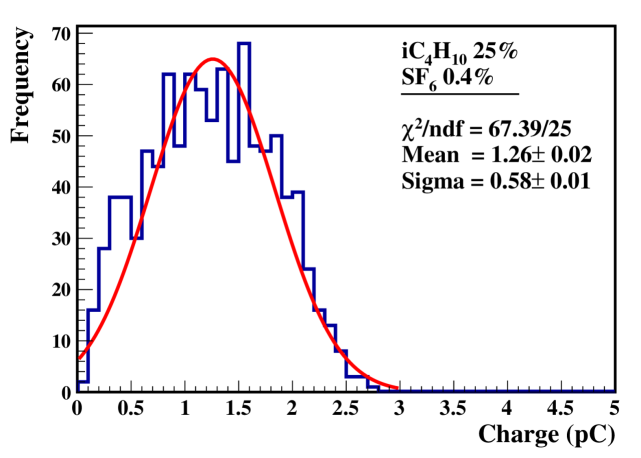
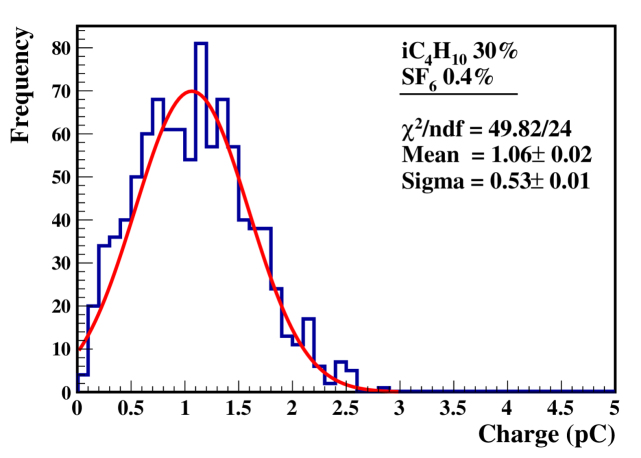
4.1 Charge distribution
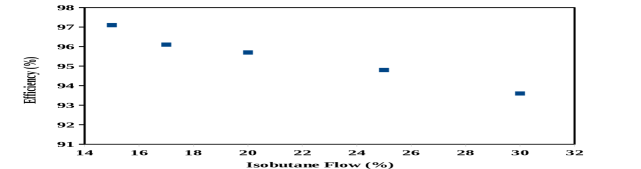
The charge distributions of the signals collected at various Isobutane proportions were fitted with Gaussians and are shown in figure 6. It is observed from the plot that the RPC is less sensitive to the variations in the proportion of Isobutane in comparison with its sensitivity to SF6 variation. The plot of efficiency versus Isobutane concentration, shown in figure 7, implies that the change in the Isobutane concentration by 10 reduces the efficiency by only 2 approximately.
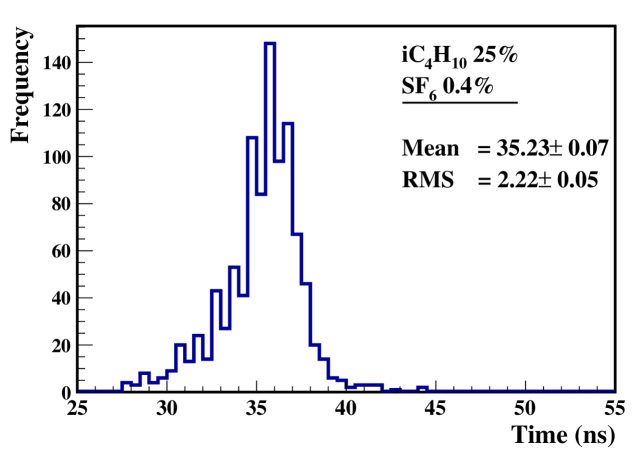
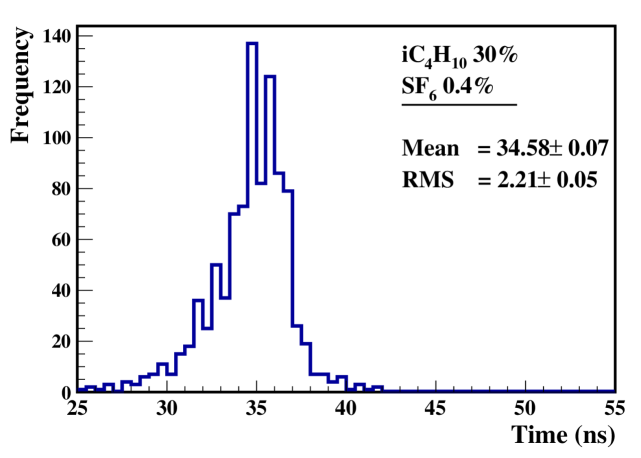
4.2 Time resolution
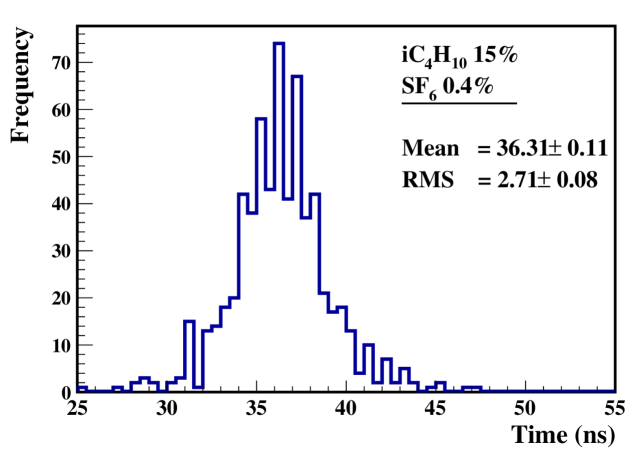
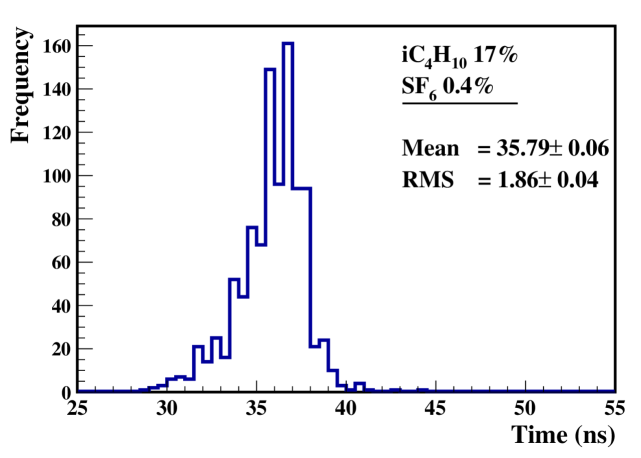
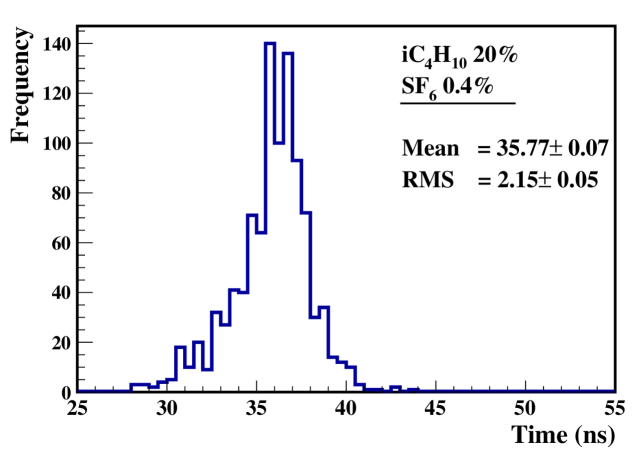
The time distribution of the signals collected with RPC for various Isobutane proportions is shown in figure 8. The time resolution of the RPC is found to be 2 ns approximately. The time resolution is not affected significantly by the variation in Isobutane concentration.
5 Conclusion
The variations in the compositions of gaseous ionizing medium in the RPC affects the propagation and multiplication of charge carriers and hence the performance of the RPCs. Therefore, the performance of RPC was studied at different concentration of SF6 and Isobutane. A slight increase in the SF6 concentration causes significant reduction in the mean of the charge induced on the strips as well as in the efficiency. This is due to the capture of the electrons in the gas gap by SF6 because of its high electron affinity. However, RPC is less sensitive for charge collection to the variations in the concentration of Isobutane compare to the variation of SF6. The mean charge and efficiency were observed to be varied slightly by increasing the concentration of Isobutane gas. This is due to the fact that Isobutane absorbs the UV photons, and hence controls the formation of secondary avalanches. There was no significant difference in the time resolution of RPC by the variation in the concentration of SF6 or Isobutane.
Acknowledgements
This work was done with the support of the Department of Atomic Energy (DAE), and the Department of Science and Technology (DST), Government of India. The authors would like to thank INO collaboration for their help throughout the work.
References
- [1] R. Santonico, New generations of RPCs for accelerator and non-accelerator physics, JINST 8 (2013) P04023.
- [2] D. Watts, G. Borghi, F. Sauli, U. Amaldi, The use of multi-gap resistive plate chambers for in-beam PET in proton and carbon ion therapy, Journal of Radiation Research 54 (2013) 136-142.
- [3] R. Santonico and R. Cardarelli, Development of resistive plate counters, Nucl. Instr. and Meth. A 187 (1981) 377-380.
- [4] S. Ahmed et al., Invited review: Physics potential of the ICAL detector at the India-based Neutrino Observatory (INO), Pramana 88 (2017) 79.
- [5] S.D. Kalmani et al., On-line gas mixing and multi-channel distribution system, Nucl. Instrum. Meth. A 602 (2009) 845-849.
- [6] M. Abbrescia et al., The simulation of resistive plate chambers in avalanche mode: charge spectra and efficiency, Nucl. Instr. and Meth. A 431 (1999) 413-427.
- [7] P. Camarri et al., Streamer suppression with SF6 in RPCs operated in avalanche mode, Nucl. Instrum. Meth. A 414 (1998) 317-324.
- [8] M. Salim et al., Experimental and numerical studies on the effect of in a glass RPC, JINST 7 (2012) P11019.