Modeling Dust and Starlight in Galaxies Observed by Spitzer and Herschel: The KINGFISH Sample
Abstract
Dust and starlight are modeled for the KINGFISH project galaxies. With data from 3.6 to 500, models are strongly constrained. For each pixel in each galaxy we estimate (1) dust surface density; (2) , the dust mass fraction in PAHs; (3) distribution of starlight intensities heating the dust; (4) luminosity emitted by the dust; and (5) dust luminosity from regions with high starlight intensity. The models successfully reproduce both global and resolved spectral energy distributions. We provide well-resolved maps for the dust properties. As in previous studies, we find to be an increasing function of metallicity, above a threshold . Dust masses are obtained by summing the dust mass over the map pixels; these “resolved” dust masses are consistent with the masses inferred from model fits to the global photometry. The global dust-to-gas ratios obtained from this study correlate with galaxy metallicities. Systems with have most of their refractory elements locked up in dust, whereas when most of these elements tend to remain in the gas phase. Within galaxies, we find that is suppressed in regions with unusually warm dust with . With knowledge of one long-wavelength flux density ratio (e.g., ), the minimum starlight intensity heating the dust () can be estimated to within 50%. For the adopted dust model, dust masses can be estimated to within 0.07 dex accuracy using the 500 luminosity alone. There are additional systematic errors arising from the choice of dust model, but these are hard to estimate. These calibrated prescriptions may be useful for studies of high-redshift galaxies.
1 Introduction
Interstellar dust affects the appearance of galaxies by attenuating short-wavelength radiation from stars and ionized gas, and contributing IR, submm, mm, and microwave emission. Dust is also an important agent in the fluid dynamics, chemistry, heating, cooling, and even ionization balance in some interstellar regions, with a major role in the process of star formation. Despite the importance of dust, determination of the physical properties of interstellar dust grains has been a challenging task [for a review, see Draine (2003)]. Even the overall amount of dust present in other galaxies has often been very uncertain.
The “Key Insights on Nearby Galaxies: a Far-Infrared Survey with Herschel” (KINGFISH) (Kennicutt et al. 2011) project is an imaging and spectroscopic survey of 61 nearby (distance ) galaxies with the Herschel Space Observatory. The KINGFISH galaxy sample was chosen to cover a wide range of integrated properties and local interstellar medium (ISM) environments found in the nearby Universe. KINGFISH is a direct descendant of the “Spitzer Infrared Nearby Galaxies Survey” (SINGS) (Kennicutt et al. 2003) which produced complete Spitzer imaging with the Infrared Array Camera (IRAC) (Fazio et al. 2004) and the Multiband Imaging Photometer for Spitzer (MIPS) (Rieke et al. 2004) instruments on Spitzer Space Telescope (Werner et al. 2004). The new Herschel observations include a complete mapping of the galaxies with the Photodetector Array Camera and Spectrometer (PACS) (Poglitsch et al. 2010) and the Spectral and Photometric Imaging Receiver (SPIRE) (Griffin et al. 2010) instruments. The merged KINGFISH and SINGS data-set provides panchromatic mapping of the galaxies, across a wide range of local extragalactic ISM environments. In addition, we have KINGFISH and SINGS data for 9 additional galaxies that fell within the 61 KINGFISH target fields. The photometric maps cover wavelengths from 3.6 to 500, allowing us to produce well-resolved maps of the dust in nearby galaxies.
Skibba et al. (2011) modeled the dust in the KINGFISH galaxy sample using “modified blackbody” models. In the present work we employ a physically-motivated dust model based on a mixture of amorphous silicate grains and carbonaceous grains, each with a distribution of grain sizes (Draine & Li 2007, hereafter DL07). The dust grains are heated by starlight, and the model allows for a distribution of intensities for the starlight heating the dust. With a small number of adjustable parameters, the DL07 model reproduces the observed spectral energy distribution (SED) of the dust emission for a variety of astrophysical systems, giving some confidence in the reliability of dust masses estimated using the model. The DL07 model has been found to be consistent with the 3.6–500 emission from the dust in the star-forming galaxies NGC 628 and NGC 6946 (Aniano et al. 2012), the dust across M31 (Draine et al. 2014), the emission from annular rings in the KINGFISH galaxy sample (Hunt et al. 2015), and the overall dust SEDs from KINGFISH galaxies (Dale et al. 2017).
The present work is a sequel to the KINGFISH study of NGC 628 and NGC 6946 (Aniano et al. 2012, hereafter AD12). AD12 developed the image processing and dust modeling techniques employed here, using the spiral galaxies NGC 628 and NGC 6946 as examples. The present work takes into account a recent “recalibration” of the DL07 model made possible by Planck observations of diffuse Galactic emission (Planck Collaboration et al. 2016). We expand the spatially-resolved dust modeling to the full KINGFISH galaxy sample, producing maps of dust mass surface density, PAH fraction, and intensities of the starlight heating the dust. Dependences of dust/gas ratio and PAH abundance on galaxy metallicity are examined, and resolved trends within galaxies are studied. While the present results are undoubtedly model-dependent, comparison of different dust models is beyond the scope of the present work.
The paper is organized as follows. A brief overview of the KINGFISH sample is given in Section 2, and in Section 3 we discuss the data sources. Background subtraction and data processing are described in Section 4, and the dust model is summarized in Section 5, including the Planck-based dust mass “recalibration” (Section 5.2). Results are reported in Section 6 with a comparison of dust parameter estimates based on different dust modeling strategies given in Section 6.4; global trends with metallicity are described in Sections 6.5 and 6.6; and resolved trends of DL07 fitted parameters are discussed in Sect. 6.7. We summarize the main results in Section 7. Appendix A (on-line version) displays maps of selected dust parameters for each of the 62 galaxies where we have reliable dust detections, at both MIPS160 and SPIRE250 resolution. Appendix B describes the method used to obtain upper limits for the dust mass for the eight galaxies (5 dwarfs, 3 ellipticals) where we were unable to measure the dust mass reliably. The on-line data set with the KINGFISH data and dust models is described in Appendix C. In Appendix D we examine the robustness of the results as the PSF is reduced, precluding use of the lower-resolution cameras (e.g., MIPS160 and SPIRE500).
2 Galaxy Sample
The observational program was designed to cover the 61 galaxies in the KINGFISH galaxy sample. Because we will also be discussing the 9 extra galaxies, and the statistical properties of various subsamples, we list these for clarity in Table 1. For each galaxy, we list in Table 2.1 the type, adopted distance, and major and minor optical radii (corresponding to 25th mag arcsec-2 isophotes), all taken from Kennicutt et al. (2011, Table 1).
The galaxies IC 3583, NGC 586, NGC 1317, NGC 1481, NGC 1510, NGC 3187, NGC 4533, NGC 7335, and NGC 7337 were not part of the KINGFISH sample, but were observed because each happened to be in the field of view of a KINGFISH galaxy. For these galaxies, we have our standard imaging with PACS and SPIRE, as well as prior observations with IRAC and MIPS, so we are able to measure and model their SEDs with the same techniques as the KINGFISH galaxies. Information for these 9 “extra” galaxies is appended to many of the tables below.
| Sample | name | KF galaxies | Extra galaxies | Total |
|---|---|---|---|---|
| Full sample | KF70 | 61 | 9 | 70 |
| Dust detected | KF62 | 53 | 9 | 62 |
| H I detected | KF57 | 57 | 0 | 57 |
| CO detected | — | 35 | 0 | 35 |
| CO upper limits | — | 5 | 0 | 5 |
2.1 Metallicities
Table 2.1 also lists the oxygen abundance for the galaxies in our sample. These are “characteristic” abundances, which Moustakas et al. (2010) take to be the values at galactocentric radius . For 6 of the KINGFISH galaxies (DDO154, IC 342, NGC 628, NGC 2146, NGC 3077, and NGC 5457) we use metallicities based on observations of weak lines (specifically, [NII]5726 and [OIII]4364) that allow “direct” determination of the electron temperature in the H I regions responsible for the line emission (van Zee et al. 1997; Pilyugin et al. 2007; Engelbracht et al. 2008; Storchi-Bergmann et al. 1994; Li et al. 2013; Croxall et al. 2016). For these galaxies we list the preferred weak line metallicities in the PP04N2 column.
| optical | M160 mask | S250 mask | ||||||||
|---|---|---|---|---|---|---|---|---|---|---|
| Galaxy | Type | |||||||||
| PTa | PP04N2b | (Mpc) | (kpc) | (kpc) | (arcmin2) | () | (arcmin2) | (arcmin2) | ||
| DDO053 | Im | 8.00c | 3.61 | 0.81 | 0.70 | 1.61 | — | — | — | |
| DDO154 | IBm | 7.67c | 4.30 | 1.89 | 1.36 | 5.15 | — | — | — | |
| DDO165 | Im | 8.04c | 4.57 | 2.30 | 1.22 | 4.98 | — | — | — | |
| Hol1 | IABm | 8.04c | 3.90 | 2.06 | 2.06 | 10.4 | — | — | — | |
| Hol2 | Im | 8.13 | 3.05 | 3.52 | 2.78 | 39.0 | 0.72 | 25.2 | 23.0 | |
| IC342 | SABcd | d | 8.85e | 3.28 | 10.5 | 9.18 | 332. | 3.47 | 417. | 398. |
| IC2574 | SABm | 8.19 | 3.79 | 7.27 | 2.72 | 51.1 | 0.66 | 54.5 | 52.7 | |
| M81dwB | Im | 8.19c | 3.60 | 0.46 | 0.30 | 0.40 | — | — | — | |
| NGC0337 | SBd | 8.47 | 19.30 | 8.08 | 4.98 | 4.01 | 3.55 | 11.1 | 6.77 | |
| NGC0584 | E4 | 8.69c | 20.80 | 12.6 | 6.67 | 7.20 | — | — | — | |
| NGC0628 | SAc | 8.64f | 7.20 | 11.0 | 10.0 | 78.8 | 1.70 | 76.1 | 70.3 | |
| NGC0855 | E | 8.43c | 9.73 | 2.83 | 2.79 | 3.09 | — | — | — | |
| NGC0925 | SABd | 8.59 | 9.12 | 13.9 | 7.57 | 47.0 | 1.48 | 46.3 | 44.8 | |
| NGC1097 | SBb | 8.75 | 14.20 | 19.3 | 12.9 | 45.8 | 2.19 | 66.3 | 55.7 | |
| NGC1266 | SB0 | 8.52 | 30.60 | 6.85 | 6.75 | 1.83 | 2.63 | 9.09 | 8.37 | |
| NGC1291 | SB0/a | 8.78 | 10.40 | 14.8 | 14.8 | 75.1 | 0.65 | 123. | 119. | |
| NGC1316 | SAB0 | 9.00g | 21.00 | 12.2 | 8.49 | 8.73 | 1.02 | 17.5 | 14.2 | |
| NGC1377 | S0 | 8.52 | 24.60 | 6.37 | 6.37 | 2.49 | 2.57 | 7.20 | 8.46 | |
| NGC1404 | E1 | 8.78c | 20.20 | 9.75 | 8.69 | 7.71 | — | — | — | |
| NGC1482 | SA0 | 8.74 | 22.60 | 8.09 | 4.40 | 2.59 | 2.19 | 24.4 | 13.0 | |
| NGC1512 | SBab | 8.72 | 11.60 | 15.0 | 9.27 | 38.5 | 0.89 | 34.4 | 15.4 | |
| NGC2146 | Sbab | e | 8.68e | 17.20 | 16.8 | 7.35 | 15.5 | 4.8 | 39.2 | 18.5 |
| NGC2798 | SBa | 8.72 | 25.80 | 9.61 | 9.61 | 5.15 | 2.63 | 13.0 | 10.2 | |
| NGC2841 | SAb | 9.00g | 14.10 | 16.7 | 6.77 | 21.1 | 0.66 | 60.9 | 55.1 | |
| NGC2915 | I0 | 8.17 | 3.78 | 1.04 | 0.51 | 1.37 | 0.58 | 5.58 | 5.51 | |
| NGC2976 | SAc | 8.61 | 3.55 | 3.04 | 1.28 | 11.5 | 2.57 | 25.6 | 21.3 | |
| NGC3049 | SBab | 8.72 | 19.20 | 6.09 | 3.99 | 2.45 | 1.48 | 7.92 | 7.99 | |
| NGC3077 | I0pec | — | 8.64h | 3.83 | 3.34 | 3.29 | 27.8 | 2.14 | 39.2 | 32.6 |
| NGC3184 | SABcd | 8.81 | 11.70 | 12.6 | 11.8 | 40.4 | 0.85 | 64.0 | 60.5 | |
| NGC3190 | SAap | 8.75 | 19.30 | 12.2 | 3.78 | 4.61 | 1.17 | 12.3 | 11.2 | |
| NGC3198 | SBc | 8.76 | 14.10 | 17.5 | 5.98 | 19.5 | 1.23 | 36.9 | 30.0 | |
| NGC3265 | E | 8.69 | 19.60 | 3.65 | 2.80 | 0.99 | 2.04 | 6.39 | 6.10 | |
| NGC3351 | SBb | 8.77 | 9.33 | 10.1 | 6.74 | 28.9 | 1.35 | 49.1 | 43.3 | |
| NGC3521 | SABbc | 8.81 | 11.20 | 17.9 | 7.83 | 41.4 | 2.19 | 91.4 | 76.6 | |
| NGC3621 | SAd | 8.75 | 6.55 | 11.7 | 6.55 | 66.4 | 1.07 | 103. | 85.7 | |
| NGC3627 | SABb | 8.62 | 9.38 | 12.4 | 5.26 | 27.6 | 2.00 | 87.2 | 54.9 | |
| NGC3773 | SA0 | 8.58 | 12.40 | 2.13 | 1.80 | 0.93 | 1.86 | 5.85 | 5.81 | |
| NGC3938 | SAc | 8.68 | 17.90 | 14.0 | 12.8 | 20.8 | 1.15 | 39.4 | 34.5 | |
| NGC4236 | SBdm | 8.37 | 4.45 | 10.4 | 2.85 | 55.4 | 0.71 | 64.7 | 63.2 | |
| NGC4254 | SAc | 8.79 | 14.40 | 11.3 | 9.76 | 19.7 | 2.40 | 45.9 | 33.2 | |
| NGC4321 | SABbc | 8.76 | 14.30 | 15.4 | 13.1 | 36.7 | 1.66 | 60.6 | 40.4 | |
| NGC4536 | SABbc | 8.63 | 14.50 | 16.0 | 6.25 | 17.6 | 2.09 | 37.0 | 25.2 | |
| NGC4559 | SABcd | 8.58 | 6.98 | 10.9 | 4.08 | 33.8 | 1.17 | 43.2 | 40.3 | |
| NGC4569 | SABab | 8.80 | 9.86 | 11.5 | 4.85 | 21.2 | 1.95 | 18.3 | 17.2 | |
| NGC4579 | SABb | 8.79 | 16.40 | 14.0 | 11.1 | 21.4 | 2.24 | 22.4 | 18.0 | |
| NGC4594 | SAa | 8.79 | 9.08 | 11.5 | 2.98 | 15.5 | 1.55 | 31.1 | 27.8 | |
| NGC4625 | SABmp | 8.67 | 9.30 | 2.95 | 2.55 | 3.23 | 1.58 | 7.47 | 6.47 | |
| NGC4631 | SBd | 8.38 | 7.62 | 17.2 | 0.30 | 3.28 | 3.16 | 83.4 | 43.3 | |
| NGC4725 | SABab | 8.71 | 11.90 | 18.6 | 12.9 | 62.7 | 1.15 | 64.1 | 55.0 | |
| NGC4736 | SAab | 8.68 | 4.66 | 7.60 | 6.15 | 80.0 | 1.38 | 124. | 120. | |
| NGC4826 | SAab | 8.78 | 5.27 | 6.13 | 4.70 | 38.5 | 2.88 | 37.3 | 17.3 | |
| NGC5055 | SAbc | 9.00g | 7.94 | 14.6 | 8.14 | 69.7 | 2.75 | 87.6 | 67.6 | |
| NGC5398 | SBdm | 8.33 | 7.66 | 3.14 | 1.85 | 3.67 | 1.62 | 7.29 | 5.72 | |
| NGC5408 | IBm | 8.19 | 4.80 | 1.13 | 0.53 | 0.97 | 2.95 | 6.66 | 5.42 | |
| NGC5457 | SABcd | h | 8.38i | 6.70 | 17.1 | 16.9 | 238. | 0.74 | 398. | 385. |
From Moustakas et al. (2010) except as noted Derived from KK metallicities from Moustakas et al. (2010) except as noted van Zee et al. (1997) Pilyugin et al. (2006) Engelbracht et al. (2008) Berg et al. (2015) see text Storchi-Bergmann et al. (1994) Li et al. (2013)
Marble et al. (2010)
For the remaining 55 KINGFISH galaxies, we consider two popular “strong line” estimators: the “PT” Pilyugin & Thuan (2005) method, taken from Moustakas et al. (2010), and the “PP04N2” method based on [NII]/H (Pettini & Pagel 2004). Abundance measurements by Moustakas et al. (2010, “characteristic” values from their Table 8) with the “KK04” (Kobulnicky & Kewley 2004) calibration were converted to PP04N2 values, according to the parameters recommended by Kewley & Ellison (2008). This procedure is described in detail by Hunt et al. (2016) who use the same metallicities in their analysis; they preferred the PP04N2 calibration because it shows tighter scaling relations overall than other calibrations, and because its behavior in the mass-metallicity relation is quite similar to weak-line electron-temperature determinations (e.g., Andrews & Martini 2013).
For NGC 1316, NGC 2841, and NGC 5055 the original KK04 O/H values (9.4) from Moustakas et al. (2010) exceeded the range of applicability for the transformations formulated by Kewley & Ellison (2008). Thus we have (somewhat arbitrarily) given these three galaxies a maximum metallicity of , consistent with what is advocated by Pilyugin et al. (2007). Ultimately, the metallicities for these three galaxies are uncertain, but toward the high end of the observed range.
Figure 1 compares the PT and PP04N2 metallicity estimates for the 55 KINGFISH galaxies where “direct” method estimates are unavailable. Note that the PT and PP04N2 metallicities differ by as much as 0.5 dex (e.g., DDO154, type IBm) or even 0.63 dex (e.g., NGC1482, type SA0). It is evident that the metallicity estimates have significant uncertainties, and that there are systematic differences between the two methods (see also Kewley & Ellison 2008). Below we will argue, by comparing PAH abundances estimated from infrared observations with these two metallicity estimates, that the PP04N2 estimate appears to be more reliable, at least for the galaxies in the KINGFISH sample.
3 Observations and Data Reduction
3.1 Infrared, Far-Infrared, and Submm
Most of the galaxies in the KINGFISH sample are part of the SINGS galaxy sample and were imaged by Spitzer Space Telescope as part of the SINGS observing program (Kennicutt et al. 2003). IRAC and MIPS imaging obtained by other Spitzer Space Telescope observing programs was available for the remaining KINGFISH galaxies.
The KINGFISH project imaged the galaxies with the Herschel Space Observatory (Pilbratt et al. 2010), following the observing strategy described by Kennicutt et al. (2011), using the 70, 100, and PACS filters, and the 250, 350, and 500 SPIRE filters. The maps were designed to cover a region out to times the optical radius , with good signal to noise (S/N) and redundancy.
Following AD12, we will use “camera” to identify each optical configuration of the observing instruments, i.e., each different channel or filter arrangement of the instruments will be referred to as a different “camera”. With this nomenclature, each “camera” has a characteristic spectral response and point-spread function (PSF). We will refer to the IRAC, MIPS, PACS, and SPIRE cameras using their nominal wavelengths in microns: IRAC3.6, IRAC4.5, IRAC5.8, IRAC8.0, MIPS24, MIPS70, MIPS160, PACS70, PACS100, PACS160, SPIRE250, SPIRE350, and SPIRE500.
IRAC imaged the galaxies in four bands, centered at 3.6, 4.5, 5.8, and 8.0, as described by Kennicutt et al. (2003). The images were processed by the SINGS Fifth Data Delivery pipeline.111Details can be found in the data release documentation: https://irsa.ipac.caltech.edu/data/SPITZER/SINGS/doc/sings_fifth_delivery_v2.pdf The IRAC images are calibrated for point sources. Photometry of extended sources requires so-called “aperture corrections”. We multiply the intensities in each pixel by the asymptotic (infinite radii) value of the aperture correction (i.e., the aperture correction corresponding to an infinite radius aperture). We use the factors 0.91, 0.94, 0.66 and 0.74 for the 3.6, 4.5, 5.8, and 8.0 bands, respectively, as described in the IRAC Instrument Handbook (V2.0.1)222 http://irsa.ipac.caltech.edu/data/SPITZER/docs/irac/iracinstrumenthandbook/IRAC_Instrument_Handbook.pdf.
Imaging with MIPS at 24, 70, and 160 was carried out following the observing strategy described in Kennicutt et al. (2003). The data were reduced using the LVL (Local Volume Legacy) project pipeline.333Details can be found in the data release documentation: https://irsa.ipac.caltech.edu/data/SPITZER/LVL/LVL_DR5_v5.pdf. A correction for nonlinearities in the MIPS70 camera was applied, as described by Dale et al. (2009) and Gordon et al. (2011).
The galaxies were observed with the PACS and SPIRE instruments on Herschel, using the “Scan Map” observing mode. Both PACS and SPIRE images were first reduced to “level 1” (flux-calibrated brightness time series, with attached sky coordinates) using HIPE v11.1.0 (Ott 2010), and maps (“level 2”) were created using the Scanamorphos data reduction pipeline (Roussel 2013), v24.0. This reduction strategy used the latest available PACS and SPIRE calibrations (as of 2014 July), and was designed to preserve the low surface brightness diffuse emission.
The assumed beam sizes are 465.4, 822.6, and 1769 for SPIRE250, SPIRE350, and SPIRE500, respectively. Additionally, we excluded discrepant bolometers from the map and adjusted the pointing to match the MIPS24 map.
3.2 H I Observations
To measure the H I gas mass we use H I 21 cm line observations made with the NSF’s NRAO444The National Radio Astronomy Observatory is a facility of the National Science Foundation operated under cooperative agreement by Associated Universities, Inc. Karl G. Jansky Very Large Array (VLA).
For 23 of our galaxies we have data from The H I Nearby Galaxies Survey (THINGS Walter et al. 2008) and for four galaxies we use data from the LittleTHINGS survey (Hunter et al. 2012). For 10 galaxies without THINGS or LittleTHINGS observations, we obtained VLA 21-cm maps in programs AL731 and AL735, in some cases also incorporating archival VLA observations. For 8 targets, we reduced and incorporated VLA archival observations of the 21 cm line. For one galaxy, NGC 4559, we use archival WSRT observations. These observations are described in Leroy et al. (2013). For each galaxy, the source of the H I map is listed in Table 3. The dominant uncertainty on the measured H I masses comes from the calibration uncertainties of %.
For NGC 1266 Alatalo et al. (2011) estimated based on 21 cm absorption of the radio continuum from the nucleus (for an assumed ). However, we estimate that H I 21cm line emission from as much as of H I could have gone undetected because of the strong continuum ( at 1.4GHz), hence the H I mass must be considered highly uncertain.
Thus we have H I data for 57 of the 61 KINGFISH galaxies. H I 21 cm observations were not available for NGC 1316 (SAB0), NGC 1377 (S0), NGC 1404 (E1), NGC 5866 (S0), nor for the nine extra galaxies.
3.3 CO Observations
To estimate H2 masses, we use observations of CO line emission together with an assumed ratio of mass to CO luminosity. The adopted CO-to- “conversion factors” are discussed in §4.5.
For 38 KINGFISH galaxies we use 12CO maps from the the HERA CO Line Emission Survey (HERACLES) (Leroy et al. 2009, 2013).
For NGC 4826, we use 12CO mapping from the Nobeyama Radio Observatory (Koda et al. in prep). We propagate uncertainties on the CO integrated intensities from the spectra through the gridding and masking of the cube as described in Leroy et al. (2013).
For NGC 1266 we use from Alatalo et al. (2011). We arbitrarily adopt a 50% uncertainty. For NGC 3190 we use CO line fluxes from Martinez-Badenes et al. (2012).
Thus we have CO data for 41 of the 61 galaxies in the KINGFISH sample. CO observations are not available for any of the nine extra galaxies.
| Galaxy | H I Source | CO Source |
| DDO 053 | LittleTHINGS | … |
| DDO 154 | THINGS | HERACLES |
| DDO 165 | LittleTHINGS | … |
| Holmberg I | THINGS | HERACLES |
| Holmberg II | THINGS | HERACLES |
| IC 342 | Hyperleda | … |
| IC 2574 | THINGS | HERACLES |
| M81 dwB | THINGS | HERACLES |
| NGC 0337 | Archival | HERACLES |
| NGC 0584 | Hyperleda | … |
| NGC 0628 | THINGS | HERACLES |
| NGC 0855 | Hyperleda | … |
| NGC 0925 | THINGS | HERACLES |
| NGC 1097 | Hyperleda | … |
| NGC 1266 | ABY11 | ABY11 |
| NGC 1291 | Hyperleda | … |
| NGC 1482 | Hyperleda | … |
| NGC 1512 | Hyperleda | … |
| NGC 2146 | AL735 | HERACLES |
| NGC 2798 | AL735 | HERACLES |
| NGC 2841 | THINGS | HERACLES |
| NGC 2915 | Hyperleda | … |
| NGC 2976 | THINGS | HERACLES |
| NGC 3049 | AL735 | HERACLES |
| NGC 3077 | THINGS | HERACLES |
| NGC 3184 | THINGS | HERACLES |
| NGC 3190 | AL735 | MBLE12 |
| NGC 3198 | THINGS | HERACLES |
| NGC 3265 | Hyperleda | … |
| NGC 3351 | THINGS | HERACLES |
| NGC 3521 | THINGS | HERACLES |
| NGC 3621 | THINGS | … |
| NGC 3627 | THINGS | HERACLES |
| NGC 3773 | Hyperleda | … |
| NGC 3938 | Archival, AL731 | HERACLES |
| NGC 4236 | AL731, AL735 | HERACLES |
| NGC 4254 | Archival, AL731 | HERACLES |
| NGC 4321 | Archival | HERACLES |
| NGC 4536 | Archival, AL731, AL735 | HERACLES |
| NGC 4559 | Archival(WSRT) | HERACLES |
| NGC 4569 | Archival | HERACLES |
| NGC 4579 | Archival | HERACLES |
| NGC 4594 | Archival, AL735 | HERACLES |
| NGC 4625 | Archival | HERACLES |
| NGC 4631 | Archival | HERACLES |
| NGC 4725 | AL735 | HERACLES |
| NGC 4736 | THINGS | HERACLES |
| NGC 4826 | THINGS | CANON |
| NGC 5055 | THINGS | HERACLES |
| NGC 5398 | Hyperleda | … |
| NGC 5408 | Hyperleda | … |
| NGC 5457 | THINGS | HERACLES |
| NGC 5474 | Archival | HERACLES |
| NGC 5713 | Archival | HERACLES |
| NGC 6946 | THINGS | HERACLES |
| NGC 7331 | THINGS | HERACLES |
| NGC 7793 | THINGS | … |
| THINGS = Walter et al. (2008) | ||
| HERACLES = Leroy et al. (2009, 2013) | ||
| ABY11 = Alatalo et al. (2011) | ||
| LittleTHINGS = Hunter et al. (2012) | ||
| MBLE12 = Martinez-Badenes et al. (2012) | ||
| Hyperleda = Makarov et al. (2014) | ||
| CANON = Donovan Meyer et al. (2013) | ||
| FWHMa | 50% powera | Final grid | Compatible | |
| Camera | () | diameter () | pixelb () | camerasc |
| IRAC3.6 | 1.90 | 2.38 | — | not used as a final-map PSF |
| IRAC4.5 | 1.81 | 2.48 | — | not used as a final-map PSF |
| IRAC6 | 2.11 | 3.94 | — | not used as a final-map PSF |
| IRAC8 | 2.82 | 4.42 | — | not used as a final-map PSF |
| PACS70 | 5.67 | 8.46 | — | not used as a final-map PSF |
| MIPS24 | 6.43 | 9.86 | — | not used as a final-map PSF |
| PACS100 | 7.04 | 9.74 | — | not used as a final-map PSF |
| PACS160 | 11.2 | 15.3 | 5.0 | IRAC; MIPS24; PACS |
| SPIRE250 (S250) | 18.2 | 20.4 | 6.0 | IRAC; MIPS24; PACS; SPIRE250 |
| MIPS70 | 18.7 | 28.8 | 10.0 | IRAC; MIPS24,70; PACS; SPIRE250 |
| SPIRE350 | 24.9 | 26.8 | 10.0 | IRAC; MIPS24,70; PACS; SPIRE250,350 |
| SPIRE500 | 36.1 | 39.0 | 15.0 | IRAC; MIPS24,70; PACS; SPIRE |
| MIPS160 (M160) | 38.8 | 58.0 | 18.0 | IRAC; MIPS; PACS; SPIRE |
| a Values from Aniano et al. (2011) for the circularized PSFs. | ||||
| b The pixel size in the final-map grids is chosen to Nyquist-sample the PSFs. | ||||
| c Other cameras that can be convolved into the camera PSF (see text for details). | ||||
4 Image Analysis
4.1 Background Subtraction
All camera images are first rotated to RA/Dec coordinates, and then trimmed to a common sky region. For each image we estimate the best-fit “tilted plane” background (consisting of instrumental background, Galactic foreground emission, and cosmic infrared background emission) using an iterative procedure described in AD12. The procedure uses multiple cameras to identify regions in the image where only background emission is present. Regions where excess emission is detected at more than one wavelength are not used for background estimation.
4.2 Convolution to Common Resolution
After background subtraction, the images are convolved to a common point spread function (PSF), and resampled on a common final-map grid, with pixel sizes for each final-map PSF as given in Table 4. Finally, the dispersion in intensities of the background pixels (which includes noise coming from unresolved undetected background sources) is used to estimate the pixel flux uncertainties. By comparing the MIPS and PACS images, we can also estimate a calibration uncertainty. The procedures used are fully described in AD12.
As discussed in AD12, multiwavelength observations must be degraded to a common PSF before dust models are fit to the observed intensities. The convolution to a common PSF is carried out using the methods described by Aniano et al. (2011). In the present work, we present, for each galaxy, resolved results at two final-map PSFs: SPIRE250 and MIPS160, henceforth abbreviated as S250 and M160. S250 is the PSF with smallest FWHM (full width at half maximum) that allows use of enough cameras to adequately constrain the dust SED (IRAC, MIPS24, and PACS70, 100, 160, SPIRE250). The M160 PSF allows inclusion of all the cameras (IRAC, MIPS, PACS, SPIRE), therefore producing the most reliable maps; this will be our “gold standard”. Table 4 lists the resolutions of the cameras, the pixel size in the final-map grids used, and the other cameras that can be used at this resolution. In Appendix D we compare dust mass estimates obtained with different final-map PSFs.
4.3 Image Segmentation
After convolution to a common “final-map” PSF and background subtraction, we next fit a dust model to the observed SED of each pixel in the field. In order for dust mass estimation to be reliable, the pixel’s SED must be measured in a number of bands with a reasonable signal/noise ratio. However, estimates of the total dust infrared luminosity per unit area from a single pixel, , are reliable so long as there is a significant detection of far-infrared emission after background subtraction.
The procedure used for automatically identifying “galaxy” pixels is described in Appendices A and B of AD12. For purposes of dust mass estimation, we need to limit the modeling to a “galaxy mask” consisting of pixels where the emission from the galaxy of interest has sufficiently high surface brightness for dust mass estimation (via SED fitting) to be reasonably reliable.
A simple criterion for “sufficiently high surface brightness” is that the total dust luminosity/projected area exceed a specified threshold value, . The value chosen for will depend on the noisiness of the data [which may depend on the brightness of the (subtracted) Galactic foreground emission, as well as on the presence of other extragalactic objects in the field, stars, or even small-scale structure in the Galactic foreground, which may compromise background estimation and subtraction]. The choice of will also depend on the choice of final-map PSF: use of a larger PSF improves the signal/noise in each pixel by smoothing, and also enables use of more cameras to constrain the dust modeling, and thus may allow use of a lower threshold . In the present study, was chosen subjectively for each galaxy.
In this paper we report results for two final-map PSFs: S250, and M160, with the PSF FWHM corresponding to linear scales for S250 and for M160 at the median distance of the KINGFISH galaxy sample. Table 2.1 lists used to define the galaxy masks for the M160 resolution studies, for the 62 galaxies where we detect dust emission. Our adopted values of vary from galaxy to galaxy, ranging from values as low as (NGC 2915) to values as high as (NGC 6946). The median (e.g., NGC 4625). For each galaxy where dust is reliably detected at M160 resolution, we also generate a S250 resolution mask, intended to comprise the region where the S250 resolution data permit reliable estimation of the dust surface density. Our S250 masks are often similar in size to the M160 mask, but for some galaxies the S250 mask is considerably smaller than the M160 mask – the most extreme example is NGC 1481, where the S250 mask area is only 37% of M160 mask area. The M160 and S250 masks are shown in Figures 17.1-17.62. The solid angle of each mask is listed in Table 2.1. Because of the improved signal-to-noise ratio (S/N) in each pixel, most of the analysis in this paper will be done with the M160 resolution images and masks.
For 5 dwarf galaxies where dust detection is uncertain (DDO053, DDO154, DDO165, Hol1, and M81dwB) we choose instead to use masks defined by H I observations. For 3 elliptical galaxies where dust detection is uncertain (NGC0584, NGC0855, and NGC1404) we use -based masks. . We do not detect dust in any of these 8 galaxies. See Appendix B for further details.
4.4 Integrated Fluxes
The Spitzer and Herschel band surface brightnesses are integrated over the M160 and S250 resolution galaxy masks to obtain integrated flux densities. The IRAC and MIPS flux densities are given in Table LABEL:tab:spitzer, and the PACS and SPIRE flux densities are given in Table LABEL:tab:herschel. Note that MIPS70, MIPS160, SPIRE350, and SPIRE500 are not used at S250 resolution.
The uncertainties given in Tables LABEL:tab:spitzer and LABEL:tab:herschel include uncertainties associated with background subtraction, as well as calibration uncertainties. As discussed in §5.3, the fluxes measured by PACS and MIPS sometimes differ by considerably more than the estimated uncertainties: we know that some of the uncertainties have been underestimated, although it is not clear how to improve on our estimates.
Dale et al. (2017) carried out careful foreground star and background galaxy removal tailored for globally integrated photometry. For 44 of the 53 KINGFISH galaxies where we claim dust detections, the SPIRE500 flux for our M160 galaxy mask is within 10% of the global SPIRE500 photometry from Dale et al. (2017). Thus, we are not missing a significant reservoir of dust in the outer parts of the disk.555For NGC 1512 Dale et al. (2017) find a SPIRE 500 flux that is 39% larger than our value, but part of the difference is because they included the companion galaxy NGC 1510, which we have treated separately.
4.5 Gas Masses
For galaxies observed by THINGS, H I 21 cm line intensities were extracted over the area of the M160 resolution galaxy mask for each galaxy. The H I column density was estimated assuming the 21 cm emission to be optically thin.
For the 38 galaxies in the HERACLES sample, 12CO(2–1) line fluxes were obtained by integrating over the M160 resolution galaxy mask, and the H2 mass was estimated from the CO line flux assuming and a standard conversion factor666 corresponds to if a factor 1.36 is assumed to allow for Helium and heavier elements. . The adopted value is representative of the values found in 26 nearby star-forming galaxies by Sandstrom et al. (2013).
For NGC 1266 we use the integrated CO emission and the lower bound on the H I mass from Alatalo et al. (2011).
5 Dust Modeling
5.1 DL07 Dust Model
We employ the DL07 dust model, using “Milky Way” grain size distributions (Weingartner & Draine 2001a). DL07 described the construction of the dust model, and AD12 described its usage in the context of the KINGFISH galaxies. The DL07 dust model has a mixture of amorphous silicate grains and carbonaceous grains, with a distribution of grain sizes. The distribution of grain sizes was chosen to reproduce the wavelength dependence of interstellar extinction within a few kpc of the Sun (Weingartner & Draine 2001a). The silicate and carbonaceous content of the dust grains was constrained by observations of the gas phase depletions in the ISM. It is assumed that the radiation field heating the dust has a universal spectrum, taken to be that of the local interstellar radiation field estimated by Mathis et al. (1983), scaled by a dimensionless factor . Following DL07, we assume that in each pixel there is dust exposed to radiation with a single intensity , and also dust heated by a power-law distribution of starlight intensities with :
| (1) |
where is the total dust mass in the pixel, and is the fraction of the dust mass that is heated by the power-law distribution of starlight intensities.
The DL07 model has 6 adjustable parameters pertaining to the dust and the starlight heating the dust:
-
1.
: the fraction of the total grain mass contributed by polycyclic aromatic hydrocarbons (PAHs) containing fewer than carbon atoms.
-
2.
: the intensity of the diffuse ISM radiation field heating the dust, relative to the solar neighborhood.
-
3.
: the exponent of the power-law distribution of heating starlight intensities between and . The case corresponds to constant dust heating power per logarithmic interval in starlight intensity ; many galaxies seem to be characterized by .
-
4.
: the maximum heating starlight intensity of the power-law distribution of heating starlight intensities.
-
5.
: the fraction of the dust mass exposed to the power-law distribution of starlight intensities.
-
6.
: the dust mass in the pixel.
In addition, for modeling the observed fluxes in the IRAC bands, we have an additional adjustable parameter (see AD12):
-
7.
: the solid angle subtended by stars within the pixel, determined from the “direct” starlight intensity in the infrared, i.e., starlight that directly contributes to the IRAC photometry, without warming the dust.
The mean starlight intensity seen by the dust is
| (2) | |||||
| (3) |
The parameter is directly related to , defined to be the fraction of the total dust luminosity that is radiated by dust in regions where :
if , or
| (4) |
For each set of dust parameters , and the adopted grain size distribution and grain properties, the dust emission spectrum is computed from first principles. The observed SEDs are consistent with models having , and we therefore fix . Moreover, the model emission is linear in , , and (or, equivalently, ), so in the dust fitting algorithms we only need to explore a three dimensional parameter space (, , and ). The limits on adjustable parameters are given in Table 7. The allowed range for is determined by the wavelength coverage of the data used in the fit.
| Parameter | min | max | Parameter grid used | |
| 0 | continuous fit | |||
| 0 | continuous fit | |||
| 0.00 | 0.10 | in steps | ||
| 0.0 | continuous fit | |||
| 0.7 | 30 | when | in steps b | |
| 0.07 | 30 | when | in steps b | |
| 0.01 | 30 | when | in steps b | |
| 0.01 | 30 | when | in steps b | |
| 1.0 | 3.0 | in steps | ||
| not adjusted | ||||
| a For each set of and there is maximum value of possible. | ||||
| b The fitting procedure uses pre-calculated spectra for 0.01, 0.015, 0.02, 0.03, | ||||
| 0.05, 0.07, 0.1, 0.15, 0.2, 0.3, 0.4, 0.5, 0.6, 0.7, 0.8, 1.0, 1.2, 1.5, 2, 2.5, 3.0, 4.0, 5.0, | ||||
| 6.0, 7.0, 8.0, 10, 12, 15, 20, 25, 30 interpolated onto a grid with . | ||||
The region observed is at a distance from the observer and is the solid angle of pixel . For each pixel , the best-fit model vector corresponds to a dust mass surface density:
| (5) |
Similarly, we can compute the infrared luminosity surface density and , the surface density of dust luminosity from regions with , as:
| (6) |
where is the model luminosity radiated by mass of dust heated by starlight characterized by .
For each pixel , we find the best-fit model parameters by minimizing , as described by AD12. After the resolved (pixel-by-pixel) modeling of the galaxy is performed, we compute a set of global quantities by adding or taking weighted means (denoted as ) of the quantities in each individual pixel of the map. The total dust mass , total dust luminosity , and total dust luminosity radiated by dust in regions with , , are given by:
| (7) |
where the sums extend over all the pixels that correspond to the target galaxy (i.e., the “galaxy mask” pixels, as described in AD12). The dust-mass weighted PAH mass fraction , and mean starlight intensity , are given by:
| (8) |
We similarly define the dust mass-weighted minimum starlight intensity
| (9) |
The dust-luminosity weighted value of is:
| (10) |
While the average value of is of little physical significance (the sum of two power laws is not a power law), for purposes of discussion we define a representative value
| (11) |
We also fit a dust model to the global photometry of each galaxy (i.e., a single-pixel dust model). Below we will compare the result of this single-pixel global model with summing over the fits to individual pixels.
5.2 Post-Planck renormalization of DL07 dust masses and starlight intensities
Planck Collaboration et al. (2016) fitted the DL07 dust model to all-sky maps in the Planck 857, 545, 353, 217, 143, and 100 GHz (, , , , , and ) bands, DIRBE , , and bands, IRAS and bands, and the WISE band, to estimate the dust mass surface density for over 50 million pixels. About 270,000 of these pixels contain spectroscopically-confirmed SDSS quasars, which were used to estimate the correlation of quasar reddening with the reddening predicted by the DL07 dust model. It was discovered that the DL07 model tends to overpredict the reddening by a factor 2. The Panchromatic Hubble Andromeda Treasury (PHAT) study of stars in M31 (Dalcanton et al. 2015) also found that the DL07 dust model, if constrained to reproduce the observed infrared emission (Draine et al. 2014), overpredicted the reddening of stars in M31 by a factor 2. The SDSS quasars allow the bias factor to be estimated: Planck Collaboration et al. (2016) found that the bias appeared to depend on the value of :
| (12) |
If the reddening has been overestimated, it is reasonable to suppose that the dust mass/area has also been overestimated, by approximately the same factor as the reddening. Therefore, we will correct the DL07 dust mass estimates by the same empirical correction factor as for the reddening.
Because the KINGFISH sample includes some pixels with high , we choose to limit the Planck-derived correction factor for :
| (13) | |||||
| (14) |
Because the dust models are required to reproduce the dust luminosity, a reduction in the estimated amount of dust implies a corresponding increase in the estimated starlight intensities. Thus we take, for pixel :
| (15) |
and
| (16) |
All of the dust and starlight parameters (, ) reported below are “renormalized” values from Eq. (13) and (16).
The above “renormalization” is required because observations indicate that the far-infrared and submm opacity of interstellar dust per unit reddening is somewhat larger than the DL07 model values.777The empirical finding that depends on suggests that the dust opacity may decline less rapidly with increasing than assumed by DL07. We will find below (Table LABEL:tab:dust) that the global average for the 62 galaxies ranges from to , with median . Thus the typical correction relative to the DL07 model is a reduction in by a factor 0.62.
Because Eq. (13) has for , the estimated dust-to-gas ratio in regions with is reduced by a constant factor 0.70. This applies to the study of Sandstrom et al. (2013), which was dominated by regions with . However, because , the CO-to- ratios found by Sandstrom et al. (2013) are unaffected by the renormlization.
5.3 Why both MIPS and PACS are needed
As discussed by Aniano et al. (2011) the MIPS160 PSF cannot be convolved safely into any of the PSFs of the remaining cameras. Therefore, if we wish to include MIPS160 photometry in the dust modeling, we must “degrade” all other images into the MIPS160 PSF.
There are two reasons why we want to include MIPS160 even though PACS160 imaging is available. First, using the larger PSF increases the signal/noise ratio for the imaging, thereby allowing photometry to be extended to lower surface brightness regions. Secondly, there are significant and unexplained discrepancies between PACS160 and MIPS160 photometry. Similar discrepancies are found between PACS70 and MIPS70.
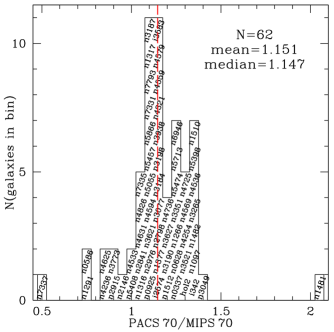
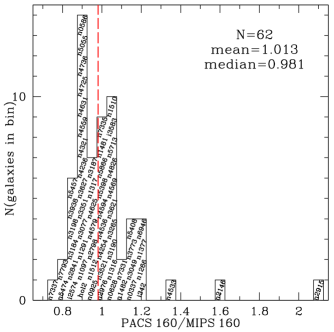
Figure 2 shows histograms of the global PACS70/ MIPS70 flux ratio (left panel), and the global PACS160/ MIPS160 flux ratio (right panel) for each of the KF62 galaxies with reliable dust detections. Each histogram shows the names of galaxies in the bin; “NGC”, “DDO”, “Holmberg” and “IC” are abbreviated to “n”, “d”, “Hol”, and “i”, respectively.
The PACS70 and MIPS70 bandpasses differ slightly, as do the PACS160 and MIPS160 bandpasses. However, AD12 show that for reasonable dust SEDs the slight difference in bandpasses can explain differences in reported fluxes of only at , and at 160, whereas much larger PACS/MIPS discrepancies are often observed.
AD12 (their Appendix F) found that even when the global photometry has PACS/MIPS , the PACS and MIPS images (with PACS convolved to the MIPS PSF) can have local surface brightnesses discrepant by factors as large as 1.5-2.0. Similar discrepancies were found when comparing PACS and MIPS imaging of M31 (Draine et al. 2014) and NGC 4449 (Calzetti et al. 2018).
Figure 2 illustrates that even after summing over the full galaxy mask, PACS70 and MIPS70 often disagree by more than a factor 1.2, and sometimes up to a factor 1.4. The median ratio is 1.17.
PACS160 and MIPS160 are generally in better agreement, but often have discrepancies larger than 10%. There are two outliers in Figure 2: NGC 2146 (PACS160/MIPS160=1.6) and NGC 2915 (PACS160/ MIPS160=2.3). The high value of PACS160/MIPS160 for NGC 2146 may be the result of sublinear response of MIPS160 on the very bright nucleus of NGC 2146. The case of NGC 2915 is unclear – the peak surface brightness is modest. Perhaps the background has been oversubtracted in the MIPS160 image, or undersubtracted in the PACS160 image.
Because it is usually unclear why PACS and MIPS disagree (the discrepancies are too large to be attributed to differences in bandpasses), we consider that both PACS and MIPS photometry should be included if we wish to estimate the dust parameters with the best accuracy available. AD12 also found that, for a given camera set, dust parameter estimates do not change significantly when using a broader PSF, therefore modeling at MIPS160 PSF does not significantly alter the dust parameter estimates. We consider our “gold standard” (i.e., the PSF and camera combination that gives the most accurate dust parameter estimates) to be resolved (i.e., multipixel) modeling done using the MIPS160 PSF, using photometry from all of the IRAC, MIPS, PACS, and SPIRE cameras.
6 Results
For each galaxy in the KF62 sample, Table LABEL:tab:dust presents the global dust parameters estimated for the “gold standard” modeling, including information characterizing the intensity of the starlight heating the dust in each galaxy. The modeling was done at MIPS160 PSF, using all the cameras available; we also give results of modeling at S250 resolution.
The given quantities are obtained by summing or averaging over the resolved maps using Equations (7-10). The dust masses listed in Table LABEL:tab:dust we obtained using the DL07 model, but then “renormalized” following Equation (13). The renormalization factor depends on , and therefore varies from pixel to pixel. The overall renormalization factor
| (17) |
for each galaxy is given in Table LABEL:tab:dust, for both M160 and S250 resolution. Henceforth, , , and will refer to the renormalized values of these quantities [see Eq. 13-16].
6.1 One Example: NGC 5457 = M 101
To illustrate the quality of the data and the modeling results for the KINGFISH galaxies, we choose the large, nearly face-on spiral NGC 5457 (M 101) as an example. As for all our galaxies, the dust mass, PAH abundance, and starlight heating parameters are adjusted separately for each pixel.
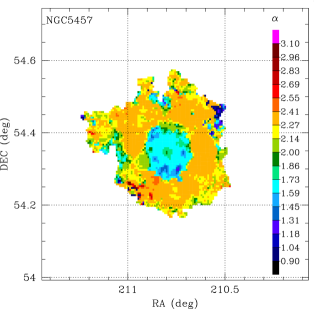
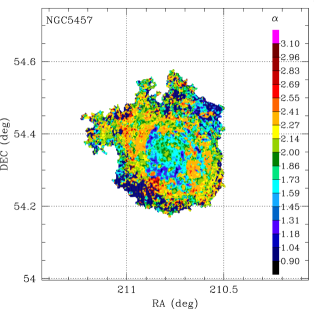
The parameter characterizes the distribution of starlight intensities heating dust within a pixel (see Eq. 1). Figure 3 shows maps of the best-fit values for the M160 and S250 resolution modeling. At M160 resolution, is azimuthally coherent but has a notable radial gradient, with in the center, and beyond galactocentric radius . While the variation in best-fit is apparent, these values are all close to , the case where there is equal power per unit . At S250 resolution, the signal-to-noise ratios are lower, and the S350, S500, and M160 cameras are not used; the map for the S250 resolution modeling shows more pixel-scale variations, but with a radial trend similar to the M160 resolution modeling.
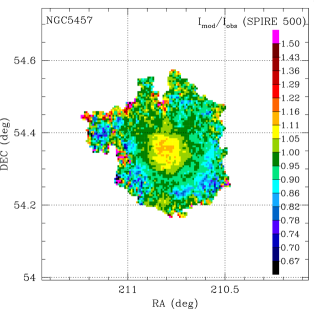
In general, the DL07 model successfully reproduces the resolved SEDs in M 101. Figure 4 compares the model surface brightness with observations. The upper panel shows modeling at M160 resolution (the observed SPIRE500 intensity is used as a model constraint). The DL07 model is generally within of the observed SPIRE500 intensity, except at the outer edges of the mask where the signal/noise is low. The model appears to fall short by 10% in the outer regions (galactocentric radius 15 kpc=0.13∘), where the metallicity has dropped to (Li et al. 2013). This could indicate that the frequency dependence of the dust opacity becomes less steep as the metallicity drops – consistent with the SED of the SMC (Israel et al. 2010; Bot et al. 2010; Planck Collaboration et al. 2011; Draine & Hensley 2012), and with evidence for a submm excess in galaxies with metallicities (Rémy-Ruyer et al. 2013).
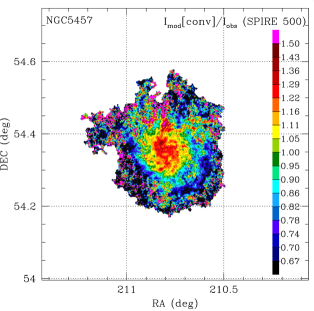
The lower panel of Figure 4 compares modeling at S250 resolution (no data longward of used to constrain the model) with the SPIRE500 observations. In the bright spiral arms, the intensity is overpredicted by 25%. Once again we see a radial gradient: the model overpredicts SPIRE500 in the central regions, and underpredicts SPIRE500 at . In the outer regions the fit is poorer, presumably due to the low signal/noise ratio at S250 resolution.
Figure 5 shows maps of dust and starlight heating parameters for M 101. There are 2 sets of figures; the first set (rows 1 and 2) corresponds to modeling done at M160 resolution, using data from all (IRAC, MIPS, PACS, and SPIRE) cameras, i.e., “gold standard” modeling, and the second (rows 3 and 4) to modeling done at S250 resolution, using IRAC, MIPS24, PACS, and SPIRE250 cameras. This latter modeling is able to resolve smaller scale structures in the galaxies, but is overall less reliable, particularly in the outer regions where the surface brightness is lower and dust is cooler.
Because of the proximity of M 101 (), the spiral structure is visible even at M160 resolution. At M160 resolution 38.8 arcsec FWHM), the dust luminosity/area ranges from the surface brightness defining the boundary of the galaxy mask to a peak ESE of the center, at the position of the giant H II region NGC 5461 (see, e.g., Esteban et al. 2009).
At S250 resolution the peak at NGC 5461 has a dust/luminosity/area [corresponding to a dust luminosity in a single S250 map pixel]. Thus at S250 resolution, we are able to measure the IR emission from the dust over a dynamic range of 2000 in .
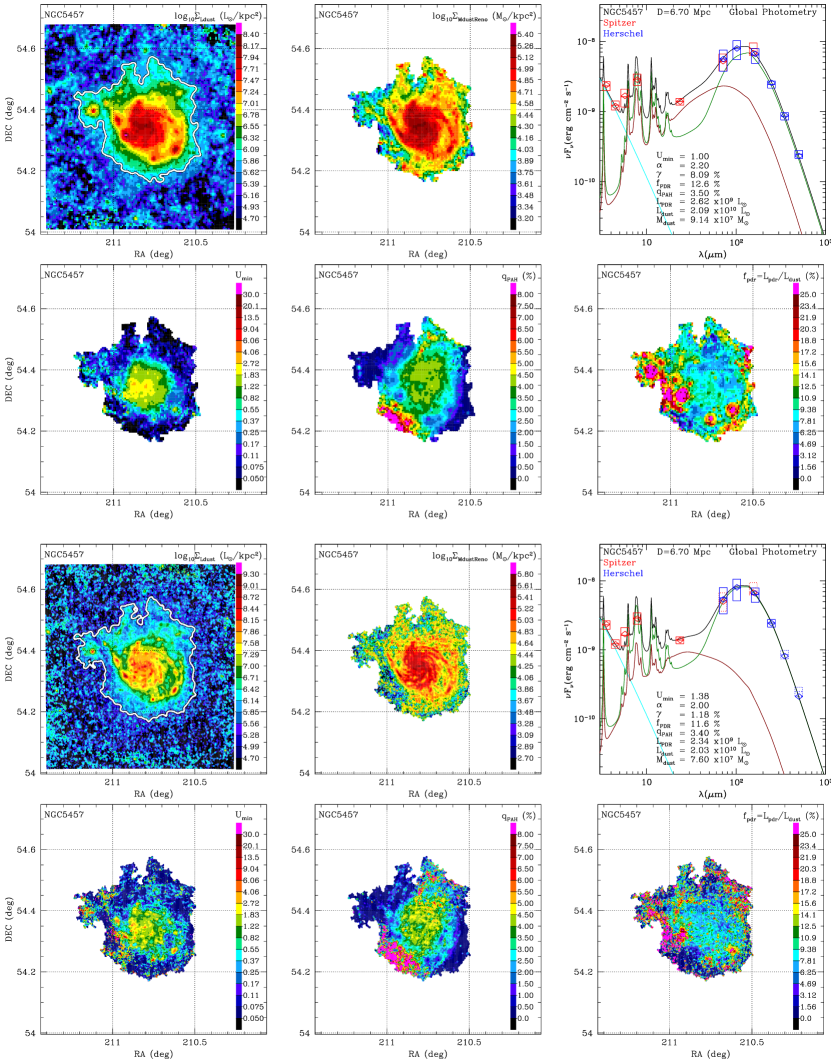
Maps of dust surface density are also shown for both the M160 and S250 modeling. At both M160 and S250 resolution has a peak at the extranuclear luminosity peak. At S250 resolution we estimate a peak dust surface density , corresponding to of dust in a single S250 map pixel.
Maps of the starlight modeling parameter are also shown at both M160 and S250 resolution. In M101, ranges from values as high as 30 (the largest value permitted by our modeling) to values as low as in the outer parts of the galaxy. The highest values of arise in the S250 modeling, with high values of appearing in a fraction of pixels in low surface brightness regions to the east of the center. The high values found in these regions using S250 resolution data are probably unphysical, arising as the result of low S/N data: an upward fluctuation in PACS70 (or a downward fluctuation in SPIRE250) can drive the fitting to a high value. Within of the center, with higher surface brightnesses, we generally find . And in the M160 modeling, we do not obtain very high values of even in the low surface brightness outer regions.
Maps of are also shown at both M160 and S250 resolution. The modeling finds a very high value of along the SSE edge of the galaxy; this is seen in both the M160 and S250 modeling of an extended region approximately SSE of the center. The high estimates for could arise from errors in the IRAC 5.6 and 8 photometry, probably due to errors in background subtraction.
Maps of – the fraction of the dust luminosity that is contributed by dust heated by starlight with – are shown at both M160 and S250 resolution. High values of are seen at many of the positions where peaks, which is consistent with the idea that these are regions with active star formation, with some fraction of the dust exposed to intense radiation fields in or near OB associations. However, we also see high values in some of the lowest surface brightness regions near the edge of the galaxy mask – this is presumably an indication that photometric errors and errors in background subtraction are leading to overestimation of 24 or 70 emission relative to the total dust luminosity. Thus our derived values of appear to be unreliable in the lowest surface brightness regions.
We also show the global SED for M101, extracted from the galaxy mask. In the upper right panel, the rectangular symbols show the measured fluxes for the 7 Spitzer cameras and the 6 Herschel cameras. At 70 and both red and blue rectangles are shown, with the MIPS and PACS photometry. Also shown is a single-pixel DL07 model, where the DL07 model is fitted to the global photometry. The diamonds show the model fluxes for each of the instrumental bandpasses. In the case of M101, the model (with 6 adjustable parameters – ) is consistent with the photometry at 11 independent wavelengths ( to ). In row 3 column 3 we show a single-pixel DL07 model fitted to only the photometry that is used for the S250 modeling (i.e., MIPS70, MIPS160, SPIRE350, or SPIRE500 are not used when adjusting the model parameters). The dashed rectangles show these unused measurements; we see that for M 101 the single-pixel model does quite well at predicting the fluxes at 350 and 500, with only a underprediction even at . The single-pixel global fit parameters are given in the SED plots.
Table 8 compares total dust mass estimates for M101. Column 2 reports the dust mass estimated from the DL07 model at either M160 or S250 resolution, after summing the dust model over the galaxy mask. Because we opted to use the same for the S250 and M160 modeling, the galaxy masks for the two cases are essentially the same. Column 3 reports the result of fitting a DL07 model to the global photometry – this is referred to as “single pixel” modeling. In columns 4 and 5 we show the multipixel or single pixel dust masses after renormalizing following Equation 13.
Multipixel vs. single-pixel modeling is of course expected to produce different estimates because the models are nonlinear. One notes in Table 8 that the discrepancies between the multipixel and single pixel mass estimators are reduced when going from the original DL07 model to the renormalized model. It is not clear why this is the case, but this is a welcome result.
| PSF | DL07 | renorm. DL07 | multipix | ||
| multipixel | single pixel | multipixel | single pixel | ||
| M160 | 0.549 | ||||
| S250 | 0.569 | ||||
6.2 Full KINGFISH Sample
Dust is detected reliably for every galaxy in the KF62 sample. Selected images for each of these galaxies are given in Appendix A (Figures 17.1-17.62, following the scheme used for M 101 in Fig. 5. This is only a fraction of the maps and images that are available online – see Appendix C for a description of the data set.
The “galaxy mask” for each galaxy is shown for both the M160 PSF and the S250 PSF. As for M101, we have opted to use the same for both the M160 and S250 modeling, hence the M160 and S250 -based galaxy masks are nearly identical for each galaxy, except for the 8 where dust emission is so weak that we treat them as nondetections (see Appendix B). The flux densities measured by Spitzer and Herschel within the M160 and S250 galaxy mask for each galaxy have been given above in Tables LABEL:tab:spitzer and LABEL:tab:herschel. The model-derived parameters for the dust and starlight are given in Table LABEL:tab:dust. is not included in Table LABEL:tab:dust because there is no natural way to define a “mean” for multipixel modeling. The uncertainties listed for the parameters are based on repeating the fitting procedure with the “observed” fluxes obtained by Monte-Carlo sampling from Gaussian distributions with means and widths given by the original observed values and uncertainty estimates (see discussion in Appendix E of AD12). Systematic errors associated with the DL07 model itself have not been estimated.
Figures 17.1-17.62 have twelve panels in all, with the top six panels showing results of modeling with the M160 PSF, and the lower six panels repeating this for the S250 PSF. For each PSF, the top row shows maps of the dust luminosity surface density (upper left) and modeled dust surface density (upper center), and the model SED (upper right). The lower row shows maps of the starlight intensity parameter (left), the PAH abundance parameter (center), and the PDR fraction (right), all restricted to the “galaxy mask”.
In the SED plot, the observed global photometry is represented by rectangular boxes [Spitzer (IRAC and MIPS) in red; Herschel (PACS and SPIRE) in blue]. The vertical extent of each box shows the uncertainty in the photometry for each band. The black line is the total DL07 model spectrum, and its different components are represented by three colors. The cyan line is the stellar contribution, the dark red line is the emission from dust heated by the power-law distribution, and the dark green line is emission from dust heated by . The DL07 model used in this SED plot is a single-pixel model, which tries to reproduce the global photometry treating the entire galaxy as a single pixel. These “single pixel” models generally do a good job at reproducing the global photometry. Multipixel models, where the photometry in every pixel is fit independently, have many more adjustable parameters, and naturally do an even better job of reproducing the global photometry after summing over all the pixels in the galaxy mask. It is reasonable to presume that models that do a better job of reproducing the photometry will also be preferred for dust mass estimation.
The dust mass surface densities and dust luminosities per unit area range over three orders of magnitude in our brightest galaxies. Figures 17.1-17.62 illustrate that the DL07 model does a satisfactory job of fitting the SEDs. Although each pixel is modeled independently of its neighbors, it is noteworthy that the dust parameters are smoothly varying over the confines of the galaxy, except for the low surface brightness outer regions at S250 resolution, where the S/N in individual pixels may become low enough that certain dust and starlight parameters, such as and , become somewhat noisy.
6.3 Special Cases
6.3.1 NGC 1404
The E1 galaxy NGC 1404 is faint at infrared wavelengths, and there is a foreground star to the SSE. However, NGC 1404 is unambiguously detected in IRAC bands 1-4, and by MIPS24. At there appears to be excess emission at the position of NGC 1404, but the surface brightness is low and the possibility that the emission is from a foreground or background source cannot be excluded (Dale et al. 2012). Using the procedure described in Appendix B, we find a upper bound for NGC 1404.
NGC 1404 has an estimated stellar mass , and evolved stars are probably injecting dust at a rate .888A rough estimate, assuming 1 stars each lose 0.5 of envelope before becoming white dwarfs, and that 1% of the envelope mass consists of dust. Thus the observed dust mass upper limit would be consistent with a dust lifetime . If the ISM in NGC 1404 has a temperature , silicate or carbonaceous dust grains would be eroded by thermal sputtering at a rate (Draine & Salpeter 1979), for a grain lifetime . The dust mass upper limit would thus be consistent with erosion of grains by sputtering in a ISM with .
6.3.2 NGC 1377
NGC 1377 has a compact dusty core, with an extremely high far-infrared surface brightness. The infrared spectrum (Roussel et al. 2006) shows that it is optically thick at . Weak PAH emission is detected, but because of the uncertain infrared extinction it is not possible to reliably estimate the PAH abundance parameter . The dust mass estimates should also be regarded as uncertain because of the unusual nature of the interstellar medium in this galaxy.
6.4 Gold-Standard DL07 fit results for KINGFISH galaxies
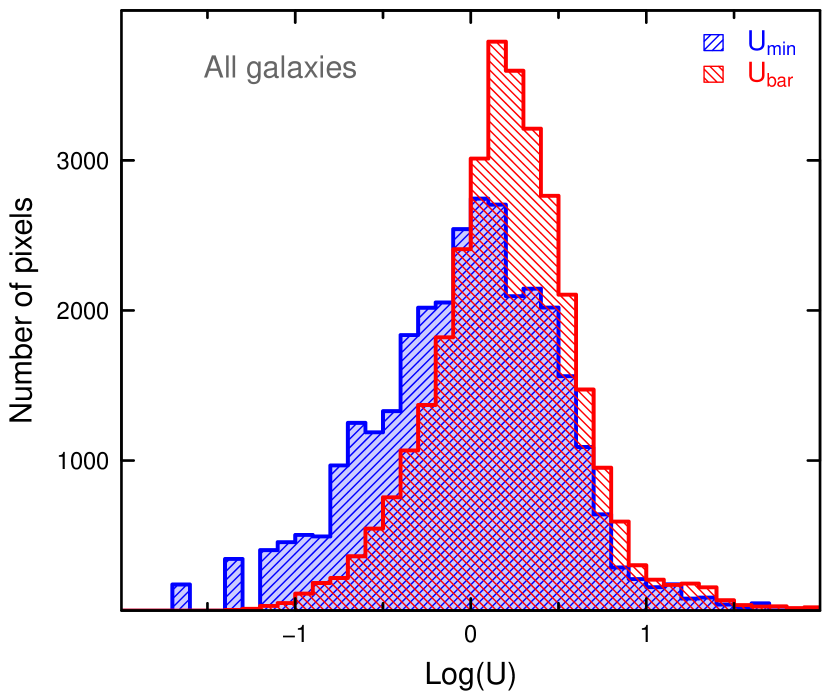
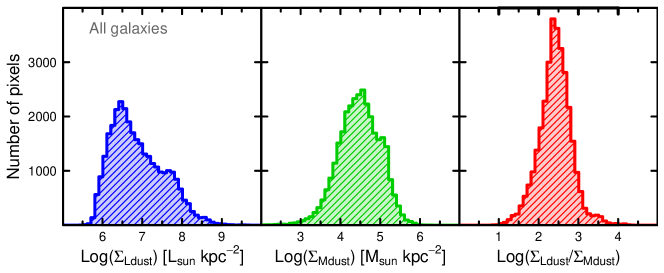
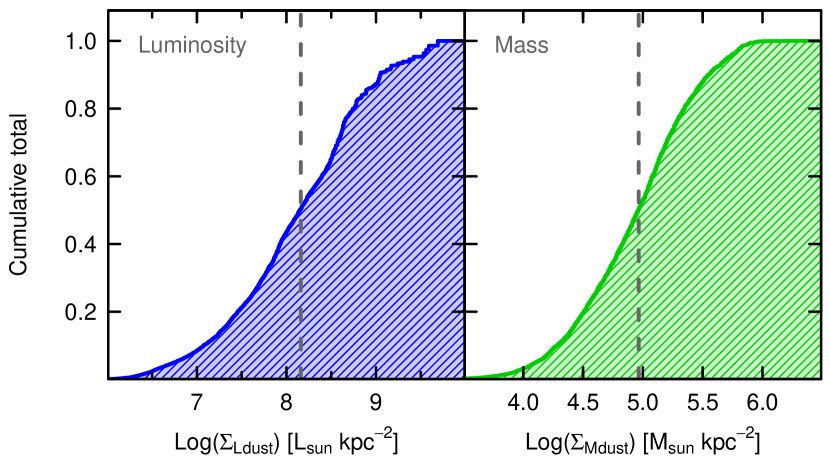
Figure 2.1 shows the dust parameter distributions for the 61 KINGFISH galaxies plus 9 “extras”. The dust parameters shown are the result of the “gold standard” modeling – multipixel modeling for each galaxy using the M160 PSF and data from all cameras.
The first row shows the distributions of (left column) and (right column) for the KF62 galaxies. The second row shows the distributions of (left column) and right column), and the bottom row shows the distributions of (left column) and (right column). In these histograms, the dust masses and are renormalized, as discussed in Section 5.2.
Figure 2.1 illustrates the large region in the model parameter space spanned by the KINGFISH sample, allowing us to probe the dust properties in a variety of ISM conditions. The total dust mass and dust luminosity found in the galaxies spans almost 4 decades: and , from the blue dwarf NGC 2915 () to the luminous starburst galaxy NGC2146 ().
![[Uncaptioned image]](/html/1912.04914/assets/x9.png)
![[Uncaptioned image]](/html/1912.04914/assets/x10.png)
![[Uncaptioned image]](/html/1912.04914/assets/x11.png)
![[Uncaptioned image]](/html/1912.04914/assets/x12.png)
![[Uncaptioned image]](/html/1912.04914/assets/x13.png)
![[Uncaptioned image]](/html/1912.04914/assets/x14.png)
The mean value of the starlight heating parameter also presents wide variations across the galaxy sample. spans the range (these values of are for the DL07 model without renormalization). The PAH mass fraction also shows wide variation, from 0.005 to 0.045, with median . The mean fraction of the dust luminosity coming from dust heated by high-intensity radiation fields, , typically ranges from 0.05 to 0.20.
There are 4 KINGFISH galaxies where the fitted DL07 dust models have very high values of : NGC 1316 = Fornax A (SAB0), NGC 3049 (SBab), NGC 3265 (E), NGC 5408 (IBm), and the “extra” galaxy NGC 1510 (SA0). NGC 1316 = Fornax A has a central AGN/LINER spectrum, and NGC 3265 has an emission-line nuclear region (Dellenbusch et al. 2008), NGC 1510 hosts a strong central starburst, and NGC 3049 and NGC 5408 are often classified as starburst galaxies. Thus the high values for these galaxies may be indicative of concentrated star formation or nuclear activity.
Finally, the mean power-law exponent spans . Allowing to vary does improve the quality of the fit to the observed SED, but in most cases the fit quality does not suffer greatly if is held fixed at , reducing the number of free parameters. Recall that corresponds to equal amounts of dust power per logarithmic interval in starlight intensity .
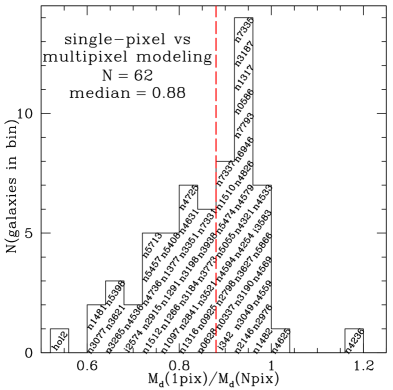
Compared with the “gold standard”, modeling using PSFs smaller than M160, and hence having fewer cameras available, can affect the derived dust and starlight parameters. As the PSF shrinks, data are provided by fewer cameras, the wavelength coverage shrinks as the PSF is reduced below S500, and the photometry becomes noisier because it is being smoothed over smaller PSFs. Above we have compared two cases: modeling with the M160 PSF, versus modeling with the S250 PSF, but additional comparisons are made in Appendix D. Here we simply note some trends. In general is fairly robust: the S250 modeling typically overestimates by 25%, but agrees with the “gold standard” to within a factor for over 75% of the galaxies (see Fig. 2.1). estimates are also robust, with typical changes of less than 15%. Longer wavelength coverage (SPIRE350 and SPIRE500) gives more reliable dust estimates. Even comparing resolved and global modeling of dust properties can give different results; although most parameters are consistent to within a few percent, global modeling can underestimate by as much as 35%, as for NGC 1481 and NGC 3077 (see Figure 21). This is because the resolved models can have “cold” regions with low values that contribute to dust mass estimates but do not emerge in the global results (e.g. Galliano et al. 2011; Galametz et al. 2012).
6.5 Dependence of global PAH fraction on metallicity
Figure 7a shows vs. for 51 galaxies using direct determinations of (O/H) where available (5 galaxies), and PT estimates otherwise. 19 galaxies have been omitted: 8 dust nondetections have been excluded, NGC1377 (a dense starburst with a core that is optically thick at 8 – see Section 6.3.2), plus 10 galaxies for which we have no PT estimate for O/H. The oxygen abundance in these galaxies ranges over more than a factor of 10, and shows a clear tendency to increase with increasing O/H, although there is considerable scatter. The observed behavior can be approximated by a step function, with an abrupt increase in when (O/H)PT rises above 8.0 Alternatively, can be approximated by a linear dependence on . Best-fit step function and linear function are shown in Fig. 7a, with per degree of freedom of 8.0 and 6.6, respectively.
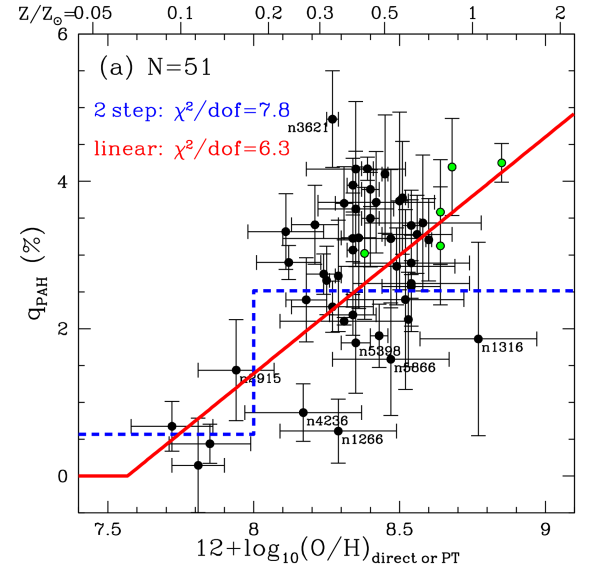
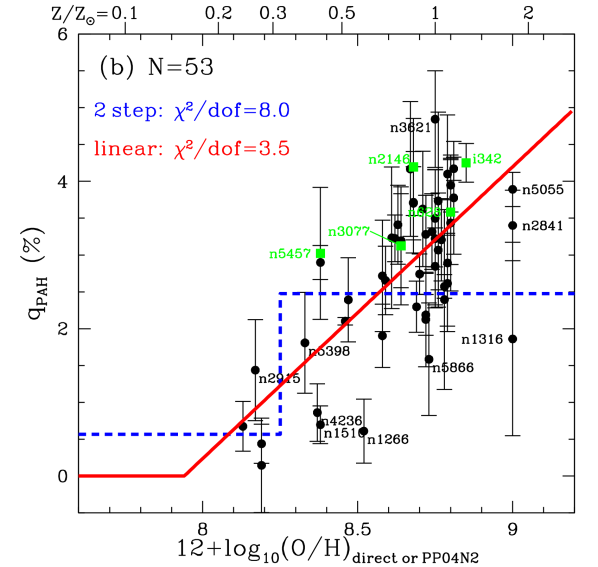
Figure 7b shows vs. the PP04N2 estimate for metallicity. Again, we show both step functions and a linear dependence on . In this case, the function linear in gives a much better fit to the data:
| (18) |
(for (O/H)PP04N27.94). This fit, with 53-2=51 degrees of freedom (dof), has /dof: the PP04N2 metallicity is evidently a much better predictor of than is the PT metallicity.999For some galaxies we use “direct” metallicities rather than the PT or PP04N2 weak-line estimates, but is dominated by the 51 galaxies where we use PP04N2 instead of the PT metallicity estimate. This strongly suggests that the PP04N2 metallicities are more tightly related to the properties of the ISM – including metallicity – that regulate the balance between PAH formation and destruction.
The observed tendency for to increase with increasing metallicity is consistent with many previous studies. The connection between PAH abundance and metallicity was first noted in ground-based spectroscopy by Roche et al. (1991), and further investigated using ISO data (Boselli et al. 1998; Sturm et al. 2000; Madden 2000). Hunt et al. (2005, 2010) found PAH emission to be weak in low-metallicity blue compact dwarf galaxies. Engelbracht et al. (2005) used IRAC and MIPS24 photometry to show that there was an abrupt drop in the 8/24 flux ratio when the metallicity dropped below 8.2, interpreting this as due to a sharp drop in the abundance of PAHs that normally dominate the emission at 8. Draine et al. (2007) estimated for 61 SINGS galaxies, using the DL07 model with IRAC and MIPS photometry, and found a similar result: a sharp increase in when (O/H)PT rises above 8.2.
Nevertheless, there are outliers in Fig. 7b. The SB0 galaxy NGC 1266 has , unusually low for a galaxy with (O/H)PP04N2=8.51. The Spitzer and Herschel photometry of NGC 1266 (see Fig. 17.8) appears to be reliable. Because the optical spectrum of NGC 1266 is AGN-dominated, the metallicity is not based on emission lines, and is therefore highly uncertain. Moustakas et al. (2010) estimated the metallicity from an assumed luminosity-metallicity relation. The resulting (O/H)PP04N2=8.51 is consistent with the stellar mass-metallicity relation (Andrews & Martini 2013). Perhaps the PAH abundance in this galaxy has been suppressed by phenomena associated with the active galactic nucleus (AGN) that is driving a molecular outflow characterized by shocked gas (Alatalo et al. 2011; Pellegrini et al. 2013; Alatalo et al. 2015).
The SAB0 galaxy NGC 1316 = Fornax A is another outlier. The dust emission is weak relative to the starlight, making the estimate uncertain. In addition, the starlight heating the dust is likely from an old population, similar to the bulge of M31, and our estimate of (based on single-photon heating by starlight assumed to have the solar neighborhood spectrum) would then be biased low. The estimate for in the center of M31 increases by almost a factor of two when calculated using the correct starlight spectrum (Draine et al. 2014), and a similar correction might bring for NGC 1316 closer to the general trend in Figure 7b. In addition, the high metallicity estimated for NGC 1316 may be influenced by the AGN contribution to the emission line spectrum.
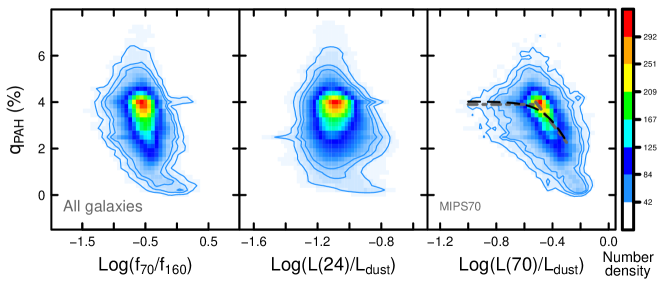
In Figure 7 it is striking that the bulk of the galaxies with (O/H)PP04N2 have in the 1.5–5% range. Evidently the physical processes responsible for formation and destruction of PAHs in normal star-forming galaxies tend to maintain PAH abundances near provided that the metallicity . From Eq. (18) it appears that there is a threshold metallicity for PAH formation: for , or .
6.6 Dependence of global dust-to-gas ratio on metallicity
6.6.1 Theoretical Expectations
The abundance of dust in the ISM is the result of competition between processes that form dust (dust formation in stellar outflows, and dust growth in the ISM) and processes that return material to the gas phase (e.g., sputtering in hot gas, and vaporization in high-speed grain-grain collisions). In the Milky Way and other star-forming galaxies with near-solar metallicity, accretion of atoms onto grains is rapid in the cool, dense phases of the ISM, and the balance between grain growth and grain destruction maintains a large fraction of the refractory elements in grains. Most of the dust in the Milky Way must have been grown in the ISM – there is simply no other way to understand the observed extreme depletions of elements like Si, Al, Ca, Ti, and Fe in the diffuse ISM (see, e.g., Draine 1990; Weingartner & Draine 1999; Draine 2009).
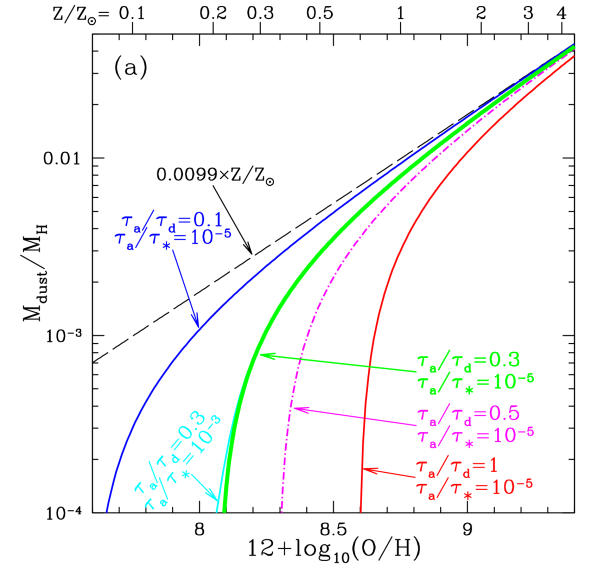
The black dashed line in Fig. 8a shows the expected dependence of on O/H if all galaxies had heavy element abundances proportional to solar abundances, and the same depletion pattern as measured in the well-studied cloud toward the nearby star Oph; in this cloud the refractory elements (e.g., Mg, Si, Fe…) are almost completely incorporated into grains, and we infer a dust/H mass ratio 0.0099 (see Table 23.1 of Draine 2011). For this scenario, we then expect
| (19) |
where we take for (O/H)=8.72 (Asplund et al. 2009, corrected for diffusion). However, in the overall ISM, will fall below this limiting value, because of dust destruction processes.
A simple toy model can illustrate the competition between formation and destruction processes. (Similar models have been discussed by, e.g., Edmunds 2001; Mattsson et al. 2012; Asano et al. 2013).
Let be the fraction of the ISM mass in “refractory” elements (), and be the fraction of the ISM mass in dust grains made of these refractory elements (). Clearly , since some of the refractory elements are in the gas phase.
Destruction and grain growth in the ISM both contribute to the rate of change of . We also include a term representing injection of solid grains into the ISM from stellar sources (AGB stars, supernovae, etc.). The rate of change of is given by
| (20) |
The first term is the rate of dust destruction: is the lifetime of solid material in the ISM against destructive processes that return material to the gas phase. The destruction rate is a mass-weighted average over the dust in the multiphase ISM. Studies of the effects of supernova blastwaves in the local ISM suggest timescales (see discussion in, e.g., Draine 2009). Realistic estimation of requires a detailed dynamic multiphase model of the ISM (e.g., Zhukovska et al. 2016). The appropriate value of will obviously vary with galactocentric radius within a galaxy, and from galaxy to galaxy.
The term in Eq. (20) representing grain growth is proportional to because it depends on grain surface area (, for a fixed distribution of grain sizes) and on the gas-phase abundance of condensible elements (). is the probability per unit time that a refractory atom in the gas phase will collide with and stick to a grain.
The last term, , represents injection of dust into the ISM from stellar sources, such as cool AGB stars, planetary nebulae, and core-collapse supernovae. This term will obviously depend on the stellar populations. Here, for illustration, we take the injection rate to be proportional to the metallicity . For galaxies of interest here, this injection term is small compared to the other terms in Eq. (20), and the precise form adopted in Eq. (20) is not critical.
If the shortest of the time scales is short compared to the 10 timescale for galactic chemical evolution, and , we can neglect time-dependence of the metallicity . The toy model will approach a quasi steady-state solution with :
| (21) |
This solution for depends only on and on ratios of time scales, and . Eq. (21) for is plotted in Fig. 8a for several choices of the ratios and . Note that for all of our examples we take : dust formation in stellar outflows is secondary to dust growth in the ISM (i.e., only a small fraction of interstellar dust is “stardust”). For large values of , all models approach the upper limit (long-dashed line in Fig. 8b).
Models of interest have , so that for near-solar abundances, accretion is faster than destruction, and a solar-metallicity ISM can maintain a large fraction of the refractory elements in dust (i.e., ). However, for sufficiently low O/H, accretion rates become slow, resulting in low values of .
6.6.2 Observations
Using dust mass estimates based on modeling the infrared emission, radial variations in dust-to-gas ratios (DGRs) were found for galaxies in the SINGS sample (Muñoz-Mateos et al. 2009) and for M101 (Vílchez et al. 2019). The dust-to-metals ratio was approximately constant for KK04 metallicities (O/H), but for (O/H) the dust-to-metals ratio appeared to decline with decreasing metallicity. Chiang et al. (2018) found variations in the dust-to-metals ratio in M101, which they related to both variations in metallicity and fraction. De Cia et al. (2016) found similar behavior in a sample that included 55 damped Lyman alpha systems (DLAs), where dust abundances were inferred from depletions of Si, and metallicities from [Zn/Fe]. It appears that as metallicity decreases below a certain threshold (e.g., (O/H)), an increasing fraction of refractory elements (Mg, Si, Fe, …) remains in the gas phase.
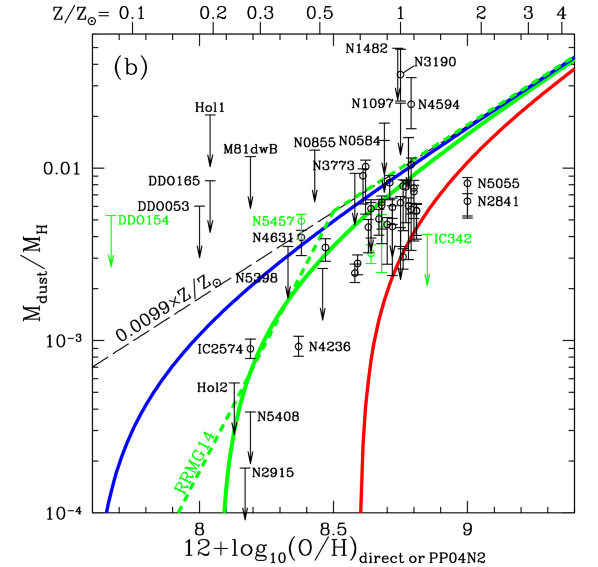
Dust-to-gas ratios (DGRs) for the KF57 sample (see Table 1) are plotted against O/H in Fig. 8b, with dust masses estimated from our model, gas masses taken from Table LABEL:tab:dust-to-gas, and the PP04N2 estimate for O/H. 14 galaxies have detections of both dust and H I, but were either not observed or not detected in CO, resulting in DGR upper limits. An additional 7 galaxies were detected in H I but not in dust, resulting in DGR upper limits.
Figure 8b shows a clear dependence of dust/gas ratio on metallicity. With some exceptions, the observed dust/H mass ratios for the KF57 sample are in broad agreement with the toy model (Eq. 19) for , with (green curve in Fig. 8b) providing a reasonable fit to the main trend in vs O/H.
We do not expect all galaxies to be characterized by a single value of . Allowing for reasonable variation of from galaxy to galaxy (ranging from for the red curve to for the blue curve) can accommodate almost all of the measured values. However, there are some notable exceptions:
-
•
NGC 1482 (type SA0), This galaxy with near-solar O/H has a measured dust/H mass ratio several times larger than the “upper limit” (although NGC 1482 is missing CO measurements). It is notable that the ISM appears to have been subject to unusual activity. NGC 1482 shows evidence of a galactic-scale “superwind”: the X-ray morphology shows a striking “hour-glass” shape emerging from the plane of the disk (Strickland et al. 2004; Vagshette et al. 2012). Interestingly, this galaxy is completely missing H I in its central region, with atomic gas only found in two blobs 2 kpc distant from its center, roughly at the confines of the X-ray emission (Hota & Saikia 2005). CO observations of NGC 1482 are needed. If NGC 1482 were found to have , the ratio would be normal for its metallicity.
-
•
NGC 4594 (M104 “Sombrero”, type SAb) also has near-solar O/H, but a dust/H mass ratio several times larger than the expected upper limit . NGC 4594 has diffuse X-ray emission, suggesting the presence of a galactic-scale outflow (Li et al. 2011). Li et al. (2011) estimate the hot gas to have a temperature and total mass . Adding this to the Bajaja et al. (1984) value for H I, and the H2 mass estimated with a standard factor, we find , and , about a factor of 2.5 above the ratio expected for metallicity . The gas in the hot phase, with a density , has a cooling time (Li et al. 2011). Some of the hot gas may have cooled down to , perhaps making an additional contribution to the total gas mass present in NGC 4594. We suggest that NGC 4594 may contain a substantial mass of diffuse H II at 10 that has not yet been detected.
Gravity, radiation pressure, and inertia can all lead to velocity differences between gas and dust, allowing the two to separate. However, because dust is generally well-coupled to the gas by both gas drag and the Lorentz force on charged grains, gas-grain “slip” velocities are generally small (e.g., Weingartner & Draine 2001b), and scenarios where gas is removed but dust is left behind are not viable unless the gas flows are slow enough that the small gas-grain “slip” velocities suffice to prevent the dust grains from leaving the galaxy. Even if gas is stripped or lost in an outflow, we expect the metallicity in the remaining gas [and therefore the upper bound Eq. (19) on the dust/mass ratio] to be unaffected. If NGC 1482 and NGC 4594 truly have high dust/gas ratios, then this would appear to require a mechanism for concentrating the dust in part of the gas, and removing the dust-poor gas via an outflow or stripping. Alternatively, perhaps the dust/gas ratio is actually normal, but the dust mass has been overestimated because the dust material for some reason has a far-infrared/submm opacity that is significantly larger than found in normal star-forming galaxies. The elevated dust/gas mass ratios in NGC 1482 and NGC 4594 require further study.
-
•
NGC 2841 (Type SAb) and NGC 5055 (M63, Type SAbc): These two galaxies have much lower dust/gas ratios than would be expected given their high estimated metallicities ((O/H)PP04N2: ). The photometry for these galaxies is reliable, and the models reproduce the SED out to 500. However, it seems likely that the metallicities given in Table 2.1 are overestimated. Moustakas et al. (2010) with KK04 found that NGC 2841 and NGC 5055 have (O/H) significantly greater than 9, 0.2 dex higher than the values found for the central regions in the same galaxies by Pilyugin et al. (2014). Pilyugin et al. (2014) also deduce strong metallicity gradients in these two galaxies implying that at , the characteristic (O/H)8.6. Such metallicities, better representing the average over the galactic disk, would be consistent with the observed dust/gas ratios for these two galaxies.
In Fig. 8b we also show the broken power-law empirical trend found by Rémy-Ruyer et al. (2014), with for O/H above a critical value,101010Using PT metallicities, Rémy-Ruyer et al. (2014) estimated this critical metallicity to be (O/H)=8.02. Here we adjust the critical value to 8.42 to allow for the systematic offset of 0.4 between PT and PP04N2 metallicities at low O/H (see Fig. 1). but with for lower values of (O/H). This empirical result is seen to fall close to our toy model with .
6.7 Resolved trends of DL07 parameters
Using data at M160 resolution, the synergy of Herschel and Spitzer for the KINGFISH sample enables an assessment of dust properties on kpc scales in nearby galaxies (the FWHM of the M160 PSF, 388, corresponds to 1.86 kpc at the median KINGFISH sample distance of 9.9 Mpc). The number of M160 pixels in each galaxy ranges from 20 for the smallest galaxies (M81 dwB, NGC 584) to 4000 pixels for the largest ones (NGC 5457 = M 101 and IC 342); the resolved sample as a whole, including the nine “extra” galaxies, comprises 32 000 pixels with well-defined dust parameters and photometry.
Figure 9 shows how the starlight intensity parameters and are distributed over the 32 000 galaxy mask pixels (i.e., ) where we are able to estimate the dust and starlight parameters. Half of the pixels have , and half of the pixels have . The distribution for the KF62 sample (Figure 9) is similar to that for Local Group galaxies (Utomo et al. 2019).
The distributions of dust luminosity densities and dust mass densities are displayed in Fig. 10. The distribution peaks toward fainter , increasing down to the lowest values of allowed by the luminosity surface density cutoff defining the “galaxy mask” for each galaxy.111111Because our cutoff varies from galaxy to galaxy, ranging from for DDO 165 to for NGC2146, the pixel histogram has a broad peak near . While the pixel histogram peaks at faint , the infrared luminosity is dominated by the bright pixels with . The distribution of dust surface densities peaks near , which corresponds to mag, and 90% of the dust mass is contributed by pixels with , or mag. The distribution of the light-to-mass ratio is shown in the right panel of Fig. 10. This is of course equivalent to the distribution of . The histogram peaks at , corresponding to a starlight heating rate parameter .
The dust light and mass surface densities that most contribute to the total dust budget are more clearly seen in Fig. 11, where we show the cumulative distributions of dust luminosity and dust mass plotted against and , respectively.
The vertical dashed lines in Fig. 11 show the surface-density thresholds that provide 50% of the total: and . Regions with dust light and mass surface densities greater than these values comprise only a small fraction of the total; from Fig. 10 we see that 50% of the dust light comes from only 3% of the (brightest) pixels, and 50% of the total dust mass from 22% of the (densest) pixels.
In what follows we have applied a limit in dust surface brightness ; thus the low signal-to-noise faint outer regions of the sample galaxies (where estimates of parameters such as and may become unreliable) will not be considered. As seen above, such regions contribute very little to either the light budget or the mass budget of the dust over the sample as a whole. Applying such a cut ensures that the plotted DL07 parameters (and the photometric quantities) will be as accurate as possible, given the constraints of the data; the total number of pixels in the sample is reduced to 25 500.
We now investigate the IR observational signatures associated with dust heating (). Figure 12 shows for all galaxies plotted versus MIPS and SPIRE flux density ratios, , , and . Because of the unexplained discrepancies between MIPS and PACS photometry (see Figure 2), we have elected to use only MIPS photometry for and . The left panel shows that the flux ratio is not a very good predictor of . This is because when , the 70 emission has an appreciable contribution from (1) single-photon heating of small grains, and (2) dust in regions with high starlight intensities (assuming , which is almost always the case). The flux ratio , shown in the middle panel, ameliorates the potential domination of the emission by small-grain stochastic heating, but the wavelength ratio of the two fluxes is insufficient to reliably sample ; a small range in flux ratio corresponds to as much as an order of magnitude change in . However, the right panel shows that the flux ratio correlates quite well with because the emission at both and is dominated by the larger grains heated by starlight intensities near . Because 160 is not in the Rayleigh-Jeans limit for the grain temperatures in these galaxies, the ratio is sensitive to large-grain temperature, and hence to starlight heating rate. The best-fit correlation, obtained with median clipping and a “robust” regression algorithm, effective for minimizing the effects of outliers (R Core Team 2014), is given by:
| (22) |
This relation predicts to within 0.21 dex (rms) over a range of of more than two orders of magnitude. Because the emission at these wavelengths is dominated completely by large grains, this long-wavelength ratio predicts very well the minimum starlight heating intensity.
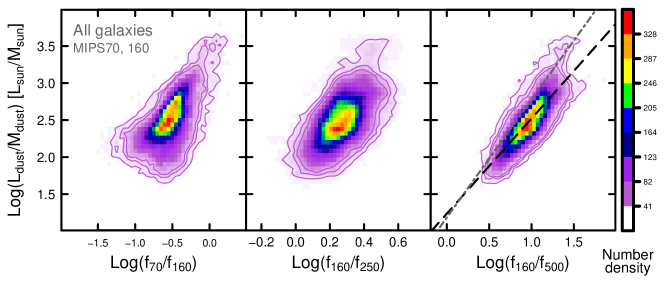
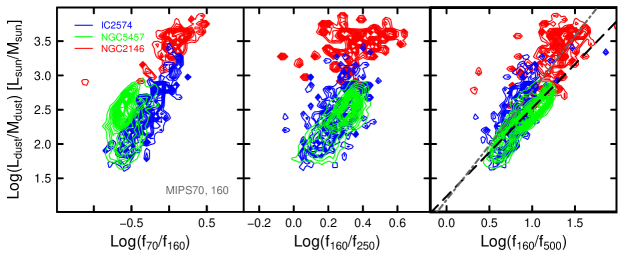
The PAH abundance parameter varies from galaxy to galaxy, as discussed in Section 6.5, where it is apparent that there is a correlation between and the gas-phase metallicity O/H. also exhibits significant variations within individual galaxies, as can be seen from the map of in M101 (see Fig. 5) as well as for other well-resolved galaxies (see Figs. 17.1-17.62). If is sensitive to metallicity, then we may expect radial variations within galaxies, with generally declining with radius. However, our maps also exhibit substantial azimuthal variations, suggesting that the PAH abundance responds to changes in environmental conditions beyond metallicity alone.
In Fig. 13, we explore – using three different proxies for the starlight intensity – whether is affected by the intensity of the radiation field. The left panel in Fig. 13 indicates that seems to be relatively independent of variations in the flux ratio. The flux ratio is apparently not uniquely tracing the temperature of the larger grains; as seen in Fig. 12, and discussed below, this ratio begins to reflect , and thus large-grain temperature, only above a certain threshold (). The middle panel, shows little correlation between and , but the right panel shows a stronger trend where tends to fall significantly when rises to the highest levels. The lack of dependence on the ratio (and the relatively small 0.5 dex range in ) arises because single-photon heating generally dominates at 24 ; big grains only get hot enough to radiate at 24 when the radiation field is extremely intense. Instead, at 70 , single-photon heating makes a significant contribution only for . Thus is a better indicator of warm large grains than , and it is these warm large grains that are the signature of high-intensity radiation fields that could be associated with PAH destruction.
As seen in the right panel of Fig. 13, the PAH fraction appears to vary with according to the empirical relation
| (23) |
where the normalization constant 0.0402 corresponds to %; the root-mean-square (rms) residual of this fit is 1.2% on . A similar empirical fit is given by the broken power-law shown by the grey dashed-dotted line in Fig. 13:
| (24) |
Such a trend may reflect a tendency for PAH destruction to occur in star-forming regions, where O stars supply high energy photons that photodestroy PAHs, and a significant fraction of the dust is exposed to starlight intensities high enough to elevate the ratio. Many studies have previously noted suppression of PAH emission in H II regions (e.g., Giard et al. 1994; Helou et al. 2004; Povich et al. 2007; Relaño et al. 2016). In a detailed study of PAH abundances in the Magellanic Clouds, Chastenet et al. (2019) show that is reduced in regions close to sources of H-ionizing radiation.
High values of also occur in low-metallicity galaxies, because of radiative transfer effects (hotter stars, less dust attenuation), and is consistent with the tendency for lower in a metal-poor ISM.
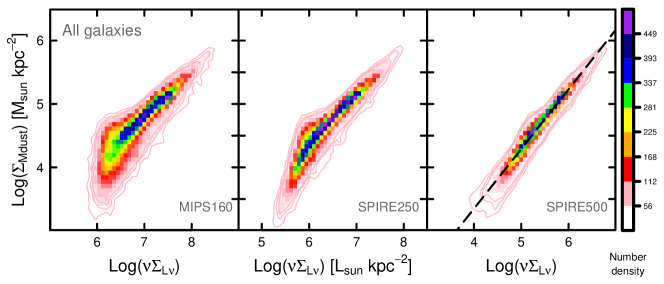
6.7.1 The resolved dust light-to-mass ratios
The dust light-to-mass ratio in galaxies and within galaxies, /, should reflect the peak and spread of luminosity-weighted dust temperatures. In the DL07 model, /, so also probes dust temperatures. We would thus expect / to depend on photometric flux ratios, as long as the two wavelengths in the flux ratios are sampling a sufficiently broad spectral range to be sensitive to large-grain temperature variations. Figure 14 illustrates the correlations in the resolved pixels of all galaxies between (noted as / in the ordinate axis label) and, as in Fig. 12, three flux density ratios, , , and . The longer the wavelength ratio (in this case 160 µm/500 µm), the better that can be predicted from observations. The right panel (black long-dashed line) of Fig. 14 shows the correlation with given by:
| (25) |
This fit with has a rms deviation of 0.16 dex over 22 000 degrees of freedom. The trend of with is much less reliable, so we have not shown any regression in the middle panel of Fig. 14. Because of the limited wavelength lever arm for the flux ratio (see also Fig. 12), for a given ratio, can vary by a factor of 30 or more; this makes it difficult to accurately determine the dust light-to-mass ratio from . Nevertheless, if we know the dust luminosity , and have a measure of a flux around the peak of dust emission (e.g., ), and one sufficiently far away and in the Rayleigh-Jeans regime (e.g., ), we can estimate the dust mass to within 50%.
Fig. 15 shows the same quantities but separately for three galaxies representative of the extremes probed by the KINGFISH sample: IC 2574, a metal-poor dwarf; NGC 5457 (M 101), a face-on grand-design spiral; and NGC 2146, a luminous IR galaxy (LIRG). For a flux density ratio with shortlong wavelengths (e.g., ) the / ratio within these galaxies can differ by up to an order of magnitude. As has been seen in previous figures, because is sensitive to both single-photon heating and the possible exposure of a small fraction of the dust to starlight intensities , the ratio does not strongly constrain the temperature of the dust grains that dominate the total emission. Instead, the longer-wavelength ratio (e.g., ) is a much better indicator of large-grain temperature, and consequently better correlated with the dust light-to-mass ratio /. Two regressions are shown in Figs. 14 and 15; the (black) long-dashed line, described above [see Eq. (25)], is for the entire sample. The (grey) dashed-dotted one is the regression obtained for only IC 2574 and NGC 2146, and given by:
| (26) |
The regression for the entire sample is entirely consistent with NGC 5457 (M 101), but not for IC 2574 and NGC 2146, which may be considered two “extreme” galaxies. The overall radiation fields in IC 2574 and NGC 2146 are higher (in the mean, by 40% and a factor of 13, respectively) than that of NGC 5457. These more intense heating fields, possibly a signature of starbursts, result in a slightly steeper slope relating / and than in more quiescent environments such as the disk of NGC 5457 (and most of the KINGFISH sample).
In the present model, the dust temperatures are determined by the starlight intensity distribution within a pixel, which is characterized by three parameters: , , and (see Section 5), and we need more than two bands if we wish to determine the distribution of temperatures for the emitting dust well enough to reliably estimate the mass of dust in the pixel. On the other hand, if flux ratios at longer wavelengths are considered (right panel of Fig. 15), there is much less variation within and between galaxies. Such behavior was also seen with in Fig. 12, and suggests that ratios at these longer wavelengths better trace /, because they provide better information about the temperatures of the large grains that dominate the dust luminosity.
6.7.2 The resolved dust mass surface densities
Given the relative constancy of dust-to-metals ratios for galaxies with metallicities (O/H)8.4 (see Fig. 8b), the dust luminosity in the Rayleigh-Jeans (R-J) regime of the dust SED has become a popular tracer of ISM mass (e.g., Corbelli et al. 2012; Eales et al. 2012; Groves et al. 2015; Scoville et al. 2014, 2016, 2017). This is an effective technique both locally and at high redshift because the R-J tail of the dust emission probes optically-thin dust, and is relatively insensitive to dust temperature. Here we explore whether this is also true for the spatially-resolved dust emission in the KINGFISH sample. Figure 16 shows the dust mass surface density (estimated from the renormalized DL07 model) plotted against monochromatic dust luminosity surface density , in the MIPS 160 µm, SPIRE 250 µm, and SPIRE 500 µm bands. It can be seen that at 160 µm, a wavelength that generally probes the dust emission peak, there is only a broad correlation with more than an order of magnitude dispersion at low surface brightness. As wavelength increases toward the SPIRE bands, the correlation improves, and becomes very good at 500 µm, similar to the trends found for KINGFISH global values by Groves et al. (2015).
The rightmost panel reports the best-fit correlation, obtained with the robust regression algorithm:
| (27) |
This fit gives an rms scatter 0.07 dex on () (with 25 400 dof), implying that dust mass surface densities can be inferred from 500 µm luminosity surface densities to within 20%. The slope is significantly sub-linear, over almost three decades of 500 µm luminosity surface densities, reflecting the tendency for dust to be somewhat warmer in pixels where is high, presumably because these pixels are more likely to harbor star-forming regions. Groves et al. (2015) obtained a similar result globally for inferring gas mass from for all KINGFISH galaxies including dwarfs (stellar mass ); however, once Groves et al. (2015) considered only the more massive galaxies, the slope steepened and became approximately linear.
The rms deviation of only 0.07 dex from Eq. (LABEL:eq:mass500) implies that one can estimate more reliably from alone than from the total dust luminosity and the ratio of two flux densities and . This is because obtaining from using Eq. (25) in effect requires estimation of , whereas obtaining from from (LABEL:eq:mass500) (with an rms of 0.16 dex) requires estimating only , since at 500 the dust emission is in the Rayleigh-Jeans limit, with .
To estimate ISM mass from Eq. (LABEL:eq:mass500), the dust mass from Eq. (LABEL:eq:mass500) needs to be combined with a gas-to-dust ratio as discussed in Sect. 6.6. However, this ratio depends on metallicity (see Fig. 8); thus oxygen abundance needs to be incorporated to estimate gas mass for metal poor galaxies. In any case, Fig. 16 shows that the slope between dust mass and luminosity is steeper, closer to unity, at lower surface brightnesses, roughly independently of wavelength. However, global integrated values of quantities such as long-wavelength IR luminosity are luminosity weighted, thus sampling preferentially higher surface brightnesses. Thus, our new result for resolved regions in KINGFISH galaxies is inconsistent with a strictly linear trend of dust mass with long-wavelength IR luminosity. Indeed, as noted above, a non-linear behavior would be expected since the dust in high pixels is, on average, somewhat warmer.
7 Summary
Dust modeling results for 70 galaxies (61 KINGFISH galaxies, plus 9 additional galaxies present in the observed fields) are presented here. Dust is detected reliably in 62 galaxies, and upper limits are reported for the remaining 8. Tables LABEL:tab:spitzer and LABEL:tab:herschel report the global galaxy photometry, and the best-fit dust parameter estimates are given in Table LABEL:tab:dust. Dust parameter maps are displayed in Figs. 17.1-17.62. The DL07 dust model successfully reproduces the dust SEDs over the wide variety of environments present in the KINGFISH sample.
Long-wavelength imaging can be omitted in order to increase the angular resolution of the modeling, but results become unreliable if the long-wavelength coverage is insufficient. For maximum reliability, we recommend using all cameras available, including MIPS160 and SPIRE250, SPIRE350, and SPIRE500. If better angular resolution is critical, the lowest-resolution cameras (SPIRE500 and MIP160) can be left out, but estimates of dust mass become unreliable unless at least SPIRE250 is included. If SPIRE350, SPIRE500, and MIPS160 are not included, the DL07 model dust masses can be low by as much as a factor 0.8, or high by as much as a factor 2 (see Figs. 20); the median factor is 1.25. and estimates are fairly insensitive to the camera combination used, so they can be obtained reliably without photometry, provided that the signal/noise ratio is adequate.
Resolved (multipixel) and global (single-pixel) modeling generate similar estimates of , , and when all the Spitzer and Herschel cameras are employed. The single-pixel modeling tends to slightly underestimate the total dust mass by 13% (see Fig. 21).
Our analysis shows that , the fraction of the dust mass contributed by PAHs, correlates much better with the PP04N2 estimate for O/H than for the PT estimate, strongly suggesting that PP04N2 is a better strong-line abundance estimator than the PT estimator. We find that appears to increase monotonically with increasing metallicity, with varying linearly with for (O/H)PP04N2 (see Fig. 7b and Eq. 18).
For most star-forming galaxies with metallicity , the dust/gas ratio is close to the limiting value where nearly all of the refractory elements are locked up in grains. However, at lower metallicity, the dust/gas ratio is often well below this limiting value, consistent with what is expected from a simple toy model with accretion rate (see Fig. 8b).
The resolved regions in the KINGFISH galaxy sample show several trends with , , and mass-to-light ratios for dust emission. can be estimated from long-wavelength flux ratios (e.g., ) to within a factor of two over more than two orders of magnitude in [see Eq. (22)]. From the same flux ratio, and with a measurement of dust luminosity, dust mass can be estimated to within 50% [see Eq. (25)]. Despite a variation of 3 orders of magnitude in IR surface brightness, for the adopted physical dust model it is possible to estimate dust mass from IR luminosity at 500 µm to within 0.07 dex), affording an accuracy of 20% [see Eq. (LABEL:eq:mass500)]. There are of course systematic errors coming from the choice of dust model, but these are difficult to estimate. Estimating gas mass for metal-poor galaxies requires incorporating metallicity, because of the metallicity dependence of dust-to-gas ratios. Our formulations for inferring starlight heating intensity and dust mass from flux ratios and integrated IR or monochromatic luminosities have been calibrated over 22 000 independent regions in 62 galaxies, spanning metal-poor dwarf irregulars to grand-design spiral disks and actively star-forming LIRGs. These calibrated prescriptions are designed with the aim of facilitating comparison with high-redshift galaxies, where frequently rest-frame and at least one longer wavelength flux are available.
References
- Alatalo et al. (2011) Alatalo, K., Blitz, L., Young, L. M., et al. 2011, ApJ, 735, 88
- Alatalo et al. (2015) Alatalo, K., Lacy, M., Lanz, L., et al. 2015, ApJ, 798, 31
- Andrews & Martini (2013) Andrews, B. H., & Martini, P. 2013, ApJ, 765, 140
- Aniano et al. (2011) Aniano, G., Draine, B. T., Gordon, K. D., & Sandstrom, K. M. 2011, PASP, 123, 1218
- Aniano et al. (2012) Aniano, G., Draine, B. T., Calzetti, D., et al. 2012, ApJ, 756, 46
- Asano et al. (2013) Asano, R. S., Takeuchi, T. T., Hirashita, H., & Inoue, A. K. 2013, Earth, Planets, and Space, 65, 213
- Asplund et al. (2009) Asplund, M., Grevesse, N., Sauval, A. J., & Scott, P. 2009, ARA&A, 47, 481
- Bajaja et al. (1984) Bajaja, E., van der Burg, G., Faber, S. M., et al. 1984, A&A, 141, 309
- Berg et al. (2015) Berg, D. A., Skillman, E. D., Croxall, K. V., et al. 2015, ApJ, 806, 16
- Boselli et al. (1998) Boselli, A., Lequeux, J., Sauvage, M., et al. 1998, A&A, 335, 53
- Bot et al. (2010) Bot, C., Ysard, N., Paradis, D., et al. 2010, A&A, 523, A20
- Calzetti et al. (2018) Calzetti, D., Wilson, G. W., Draine, B. T., et al. 2018, ApJ, 852, 106
- Chastenet et al. (2019) Chastenet, J., Sandstrom, K., Chiang, I.-D., et al. 2019, ApJ, 876, 62
- Chiang et al. (2018) Chiang, I. D., Sandstrom, K. M., Chastenet, J., et al. 2018, ApJ, 865, 117
- Corbelli et al. (2012) Corbelli, E., Bianchi, S., Cortese, L., et al. 2012, A&A, 542, A32
- Croxall et al. (2016) Croxall, K. V., Pogge, R. W., Berg, D. A., Skillman, E. D., & Moustakas, J. 2016, ApJ, 830, 4
- Dalcanton et al. (2015) Dalcanton, J. J., Fouesneau, M., Hogg, D. W., et al. 2015, ApJ, 814, 3
- Dale et al. (2009) Dale, D. A., Cohen, S. A., Johnson, L. C., et al. 2009, ApJ, 703, 517
- Dale et al. (2012) Dale, D. A., Aniano, G., Engelbracht, C. W., et al. 2012, ApJ, 745, 95
- Dale et al. (2017) Dale, D. A., Cook, D. O., Roussel, H., et al. 2017, ApJ, 837, 90
- De Cia et al. (2016) De Cia, A., Ledoux, C., Mattsson, L., et al. 2016, A&A, 596, A97
- Dellenbusch et al. (2008) Dellenbusch, K. E., Gallagher, John S., I., Knezek, P. M., & Noble, A. G. 2008, AJ, 135, 326
- Donovan Meyer et al. (2013) Donovan Meyer, J., Koda, J., Momose, R., et al. 2013, ApJ, 772, 107
- Draine (1990) Draine, B. T. 1990, in Astr. Soc. Pac. Conf. Ser. 12, The Evolution of the Interstellar Medium, ed. L. Blitz, 193–205
- Draine (2003) Draine, B. T. 2003, ARA&A, 41, 241
- Draine (2009) Draine, B. T. 2009, in Astr. Soc. Pac. Conf. Ser. 414, Cosmic Dust – Near and Far, ed. T. Henning, E. Grün, & J. Steinacker, 453–472
- Draine (2011) —. 2011, Physics of the Interstellar and Intergalactic Medium (Princeton, NJ: Princeton Univ. Press)
- Draine & Hensley (2012) Draine, B. T., & Hensley, B. 2012, ApJ, 757, 103
- Draine & Li (2007) Draine, B. T., & Li, A. 2007, ApJ, 657, 810
- Draine & Salpeter (1979) Draine, B. T., & Salpeter, E. E. 1979, ApJ, 231, 77
- Draine et al. (2007) Draine, B. T., Dale, D. A., Bendo, G., et al. 2007, ApJ, 663, 866
- Draine et al. (2014) Draine, B. T., Aniano, G., Krause, O., et al. 2014, ApJ, 780, 172
- Eales et al. (2012) Eales, S., Smith, M. W. L., Auld, R., et al. 2012, ApJ, 761, 168
- Edmunds (2001) Edmunds, M. G. 2001, MNRAS, 328, 223
- Engelbracht et al. (2005) Engelbracht, C. W., Gordon, K. D., Rieke, G. H., et al. 2005, ApJ, 628, L29
- Engelbracht et al. (2008) Engelbracht, C. W., Rieke, G. H., Gordon, K. D., et al. 2008, ApJ, 678, 804
- Esteban et al. (2009) Esteban, C., Bresolin, F., Peimbert, M., et al. 2009, ApJ, 700, 654
- Fazio et al. (2004) Fazio, G. G., Hora, J. L., Allen, L. E., et al. 2004, ApJS, 154, 10
- Galametz et al. (2012) Galametz, M., Kennicutt, R. C., Albrecht, M., et al. 2012, MNRAS, 425, 763
- Galliano et al. (2011) Galliano, F., Hony, S., Bernard, J. P., et al. 2011, A&A, 536, A88
- Giard et al. (1994) Giard, M., Bernard, J. P., Lacombe, F., Normand, P., & Rouan, D. 1994, A&A, 291, 239
- Gordon et al. (2011) Gordon, K. D., Meixner, M., Meade, M. R., et al. 2011, AJ, 142, 102
- Griffin et al. (2010) Griffin, M. J., Abergel, A., Abreu, A., et al. 2010, A&A, 518, L3
- Groves et al. (2015) Groves, B. A., Schinnerer, E., Leroy, A., et al. 2015, ApJ, 799, 96
- Helou et al. (2004) Helou, G., Roussel, H., Appleton, P., et al. 2004, ApJS, 154, 253
- Hota & Saikia (2005) Hota, A., & Saikia, D. J. 2005, MNRAS, 356, 998
- Hunt et al. (2005) Hunt, L., Bianchi, S., & Maiolino, R. 2005, A&A, 434, 849
- Hunt et al. (2016) Hunt, L., Dayal, P., Magrini, L., & Ferrara, A. 2016, MNRAS, 463, 2002
- Hunt et al. (2010) Hunt, L. K., Thuan, T. X., Izotov, Y. I., & Sauvage, M. 2010, ApJ, 712, 164
- Hunt et al. (2015) Hunt, L. K., Draine, B. T., Bianchi, S., et al. 2015, A&A, 576, A33
- Hunter et al. (2012) Hunter, D. A., Ficut-Vicas, D., Ashley, T., et al. 2012, AJ, 144, 134
- Israel et al. (2010) Israel, F. P., Wall, W. F., Raban, D., et al. 2010, A&A, 519, A67
- Kennicutt et al. (2003) Kennicutt, R. C., Armus, L., Bendo, G., et al. 2003, PASP, 115, 928
- Kennicutt et al. (2011) Kennicutt, R. C., Calzetti, D., Aniano, G., et al. 2011, PASP, 123, 1347
- Kewley & Ellison (2008) Kewley, L. J., & Ellison, S. L. 2008, ApJ, 681, 1183
- Kobulnicky & Kewley (2004) Kobulnicky, H. A., & Kewley, L. J. 2004, ApJ, 617, 240
- Leroy et al. (2009) Leroy, A. K., Walter, F., Bigiel, F., et al. 2009, AJ, 137, 4670
- Leroy et al. (2013) Leroy, A. K., Walter, F., Sandstrom, K., et al. 2013, AJ, 146, 19
- Li et al. (2013) Li, Y., Bresolin, F., & Kennicutt, Jr., R. C. 2013, ApJ, 766, 17
- Li et al. (2011) Li, Z., Jones, C., Forman, W. R., et al. 2011, ApJ, 730, 84
- Madden (2000) Madden, S. C. 2000, New Astronomy Review, 44, 249
- Makarov et al. (2014) Makarov, D., Prugniel, P., Terekhova, N., Courtois, H., & Vauglin, I. 2014, A&A, 570, A13
- Marble et al. (2010) Marble, A. R., Engelbracht, C. W., van Zee, L., et al. 2010, ApJ, 715, 506
- Martinez-Badenes et al. (2012) Martinez-Badenes, V., Lisenfeld, U., Espada, D., et al. 2012, A&A, 540, A96
- Mathis et al. (1983) Mathis, J. S., Mezger, P. G., & Panagia, N. 1983, A&A, 128, 212
- Mattsson et al. (2012) Mattsson, L., Andersen, A. C., & Munkhammar, J. D. 2012, MNRAS, 423, 26
- McMullin et al. (2007) McMullin, J. P., Waters, B., Schiebel, D., Young, W., & Golap, K. 2007, Astronomical Society of the Pacific Conference Series, Vol. 376, CASA Architecture and Applications, ed. R. A. Shaw, F. Hill, & D. J. Bell, 127
- Moustakas et al. (2010) Moustakas, J., Kennicutt, R. C., Tremonti, C. A., et al. 2010, ApJS, 190, 233
- Muñoz-Mateos et al. (2009) Muñoz-Mateos, J. C., Gil de Paz, A., Boissier, S., et al. 2009, ApJ, 701, 1965
- Ott (2010) Ott, S. 2010, in Astronomical Society of the Pacific Conference Series, Vol. 434, Astronomical Data Analysis Software and Systems XIX, ed. Y. Mizumoto, K.-I. Morita, & M. Ohishi, 139–142
- Pellegrini et al. (2013) Pellegrini, E. W., Smith (PI, J. D., Wolfire, M. G., et al. 2013, ApJ, 779, L19
- Pettini & Pagel (2004) Pettini, M., & Pagel, B. E. J. 2004, MNRAS, 348, L59
- Pilbratt et al. (2010) Pilbratt, G. L., Riedinger, J. R., Passvogel, T., et al. 2010, A&A, 518, L1
- Pilyugin et al. (2014) Pilyugin, L. S., Grebel, E. K., & Kniazev, A. Y. 2014, AJ, 147, 131
- Pilyugin & Thuan (2005) Pilyugin, L. S., & Thuan, T. X. 2005, ApJ, 631, 231
- Pilyugin et al. (2006) Pilyugin, L. S., Thuan, T. X., & Vílchez, J. M. 2006, MNRAS, 367, 1139
- Pilyugin et al. (2007) —. 2007, MNRAS, 376, 353
- Planck Collaboration et al. (2011) Planck Collaboration, Ade, P. A. R., Aghanim, N., et al. 2011, A&A, 536, A17
- Planck Collaboration et al. (2016) —. 2016, A&A, 586, A132
- Poglitsch et al. (2010) Poglitsch, A., Waelkens, C., Geis, N., et al. 2010, A&A, 518, L2
- Povich et al. (2007) Povich, M. S., Stone, J. M., Churchwell, E., et al. 2007, ApJ, 660, 346
- R Core Team (2014) R Core Team. 2014, R: A Language and Environment for Statistical Computing, R Foundation for Statistical Computing, Vienna, Austria
- Relaño et al. (2016) Relaño, M., Kennicutt, R., Lisenfeld, U., et al. 2016, A&A, 595, A43
- Rémy-Ruyer et al. (2013) Rémy-Ruyer, A., Madden, S. C., Galliano, F., et al. 2013, A&A, 557, A95
- Rémy-Ruyer et al. (2014) —. 2014, A&A, 563, A31
- Rieke et al. (2004) Rieke, G. H., Young, E. T., Engelbracht, C. W., et al. 2004, ApJS, 154, 25
- Roche et al. (1991) Roche, P. F., Aitken, D. K., Smith, C. H., & Ward, M. J. 1991, MNRAS, 248, 606
- Roussel (2013) Roussel, H. 2013, PASP, 125, 1126
- Roussel et al. (2006) Roussel, H., Helou, G., Smith, J. D., et al. 2006, ApJ, 646, 841
- Sandstrom et al. (2013) Sandstrom, K. M., Leroy, A. K., Walter, F., et al. 2013, ApJ, 777, 5
- Scoville et al. (2014) Scoville, N., Aussel, H., Sheth, K., et al. 2014, ApJ, 783, 84
- Scoville et al. (2016) Scoville, N., Sheth, K., Aussel, H., et al. 2016, ApJ, 820, 83
- Scoville et al. (2017) Scoville, N., Lee, N., Vanden Bout, P., et al. 2017, ApJ, 837, 150
- Skibba et al. (2011) Skibba, R. A., Engelbracht, C. W., Dale, D., et al. 2011, ApJ, 738, 89
- Storchi-Bergmann et al. (1994) Storchi-Bergmann, T., Calzetti, D., & Kinney, A. L. 1994, ApJ, 429, 572
- Strickland et al. (2004) Strickland, D. K., Heckman, T. M., Colbert, E. J. M., Hoopes, C. G., & Weaver, K. A. 2004, ApJS, 151, 193
- Sturm et al. (2000) Sturm, E., Lutz, D., Tran, D., et al. 2000, A&A, 358, 481
- Utomo et al. (2019) Utomo, D., Chiang, I. D., Leroy, A. K., Sandstrom, K. M., & Chastenet, J. 2019, ApJ, 874, 141
- Vagshette et al. (2012) Vagshette, N. D., Pandge, M. B., Pandey, S. K., & Patil, M. K. 2012, New A, 17, 524
- van Zee et al. (1997) van Zee, L., Haynes, M. P., & Salzer, J. J. 1997, AJ, 114, 2479
- Vílchez et al. (2019) Vílchez, J. M., Relaño, M., Kennicutt, R., et al. 2019, MNRAS, 483, 4968
- Walter et al. (2008) Walter, F., Brinks, E., de Blok, W. J. G., et al. 2008, AJ, 136, 2563
- Weingartner & Draine (1999) Weingartner, J. C., & Draine, B. T. 1999, ApJ, 517, 292
- Weingartner & Draine (2001a) —. 2001a, ApJ, 548, 296
- Weingartner & Draine (2001b) —. 2001b, ApJ, 553, 581
- Werner et al. (2004) Werner, M. W., Roellig, T. L., Low, F. J., et al. 2004, ApJS, 154, 1
- Zhukovska et al. (2016) Zhukovska, S., Dobbs, C., Jenkins, E. B., & Klessen, R. S. 2016, ApJ, 831, 147
Appendix A Resolved dust parameter maps for KINGFISH galaxies
As described in the text, each galaxy where we have a positive dust detection has two figures: the first (a) shows the model done at MIPS160 resolution, using data from all cameras (IRAC, MIPS, PACS, and SPIRE) cameras. This is our “gold standard” modeling. The second (b) shows a model at SPIRE250 resolution, using IRAC, MIPS24, PACS, and SPIRE250 cameras (i.e., omitting MIPS70, MIPS160, SPIRE350, SPIRE500). This latter modeling, while able to resolve smaller scale structures in the galaxies, is overall less reliable.
Figures 17.1-17.62 each have twelve panels. For each of the resolutions. the top row is a map of dust luminosity surface density (left), dust surface density (center), and the model SED (right). The lower row shows the starlight intensity parameter (left), the PAH abundance parameter (center), and the PDR fraction (left). The dust luminosity surface density is shown for the full field, with the white contour showing the minimum surface brightness below which we do not attempt to model the emission. Maps of derived quantities (, , , and ) are limited to the “galaxy mask” region with . In the SED plot, the observed photometry is represented by rectangular boxes (Spitzer (IRAC, MIPS) in red; Herschel (PACS, SPIRE) in blue) showing uncertainties. The black line is a single-pixel DL07 model that seeks to reproduce the observed SED, with different components shown. The values of and in the label are for the DL07 model before renormalization. The cyan line is the stellar contribution, the dark red line is the emission from dust heated by the power-law distribution, and the dark green line is emission from dust heated by .
Figures 17.1-17.5 are shown below as examples. This paper with a complete figure set is available at http://www.astro.princeton.edu/~draine/KFdust/KFdust_full.pdf
Fig. Set17.
Dust Maps for 62 Galaxies
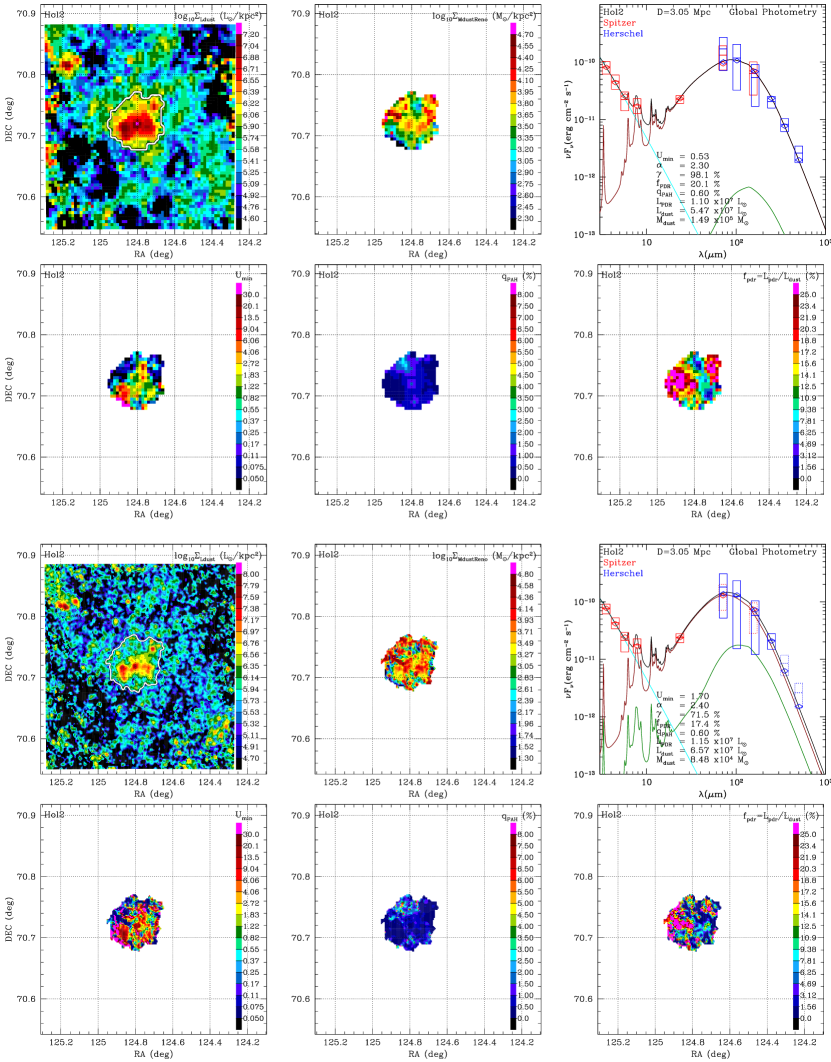
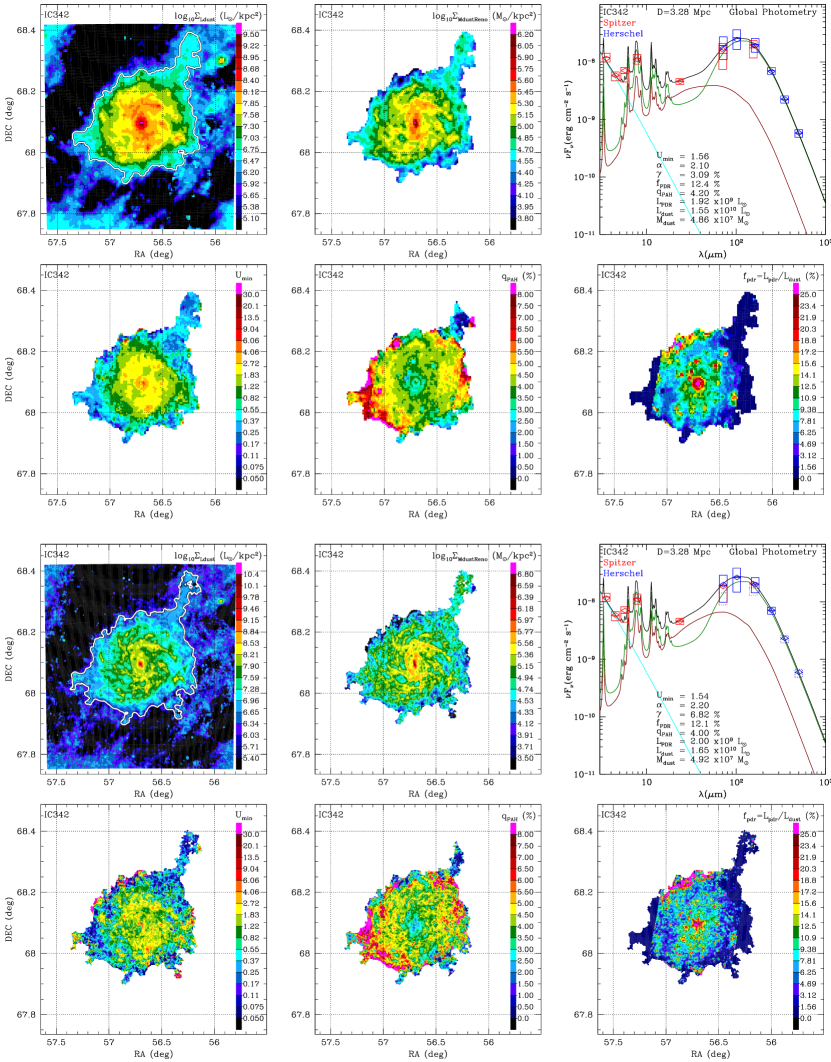
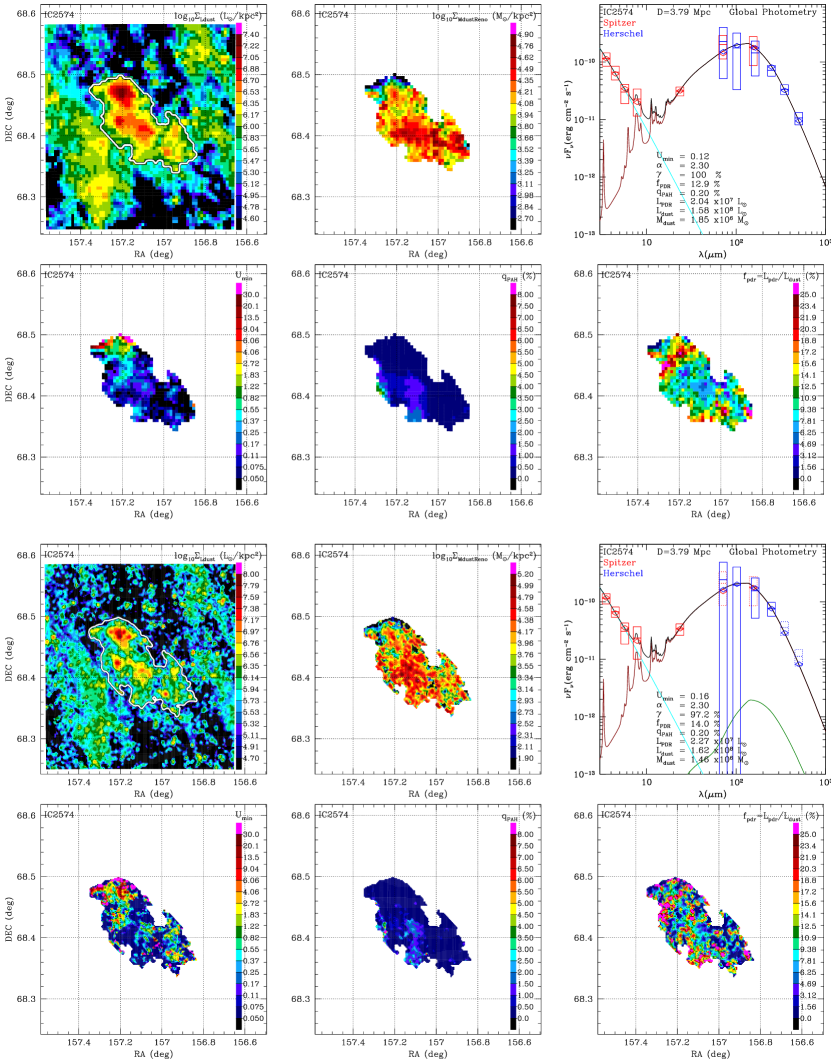
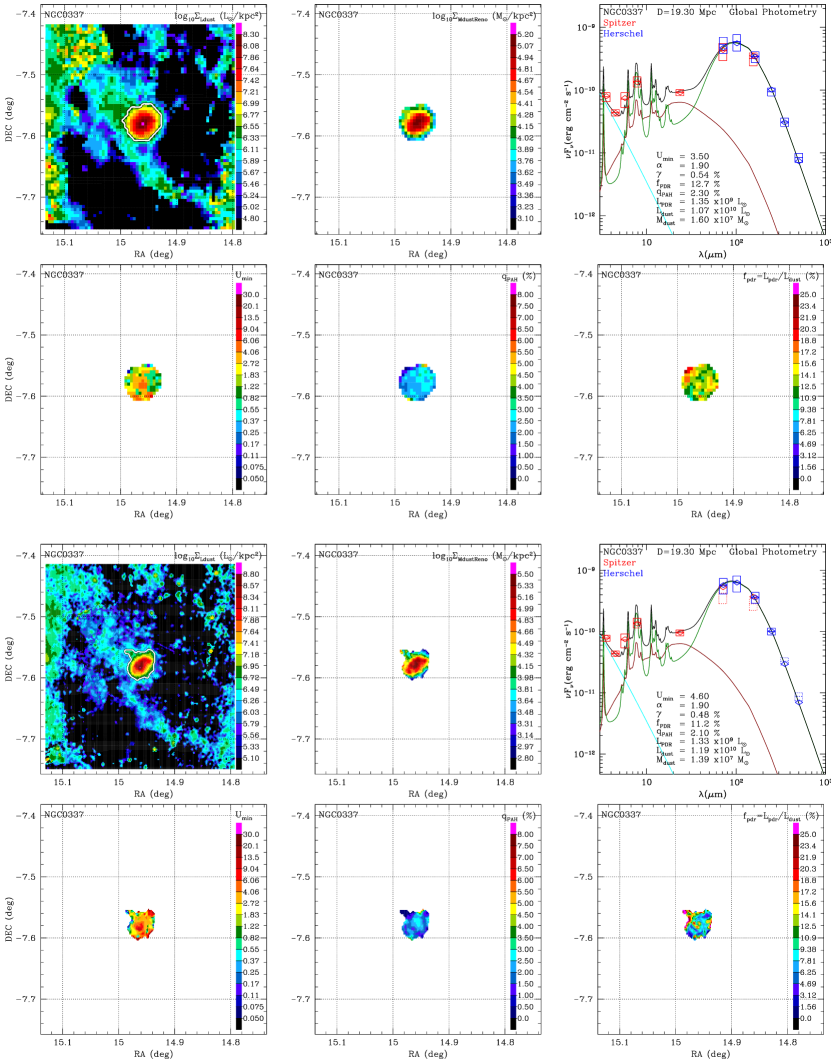
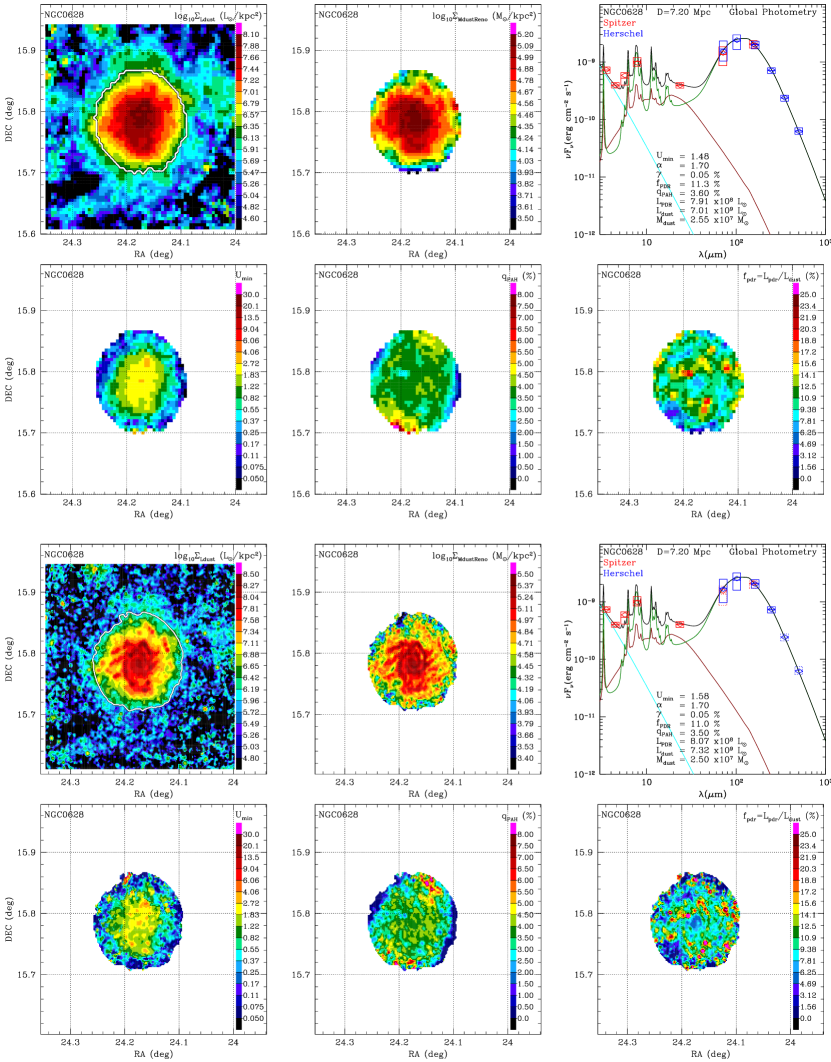
Appendix B Cases with upper limits for dust mass
Eight galaxies in the KINGFISH sample – five dwarfs (DDO053, DDO154, DDO165, Hol1, and M81dwB) and three ellipticals (NGC0584, NGC0855, and NGC1404) yield upper limits on the dust mass from our modeling. In these cases, the signal from the galaxy in the far-IR is of comparable magnitude to the contamination from background galaxies, leading to uncertain dust mass measurements.
For the 3 elliptical galaxies, we employ a -based mask that roughly coincides with the optical galaxy. To obtain an upper limit on the dust mass in the case of these non-detections, we randomly shift the mask around in the M160 resolution dust mass image, avoiding overlap with the original mask, and remeasure the total dust mass. We construct a distribution of these “background” dust mass measurements to obtain a mean and standard deviation. In all galaxies mentioned above, the mean of the “background” dust mass values is positive, as would be expected due to the real signal at far-IR wavelengths from unidentified background sources (“confusion noise”). The measured dust mass at the expected galaxy location is within of the mean. In the text and Table LABEL:tab:Mdupperlimits we provide the upper limit on the dust mass generated with this procedure.
The definition of the galaxy mask itself is also potentially affected by confusion noise. In the case of the dwarf galaxies, we use the H I observations from THINGS and Little THINGS to create an alternative galaxy mask, based on a cut at an H I column density of from the H I image convolved to M160 resolution. The H I-based galaxy mask is typically somewhat larger than that defined by the dust luminosity surface density cut. We apply the same procedure described above to obtain the background mean and standard deviation.
Table LABEL:tab:Mdupperlimits and Figures 18.1-18.8 provide the results of this procedure. Table LABEL:tab:Mdupperlimits lists the upper limits for each galaxy using the H I-based masks for the dwarfs and the dust luminosity surface density masks (as described in the text) for the ellipticals. Histograms of the dust masses from the randomly shifted masks are shown in Figures 18.1-18.8. We note that the dust mass limits from this procedure are expected to be very conservative. Higher S/N could be obtained by a careful treatment of the integrated photometry for each galaxy taking the confusion noise into account.
Figure 18.1 (DDO053) and Figure 18.5 (NGC0584) are shown below as examples. This paper with a complete figure set is available at http://www.astro.princeton.edu/~draine/KFdust/KFdust_full.pdf
Fig. Set18. 8 Galaxies with Upper Limits for Dust Mass: DDO053, DDO154, DDO165, Hol1, M81dwB, NGC0584, NGC0855, NGC1404
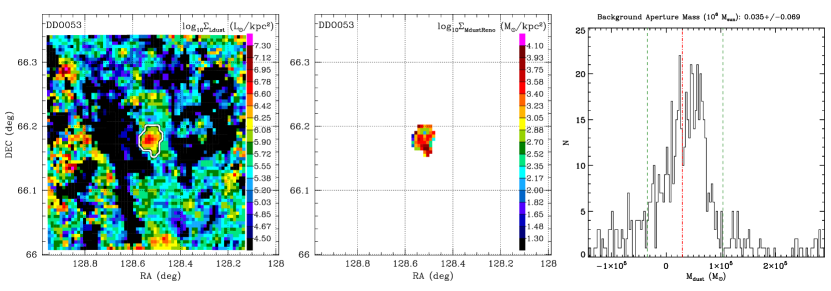
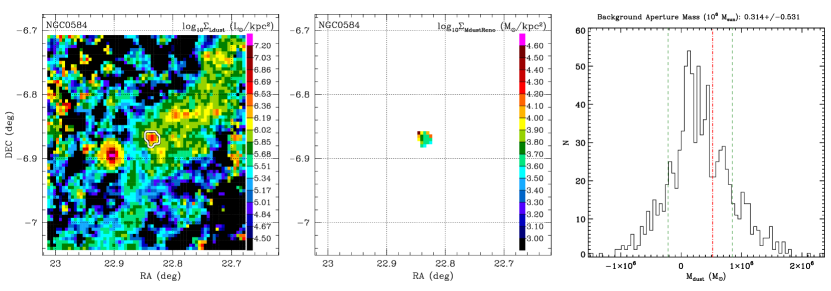
Appendix C On-line KINGFISH data and dust models
The processed KINGFISH imaging and dust models are available online at http://www.astro.princeton.edu/~draine/KFdust/KFdustsite/
Here we briefly describe the types of data that are available there.
For each of the 70 galaxies (61 KINGFISH galaxies + 9 “extras”) we provide results for resolved modeling at 4 different resolutions: M160, S500, S350, and S250. For each case, we use all compatible cameras (see Table 4). FITS files of the following maps are provided:
-
•
Dust mass surface density (renormalized).
-
•
Dust luminosity per unit projected area .
-
•
PAH mass fraction .
-
•
= minimum starlight intensity parameter for the DL07 model. The renormalized can be obtained from using Eq. (16).
-
•
= mean starlight intensity parameter for the DL07 model. The renormalized can be obtained from using Eq. (15).
-
•
= fraction of the total starlight heating of dust taking place in subregions where .
-
•
global SED for the dust model.
For each case, the data in the FITS files are limited to the “galaxy mask” defined by , where for each galaxy is given in Table 2.1.
Appendix D Dependence of model results on PSF used and wavelength coverage
Obviously, one would like to model the dust emission with the best angular resolution that is feasible. Some of the cameras (e.g., PACS160) have small PSFs, which would seem to allow observations and modeling with high angular resolution. However, deciding to use a small PSF means not being able to use data from cameras with larger PSFs, which both reduces the amount of redundant data (e.g., MIPS70 and MIPS160) and limits the wavelength coverage by preventing use of the longer wavelength cameras (e.g., SPIRE500). In addition, use of a smaller PSF implies a lower signal/noise ratio, which is a limiting factor in low surface brightness regions.
Here we examine the degree to which derived dust and starlight parameters are sensitive to the choice of PSF. We also compare the results obtained from the resolved modeling and those from global photometry.
D.1 Comparison of modeling at S250 resolution with the gold standard (M160)
Figure 2.1 shows the comparison of the dust parameter estimates obtained from models using the S250 PSF (18.2″FWHM) with parameters estimated from (our “gold standard”) modeling using all cameras (IRAC, MIPS, PACS, SPIRE) and the M160 PSF (39″FWHM).
The results for and at S250 resolution appear to be quite robust: the median change in is only 5%, which may be due in part to calibration differences between MIPS160 and PACS160, with MIPS160 data being used only in the M160 PSF modeling. shows more variation: with a median change of 25%; this is likely because loss of SPIRE350 and SPIRE500 may allow modeling at the S250 PSF to include a bit more cool dust than is actually present. However, it is gratifying that the median change is only 25%, indicating that the DL07 model is relatively good at “predicting” emission using data shortward of . However, in some cases the dust mass is overestimated by as much as a factor of 2 (see Fig. 20), and we therefore recommend using M160 resolution modeling rather than the riskier S250 PSF.
![[Uncaptioned image]](/html/1912.04914/assets/x34.png)
![[Uncaptioned image]](/html/1912.04914/assets/x35.png)
![[Uncaptioned image]](/html/1912.04914/assets/x36.png)
![[Uncaptioned image]](/html/1912.04914/assets/x37.png)
D.2 Dust mass estimates at different resolutions
Figure 20 shows the comparison of the dust mass estimates for 4 different resolutions and camera combinations. The compared resolutions are
-
•
M160 (the “gold standard”) uses all the cameras (IRAC, MIPS, PACS, SPIRE) at the MIPS160 PSF; this is taken to be our best estimate for
-
•
S500: IRAC, MIPS24, MIPS70, PACS, and SPIRE at the SPIRE500 PSF.
-
•
S350: IRAC, MIPS24, MIPS70, PACS, SPIRE250, and SPIRE350 at the SPIRE350 PSF.
-
•
S250: IRAC, MIPS24, PACS, and SPIRE250 at the SPIRE250 PSF.
-
•
P160: IRAC, MIPS24, and PACS at the PACS160 PSF. This is the riskiest PSF we are willing to consider.
For each resolution, Fig. 20 shows a histogram of the galactic total dust mass estimates divided by the gold standard estimate.
We observe that dust mass discrepancies can be large, with the errors and bias increasing as fewer cameras are used, and long-wavelength data are lost. The S500 case (coverage out to 500, a PSF that is not much smaller than the M160 PSF, but no MIPS160 photometry) gives dust mass estimates that are close to our gold standard estimate, with a median ratio of 1.21. However, there are a few outliers where appears to be overestimated by as much a factor of 2. These are all galaxies with very weak dust emission and low signal/noise data, where loss of the data from one camera (MIPS160) causes a significant change in the apparent SED.
The systematic bias in as well as the scatter both increase as we move to smaller PSFs (S350, S250, P160). At P160 resolution, fully 25% of the cases have under-estimated by a factor of 2 or more.
On balance, it appears that modeling at S250 resolution is reasonable, although slightly risky – there is a significant chance that the dust mass may be overestimated or underestimated by a factor 1.5 or more. S350 resolution is safer, and S500 even better.
D.3 Modeling using only global photometry (single-pixel)
The KINGFISH galaxies are close () and large enough that they can be resolved using Herschel Space Telescope. When studying galaxies at larger distances, only their global photometry may be available. Here we compare our dust mass estimates using resolved imaging and multipixel modeling with “single-pixel” modeling that makes use of only the global SED. We recall that the dust modeling is not a linear process, and differences in parameter estimates are to be expected.
Figure 21 shows the ratio of the dust model parameter estimates from fitting global photometry (a “single pixel” model) versus our “gold standard” multipixel modeling at M160 resolution, where each pixel is modeled separately. In both cases we use all cameras: IRAC, MIPS, PACS and SPIRE. We observe that is very reproducible, with the single-pixel luminosity estimate differing from the multipixel result by only a few percent.
The dust mass estimate is probably most important, and is found to be moderately robust: for 75% of the cases, the single-pixel modeling obtains a mass estimate within 25% of the resolved multipixel analysis. Thus dust mass estimates for unresolved distant galaxies should be reliable, assuming only that the photometry covers a suitable range of wavelengths (rest-frame wavelengths ), with an adequate signal/noise ratio.
The and estimates are both quite robust, with the single pixel results agreeing with the multipixel analysis to within 5% in most cases.
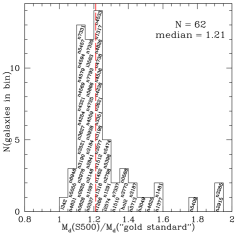 |
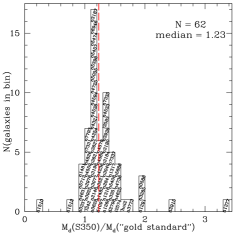 |
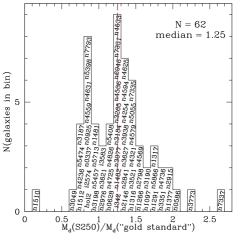 |
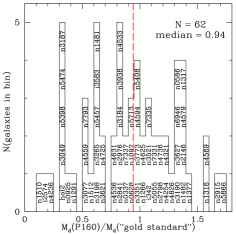 |