Solenogam: A new detector array for -ray and conversion-electron spectroscopy of long-lived states in fusion-evaporation products
Abstract
A new detector array, Solenogam, has been developed at the Australian National University Heavy Ion Accelerator Facility. Coupled initially to the SOLITAIRE 6.5 T, gas-filled, solenoidal separator, and later to an 8 T solenoid, the system enables the study of long-lived nuclear states through -ray and conversion-electron spectroscopy in a low-background environment. The detector system is described and results from the commissioning experiments are presented.
keywords:
Solenogam; Solitaire; Recoil separators; Gamma-ray and conversion-electron spectroscopy; Isomeric states1 Introduction
The study of isomeric states offers insight into nuclear structure, highlighting changes in the underlying behaviour of the nucleons. Transition rates between nuclear states depend on changes in excitation energy, angular momentum, parity, and state character. In particular, when there is a large change in the nuclear wavefunction, the associated transitions are inhibited, which can result in a relatively long lifetime.
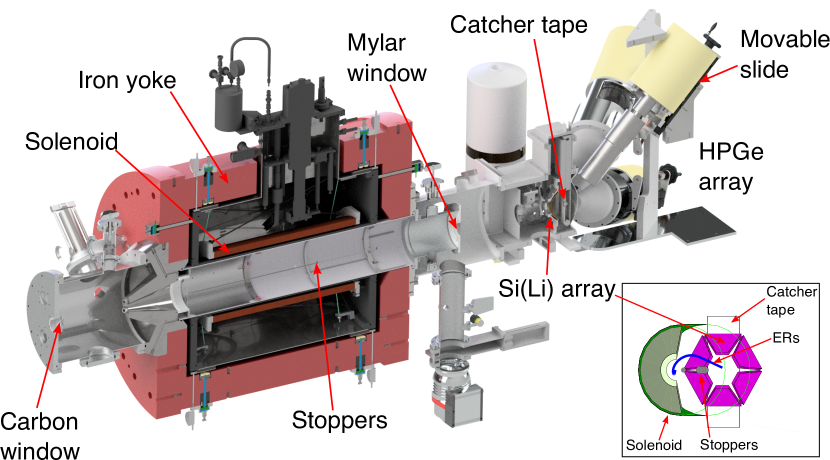
Solenogam (see Figure 1) is a spectrometer developed at the Australian National University (ANU), and located at the Heavy Ion Accelerator Facility (HIAF), for the purpose of characterising the decay of long-lived nuclear states such as isomers and radioactive ground states. The system combines a high-efficiency, high-resolution array of -ray and conversion-electron detectors, Solenogam, with a superconducting, solenoidal recoil separator, SOLITAIRE [1].
The solenoid allows nuclei of interest to be separated from elastically scattered beam particles and other reaction products, allowing their decay to be observed in a low-background environment, removed in space from the target location and in time from the beam burst. With a transmission efficiency of up to 80% and a flight time of less than a microsecond, SOLITAIRE is able to isolate states that could not be accessed using longer separators, such as the FMA [2] and RITU [3], albeit with a comparative loss of resolution and background reduction. Once the evaporation residues are transported to the focus of Solenogam, their decay is observed with both electron and -ray detectors. This combination allows conversion coefficients to be extracted from a simple intensity ratio so that transition multipolarities can be assigned and mixing ratios measured.
The addition of the Solenogam system to the ANU-HIAF expands on the existing capacity for conversion-electron spectroscopy and complements the existing Super-e spectrometer [4]. Super-e is capable of precision measurements of conversion electrons and electron–positron pairs, however lacks extensive -ray capabilities.
In the following sections, descriptions of SOLITAIRE and Solenogam are presented, followed by a summary of the experiments made during the development of the system. Lastly, the system’s performance is discussed, along with plans for potential improvements and future areas of research.
2 SOLITAIRE
SOLITAIRE (SOLenoid for In-beam Transport And Identification of Recoiling Evaporation-residues) [1] is a gas-filled, magnetic solenoid that separates fusion-evaporation residues from elastically scattered beam particles and transports them to the focal point of the Solenogam array (see Figure 1). Particles moving through the bore of the solenoid undergo a series of charge-changing collisions with the gas, quickly reaching an equilibrium charge-state distribution [5]. The solenoid then acts as a converging lens with a focal length of
| (1) |
where is the momentum of the particle, is the charge state of the ion, is the length of the solenoid, and is the average of the squared axial field [1]. The magnetic field can be tuned such that evaporation residues of interest are transported through the solenoid while scattered beam particles and other reaction products are stopped by a series of blocking discs placed along the axis. Initial measurements with the system have obtained a transmission of up to 80-90% [1]. An iron return yoke ensures that the magnetic field is negligible outside the bore of the solenoid.
SOLITAIRE can be used for the precise measurement of fusion cross-sections, where knowledge of the evaporation residue charge states allows position sensitive detectors at the focal plane to reconstruct the angular distribution of evaporation residues. Measurements of this type require a thin target so that the evaporation residues produced can escape the target with minimal loss of energy. Alternatively, nuclear structure measurements with the Solenogam array use -ray and electron detectors to study the decay schemes of long-lived nuclear states. For these measurements a thicker target can be used to maximise yield, as precise knowledge of the scattering angles is not important. For a more detailed discussion of SOLITAIRE and its capabilities, see Ref. [1].
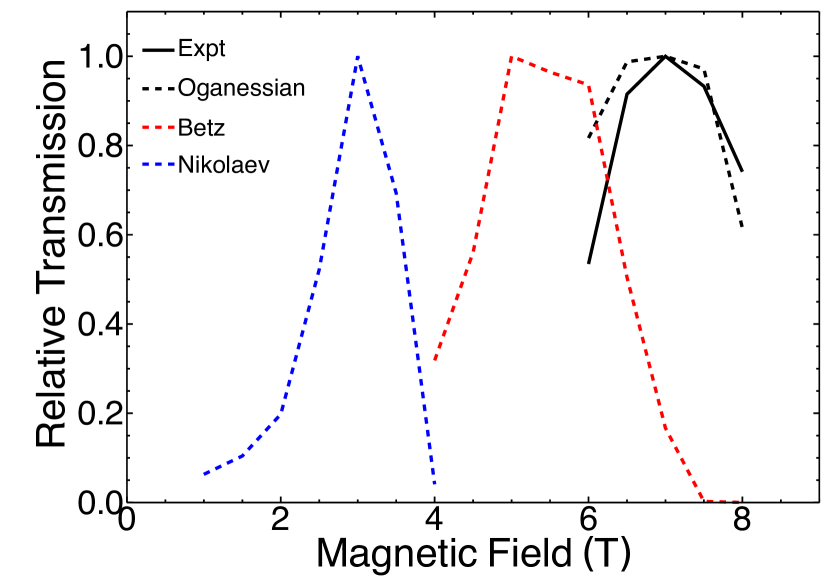
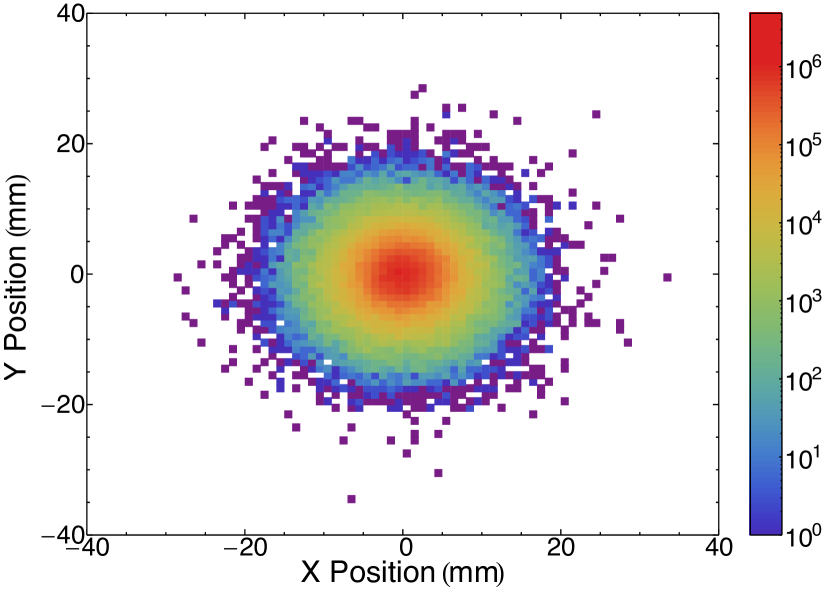
The simulation software Simsol [6] (developed at the Australian National University) can be used to simulate the path of heavy ions through the solenoid and provides an estimate of the magnetic field required for an experiment. Ref. [1] presents a comparison of experimental results with the predictions of Simsol, giving confidence in the validity of its output. For tuning the solenoid, the angular distribution of evaporation residues leaving the target can be determined using SRIM [7] and the path through the solenoid can then be simulated at different magnetic field strengths, using a number of approaches to calculate the average charge state. Figure 2 shows the normalised transmission from these simulations for the 176Yb(19F,5n)190Au reaction with a 95 MeV 19F beam, compared with measurements conducted in the current work (discussed below). The results of the simulations and measurements were in good agreement when the approach of Oganessian et al. [8] was used to calculate the average charge state. Figure 3 shows the simulated distribution of implantations on the catcher tape predicting a beam spot with radius 1.5 cm.
The Solenogam system was originally used coupled to a solenoid with a maximum field of 6.5 T and initial results have been published (see Ref. [10]). It has since been upgraded by coupling to an 8 T solenoid, providing greater focusing power and access to a wider range of reaction possibilities, while also freeing the 6.5 T solenoid for dedicated use with radioactive-ion beams (see Ref. [11]).
3 SOLENOGAM
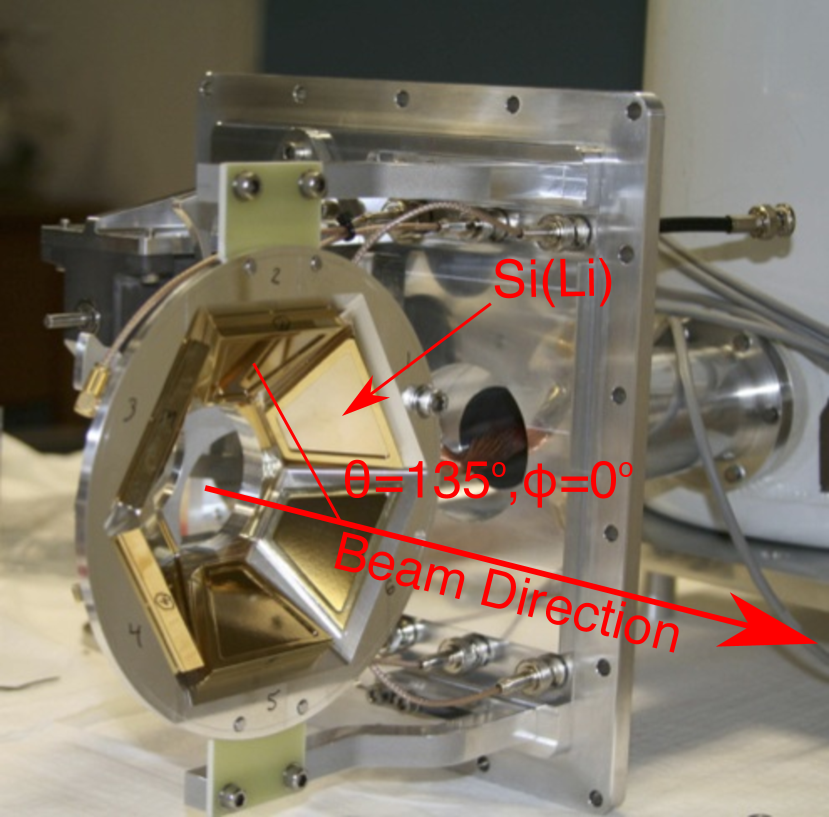
Solenogam is an array of six Si(Li) and up to seven HPGe/LEPS detectors situated at the exit of SOLITAIRE (see Figure 1). Evaporation residues transported by the solenoid are brought to a focus at the centre of the array where they are implanted in a mylar catcher tape and their subsequent decays are observed. The array was designed with a particular goal of assigning transition multipolarities using conversion coefficients. Due to the simultaneous measurement of both rays and conversion electrons, conversion coefficients can be extracted from singles data through a direct comparison of intensities from a -ray and the associated conversion-electron peaks. From - and -e- coincidence data, intensities can be obtained from a common -ray gate in both the - and -e- matrices. This allows complex decay schemes to be resolved through the removal of contaminating lines by careful selection of -ray gates. In both cases, conversion coefficients are obtained from the ratio of the efficiency-corrected intensities.
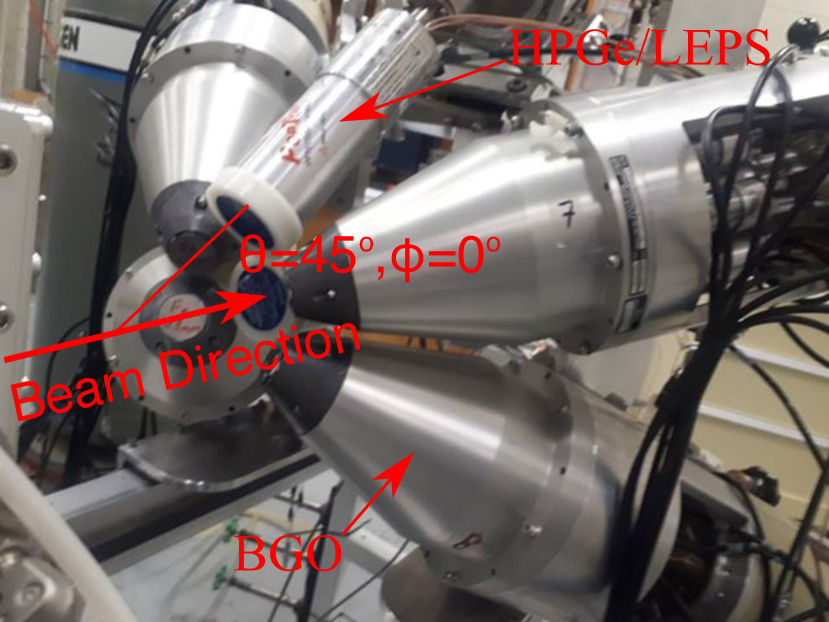
The seven -ray detectors in Solenogam are located downstream of the focal point. One of these detectors is located directly on the beam axis with the remaining six placed at =45∘ to the beam axis with angles of 0∘, 60∘, 120∘, and 180∘ (see Figure 4). The front faces of the HPGe detectors are typically located about 150 mm from the focal point of the array, but are capable of being moved in and out. The detectors can be placed inside BGO shields to provide active Compton suppression. The improvement in spectrum quality from Compton suppression is offset by a loss of statistics, such that the choice of whether or not to use the Compton shields is best made on a case-by-case basis.
The Si(Li) array in Solenogam is located upstream of the catcher tape and consists of six, 2-mm thick Si(Li) detectors. The cross section of each detector is an isosceles trapezoid (see Figure 5) with height, major base, and minor base of 35 mm, 52 mm, and 17.5 mm, respectively, giving a total active area of 1216 mm2 per detector and an angular coverage of 16% of 4 for the full Si(Li) array. The face of each detector is covered by a 200 gold layer. The geometric centres of the Si(Li) detectors are 60 mm from the focal point and located at an angle of =135∘ to the beam axis with angles that mirror the HPGe array (=, , , and ).
Using an open 152Eu source, the energy resolution of the detectors has been measured as 4.5 keV for the 1408-K line, slightly worse than the manufacturer-specified value of 3.5 keV. Further loss of energy resolution can be introduced by electron straggling, caused by the implantation of the evaporation residues into the mylar catcher tape. Both experiment and modelling have been used to evaluate this effect on the energy resolution [12]. The 152Eu source was placed in front of the Si(Li) array and increasingly thick pieces of mylar were placed between the source and detectors to simulate the straggling effects of the catcher tape. These results showed that for an implantation depth of 10 m, the conversion electrons lose 8 keV of energy leaving the tape and the measured resolution of the 1408 keV, K-Line is reduced to 9.5 keV. As this depth can be exceeded for the products of mass-symmetric reactions, an optional degrader foil can be used to slow the evaporation residues before implantation, reducing the implantation depth and therefore the straggling.
Energy and efficiency calibrations can be obtained for both HPGe and Si(Li) arrays using an open 152Eu source placed at the focus of the array. Figure 6 presents the energy-dependent absolute efficiencies for -ray and electron emissions. Considering the potential radius of the beam spot after the solenoid (see Figure 3), a Geant4 [13] simulation of the array was used to determine the effects of a distributed source on the efficiency. The effects were generally found to be small. For a beam spot with radius 3 cm, the efficiency of the Si(Li) array decreased by 5% and there was a negligible effect on the efficiency of the HPGe array. Considering the Simsol calculations predict a beam spot smaller than this, in general the point source efficiencies can be used.

4 Commissioning experiments
A series of experiments was performed to investigate and benchmark the performance of the system. These were conducted at the ANU-HIAF using the 14UD tandem accelerator. The statistical model code PACE2 [14] was used to select reactions and beam energies such that the nucleus of interest was the dominant production channel. This is possible since, for the reactions used, neutron evaporation dominates and the thin targets and low energy loss mean that a particular xn channel is dominant. A summary of these experiments is presented below.
4.1 189Pb
A 32-s isomer in 189Pb was studied using the Solenogam array, with results reported in Ref. [10]. Evaporation residues from the 164Er(29Si,4n)189Pb reaction were transported to the detector array using the 6.5 T solenoid with a 6 T magnetic field and 0.2 Torr of He gas. Gamma-ray and electron singles were measured using one unsuppressed HPGe detector and the full Si(Li) array. The spin and parity of the isomer was confirmed as 31/2- by using conversion coefficients to assign transition multipolarities, in particular the E3 and M2 isomeric decays. This confirmation enabled the isomer’s subsequent interpretation as a shears-mode bandhead [10].
4.2 182W
An offline measurement was made using one suppressed and two unsuppressed HPGe detectors with the full electron array in order to test the ability to extract conversion coefficients from -e- coincidences (see Ref. [15]). Radioactive sources of 182Re were created using the 176Yb(11B,5n) reaction with 60 MeV 11B ions incident on a 1-mg/cm2 enriched target. These sources were placed at the focus of the array and - and -e- coincidence data were collected for approximately four half-lives of the =64 hr, decay into 182W. Conversion coefficients were measured for 21 transitions in the known 182W level scheme [16] by extracting the ratio of intensities in -gated -ray and conversion-electron spectra. In general, good agreement was found with existing literature values from Ref. [16] and with theoretical values calculated using the BrIcc code [17] (see Figure 7). A lack of agreement was seen at low energies and this has been attributed to contamination of the e- spectra by low-energy -rays. Neglecting these two points, the weighted average is 1.03 (9).

With the initial focus on conversion coefficients, limited consideration was given to the effects of -e- angular correlations when designing the Solenogam system. This is a potential problem as these angular correlations could significantly affect the measured intensities in -ray gated spectra due to the high symmetry of the system. As part of this work, the effects of -e- angular correlations in Solenogam were investigated to determine if they would impact the measurement of conversion coefficients in -ray gates and to determine the feasibility of using -e- correlations as a measurement tool. Measured angular correlations were fitted with the formula;
| (2) |
with
| (3) |
where is a scaling constant, and are the directional distribution and orientation parameters for each transition (as defined in Ref. [18]), the coefficients are the solid-angle corrections for each detector [19], is the second order Legendre polynomial, and is the angle between detectors. is related to by the particle parameter, , calculated using a modified version [20] of CATAR [21] and HEX [22],
| (4) |
The Geant4 simulation discussed above in Sect. 3 was used to obtain the coefficients for the array and to study the effects of a distributed source on the angular correlations. A modelled cascade with a fixed value of was emitted from a uniform circular source centred at the focus of the array. The angular correlation observed by the simulated detectors was then compared with the fixed value. Figure 8 shows these results as a function of source radius. Increasing the size of the source had little effect on the - correlations, however, the -e- correlations were significantly attenuated for cm. As the typical size of the ANU 14UD beam spot, and thus the size of the source, is mm, the point source values of (HPGe)=0.98 (1) and (SiLi)=0.86 (2) were used for this offline measurement. However, for on-line measurements, the attenuation from a larger beam spot will need to be considered.
Figure 9 shows the correlations measured for the 229 keV -ray, 100 keV, L electron, cascade in 182W (the L-line was used as the K conversion electron was too low in energy to be detected). Due to the small magnitude of this correlation, the effects on the measured conversion coefficients were small, 1%. Similar results were found for other cascades in the 182W level scheme. For on-line measurements, the magnitude of the correlation will further decrease due to the larger source size (see Figure 8) and hence the magnitude of these effects will be even smaller and can be largely neglected when evaluating conversion coefficients. Furthermore, another consequence is that it is unlikely that -e- angular correlations will be a useful spectroscopic tool for Solenogam, at least with the current detector configuration.


4.3 184,190Pt
Electric monopole (E0) transitions connect states with the same spin and parity and proceed only via internal conversion. They are sensitive to changes in the nuclear shape, making them ideal for the study of shape coexistence (see, for example, the reviews of Heyde and Wood [23], Wood et al. [24], and Garrett [25]). For transitions where , the transition typically proceeds with a mixed M1+E2+E0 character. The conversion coefficient for such a transition is
| (5) |
where are the conversion coefficients for the pure M1 and E2 multipolarities, is the E2/M1 -ray mixing ratio and is the ratio of the E0 and E2 conversion electrons
| (6) |
In the case of a pure E0 transition, the E2 component in is taken from an E2 transition to a nearby state.
In order to fully characterise these mixed M1/E2/E0 transitions, both and need to be determined. Equations of the same form as Equation 5 can be obtained for other electron shells (i.e and ) and this system of equations can be solved if at least two sub-shell conversion coefficients are known. Alternatively, both -ray angular distributions and correlations are independent of (as E0 transitions cannot proceed via -ray emission) and can be used to measure in isolation. A single conversion coefficient can then be used to extract . By simultaneously measuring both rays and conversion electrons, Solenogam should be able to characterise E0 transitions using either of the above methods; however it should be noted that -ray angular distribution measurements cannot be made due to the loss of spin alignment during transit through the solenoid.
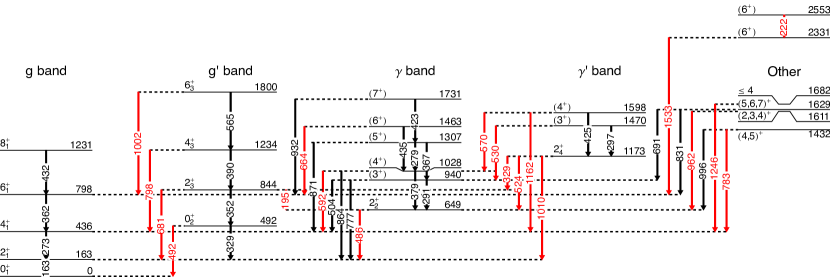
Previous studies have shown the presence of E0 transitions in the platinum isotopes [26], in particular 184Pt where there are two pairs of coexisting bands. The presence of both and bands built upon the spherical and deformed structures (see Figure 10) provides a number of known transitions with which to benchmark the performance of the Solenogam system.
As these were the first on-line coincidence measurements with the Solenogam system, an initial measurement of 190Pt was made. Since 190Pt has a longer half-life (=6.5 years) and no daughter decay products it makes for a simple test case. A 0.7 mg/cm2 176Yb target and a 95 MeV 19F beam were used to produce 190Au, with the subsequent =43 (3) min [27] decay into 190Pt observed. The beam was chopped on a long timescale of 43 min on, 43 min off (43/43 min), with data collected out of beam. Transmission through the solenoid was measured by observing the intensity of known 190Pt rays at the focus of the array throughout one measurement cycle, normalised to the beam current during the irradiation. This was done at a range of magnetic field strengths, resulting in a maximum transmission at 7 T for 0.26 Torr He (see Figure 2). An absolute transmission through SOLTIAIRE is difficult to measure using the Solenogam array. In Ref. [1], accurate transmissions were calculated using position sensitive particle detectors located at the focus of the solenoid and knowledge of the angular distribution of evaporation residues leaving the target. The lack of particle detectors in the Solenogam array meant a similar approach could not be used in the current work. An approximate transmission of 90% was calculated based on the expected -ray intensities from the 190Au decay, the measured efficiency of the Solenogam array, calculated production cross-sections from PACE2, the beam current and duration of the irradiation, and the measured thickness of the target, however, it should be noted that there is significant uncertainty associated with this value.
In the subsequent experiment on 184Pt, the =53 s, decay of 184Au was studied, produced using the 159Tb(30Si,5n)184Au reaction with a 150 MeV 30Si beam of ions chopped at 106/106 s and incident on a 0.8 mg/cm2 target. Transmission through SOLITAIRE was maximised with a 7 T magnetic field for 0.25 Torr of He gas. For both the 190Pt and 184Pt measurements, five HPGe detectors and one LEPS detector were used. The HPGe detectors at =60∘, and 120∘ were placed inside BGO Compton shields. The total projections of rays and electrons from - and - coincidence matrices from the 190Pt and 184Pt measurements are shown in Figures 11 and 14, respectively. Spectra gated by the 163 keV, ray in 184Pt are shown in Figures 14 and 14.
| Nucleus | (keV) | Multipolarity | ||||||
|---|---|---|---|---|---|---|---|---|
| This work | Literature | M1 | E2 | |||||
| 190Pt | 296 | 296 0 | 2+ 0+ | 5.3 (4) | 6.1 (5) | 26.4 | 6.37 | E2 |
| 302 | 598 296 | 2+ 2+ | 5.7 (4) | 5.9 (5) | 25.0 | 6.06 | M1/E2 | |
| 319 | 917 598 | 3+ 2+ | 4.3 (7) | 5.7 (6) | 21.5 | 5.29 | E2 | |
| 323 | 921 598 | 0+ 2+ | 7.1 (3) | 5.0 (6) | 20.6 | 5.09 | E2 | |
| 441 | 737 598 | 4+ 2+ | 2.3 (3) | 2.9 (4) | 8.97 | 2.42 | E2 | |
| 531 | 1128 598 | (4+) 2+ | 1.5 (8) | <2.6 | 5.54 | 1.61 | (E2) | |
| 605 | 1203 598 | 2+ 2+ | 2.3 (4) | 3.4 (5) | 3.91 | 1.21 | M1(/E2) | |
| 616 | 1353 737 | 3- 4+ | 0.5 (1) | 0.44 (8) | 3.75 | 1.16 | E1 | |
| 621 | 917 296 | 3 2+ | 1.0 (2) | 1.6 (2) | 3.68 | 1.15 | M1/E2 | |
| 625 | 921 296 | 0 2+ | 1.1 (2) | 1.08 (2) | 3.62 | 1.13 | E2 | |
| 797 | 1395 598 | 2+ 2+ | 30 (20) | 17 (4) | 1.93 | 0.69 | E0(/M1/E2) | |
| 907 | 1203 296 | 2+ 2+ | 3.8 (5) | 3.8 (5) | 1.39 | 0.53 | E0(/M1/E2) | |
| 1005 | 1602 598 | (1,2)+ 2+ | <0.5 | - | 1.07 | 0.44 | M1/E2 | |
| 1099 | 1395 296 | 2 2+ | 2.1 (5) | 2.7 (5) | 0.85 | 0.37 | E0(/M1/E2) | |
| 184Pt | 195 | 844 649 | 2+ 2+ | 123 (30) | 90 (30) | 82.6 | 18.1 | E0/M1/E2 |
| 222 | 25532331 | (6+) (6+) | 91 (8) | - | 57.6 | 13.1 | E0/M1/E2 | |
| 273 | 436 163 | 4+ 2+ | 9.7 (7) | 9.1 (20) | 32.6 | 7.73 | E2 | |
| 329 | 1173844 | 2 2 | 20 (5) | 19 (5) | 19.5 | 4.86 | M1 | |
| 362 | 798 436 | 6+ 4+ | 5.1 (4) | 4.1 (7) | 15.2 | 3.86 | E2 | |
| 435 | 14631028 | (6)+ (4)+ | 14 (3) | - | 9.36 | 2.52 | - | |
| 486 | 649 163 | 2+ 2+ | 5.7 (6) | 5.1 (6) | 6.95 | 1.95 | M1/E2 | |
| 504 | 940 436 | (3)+ 4+ | 5 (1) | - | 6.35 | 1.80 | - | |
| 524 | 1173649 | 2+ 2+ | 37 (24) | 36 (4) | 5.68 | 1.64 | E0/M1/E2 | |
| 530 | 1470940 | 3+ 3+ | 20 (13) | >40 | 5.54 | 1.61 | E0/M1/E2 | |
| 570 | 15981028 | 4+ 4+ | - | 7.8 (16) | 4.58 | 1.37 | E0/M1/E2 | |
| 592 | 1028436 | (4)+ 4+ | 1.0 (4) | 2.2(3) | 4.15 | 1.26 | M1/E2 | |
| 664 | 1463798 | (6)+ 6+ | 1.3 (3) | 1.26(14) | 3.09 | 1.00 | M1/E2 | |
| 681 | 844 163 | 2+ 2+ | 30 (6) | 30(3) | 2.89 | 0.95 | E0/M1/E2 | |
| 777 | 940 163 | (3)+ 2+ | 0.85 (3) | 1.1(2) | 2.06 | 0.72 | (M1/)E2 | |
| 798 | 1234436 | 4+ 4+ | 4.4 (9) | 4.5(6) | 1.93 | 0.69 | E0/M1/E2 | |
| 831 | 1629798 | (5,6,7)+ 6+ | 3.2 (6) | 1.5(4) | 1.74 | 0.63 | M1 | |
| 871 | 1307436 | (5)+ 4+ | 1.1 (3) | 0.66(16) | 1.54 | 0.58 | M1/E2 | |
| 996 | 1432436 | 4+ 4+ | - | <1.4 | 1.10 | 0.45 | M1/E2 | |
| 1002 | 1800798 | 6+ 6+ | - | 1.1 (4) | 1.08 | 0.44 | M1/E2 | |
| 1010 | 1173163 | 2+ 2+ | - | 1.2 (4) | 1.06 | 0.43 | M1 | |
| 1162 | 1598436 | 4+ 4+ | - | 0.6 | 0.74 | 0.33 | D+Q | |


Internal conversion coefficients were extracted from coincidence data for 14 transitions in 190Pt and 17 in 184Pt (see Table 1). In both cases, good agreement and a similar level of precision was found when compared with the existing literature [26, 27]. The measured conversion coefficients for many transitions were consistent with theoretical values from BrIcc [17] (see Table 1 and Figure 15), however, a number of transitions were found to have an E0 component, as indicated by a conversion coefficient significantly greater than the value. Attempts to measure both the M1/E2 and E2/E0 mixing ratios for these transitions were unsuccessful, as described below.
Attempts to measure both and using conversion coefficients from different electron shells were unsuccessful due to poor electron resolution and statistics. Figure 14 shows the ray and conversion electrons from the 681 keV transition in 184Pt, in spectra that are both gated by the 163 keV, transition. While the K conversion-electron line can be clearly resolved, the corresponding L and M lines are at the level of the background. The other transitions in the nucleus had weaker conversion lines than the 681 keV transition and faced the same problem.
Attempts to measure - angular correlations were similarly unsuccessful. Figure 16 shows the observed correlations for the 486-163 keV, cascade along with the theoretical correlations for an M1/E2 transition with and . It is clear from the location of the experimental points that the angular separations between detectors in the present array are not sufficient to resolve such ambiguity in the M1/E2 mixing ratio.
Without resolving these problems, the Solenogam system, on its own, is unable to collect sufficient spectroscopic data to extract the and values for these mixed M1/E2/E0 transitions. However, with knowledge of the M1/E2 mixing ratio from another source, the value can be extracted using the measured value.
Table 2 contains a summary of the E0 transitions in 184Pt measured in the current work. For the transitions where the E2/M1 mixing ratio is known, coefficients have been calculated using Equation 5 and the weighted average of conversion coefficients from both the current work and Xu et al. [26]. Where the mixing ratio was not known, limits on have been placed by assuming either a pure M1 (=0) or pure E2 () transition. The agreement between the conversion coefficients measured in the current work and those from Ref. [26], coupled with the lack of new mixing ratios measured in the current work, means the coefficients in Table 2 are largely unchanged from existing values [26] and are still consistent with the interpretation of the 184Pt level scheme as two pairs of coexisting bands.

| (keV) | (E2/M1) | (E0/E2) | ||||
|---|---|---|---|---|---|---|
| expt | M1 | E2 | ||||
| 492 | 0 0 | - | - | - | - | 8.9 (9)a |
| 486 | 2 2 | 5.4 (4) | 6.95 | 1.95 | +0.49 (7) | 0 |
| 681 | 2 2 | 30 (3) | 2.89 | 0.95 | -1.2 | 50 |
| 195 | 2 2 | 110 (20) | 82.6 | 18.1 | - | >5 |
| 1010 | 2 2 | 1.2 (4) | 1.06 | 0.43 | - | >1.8 |
| 524 | 2 2 | 37 (4) | 5.68 | 1.64 | - | >21 |
| 329 | 2 2 | 19 (5) | 19.6 | 4.86 | - | <2.9 |
| 530 | 3 3 | 20 (8) | 5.68 | 1.61 | - | >11 |
| 592 | 4 4 | 1.4 (2) | 4.15 | 1.26 | -2.25 | <0.11 |
| 798 | 4 4 | 4.5 (5) | 1.93 | 0.69 | +1.1 (3) | 9 (2) |
| 996 | 4 4 | <1.4 | 1.10 | 0.45 | - | - |
| 570 | 4 4 | 7.8 (16) | 4.58 | 1.37 | - | >4.7 |
| 1162 | 4 4 | 0.6 | 0.74 | 0.33 | -1.62 | <0.8 |
| 664 | 6 6 | 1.3 (1) | 3.09 | 1.00 | -1.01 | 0 |
| 1002 | 6 6 | 1.1 (4) | 1.08 | 0.44 | +1.08 | 1.5 (1.7) |
-
a
From comparison with the transition (see text).
5 Conclusions and future work
Solenogam is an array of HPGe and Si(Li) detectors located at the focus of the SOLITAIRE recoil separator. It was designed to study the decay of long-lived nuclear states, with a particular focus on extracting conversion coefficients. Through a series of commissioning experiments, the system has demonstrated its ability to isolate long-lived states in a low-background environment and extract conversion coefficients using singles and coincidence spectra of both rays and conversion electrons. Attempts were made to study E0 transitions and extract both the E2/M1 and E0/E2 mixing ratios from conversion coefficients and/or angular correlations. This was unsuccessful due to the difficulty of the e- measurements (electron statistics and energy resolution) and the limited sensitivity for -ray angular correlations. In order to address these issues and improve the array in general, a number of upgrades are being discussed. These include:
-
1.
Replacing the Si(Li) array with a larger number of smaller crystals. The reduced surface area of the crystals leads to better energy resolution due to the decreased capacitance of the detectors [31];
-
2.
Changing the angular placement of the HPGe detectors to increase the sensitivity to angular correlation effects;
-
3.
Adding a position-sensitive detector upstream of the Si(Li) array to image the evaporation residues. This will decrease the experimental setup time required to find the optimal field strength that focuses the evaporation residues, while also allowing monitoring of the beam spot during experiments; and
-
4.
Installing a moving tape system to decrease the system background by enabling the removal of long-lived contaminants from within the detector array.
The data acquisition system at the ANU-HIAF has also been recently upgraded to a digital system using XIA Pixie-16 digitisers [32] that can handle much higher data rates than the analogue system. This allows the collection of greater statistics and provides more flexibility in offline analysis.
A more recent focus of the SOLENOGAM system has been the study of nuclear isomers in other regions of the nuclear chart. Measurements of the high-spin isomer in 145Sm have been performed to better understand the systematic appearance of an isomeric, 49/2+ state in the N=83 isotones [33]. Analysis of these data is ongoing, however the measurement of - and -e- coincidences has already proven crucial to understanding the level scheme. Further experiments on other isomers are also planned.
Acknowledgements
The authors are grateful to the academic and technical staff of the Department of Nuclear Physics (Australian National University) and the Heavy Ion Accelerator Facility for their continued support. This research was supported by the Australian Research Council through grant numbers FT100100991, DP120101417, DP14102986, and DP140103317. M.S.M.G., A.A., B.J.C., J.T.H.D., T.J.G., B.Q.L., and T.P. acknowledge the support of the Australian Government Research Training Program. Support for the ANU Heavy Ion Accelerator Facility operations through the Australian National Collaborative Research Infrastructure Strategy (NCRIS) program is acknowledged.
References
- [1] M. D. Rodríguez, M. L. Brown, M. Dasgupta, D. J. Hinde, D. C. Weisser, T. Kibédi, M. A. Lane, P. J. Cherry, A. G. Muirhead, R. B. Turkentine, N. Lobanov, A. K. Cooper, A. B. Harding, M. Blacksell, P. M. Davidson, SOLITAIRE: A new generation solenoidal fusion product separator, Nucl. Instruments Methods Phys. Res. A 614 (1) (2010) 119–129. doi:10.1016/j.nima.2009.12.039.
- [2] C. N. Davids, B. B. Back, K. Bindra, D. J. Henderson, W. Kutschera, T. Lauritsen, Y. Nagame, P. Sugathan, A. V. Ramayya, W. B. Walters, Startup of the Fragment Mass Analyzer at ATLAS, Nucl. Inststruments Methods Phys. Res. B 70 (1-4) (1992) 358–365. doi:10.1016/0168-583X(92)95951-M.
- [3] M. Leino, J. Äystö, T. Enqvist, P. Heikkinen, A. Jokinen, M. Nurmia, A. Ostrowski, W. H. Trzaska, J. Uusitalo, K. Eskola, P. Armbruster, V. Ninov, Gas-filled recoil separator for studies of heavy elements (1995). doi:10.1016/0168-583X(94)00573-7.
- [4] T. Kibédi, G. D. Dracoulis, A. P. Byrne, Lens-mode operation of a superconducting electron spectrometer in (HI, xn) reactions, Nucl. Inststruments Methods Phys. Res. A 294 (3) (1990) 523–533. doi:10.1016/0168-9002(90)90294-G.
- [5] H. D. Betz, Charge states and charge-changing cross sections of fast heavy ions penetrating through gaseous and solid media, Rev. Mod. Phys. 44 (3) (1972) 465–539. doi:10.1103/RevModPhys.44.465.
- [6] M. L. Brown, Simulation of a gas-filled solenoid: Optimizing functionality and expanding applicability, Masters thesis (2011).
- [7] J. F. Ziegler, M. D. Ziegler, J. P. Biersack, SRIM - The stopping and range of ions in matter, Nucl. Instruments Methods Phys. Res. B 268 (11-12) (2010) 1818–1823. doi:10.1016/j.nimb.2010.02.091.
- [8] Y. T. Oganessian, Y. V. Lobanov, A. G. Popeko, F. S. Abdullin, Y. P. Kharitonov, A. A. Ledovskoy, Y. S. Tsyganov, The average equilibrium charge-states of heavy ions with Z > 60 stripped in He and H2, Zeitschrift für Phys. D 21 (1991) 357–358. doi:10.1007/BF01426353.
- [9] V. S. Nikolaev, I. S. Dmitriev, On the equilibrium charge distribution in heavy element ion beams, Phys. Lett. A 28 (4) (1968) 277–278. doi:10.1016/0375-9601(68)90282-X.
- [10] G. D. Dracoulis, G. J. Lane, T. Kibédi, P. Nieminen, Characterization of the 32 s isomer in 189Pb as a shears-mode bandhead, Phys. Rev. C 79 (3) (2009) 1–5. doi:10.1103/PhysRevC.79.031302.
- [11] R. Rafiei, D. J. Hinde, M. Dasgupta, D. C. Weisser, A. G. Muirhead, A. B. Harding, A. K. Cooper, H. J. Wallace, N. R. Lobanov, A. Wakhle, M. L. Brown, C. J. Lin, A. J. Horsley, R. Du Rietz, D. H. Luong, M. Evers, SOLEROO: A solenoidal exotic rare isotope separator at the Australian National University, Nucl. Instruments Methods Phys. Res. A 631 (1) (2011) 12–21. doi:10.1016/j.nima.2010.12.103.
- [12] L. Whichello, Investigation of straggling effects on the electron resolution of the Solenogam spectrometer, Tech. rep., Australian National University (2014).
- [13] S. Agostinelli, J. Allison, K. Amako, J. Apostolakis, H. Araujo, P. Arce, M. Asai, D. Axen, S. Banerjee, G. Barrand, F. Behner, L. Bellagamba, J. Boudreau, L. Broglia, A. Brunengo, H. Burkhardt, S. Chauvie, J. Chuma, R. Chytracek, G. Cooperman, G. Cosmo, P. Degtyarenko, A. Dell’Acqua, G. Depaola, D. Dietrich, R. Enami, A. Feliciello, C. Ferguson, H. Fesefeldt, G. Folger, F. Foppiano, A. Forti, S. Garelli, S. Giani, R. Giannitrapani, D. Gibin, J. J. Gómez Cadenas, I. González, G. Gracia Abril, G. Greeniaus, W. Greiner, V. Grichine, A. Grossheim, S. Guatelli, P. Gumplinger, R. Hamatsu, K. Hashimoto, H. Hasui, A. Heikkinen, A. Howard, V. Ivanchenko, A. Johnson, F. W. Jones, J. Kallenbach, N. Kanaya, M. Kawabata, Y. Kawabata, M. Kawaguti, S. Kelner, P. Kent, A. Kimura, T. Kodama, R. Kokoulin, M. Kossov, H. Kurashige, E. Lamanna, T. Lampén, V. Lara, V. Lefebure, F. Lei, M. Liendl, W. Lockman, F. Longo, S. Magni, M. Maire, E. Medernach, K. Minamimoto, P. de Freitas, Y. Morita, K. Murakami, M. Nagamatu, R. Nartallo, P. Nieminen, T. Nishimura, K. Ohtsubo, M. Okamura, S. O’Neale, Y. Oohata, K. Paech, J. Perl, A. Pfeiffer, M. G. Pia, F. Ranjard, A. Rybin, S. Sadilov, E. Di Salvo, G. Santin, T. Sasaki, N. Savvas, Y. Sawada, S. Scherer, S. Sei, V. Sirotenko, D. Smith, N. Starkov, H. Stoecker, J. Sulkimo, M. Takahata, S. Tanaka, E. Tcherniaev, E. Safai Tehrani, M. Tropeano, P. Truscott, H. Uno, L. Urban, P. Urban, M. Verderi, A. Walkden, W. Wander, H. Weber, J. P. Wellisch, T. Wenaus, D. C. Williams, D. Wright, T. Yamada, H. Yoshida, D. Zschiesche, Geant4 - a simulation toolkit, Nucl. Instruments Methods Phys. Res. A 506 (3) (2003) 250–303. arXiv:1005.0727v1, doi:10.1016/S0168-9002(03)01368-8.
- [14] A. Gavron, Statistical model calculations in heavy ion reactions, Phys. Rev. C 21 (1) (1980) 230–236. doi:10.1103/PhysRevC.21.230.
- [15] M. S. M. Gerathy, M. W. Reed, G. J. Lane, T. Kibédi, S. S. Hota, A. E. Stuchbery, Decay spectroscopy with Solenogam at the ANU Heavy ion Accelerator Facility, EPJ Web Conf. 123. doi:10.1051/epjconf/201612304007.
- [16] B. Singh, Nuclear Data Sheets for A = 182, Nucl. Data Sheets 130 (2015) 21–126. doi:10.1016/j.nds.2015.11.002.
- [17] T. Kibédi, T. W. Burrows, M. B. Trzhaskovskaya, P. M. Davidson, C. W. Nestor, Evaluation of theoretical conversion coefficients using BrIcc, Nucl. Instruments Methods Phys. Res. A 589 (2) (2008) 202–229. doi:10.1016/j.nima.2008.02.051.
- [18] R. M. Steffen, K. Alder, Angular distribution and correlation of gamma rays, in: W. Hamilton (Ed.), Electromagn. Interact. Nucl. Phys., North-Holland Publishing Company, North-Holland, 1975, pp. 505–583. doi:10.1016/0550-306x(67)80009-0.
- [19] M. E. Rose, The analysis of angular correlation and angular distribution data, Phys. Rev. 91 (3) (1953) 610–615. doi:10.1103/PhysRev.91.610.
- [20] J. T. H. Dowie, T. Kibédi, T. K. Eriksen, A. E. Stuchbery, Table of electronic factors for E0 electron and electron–positron pair conversion transitions, At. Data Nucl. Data Tables 131 (2020) 101283. doi:10.1016/j.adt.2019.06.002.
- [21] H. C. Pauli, U. Raff, A computer program for internal conversion coefficients and particle parameters, Comput. Phys. Commun. 9 (6) (1975) 392–407. doi:10.1016/0010-4655(75)90019-3.
- [22] D. A. Liberman, D. T. Cromer, J. T. Waber, Relativistic self-consistent field program for atoms and ions, Comput. Phys. Commun. 2 (2) (1971) 107–113. doi:10.1016/0010-4655(71)90020-8.
- [23] K. Heyde, J. L. Wood, Shape coexistence in atomic nuclei, Rev. Mod. Phys. 83 (4) (2011) 1467–1521. doi:10.1103/RevModPhys.83.1467.
- [24] J. L. Wood, K. Heyde, W. Nazarewicz, M. Huyse, P. van Duppen, Coexistence in even-mass nuclei, Phys. Rep. 215 (3-4) (1992) 101–201. doi:10.1016/0370-1573(92)90095-H.
- [25] P. E. Garrett, Shape coexistence at low spin in the Z = 50 region and its spectroscopic signatures, J. Phys. G 43 (8). doi:10.1088/0954-3899/43/8/084002.
- [26] Y. Xu, K. S. Krane, M. A. Gummin, M. M. Jarrio, J. L. Wood, E. F. Zganjar, H. K. Carter, Shape coexistence and electric monopole transitions in 184Pt, Phys. Rev. Lett. 68 (26) (1992) 3853–3856. doi:10.1103/PhysRevLett.68.3853.
- [27] A. Johansson, B. Nyman, The decay of 190Au, Phys. Scr. 8 (3) (1973) 99–108. doi:10.1088/0031-8949/8/3/005.
- [28] C. M. Baglin, Nuclear Data Sheets for A = 184, Nucl. Data Sheets 111 (2) (2010) 275–523. doi:10.1016/j.nds.2010.01.001.
- [29] B. Singh, Nuclear Data Sheets for A = 190, Nucl. Data Sheets 99 (2) (2003) 275–481. doi:10.1006/ndsh.2003.0009.
- [30] Y. Xu, K. S. Krane, M. A. Gummin, J. L. Wood, M. M. Jarrio, J. B. Breitenbach, E. F. Zganjar, D. Rupnik, H. K. Carter, P. F. Mantica, B. E. Zimmerman, On-line nuclear orientation study of 184Au, Hyperfine Interact. 75 (1-4) (1992) 481–487. doi:10.1007/BF02399005.
- [31] G. F. Knoll, Radiation detection and measurement, John Wiley & Sons, 2000.
- [32] XIA, Pixie-16 | XIA LLC (2018).
- [33] A. Odahara, Y. Gono, S. Mitarai, T. Morikawa, T. Shizuma, M. Kidera, M. Shibata, T. Kishida, E. Ideguchi, K. Morita, A. Yoshida, H. Kumagai, Y. H. Zhang, A. Ferragut, T. Murakami, M. Oshima, H. Iimura, S. Hamada, H. Kusakari, M. Sugawara, M. Ogawa, M. Nakajima, B. J. Min, J. C. Kim, S. J. Chae, H. Sagawa, High-spin isomer and level structure of 145Sm, Nucl. Phys. A 620 (3) (1997) 363–384. doi:10.1016/S0375-9474(97)00189-9.