Electronic Structure Studies of FeSi: A Chiral Topological System
Abstract
Most recent observation of topological Fermi arcs on the surface of manyfold degenerate B20 systems, CoSi and RhSi, have attracted enormous research interests. Although an another isostructural system, FeSi, has been predicted to show bulk chiral fermions, it is yet to be clear theoretically and as well experimentally that whether FeSi possesses the topological surface Fermi arcs associated with the exotic chiral fermions in vicinity of the Fermi level. In this contribution, using angle-resolved photoemission spectroscopy (ARPES) and density functional theory (DFT), we present the low-energy electronic structure of FeSi. We further report the surface state calculations to provide insights into the surface band structure of FeSi near the Fermi level. Unlike in CoSi or RhSi, FeSi has no topological Fermi arcs near the Fermi level as confirmed both from ARPES and surface state calculations. Further, the ARPES data show spin-orbit coupling (SOC) band splitting of 40 meV, which is in good agreement with bulk band structure calculations. We noticed an anomalous temperature dependent resistivity in FeSi which can be understood through the electron-phonon interactions as we find a Debye energy of 80 meV from the ARPES data.
Since the discovery of linear dispersive Dirac fermions in graphene Novoselov et al. (2005); Castro Neto et al. (2009), the condensed matter has become fertile grounds for the investigation of various exotic topological fermions. Especially, the experimental realization of three-dimensional topological insulators Hasan and Kane (2010) further boosted the field to new heights, from basic sciences Zhang et al. (2011); Virot et al. (2011); Yan et al. (2012); Young et al. (2012); Wang et al. (2012, 2013); Borisenko et al. (2014); Neupane et al. (2014); Liu et al. (2014); Huang et al. (2015); Zhang et al. (2015); Ghimire et al. (2015); Shekhar et al. (2015); Xu et al. (2016); Tamai et al. (2016); Deng et al. (2016); Huang et al. (2016); Liang et al. (2016); Wang et al. (2016a); Jiang et al. (2017); Thirupathaiah et al. (2017a, b, 2018) to more complex technological designs for the futuristic topological quantum computations (TQC) Nayak et al. (2008); Lutchyn et al. (2010); Mourik et al. (2012); Stern and Lindner (2013); Stanescu (2016). At present, the topological quantum materials are classified by the Weyl fermions Huang et al. (2015); Zhang et al. (2015); Ghimire et al. (2015); Shekhar et al. (2015); Xu et al. (2016); Tamai et al. (2016); Deng et al. (2016); Huang et al. (2016); Liang et al. (2016); Wang et al. (2016a); Jiang et al. (2017); Haubold et al. (2017); Thirupathaiah et al. (2017a, b), the Dirac fermions Young et al. (2012); Wang et al. (2012, 2013); Borisenko et al. (2014); Neupane et al. (2014); Liu et al. (2014); Thirupathaiah et al. (2018), and the Majorana fermions Sato and Fujimoto (2009); Stanescu (2016). In general, at the band crossing point (BCP), the Weyl fermions have twofold degeneracy and the Dirac fermions have fourfold degeneracy. Recently, a new type of quantum materials have emerged with manyfold degenerate fermions at the band crossing point Bradlyn et al. (2016); Tang et al. (2017); Chang et al. (2017); Pshenay-Severin and Burkov (2019); Rao et al. (2019); Takane et al. (2019). These manyfold degenerate fermions are manifestations of the certain space-group symmetries in presence of the time-reversal invariance Bradlyn et al. (2016). Among them, the topological chiral systems like the transition-metal mono-silicides MSi (M = Co, Mn, Fe, Rh) have been at the recent intense research focus as under certain conditions, these systems are predicted to show spin-1/2 Weyl fermions with a topological charge of 1 Bradlyn et al. (2016); Chang et al. (2017); Tang et al. (2017); Shekhar (2018); Takane et al. (2019); Sanchez et al. (2019); Yang et al. (2019); Schröter et al. (2019); Rao et al. (2019), spin-1 excitations with a topological charge of 2 Fang et al. (2012), and spin-3/2 Rarita-Schwinger-Weyl (RSW) fermions with topological charges of Rarita and Schwinger (1941). Moreover, the surface Fermi arcs connecting the manyfold degenerate BCPs are much longer in these systems compared to the other known Weyl and Dirac semimetals Lv et al. (2015); Sun et al. (2015a); Xu et al. (2015); Deng et al. (2016).
Earlier the transition metal monosilicides were extensively studied for their low-energy electronic correlations Fu et al. (1994); Park et al. (1995); Arko et al. (1997); Chernikov et al. (1997); Ishizaka et al. (2005); Klein et al. (2008); Arita et al. (2008); Zhao et al. (2009); Petrova et al. (2010); Sales et al. (2011); Dutta and Pandey (2018). Specifically, FeSi shows peculiar temperature dependent electronic and magnetic properties. It is an antiferromagnetic metal above 500 K, while a nonmagnetic narrow band gap insulator at low temperatures Schlesinger et al. (1993); Jaccarino et al. (1967); Schlesinger et al. (1997); Takahashi (1998); Fang et al. (2018). Further, FeSi behaves as a semiconductor with an indirect band gap of 50 meV within the temperature range of 100-200 K Schlesinger et al. (1993); Petrova et al. (2010), while is a bad metal outside of this temperature range. Different mechanisms were proposed to explain this strange electronic and magnetic behaviour, (a) electron-phonon interactions Delaire et al. (2011); Sales et al. (2011), (b) spin fluctuations Evangelou and Edwards (1983); Takahashi (1997), and c) charge excitations Tomczak et al. (2012). Apart from these interesting physical properties, FeSi is further predicted to show the above-mentioned manyfold degenerate chiral fermions at the high symmetry points with a nonzero Berry phase Kübler et al. (2013). Further, a recent transport study on FeSi show anomalous temperature dependent resistivity which they attribute it to the plausible topological surface states Fang et al. (2018).
Motivated by the presence of surface Fermi arcs in RhSi and CoSi, we studied the low-energy electronic structure of isostructural FeSi using angle-resolved photoemission spectroscopy and density functional theory to show that despite FeSi is being chiral topological system, associated surface Fermi arcs connecting the manyfold degenerate bulk BCPs are absent near the Fermi level. These observations are further confirmed by our surface state calculations. The ARPES data clearly show a spin-orbit coupling band splitting of 40 meV, consistent with the theoretical calculations which predict a SOC split of 39.5 meV. We further noticed anomalous temperature dependent resistivity in FeSi, that means, FeSi is a semiconductor respecting the activation energy formula only within the temperature range of 75-143 K and eventually becoming a bad metal as moving away from the this temperature range. The spectral function analysis of ARPES data suggest an electron-phonon interaction at a Debye energy of 80 meV, while the spectral widths near the Fermi level changes merely by the thermal excitations within the range of 15-80 K.
Single crystals were grown using floating zone method Mason (1979). As grown single crystals were characterized using X-ray diffractometer (XRD) and energy dispersive X-ray analysis (EDAX). These characterization techniques confirm the stoichiometric composition of FeSi and the space group of P213 (198) Damascelli et al. (1997); Petrova et al. (2010).
Resistivity measurements were carried out on a closed cycle refrigerator (CCR) based cryostat of CRYOMECH. Four copper (Cu) leads were connected to the sample by vacuum compatible silver epoxy (Epo-Tek H27D) in Van der Pauw method. The sample temperature was varied between 4 and 320 K during the measurements.
ARPES measurements were carried out at 13-ARPES end station equipped with VG-Scienta R4000 electron analyzer in BESSY II (Helmholtz zentrum Berlin) synchrotron radiation center Borisenko (2012); Borisenko et al. (2012). The angular resolution was set at for R4000. Photon energies for the measurements were varied between 30 and 110 eV. The energy resolution was set between 10 and 15 meV depending on the excitation energy. Data were recorded at a chamber vacuum of the order of 1 10-10 mbar and the sample temperature was kept at 1 K during the measurements. We employed various photon polarizations in order to extract the electronic structure comprehensively. Another set of ARPES measurements were performed in Swiss Light Source (SLS) at the SIS beamline using a VG-Scienta R4000 electron analyzer. Photon energy was varied between between 20 and 120 eV. Overall energy resolution was set between 15 and 25 meV depending on the photon energy. Samples were cleaved in situ at a sample temperature of 15 K and the chamber vacuum was better than mbar during the measurements. At SIS beamline, the data were recorded by varying the sample temperature between 15 and 80 K.
Band structure calculations were performed on the noncentrosymmetric cubic B20 crystal structure of FeSi Brown (1966), having the lattice parameters of = = = 4.484 Å, using density functional theory (DFT) within the generalized gradient approximation (GGA) of Perdew, Burke and Ernzerhof (PBE) exchange and correlation potential Perdew et al. (1996) as implemented in the Quantum Espresso simulation package Giannozzi et al. (2009). Ultra-soft non-relativistic and fully relativistic pseudopotentials were used to perform the calculations without spin-orbit coupling (SOC) and with SOC, respectively. The electronic wavefunction is expanded using plane waves up to a cutoff energy of 40 Ry (545 eV). Brillouin zone sampling is done over a 202020 Monkhorst-Pack -grid. The internal coordinates of the system are relaxed before producing the band structure.
For the surface state calculations, the tight-binding model was derived by computing the maximally-localized Wannier functions, choosing Fe and Si orbitals as the basis using the Wannier90 code Mostofi et al. (2008). We then employed WannierTools package Wu et al. (2018) for analysis of surface and topological properties. Spin-orbit coupling was included for the surface calculations.
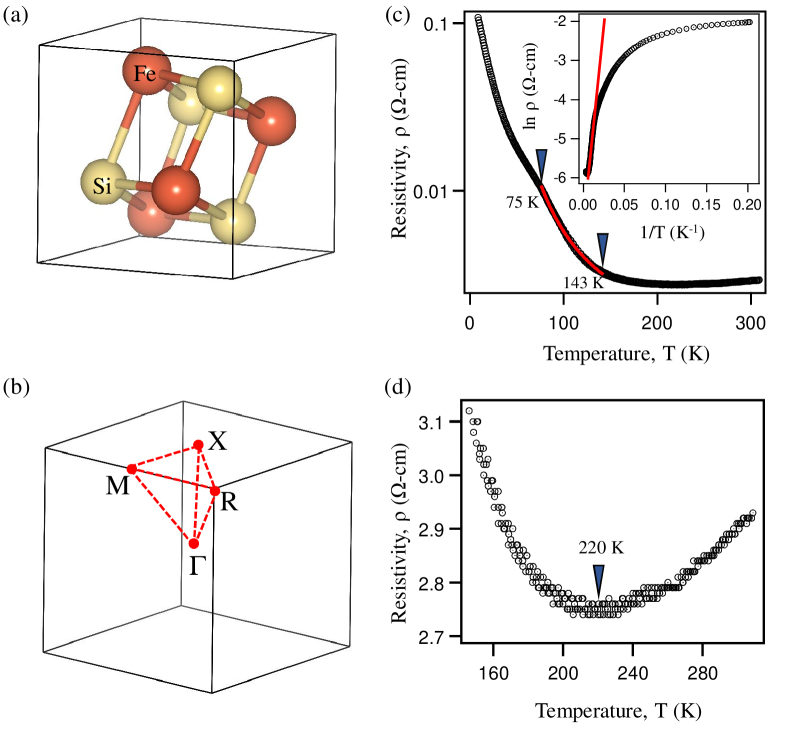
Resistivity of FeSi as a function of temperature is shown in Figure 1. As can be seen from Figs. 1(c) and 1(d), the resistivity of FeSi decreases with increasing temperature up to 220 K, like a semiconductor. However, from a close observation we realise that FeSi is semiconductor only within the temperature range of 75-143 K as it can be properly fitted by the activation formula, , where is the band gap. By fitting the resistivity data, as shown by the red line in the inset of Fig. 1(c), we estimate a semiconducting band gap of =35 meV within this temperature range. The derived gap is in good agrement with previous report Fu et al. (1994). Further, we noticed a kink in the resistivity curve at around T = 75 K, below which decreases with the temperature. Similarly, we find that decreases with increasing temperature between 143 K and 220 K. And beyond 220 K, the resistivity increases with temperature. This peculiar resistivity character below 75 K and above 143 K can be attributed to bad metalicity of FeSi Petrova et al. (2010); Fang et al. (2018). Thus, our resistivity measurements suggest that FeSi is a semiconductor following the activation formula within the temperature range of 75-143 K and gradually becomes a bad metal as we go away from this temperature range. These results are qualitatively in agreement with the existing reports, although the semiconducting temperature range is found to be different from different studies Samuely et al. (1996); Buschinger et al. (1997); Paschen et al. (1997); Fäth et al. (1998); Sales et al. (2011); Fang et al. (2018).
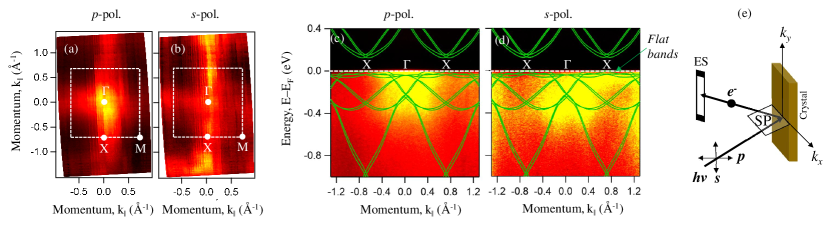
Next, ARPES data of FeSi is shown in Figure 2 recorded at a sample temperature of 1 K. Fermi surface maps in the plane are shown in Figs. 2 (a) and 2(b) measured using -polarized light with photon energies of 130 eV and 90 eV, respectively. Consistent with the crystal structure, the in-plane Fermi surface (FS) maps show the square symmetry. From the FS maps, we identify a blob-like spectral intensity with fourfold symmetry at the point. On the other hand, we did not observe any clear spectral intensity either at or point when measured using -polarized light. To further elucidate the nature of band dispersions, we show energy distribution maps (EDMs) along the high symmetry lines and as shown in Figs. 2 (c) and 2(d), respectively, measured using -polarized light. DFT bulk band structure including spin-orbit coupling along the respective high symmetry lines is overlapped on to the EDMs. As can be seen from Figs. 2(c) and 2(d), there is a good agreement between ARPES data and DFT calculations. Note here that the Fermi level of DFT calculations is shifted approximately 100 meV towards the higher binding energy to match with the experimental Fermi level. Band structure from the DFT calculations without SOC and with SOC in the path are shown in Figs. 2(e) and 2(f), respectively. Further, using -polarized light we could detect flat bands along the high symmetry line (see Fig. 1 in supplementary information) which is in agreement with the DFT calculations. Thus, there is a finite spectral intensity at point that is clearly visible with the -polarized light. This suggests that the band structure of FeSi near the Fermi level is composed by the multiple orbital characters. More details on the polarization dependent matrix elements can be found at Ref. Thirupathaiah et al., 2010. Importantly, in Fig. 2, we did not observe any spectral intensity related to the surface Fermi arcs. Overall, the ARPES data shown in Fig. 2 supports the bad metallic picture of FeSi at low temperatures as observed from our resistivity measurements. Worth to mention here that, in Fig. 2, for an easy representation, we did not take into account the effects while assigning the high symmetry points on the Fermi surface maps and EDMs.
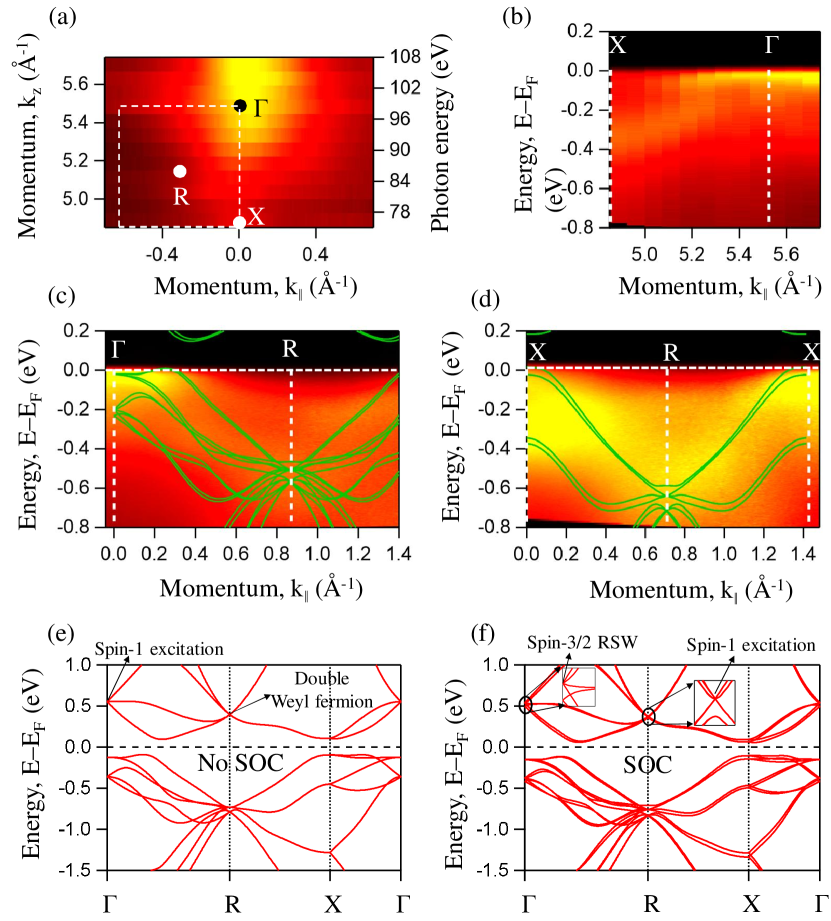
Photon energy dependent ARPES data are shown in Figure 3. Fig. 3 (a) shows Fermi surface map measured with the photon energies ranging from 75 eV to 108 eV with a step of 3 eV using -polarized light. The high symmetry points , and are denoted on the Fermi surface map following the equation, with an inner potential of 16 eV. From the Fermi surface map we realize that the photon energy of 1003 eV detects the bands from the point and photon energy of 753 eV detects the bands from the point. Similarly, the high symmetry point is accessible with a photon energy of 863 eV when the sample surface is normal to the axis. Energy distribution maps along , and are shown in Figs. 3(b), (c), and (d), respectively. The band structure extracted along the in-plane ([100]) as shown in Fig. 3(b), is in good agreement with the band structure extracted along the out-of-plane ([001]) as shown in Fig. 2(d). The band structure derived from DFT calculations with SOC along and is overlapped on the experimental band structure as shown in Figs. 3(c) and (d), and there is a good agreement between DFT calculations and ARPES data. The calculated bulk band structure without SOC and with SOC in the -path are shown in Figs. 3(e) and (f), respectively. As predicted from the DFT calculations without SOC, in FeSi the triple-point spin-1 excitations with topological charge of 2 are at the point and double Weyl fermions with topological charge of 2 are at the point. On the other hand, DFT with SOC, the triple-point spin-1 excitations are predicted at the point while the spin-3/2 Rarita-Schwinger-Weyl fermions are predicted at the point Tang et al. (2017).
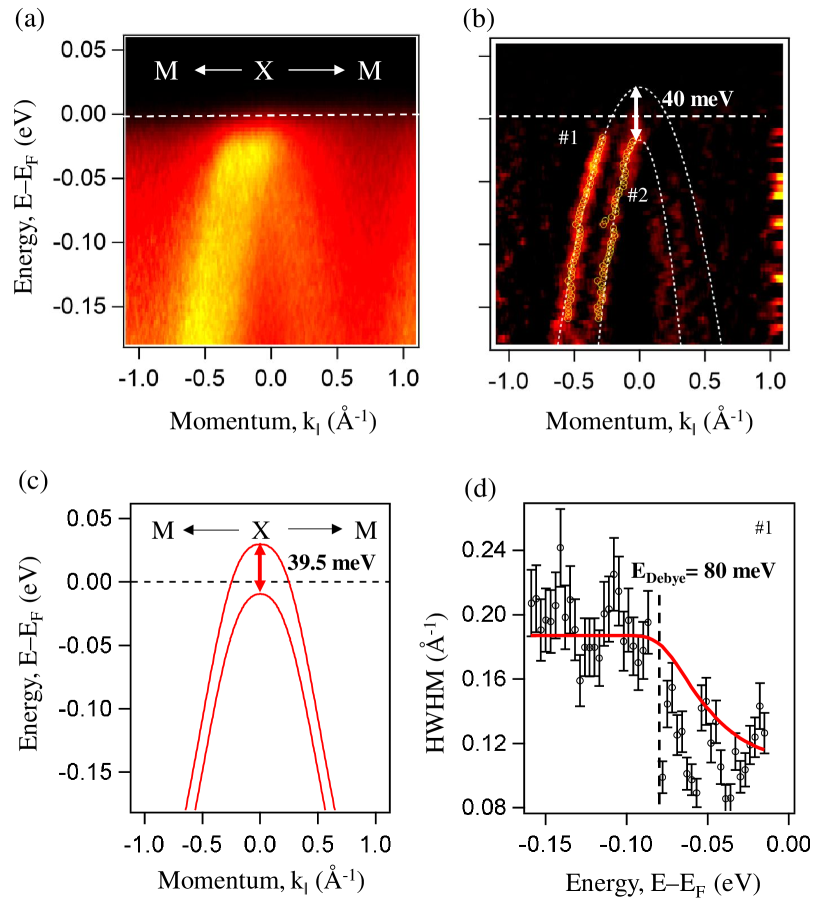
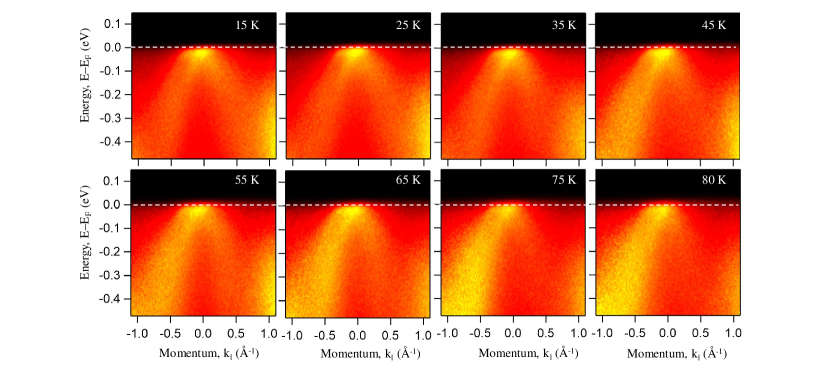
Figure 4(a) depicts EDM along the orientation measured at a sample temperature of 15 K. From the second derivative of Fig. 4(a) as shown in Fig. 4(b) we identify two band dispersions, #1 and #2. Here, the band #1 is crossing the Fermi level with a momentum vector of 0.22 at the point whereas the band #2 does not cross the Fermi level. Further, we estimate an energy difference between the top of #1 and #2 is about 40 meV, which is in good agreement with the DFT calculations with SOC which predicts it to be 39.5 meV as shown in Fig. 4(c). In fact, without SOC there exists only one band dispersion along orientation at this energy position [see Fig. 2(e)]. Thus, the experimental band structure can be properly reproduced using DFT calculations only with the SOC inclusion. To further elucidate temperature effects on the electronic band structure of FeSi, we measured EDMs along orientation with temperature ranging between 15 K and 80 K (see Fig. 2 in the supplementary information). From the temperature dependent EDMs as shown in Fig. 2 of the supplementary information, it is evident that the band structure near the Fermi level hardly changes with the temperature at least within the range of 15-80 K. We further estimated half-width-half-maximum (HWHM) from MDCs which is directly related to the imaginary part of the self-energy () for the band #1 as shown in Fig. 4(d). By fitting HWHM using the self-energy function Valla et al. (1999), we find electron-phonon coupling at a Debye energy of 80 meV. This estimate of Debye energy is in good agreement with an earlier ARPES report which suggested a Debye energy of 90 meV Klein et al. (2008). Thus, the anomalous resistivity observed in FeSi (see Fig. 1) may not be of the electronic structure origin. But, based on the spectral functional analysis, we suggest that the electron-phonon coupling is playing a crucial role for the observed anomalous resistivity also as suggested by the previous reports Racu et al. (2007); Menzel et al. (2009); Delaire et al. (2011); Sales et al. (2011).
Overall, the experimental band structure is quantitatively in agreement with the DFT calculations. Specially, the experimental observation of SOC band splitting has been explained very well from DFT calculations with spin-orbit interactions. Till date, a very few ARPES data with low energy and momentum resolution are available in the literature on FeSi, so it is difficult to compare quantitatively. However, qualitatively, our ARPES data is consistent with some of the earlier ARPES reports Arita et al. (2008); Klein et al. (2008). Next, coming to the main point of this manuscript, recent ARPES reports on CoSi and RhSi showed topological surface Fermi arcs spanned over a large area of 2D Brillouin zone Chang et al. (2017); Tang et al. (2017); Shekhar (2018); Takane et al. (2019); Yang et al. (2019); Sanchez et al. (2019); Schröter et al. (2019); Rao et al. (2019); Takane et al. (2019). Moreover, they could record manyfold bulk Weyl fermions at and high symmetry points. In contrast, we could not observe any such surface Fermi arcs from our ARPES measurements performed on the isostructural FeSi. As predicted by the DFT calculations [see Fig. 3(f)], in FeSi, the manyfold spin-3/2 RSW fermions are at 0.54 eV and the triple-point spin-1 excitations are at 0.37 eV above the Fermi level. So, it would not be possible to measure them using ARPES technique. Nevertheless, based on the present understanding, irrespective of the energy position of the manyfold band crossing points (BCPs) one would expect the associated Fermi surface arcs on the surface Brillouin zone Sun et al. (2015b); Bradlyn et al. (2016); Wang et al. (2016b).
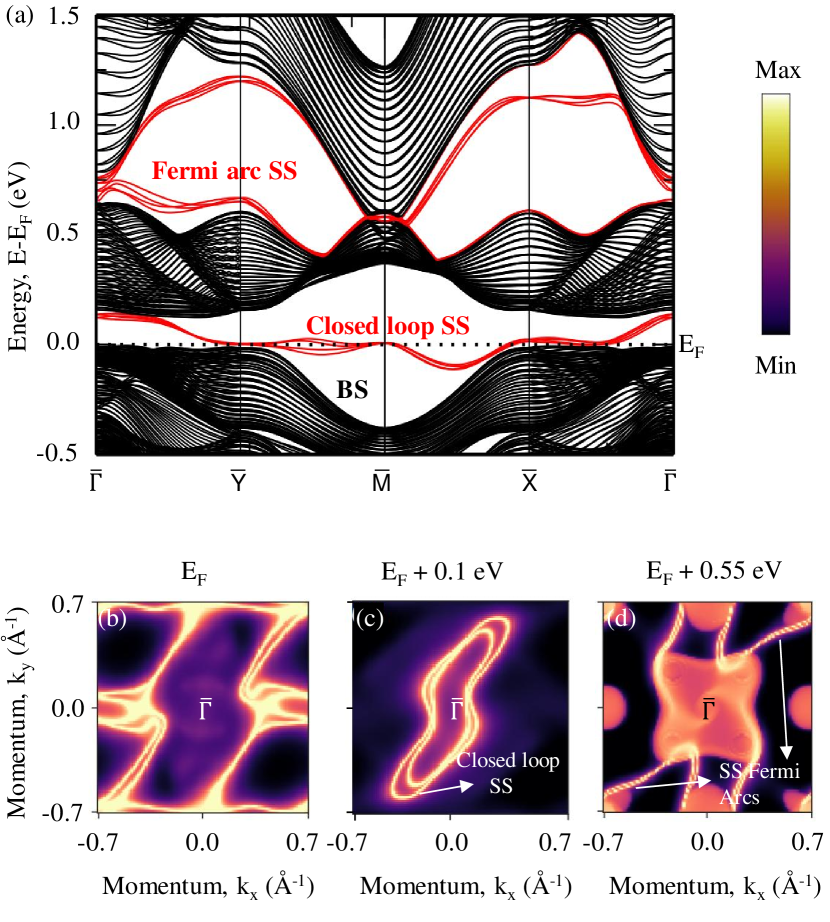
Therefore, to gain more insight into the surface band structure of FeSi, we carried out density functional theory calculations as shown in Fig. 5. We constructed a wannier function based model to compute the band structure of FeSi slab oriented along the [001] direction. The band structure, for a slab of thickness 88.96 , along the high symmetry directions is shown in Fig. 5(a). Most noticeably, we find only a set of trivial surface bands within the bulk band gap, and the absence of any topological protected Fermi arcs close to the Fermi level. The topological Fermi arcs, associated with manyfold fermions similar CoSi and RhSi, occur at substantially higher energies (0.55 eV above the Fermi level). Furthermore, we also considered the semi-infinite geometry, employing a Green’s function method to calculate the surface states, as a function of the in-plane momenta, at different energies. These are presented in Fig. 5(b)-(d). In stark contrast to the case of CoSi, we find that these surface states near the Fermi level close-in on themselves as shown in Figs. 5(b) and 5(c), clearly indicating the triviality of these states. The reciprocal space extent of these surface states diminishes as one moves away from the Fermi energy, with the closed loops shrinking in size. However, though the shape of the Fermi arcs is a bit different from CoSi and RhSi, the non-trivial topological Fermi arcs can be noticed in FeSi at 0.55 eV above the Fermi level as shown in Fig. 5(d). Thus the surface state calculations indicate that the topological Fermi arcs present in FeSi, however, they are not accessible by conventional ARPES technique. Further, these calculations predicted trivial surface states near the Fermi level which are not well resolved in our ARPES data due to either the surface state spectral intensity is very low compared to the bulk spectral intensity or the sample surface quality is not good enough to detect them.
We systematically studied the low-energy electronic structure of topological chiral fermionic system, FeSi, using angle-resolved photoemission spectroscopy and density functional theory to derive the following conclusions,
1. Observation of Fermi surface from the ARPES measurements suggest that FeSi is a metal at low temperature, in agreement with our resistivity measurements.
2. ARPES data show a spin-orbit band splitting of 40 meV that is nicely reproduced by the DFT calculations including SOC. Therefore, SOC effects must be considered while discussing the physics of manyfold degenerate fermions in the transition metal monosilicides.
3. Anomalous temperature dependent resistivity of FeSi can be explained by the electron-phonon interactions.
4. Unlike in the case of CoSi or RhSi, FeSi do not show topological surface Fermi arcs near the Fermi level as surface state calculations predicted them well above the Fermi level. Therefore, we are unable to detect them using conventional ARPES technique.
S.C. acknowledges University Grants Commission (UGC), India for the PhD fellowship. A.B. thanks Indian Institute of Science for the PhD fellowship. A.N. acknowledges support from the start-up grant at the Indian Institute of Science. S.A. acknowledges financial support by DFG through grant AS 523/4-1. S.A. and B.B. thank DFG through grant AS 523/3-1. S.T. acknowledges the financial support by DST, India through the INSPIRE-Faculty program (Grant No. IFA14 PH-86). S.T. acknowledges the financial support given by SNBNCBS through the Faculty Seed Grants program. S.T. Acknowledges the travel support given by DST, India (SR/NM/Z-07/2015) and Jawaharlal Nehru Centre for Advanced Scientific Research (JNCASR) for managing the project. The authors thank Alexander Fedorov and Emile Rienks for their technical support during the experiments performed at BESSYII (HZB).
References
- Novoselov et al. (2005) K. S. Novoselov, A. K. Geim, S. V. Morozov, D. Jiang, M. I. Katsnelson, I. V. Grigorieva, S. V. Dubonos, and A. A. Firsov, Nature 438, 197 (2005).
- Castro Neto et al. (2009) A. H. Castro Neto, F. Guinea, N. M. R. Peres, K. S. Novoselov, and A. K. Geim, Rev. Mod. Phys. 81, 109 (2009).
- Hasan and Kane (2010) M. Z. Hasan and C. L. Kane, Rev. Mod. Phys. 82, 3045 (2010).
- Zhang et al. (2011) W. Zhang, R. Yu, W. Feng, Y. Yao, H. Weng, X. Dai, and Z. Fang, Phys. Rev. Lett. 106 (2011), 10.1103/physrevlett.106.156808.
- Virot et al. (2011) F. m. c. Virot, R. Hayn, M. Richter, and J. van den Brink, Phys. Rev. Lett. 106, 236806 (2011).
- Yan et al. (2012) B. Yan, L. Müchler, and C. Felser, Phys. Rev. Lett. 109, 116406 (2012).
- Young et al. (2012) S. M. Young, S. Zaheer, J. C. Y. Teo, C. L. Kane, E. J. Mele, and A. M. Rappe, Phys. Rev. Lett. 108, 140405 (2012).
- Wang et al. (2012) Z. Wang, Y. Sun, X.-Q. Chen, C. Franchini, G. Xu, H. Weng, X. Dai, and Z. Fang, Phys. Rev. B 85, 195320 (2012).
- Wang et al. (2013) Z. Wang, H. Weng, Q. Wu, X. Dai, and Z. Fang, Phys. Rev. B 88, 125427 (2013).
- Borisenko et al. (2014) S. Borisenko, Q. Gibson, D. Evtushinsky, V. Zabolotnyy, B. Büchner, and R. J. Cava, Phys. Rev. Lett. 113, 027603 (2014).
- Neupane et al. (2014) M. Neupane, S.-Y. Xu, R. Sankar, N. Alidoust, G. Bian, C. Liu, I. Belopolski, T.-R. Chang, H.-T. Jeng, H. Lin, A. Bansil, F. Chou, and M. Z. Hasan, Nature Communications 5 (2014), 10.1038/ncomms4786.
- Liu et al. (2014) Z. K. Liu, J. Jiang, B. Zhou, Z. J. Wang, Y. Zhang, H. M. Weng, D. Prabhakaran, S.-K. Mo, H. Peng, P. Dudin, T. Kim, M. Hoesch, Z. Fang, X. Dai, Z. X. Shen, D. L. Feng, Z. Hussain, and Y. L. Chen, Nature Materials 13, 677 (2014).
- Huang et al. (2015) X. Huang, L. Zhao, Y. Long, P. Wang, D. Chen, Z. Yang, H. Liang, M. Xue, H. Weng, Z. Fang, X. Dai, and G. Chen, Phys. Rev. X 5, 031023 (2015).
- Zhang et al. (2015) C. Zhang, Z. Yuan, S. Xu, Z. Lin, B. Tong, M. Zahid Hasan, J. Wang, C. Zhang, and S. Jia, ArXiv e-prints (2015), arXiv:1502.00251 [cond-mat.mtrl-sci] .
- Ghimire et al. (2015) N. J. Ghimire, Y. Luo, M. Neupane, D. J. Williams, E. D. Bauer, and F. Ronning, Journal of Physics: Condensed Matter 27, 152201 (2015).
- Shekhar et al. (2015) C. Shekhar, A. K. Nayak, Y. Sun, M. Schmidt, M. Nicklas, I. Leermakers, U. Zeitler, Y. Skourski, J. Wosnitza, Z. Liu, Y. Chen, W. Schnelle, H. Borrmann, Y. Grin, C. Felser, and B. Yan, Nature Physics 11, 645 (2015).
- Xu et al. (2016) N. Xu, Z. J. Wang, A. P. Weber, A. Magrez, P. Bugnon, H. Berger, C. E. Matt, J. Z. Ma, B. B. Fu, B. Q. Lv, N. C. Plumb, M. Radovic, E. Pomjakushina, K. Conder, T. Qian, J. H. Dil, J. Mesot, H. Ding, and M. Shi, (2016), arXiv:1604.02116 .
- Tamai et al. (2016) A. Tamai, Q. S. Wu, I. Cucchi, F. Y. Bruno, S. Riccò, T. K. Kim, M. Hoesch, C. Barreteau, E. Giannini, C. Besnard, A. A. Soluyanov, and F. Baumberger, Phys. Rev. X 6, 031021 (2016).
- Deng et al. (2016) K. Deng, G. Wan, P. Deng, K. Zhang, S. Ding, E. Wang, M. Yan, H. Huang, H. Zhang, Z. Xu, J. Denlinger, A. Fedorov, H. Yang, W. Duan, H. Yao, Y. Wu, S. Fan, H. Zhang, X. Chen, and S. Zhou, Nature Physics 12, 1105 (2016).
- Huang et al. (2016) L. Huang, T. M. McCormick, M. Ochi, Z. Zhao, M.-T. Suzuki, R. Arita, Y. Wu, D. Mou, H. Cao, J. Yan, N. Trivedi, and A. Kaminski, Nature Materials 15, 1155 (2016).
- Liang et al. (2016) A. Liang, J. Huang, S. Nie, Y. Ding, Q. Gao, C. Hu, S. He, Y. Zhang, C. Wang, B. Shen, J. Liu, P. Ai, L. Yu, X. Sun, W. Zhao, S. Lv, D. Liu, C. Li, Y. Zhang, Y. Hu, Y. Xu, L. Zhao, G. Liu, Z. Mao, X. Jia, F. Zhang, S. Zhang, F. Yang, Z. Wang, Q. Peng, H. Weng, X. Dai, Z. Fang, Z. Xu, C. Chen, and X. J. Zhou, (2016), arXiv:1604.01706 .
- Wang et al. (2016a) Z. Wang, Y. Zheng, Z. Shen, Y. Lu, H. Fang, F. Sheng, Y. Zhou, X. Yang, Y. Li, C. Feng, and Z.-A. Xu, Phys. Rev. B 93, 121112 (2016a).
- Jiang et al. (2017) J. Jiang, Z. Liu, Y. Sun, H. Yang, C. Rajamathi, Y. Qi, L. Yang, C. Chen, H. Peng, C.-C. Hwang, S. Sun, S.-K. Mo, I. Vobornik, J. Fujii, S. Parkin, C. Felser, B. Yan, and Y. Chen, Nat. Commun. 8, 13973 (2017).
- Thirupathaiah et al. (2017a) S. Thirupathaiah, R. Jha, B. Pal, J. S. Matias, P. K. Das, P. K. Sivakumar, I. Vobornik, N. C. Plumb, M. Shi, R. A. Ribeiro, and D. D. Sarma, Phys. Rev. B (R) 95, 241105 (2017a).
- Thirupathaiah et al. (2017b) S. Thirupathaiah, R. Jha, B. Pal, J. S. Matias, P. K. Das, I. Vobornik, R. A. Ribeiro, and D. D. Sarma, Phys. Rev. B 96, 165149 (2017b).
- Thirupathaiah et al. (2018) S. Thirupathaiah, I. Morozov, Y. Kushnirenko, A. V. Fedorov, E. Haubold, T. K. Kim, G. Shipunov, A. Maksutova, O. Kataeva, S. Aswartham, B. Büchner, and S. V. Borisenko, ArXiv e-prints (2018), arXiv:1802.04045 [cond-mat.mtrl-sci] .
- Nayak et al. (2008) C. Nayak, S. H. Simon, A. Stern, M. Freedman, and S. Das Sarma, Rev. Mod. Phys. 80, 1083 (2008).
- Lutchyn et al. (2010) R. M. Lutchyn, J. D. Sau, and S. Das Sarma, Phys. Rev. Lett. 105, 077001 (2010).
- Mourik et al. (2012) V. Mourik, K. Zuo, S. M. Frolov, S. R. Plissard, E. P. A. M. Bakkers, and L. P. Kouwenhoven, Science 336, 1003 (2012).
- Stern and Lindner (2013) A. Stern and N. H. Lindner, Science 339, 1179 (2013).
- Stanescu (2016) T. D. Stanescu, ed., Introduction to Topological Quantum Matter & Quantum Computation (CRC Press, 2016) pp. 319–246.
- Haubold et al. (2017) E. Haubold, K. Koepernik, D. Efremov, S. Khim, A. Fedorov, Y. Kushnirenko, J. van den Brink, S. Wurmehl, B. Büchner, T. K. Kim, M. Hoesch, K. Sumida, K. Taguchi, T. Yoshikawa, A. Kimura, T. Okuda, and S. V. Borisenko, Phys. Rev. B 95, 241108 (2017).
- Sato and Fujimoto (2009) M. Sato and S. Fujimoto, Phys. Rev. B 79, 094504 (2009).
- Bradlyn et al. (2016) B. Bradlyn, J. Cano, Z. Wang, M. G. Vergniory, C. Felser, R. J. Cava, and B. A. Bernevig, Science 353, aaf5037 (2016).
- Tang et al. (2017) P. Tang, Q. Zhou, and S.-C. Zhang, Phys. Rev. Lett. 119, 206402 (2017).
- Chang et al. (2017) G. Chang, S.-Y. Xu, B. J. Wieder, D. S. Sanchez, S.-M. Huang, I. Belopolski, T.-R. Chang, S. Zhang, A. Bansil, H. Lin, and M. Z. Hasan, Phys. Rev. Lett. 119, 206401 (2017).
- Pshenay-Severin and Burkov (2019) D. A. Pshenay-Severin and A. T. Burkov, Materials 12, 2710 (2019).
- Rao et al. (2019) Z. Rao, H. Li, T. Zhang, S. Tian, C. Li, B. Fu, C. Tang, L. Wang, Z. Li, W. Fan, J. Li, Y. Huang, Z. Liu, Y. Long, C. Fang, H. Weng, Y. Shi, H. Lei, Y. Sun, T. Qian, and H. Ding, Nature 567, 496 (2019).
- Takane et al. (2019) D. Takane, Z. Wang, S. Souma, K. Nakayama, T. Nakamura, H. Oinuma, Y. Nakata, H. Iwasawa, C. Cacho, T. Kim, K. Horiba, H. Kumigashira, T. Takahashi, Y. Ando, and T. Sato, Phys. Rev. Lett. 122, 076402 (2019).
- Shekhar (2018) C. Shekhar, Nature Materials 17, 953 (2018).
- Sanchez et al. (2019) D. S. Sanchez, I. Belopolski, T. A. Cochran, X. Xu, J.-X. Yin, G. Chang, W. Xie, K. Manna, V. Süß, C.-Y. Huang, N. Alidoust, D. Multer, S. S. Zhang, N. Shumiya, X. Wang, G.-Q. Wang, T.-R. Chang, C. Felser, S.-Y. Xu, S. Jia, H. Lin, and M. Z. Hasan, Nature 567, 500 (2019).
- Yang et al. (2019) Y. Yang, H. xiang Sun, J. ping Xia, H. Xue, Z. Gao, Y. Ge, D. Jia, S. qi Yuan, Y. Chong, and B. Zhang, Nat. Phys. 15, 645 (2019).
- Schröter et al. (2019) N. B. M. Schröter, D. Pei, M. G. Vergniory, Y. Sun, K. Manna, F. de Juan, J. A. Krieger, V. Süss, M. Schmidt, P. Dudin, B. Bradlyn, T. K. Kim, T. Schmitt, C. Cacho, C. Felser, V. N. Strocov, and Y. Chen, Nat. Phys. 15, 759 (2019).
- Fang et al. (2012) C. Fang, M. J. Gilbert, X. Dai, and B. A. Bernevig, Phys. Rev. Lett. 108, 266802 (2012).
- Rarita and Schwinger (1941) W. Rarita and J. Schwinger, Phys. Rev. 60, 61 (1941).
- Lv et al. (2015) B. Q. Lv, H. M. Weng, B. B. Fu, X. P. Wang, H. Miao, J. Ma, P. Richard, X. C. Huang, L. X. Zhao, G. F. Chen, Z. Fang, X. Dai, T. Qian, and H. Ding, Phys. Rev. X 5, 031013 (2015).
- Sun et al. (2015a) Y. Sun, S.-C. Wu, and B. Yan, Phys. Rev. B 92, 115428 (2015a).
- Xu et al. (2015) S.-Y. Xu, I. Belopolski, N. Alidoust, M. Neupane, G. Bian, C. Zhang, R. Sankar, G. Chang, Z. Yuan, C.-C. Lee, S.-M. Huang, H. Zheng, J. Ma, D. S. Sanchez, B. Wang, A. Bansil, F. Chou, P. P. Shibayev, H. Lin, S. Jia, and M. Z. Hasan, Science 349, 613 (2015).
- Fu et al. (1994) C. Fu, M. P. C. M. Krijn, and S. Doniach, Physical Review B 49, 2219 (1994).
- Park et al. (1995) C.-H. Park, Z.-X. Shen, A. G. Loeser, D. S. Dessau, D. G. Mandrus, A. Migliori, J. Sarrao, and Z. Fisk, Phys. Rev. B 52, R16981 (1995).
- Arko et al. (1997) A. J. Arko, J. J. Joyce, A. B. Andrews, J. D. Thompson, J. L. Smith, D. Mandrus, M. F. Hundley, A. L. Cornelius, E. Moshopoulou, Z. Fisk, P. C. Canfield, and A. Menovsky, Phys. Rev. B 56, R7041 (1997).
- Chernikov et al. (1997) M. A. Chernikov, L. Degiorgi, E. Felder, S. Paschen, A. D. Bianchi, H. R. Ott, J. L. Sarrao, Z. Fisk, and D. Mandrus, Phys. Rev. B 56, 1366 (1997).
- Ishizaka et al. (2005) K. Ishizaka, T. Kiss, T. Shimojima, T. Yokoya, T. Togashi, S. Watanabe, C. Q. Zhang, C. T. Chen, Y. Onose, Y. Tokura, and S. Shin, Phys. Rev. B 72 (2005), 10.1103/physrevb.72.233202.
- Klein et al. (2008) M. Klein, D. Zur, D. Menzel, J. Schoenes, K. Doll, J. Röder, and F. Reinert, Phys. Rev. Lett. 101, 046406 (2008).
- Arita et al. (2008) M. Arita, K. Shimada, Y. Takeda, M. Nakatake, H. Namatame, M. Taniguchi, H. Negishi, T. Oguchi, T. Saitoh, A. Fujimori, and T. Kanomata, Phys. Rev. B 77 (2008), 10.1103/physrevb.77.205117.
- Zhao et al. (2009) Y. N. Zhao, H. L. Han, Y. Yu, W. H. Xue, and T. Gao, EPL (Europhysics Letters) 85, 47005 (2009).
- Petrova et al. (2010) A. E. Petrova, V. N. Krasnorussky, A. A. Shikov, W. M. Yuhasz, T. A. Lograsso, J. C. Lashley, and S. M. Stishov, Phys. Rev. B 82, 155124 (2010).
- Sales et al. (2011) B. C. Sales, O. Delaire, M. A. McGuire, and A. F. May, Phys. Rev. B 83, 125209 (2011).
- Dutta and Pandey (2018) P. Dutta and S. K. Pandey, Comput. Condens. Matter 16, e00325 (2018).
- Schlesinger et al. (1993) Z. Schlesinger, Z. Fisk, H.-T. Zhang, M. B. Maple, J. DiTusa, and G. Aeppli, Phys. Rev. Lett. 71, 1748 (1993).
- Jaccarino et al. (1967) V. Jaccarino, G. K. Wertheim, J. H. Wernick, L. R. Walker, and S. Arajs, Phys. Rev. 160, 476 (1967).
- Schlesinger et al. (1997) Z. Schlesinger, Z. Fisk, H.-T. Zhang, and M. Maple, Physica B 237-238, 460 (1997).
- Takahashi (1998) Y. Takahashi, J Phys : Condens Matter 10, L671 (1998).
- Fang et al. (2018) Y. Fang, S. Ran, W. Xie, S. Wang, Y. S. Meng, and M. B. Maple, PNAS 115, 8558 (2018).
- Delaire et al. (2011) O. Delaire, K. Marty, M. B. Stone, P. R. C. Kent, M. S. Lucas, D. L. Abernathy, D. Mandrus, and B. C. Sales, Proceedings of the National Academy of Sciences 108, 4725 (2011).
- Evangelou and Edwards (1983) S. N. Evangelou and D. M. Edwards, J. Phys. C: Solid State Phys. 16, 2121 (1983).
- Takahashi (1997) Y. Takahashi, J. Phys.: Condens. Matter 9, 2593 (1997).
- Tomczak et al. (2012) J. M. Tomczak, K. Haule, and G. Kotliar, Proceedings of the National Academy of Sciences 109, 3243 (2012).
- Kübler et al. (2013) J. Kübler, B. Yan, and C. Felser, EPL (Europhysics Letters) 104, 30001 (2013).
- Mason (1979) K. Mason, Progress in Crystal Growth and Characterization 2, 269 (1979).
- Damascelli et al. (1997) A. Damascelli, K. Schulte, D. van der Marel, and A. A. Menovsky, Phys. Rev. B 55, R4863 (1997).
- Borisenko (2012) S. V. Borisenko, Synchrotron Radiation News 25, 6 (2012).
- Borisenko et al. (2012) S. V. Borisenko, V. B. Zabolotnyy, D. V. Evtushinsky, T. K. Kim, I. V. Morozov, A. N. Yaresko, A. A. Kordyuk, G. Behr, A. Vasiliev, R. Follath, and B. Büchner, J. Vis. Exp. 68, e50129 (2012).
- Brown (1966) B. E. Brown, Acta Crystallographica 20, 268 (1966).
- Perdew et al. (1996) J. P. Perdew, K. Burke, and M. Ernzerhof, Phys. Rev. Lett. 77, 3865 (1996).
- Giannozzi et al. (2009) P. Giannozzi, S. Baroni, N. Bonini, M. Calandra, R. Car, C. Cavazzoni, D. Ceresoli, G. L. Chiarotti, M. Cococcioni, I. Dabo, A. Dal Corso, S. de Gironcoli, S. Fabris, G. Fratesi, R. Gebauer, U. Gerstmann, C. Gougoussis, A. Kokalj, M. Lazzeri, L. Martin-Samos, N. Marzari, F. Mauri, R. Mazzarello, S. Paolini, A. Pasquarello, L. Paulatto, C. Sbraccia, S. Scandolo, G. Sclauzero, A. P. Seitsonen, A. Smogunov, P. Umari, and R. M. Wentzcovitch, J. Phys.: Condens. Matter 21, 395502 (19pp) (2009).
- Mostofi et al. (2008) A. A. Mostofi, J. R. Yates, Y.-S. Lee, I. Souza, D. Vanderbilt, and N. Marzari, Comput. Phys. Commun. 178, 685 (2008).
- Wu et al. (2018) Q. Wu, S. Zhang, H.-F. Song, M. Troyer, and A. A. Soluyanov, Comput. Phys. Commun. 224, 405 (2018).
- Samuely et al. (1996) P. Samuely, P. Szabó, M. Mihalik, N. Hudáková, and A. Menovsky, Physica B 218, 185 (1996).
- Buschinger et al. (1997) B. Buschinger, C. Geibel, F. Steglich, D. Mandrus, D. Young, J. Sarrao, and Z. Fisk, Physica B: Condensed Matter 230-232, 784 (1997).
- Paschen et al. (1997) S. Paschen, E. Felder, M. A. Chernikov, L. Degiorgi, H. Schwer, H. R. Ott, D. P. Young, J. L. Sarrao, and Z. Fisk, Phys. Rev. B 56, 12916 (1997).
- Fäth et al. (1998) M. Fäth, J. Aarts, A. A. Menovsky, G. J. Nieuwenhuys, and J. A. Mydosh, Phys. Rev. B 58, 15483 (1998).
- Thirupathaiah et al. (2010) S. Thirupathaiah, S. de Jong, R. Ovsyannikov, H. A. Dürr, A. Varykhalov, R. Follath, Y. Huang, R. Huisman, M. S. Golden, Y.-Z. Zhang, H. O. Jeschke, R. Valentí, A. Erb, A. Gloskovskii, and J. Fink, Phys. Rev. B 81, 104512 (2010).
- Valla et al. (1999) T. Valla, A. V. Fedorov, P. D. Johnson, and S. L. Hulbert, Phys. Rev. Lett. 83, 2085 (1999).
- Racu et al. (2007) A.-M. Racu, D. Menzel, J. Schoenes, and K. Doll, Phys. Rev. B 76, 115103 (2007).
- Menzel et al. (2009) D. Menzel, P. Popovich, N. N. Kovaleva, J. Schoenes, K. Doll, and A. V. Boris, Phys. Rev. B 79, 165111 (2009).
- Sun et al. (2015b) Y. Sun, S.-C. Wu, M. N. Ali, C. Felser, and B. Yan, Phys. Rev. B 92, 161107 (2015b).
- Wang et al. (2016b) C. Wang, Y. Zhang, J. Huang, S. Nie, G. Liu, A. Liang, Y. Zhang, B. Shen, J. Liu, C. Hu, Y. Ding, D. Liu, Y. Hu, S. He, L. Zhao, L. Yu, J. Hu, J. Wei, Z. Mao, Y. Shi, X. Jia, F. Zhang, S. Zhang, F. Yang, Z. Wang, Q. Peng, H. Weng, X. Dai, Z. Fang, Z. Xu, C. Chen, and X. J. Zhou, Phys. Rev. B 94, 241119 (2016b).
I Supplementary information