Is Your Smartband Smart Enough to Know Who You Are: Continuous Physiological Authentication in The Wild
Abstract
The use of cloud services that process privacy-sensitive information such as digital banking, pervasive healthcare, smart home applications requires an implicit continuous authentication solution which will make these systems less vulnerable to the spoofing attacks. Physiological signals can be used for continuous authentication due to their personal uniqueness. Ubiquitous wrist-worn wearable devices are equipped with photoplethysmogram sensors which enable to extract heart rate variability (HRV) features. In this study, we show that these devices can be used for continuous physiological authentication, for enhancing the security of the cloud, edge services, and IoT devices. A system that is suitable for the smartband framework comes with new challenges such as relatively low signal quality and artifacts due to placement which were not encountered in full lead electrocardiogram systems. After the artifact removal, cleaned physiological signals are fed to the machine learning algorithms. In order to train our machine learning models, we collected physiological data using off-the-shelf smartbands and smartwatches in a real-life event. Performance evaluation of selected machine learning algorithms shows that HRV is a strong candidate for continuous unobtrusive implicit physiological authentication.
Index Terms:
smartband, smartwatch, heart rate variability, continuous authenticationI Introduction
Implicit continuous authentication is required for cloud oriented services which grant access to the privacy sensitive information domains such as mobile banking, pervasive healthcare [1, 2]. Smartphones, computers, smartwatches and Internet-of-Things (IoT) devices become more dependent on these services. It is expected that the number of IoT devices will be more than 75 Billion in 2025 [3]. However, these services are vulnerable to attacks once users authenticate. For example, a smartphone can be forgotten logged-in, the privacy-sensitive services and information can be stolen by the attackers. One simple mechanism can be asking a password to the user frequently. However, this is annoying for the service users. Continuous authentication should be implicit. Face-based systems can be tricked by using presence attacks, such as printing the face of the victim on a paper. Storing the face pictures of the users also create a privacy concern [4]. Furthermore, fingerprint which is another prominent traditional biometrics modality along with the face-based systems can be easily manipulated [5] and fails on liveness detection tests. On the other hand, biosignals are difficult to temper with and they inherently have liveness detection feature [6]. Heart activity is unique to individuals and biosignal authentication research has started investigating this signal [6]. One of the most important properties of this signal is the Heart Rate Variability (HRV). Although research in the past mostly focused on the connection between HRV and different types of health disorders [7], the validity of using HRV for biometric recognition is supported by the fact that the physiological and geometrical differences of the heart in different individuals display certain uniqueness in their HRV features [8].
High-end wearable systems are expensive and provide low comfort for the users, which limit their wide range application. Recently, smart bands and smartwatches became widely adopted by consumers. These devices are equipped with a rich set of sensors such as accelerometer, heart rate monitor and skin conductance. These advances create an opportunity to build a continuous implicit authentication system. However, these devices are prune to activity related errors [9] unlike full lead ECG systems. Modality specific artifact detection and removal mechanisms should be developed for accurate measurements. A solution suitable for IoT connected devices should be context-independent because every service may require different types of behavior. Therefore, systems that only work in certain scenarios such as while typing or walking are very limited in terms of the application area. The physiological parameters like hidden heart-related biometrics are more suitable for this purpose due to their uniqueness and activity independence [10], [11]. We propose an unobtrusive, low cost, activity-independent continuous authentication system with smartbands. We implemented our solution on Empatica E4 Smartband [12], Samsung Gear S and Gear S2 [13] which are equipped with a photoplethysmography (PPG) sensor.
Let’s think about a scenario, where John has to make money transactions through a mobile banking smartphone application. He logins to the system via two-factor authentication. After he successfully makes the transaction, he forgets to logout. Then, an attacker withdraws all the cash from John’s account by using his session. If John has a continuous biometric authentication system, he would not have this problem. Such a system can be also used in services like city bikes and electric scooter rental services which have become popular in recent years. The literature on continuous authentication with physiological signals gathered from smartbands is limited. The effectiveness of HRV features derived from PPG sensors of smartwatches and smartbands is still unknown for continuous authentication [4]. Our proposed system enhances the state of the art as follows:
-
•
One of the previous studies employed mean heart rate per minute which requires longer recordings and achieves approximately five minutes [14]. The proposed system uses more sophisticated HRV features derived from inter-beat intervals which are extracted from the raw PPG sensor data.
-
•
Most of the previous works with smartbands only focused on continuous authentication while using a laptop, a smartphone, an ATM and used lifestyle related metrics. Our solution is not activity dependent. For example, a user may use this system during any activity such as live streaming, on social media, cycling, presentation or working in an office.
-
•
Our solution is comfortable, unobtrusive, seamless and works without interrupting the ordinary pattern of any activity.
-
•
Real-life data contains artifacts. We evaluate the effect of data quality on system performance.
In Section II we provide background information on the smartwatch framework and heart rate variability. In Section III, the related work on continuous authentication and the comparison with our work in terms of its novelty are presented. In Section IV, we describe the proposed system for continuous authentication with smartwatches using heart rate variability. In Section V, we explain the conducted experiment for the proposed system. In Section VI, we provide the results of our system. In Section VII, we present the conclusion and future works of our study.
II Background
II-A Smartband Framework
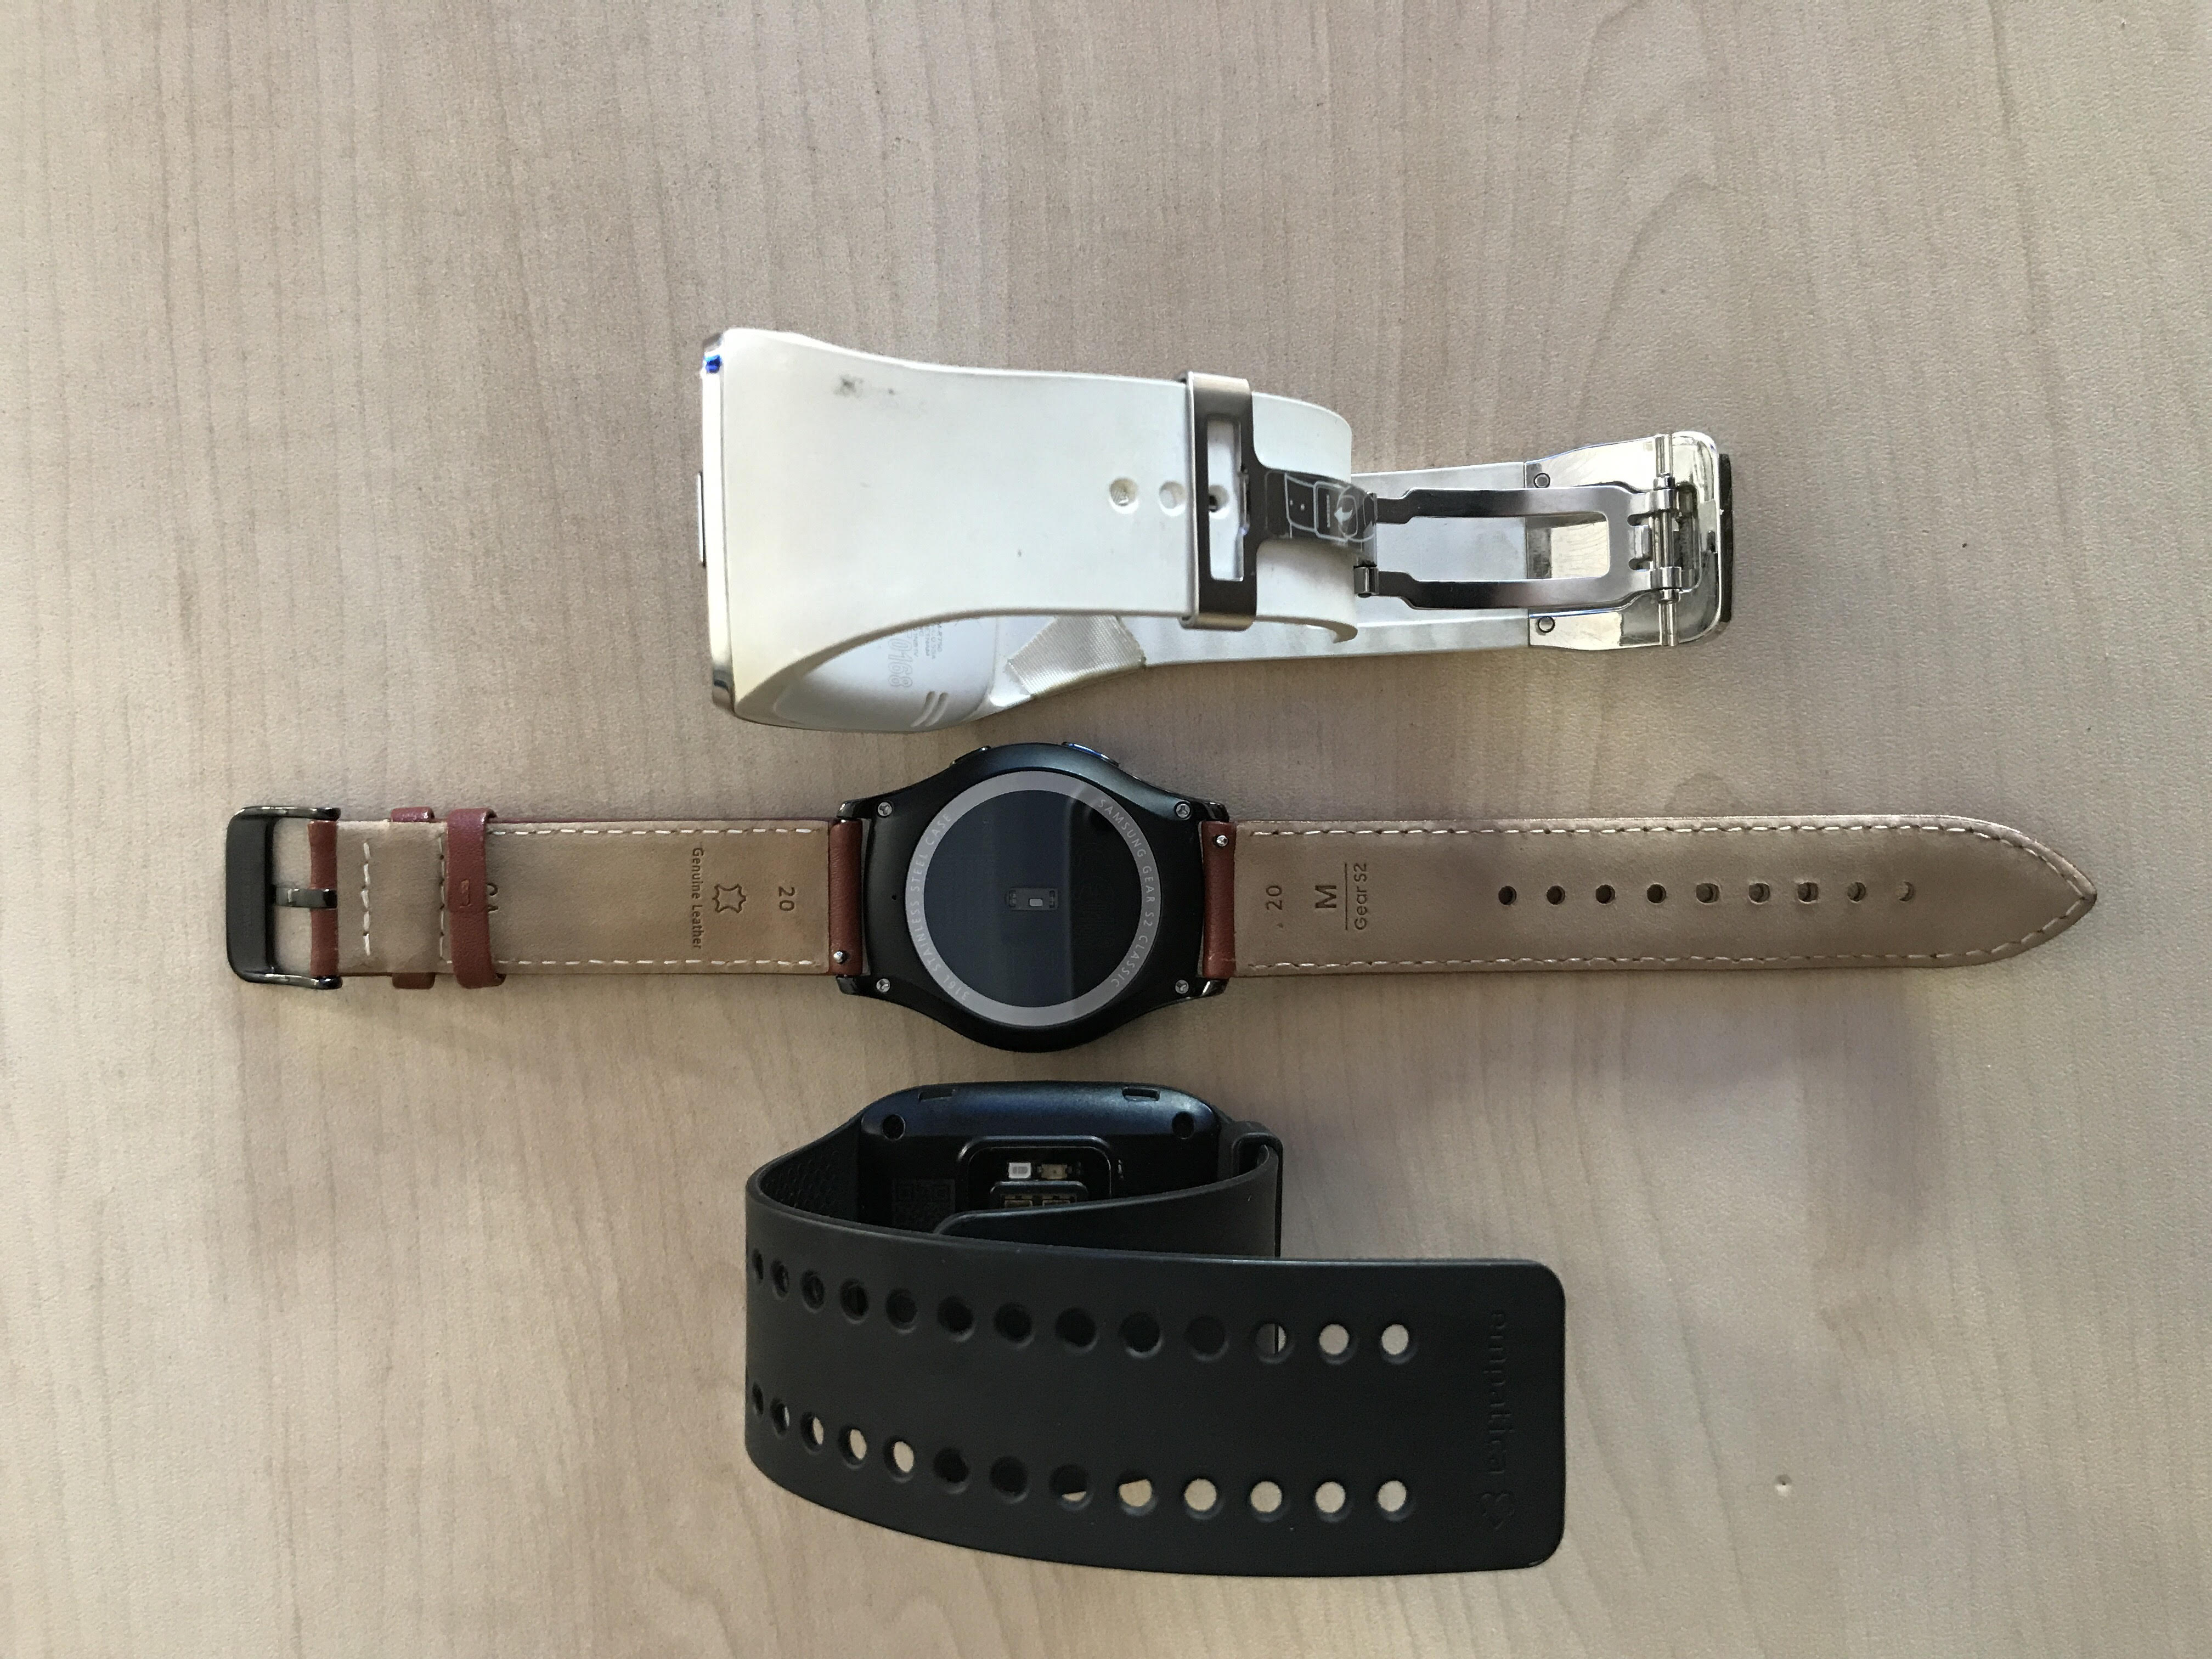
Smartbands (some times called wristbands or smartwatches) are comfortable devices that can be attached to the wrist or arm. The devices used in this study are shown in Figure 1. Recently, the battery life of smartbands is increased to days. For example, the battery life of Empatica E4 is two days when all sensors are used [12]. The extended battery life of smartbands enables monitoring physiological signals gathered from individuals for long periods. Most of the wristbands are equipped with PPG which is an optically obtained signal that can be used to detect blood volume changes in the microvascular bed of tissue [15]. From the PPG signal, the time between the beats (RR intervals) can be computed. Most of the modern smartbands provide RR intervals thanks to their APIs. For example, Samsung smartwatches use the Tizen framework which has Human Activity Monitor API to gather the RR intervals. The sampling frequency of the PPG sensor can vary from 20Hz to 100Hz (64Hz for E4, 100Hz for Samsung Gear Series) in many smartbands. Cubic spline interpolation is used to detect the beats more accurately and most of the devices correct the heartbeats by using an accelerometer sensor for detecting the movements of the subject. This functionality is available in Tizen and Empatica API [12]. These devices are also equipped with Bluetooth and recently NFC chips which enable them to connect to smartphones, edge and cloud services. These short-range network interfaces can be used to check if the user is in the close proximity of the computer they are using.
II-B Heart Rate Variability
The variability of RR intervals is called HRV [16]. It is a very important feature for recognition of certain psychological, physiological and personal properties of an individual [16]. In the literature, Kubios [17] is a popular HRV feature extraction tool to compute the HRV. Non-linear, time domain and frequency domain features can define the variability of the heart [17]. The calculation of frequency domain and time domain features of HRV is computationally effective, thanks to Fast Fourier Transform (FFT) for frequency domain and for time-domain features.
III Related Work
Article Year Device(s) Device Position(s) Features Unobtrusive Environment Activity Independent S. A. Elkader et al. [18] 2018 A combination of acceleration, gyroscope and magnetometer sensors Dominant wrist, dominant upper arm, non- dominant wrist,thigh, chest, ankle Accelerometers, gyroscope and magnetometers features extracted from six sensor-based body locations No Laboratory Kitchen area No Y. Zeng et al. [19] 2017 Shimmer 6DoF IMU Samsung Galaxy S4 i9500 Samsung Galaxy Nexus i9500 Wrist,ankle, hip/torso, thigh/front pocket, upper arm Statistical features extracted from accelerometer sensor Yes Laboratory No S. Vhaduri et al. [20] 2017 Fitbit Charge HR device Wrist Statistical features extracted from step counts, heart rate, calorie burn, metabolic equivalent of task information Yes Daily Life No S. Vhaduri et al. [14] 2019 Fitbit Charge HR device Wrist Statistical features extracted from step counts, heart rate, calorie burn, metabolic equivalent of task information Yes Daily Life No Matsuyama et al. [21] 2015 Near-infrared Spectroscopy (NIRS) Fore Head Low-frequency brainwaves No Laboratory No Sarkar et al. [22] 2016 Front facing camera of mobile device In front of face Deep Face Features Yes Daily Life No Ramli et al. [8] 2016 Hearbeat detection kit as a wearable bracelet Wrist ECG Wavelet Features No Laboratory No Ntantogian et al. [2] 2015 Camera In front of a person Gait and gesture features Yes Laboratory No Musale et al. [23] 2019 Motorola 360 Sport 2nd Gen (smartwatch) Motorola G4 plus (smartphone) Wrist Statistical and human-action-related features from accelerometer and gyroscope sensor Yes Daily Life No Peng et al. [24] 2017 Google Glass Head Touch gestures (single-tap, swipe forward, swipe backward, swipe down, two-finger, swipe forward, and two-finger swipe backward) and voice commands No Laboratory No Our Work 2019 Samsung Gear S Samsung Gear S2 Empatica E4 Wrist Heart Rate Variability features derived from PPG sensor Yes Real Life Yes
The behavioral and physiological biometrics from the wearable devices via sensors have become popular in individual recognition and authentication models. Some models focus on biometrics such as face [25], voice [26], fingerprints [27], [28], electroencephalography (EEG) [29], [30], [31], ECG [32], [33], [28] and phonocardiography (PCG), [34]. The continuous authentication field is a fast-growing field, however, the literature on a system that is not dependent on a certain type of task is limited. Most of the previous work using physiological signals have been done on laboratory-grade equipment. Some of these sensors are not available in unobtrusive devices such as smartphones, smartwatches, and smart bands. On the other hand, fingerprints and face-based authentication systems can be easily deceived. Authentication with voice has privacy issues, which requires continuous voice recording of the environment.
As a method for recognizing individuals, Elkader et al. [18] presented a sensor-based motion biometric model that is suitable for 20 sedentary and non-sedentary activities (Vacuuming, Sweeping, Walking Downstairs, Walking Upstairs, Dusting, Iron Cloth, Folding Cloth, Washing Hands, Brushing Teeth, Washing Dishes, Washing Vegetables, Dicing, Peeling Vegetables, Grating, Stirring, Watching TV, Using PC, Talking on Phone Texting on Phone, Writing with Pen). They used different combinations of 3 sensors (acceleration, gyroscope and magnetometer sensors) on 6 different body positions (dominant wrist, dominant upper arm, non-dominant wrist, chest, thigh, and ankle positions). They concluded that features extracted from the combination of six sensors reach the best classification accuracy in overall (98.3%). These activities are gathered in a laboratory environment with manual segmentation of the signals.
Another approach for implicit identification and authentication based on activity information, WearAI, Zeng et al.[19], proposed a biometric model that utilizes accelerometer and gyroscope sensors from five body locations such as left wrist (Shimmer 6DoF IMU), right ankle (Shimmer 6DoF IMU), center right hip/torso (Samsung Galaxy S4 i9500), left thigh/front pocket (Samsung Galaxy Nexus i9250), right upper arm (Samsung Galaxy Nexus i9250)). They achieved 97% accuracy with less than 1% false-positive rate. However, in both methods, placing many sensors on the body can be disturbing for the user in daily life usage.
Acar et al. [35] used smartwatches with keystroke dynamics for continuous authentication. Musale et al. [23] proposed a continuous authentication system based on Motorola 360 Sport by using accelerometer and gyroscope features. Vhaduri et al. [20] proposed continuous user authentication scheme that uses 44 features extracted from various biometrics (calorie burn, metabolic equivalent of task (MET), heart rate and step count) using Fitbit Charge HR device and they achieved average accuracy of 87.37% with Quadratic SVM classifier in one-to-many approach and average accuracy of 93% with Quadratic SVM classifier in one-to-one approach. In their revised scheme [14], they adopted more features (65) with different feature selection approaches and 93% (sedentary) and 90% (non-sedentary) with equal error rates of 5% is obtained. However, the Fitbit framework only provides only one sample each minute and access to the raw data is not possible. A system for continuous authentication with physiological signals should be low-cost and unobtrusive, and should not be dependent on certain activity for the sake of universality. We compared the proposed system with the related work in Table I in terms of device and device position, features, unobtrusiveness, environment, and dependency to the activity type. Our system outperforms other studies when feature engineering complexity, activity independence and unobtrusiveness are taken into consideration.
IV Proposed System
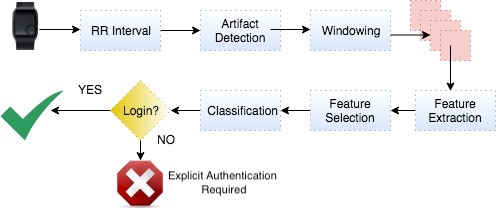
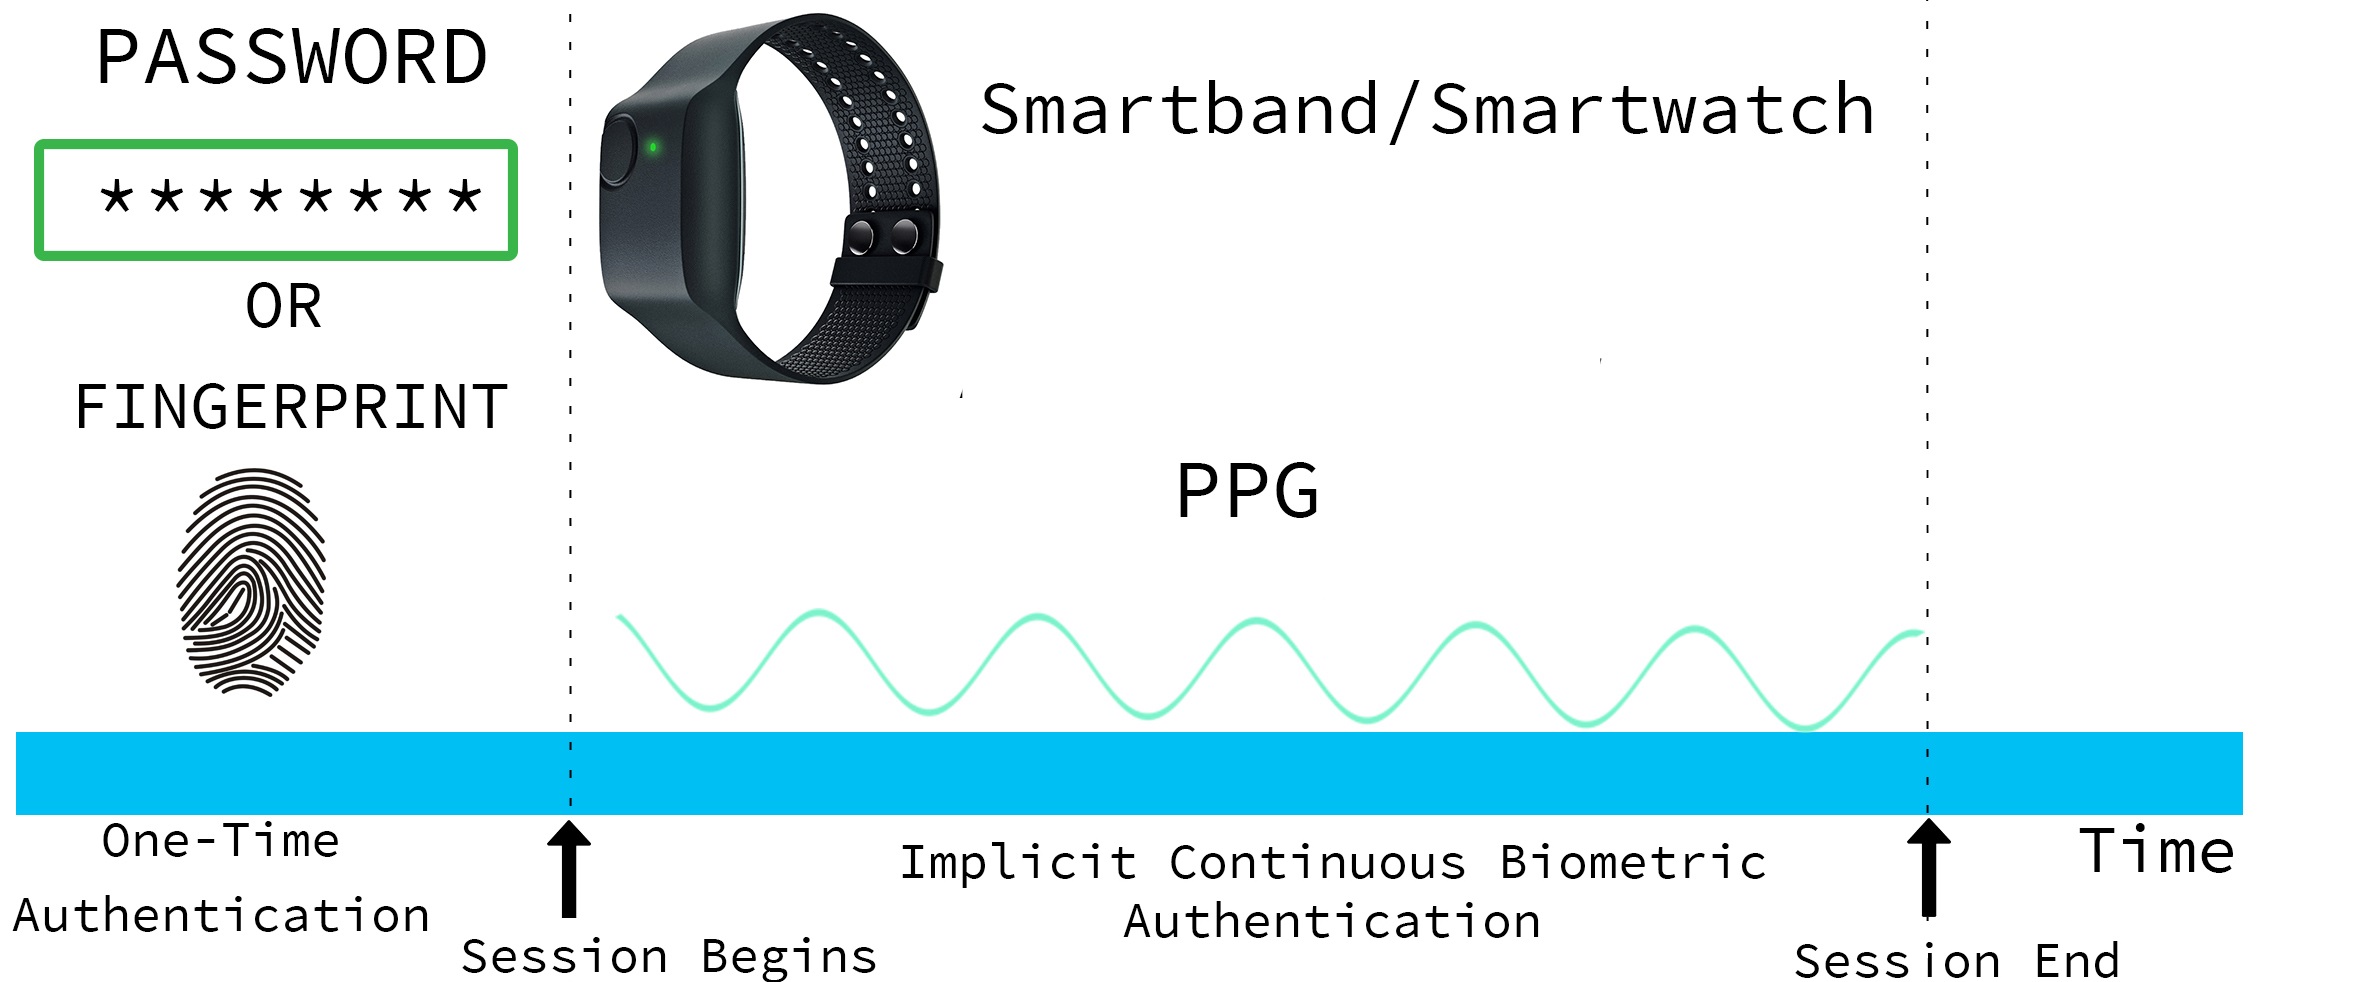
In this section, we explain our continuous authentication scheme. In Figure 2, we show the data collection application, preprocessing for artifact detection, feature extraction, feature selection and classification units of our system. The overall multi-factor authentication diagram where a user initiates his/her session with a password, or fingerprint, is shown in Figure 3.
IV-A Data Collection Application
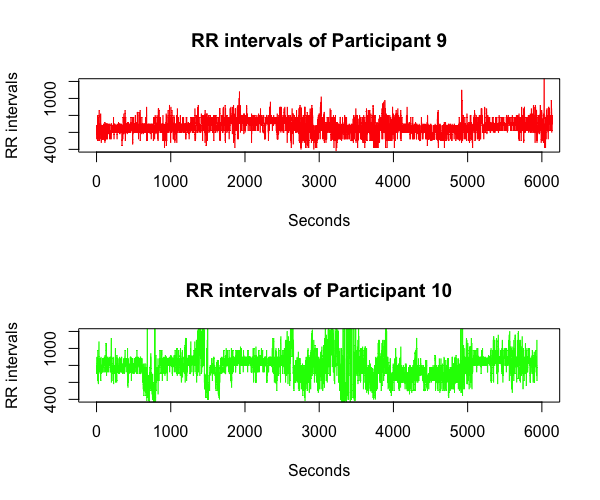
We developed a data collection application in Tizen 3.0 framework [36] for Samsung Gear S and S2. The application collects inter-beat intervals and 3D accelerometer data and stores them as downloadable comma-separated values (CSV files). Empatica E4 has a cloud based data collection application. The physiological signals can be downloaded as a CSV file. The gathered RR intervals from two different participants are shown in Figure 4.
IV-B Preprocessing and Artifact Removal
We implemented our preprocessing module in MATLAB [37]. First, we loaded the CSV file provided from the smartbands. The signal is segmented into non-overlapping time windows of 120 seconds. According to the HRV guidelines, 2 minutes is the minimum window length for calculation of short-term HRV features [16]. Since response time is important for a continuous authentication system, we selected the minimum possible duration. Therefore, the minimum required duration of physiological data for authentication is 2 minutes. The artifacts in the RR intervals are detected by checking the difference between the consecutive points. We labeled the points exceeding more than 20% of the local average as artifacts, and the other points as the validated RR intervals, this threshold is selected from the previous works [38]. The points labeled as artifacts are deleted. After the removal, we implemented two different techniques. The first one is to interpolate the missing data points using a cubic spline interpolation algorithm which is commonly used [17]. The second technique is to apply the minimum consecutive time and sample constraints on the remaining data to be regarded as meaningful. For example, if the minimum sample constraint is set to 5, we do not count three consecutive samples followed by a missing data point because the sequence is too short to be evaluated. In this study, we applied the former technique because it achieved better results [9].
IV-C Feature Extraction
We extracted time and frequency domain heart rate variability features from the segmented time windows. We used Marcus Volmer’s toolbox [39] which is implemented in MATLAB. We selected the features which are commonly used in the previous works related to heart rate variability [9], [38] and [40]. In order to compute the frequency domain features, the RR intervals are interpolated using 4Hz cubic spline interpolation, because RR intervals are unevenly sampled. We applied FFT to the interpolated windows. The computed features are shown in Table II. The total number of extracted features is 11 for each window.
| HRV Feature | Description |
| Mean RR | Mean value of the RR intervals |
| STD RR | Standard deviation of the RR intervals |
| RMSSD | Root mean square of successive difference of the RR intervals |
| pNN50 | Percentage of the number of successive RR intervals varying more than 50ms from the previous interval |
| HRV triangular index | Total number of RR intervals divided by the height of the histogram of all RR intervals measured on a scale with bins of 1/128 s |
| TINN | Triangular interpolation of RR interval histogram |
| SDSD | Related standard deviation of successive RR interval differences |
| LF | Power in low-frequency band (0.04-0.15 Hz) |
| HF | Power in high-frequency band (0.15-0.4 Hz) |
| LF/HF | Ratio of LF-to-HF |
| VLF | Power in very low-frequency band (0.00-0.04 Hz) |
IV-D Dimensionality Reduction
It is known that dimensionality reduction leads to better performance for the machine learning systems since it removes the unrelated features with the desired prediction [41]. We used Principal Component Analysis (PCA) based dimensionality reduction which is available in the Weka toolkit [42]. PCA is a very powerful tool when applied with machine learning (ML) classifiers. It converts the set of vectors to uncorrelated variables. We explored the effect of different selection of covered variance and PCA variables. It is known that the covered variance affects the classification performance, therefore different values are evaluated (0.8, 0.85, 0.9 and 0.95) we reported the best results when the variance is selected as 0.9.
IV-E Handling Class Imbalance
Since some of the windows are deleted due to improper placement of the devices or heavy movements. There is a class imbalance between participants. We applied the majority class subsampling to equalize the number of windows for each participant. This method is the most commonly used one in the literature [43].
IV-F Machine Learning
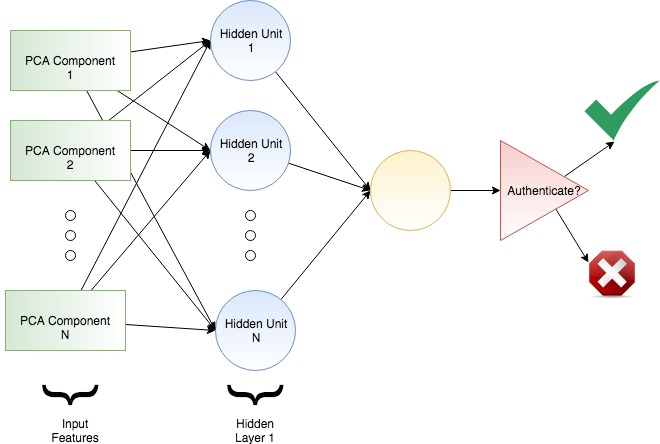
We used k-Nearest Neighbour (kNN), Random Forest (RF), Multi-Layer Perceptron (MLP) and Linear Discriminant Analysis (LDA) classifiers which are available in the Weka Machine Learning software [42]. We fine tuned the parameters for different classifiers. The best performing feature set are as follows: N selected as 3 for the kNN, the number of trees is selected as 100 for the random forest and the hidden layer is selected as 1 and hidden unit as 5 for the MLP as shown in Figure 5. We created a binary authentication model for each user. The selected user’s label is set to 1 and others as 0.
We applied 10 fold stratified cross-validation (the distribution of class labels are equal in each fold) for evaluating our system and fine tuned the parameters where 90% of the dataset is used for training and the rest is used for testing by changing the folds.

IV-G Evaluation Metrics
In order to present the results of our authentication system, we provide the performance metrics used in the literature [14, 34, 18, 19, 8] . In authentication systems, there are two types of error which are False Acceptance Rate (FAR) and False Rejection Rate (FRR). These errors are depend on selection of the threshold which can be between 0 and 1 for the ML classifiers. A smaller value will cause a low FAR but high FRR. The point of equilibrium is important for such a system. This point is called Equal Error Rate (EER). The definitions are provided below:
-
•
False Acceptance Rate (FAR): It is the ratio of false acceptance divided by the total attempts.
-
•
False Rejection Rate (FRR): It is the ratio of denied legitimate attempts to the total number of attempts.
-
•
Equal Error Rate (EER): The common value when FRR and FAR are equal, is called EER [44].
V Data Collection
In this section, we describe the data collection in real life and the ethics procedure. We collected physiological data from 28 people in controlled real-life settings, during a summer school for teachers. All of the participants are healthy teachers who have no prior medical condition. Before the data collection, subjects received and filled a consent. The gender of participants are 16 male and 12 female, the ages are between 25 and 35. The data collection procedure is shown in Figure 6. The duration of the total data collection is 110 minutes. The dataset has a baseline (20 minutes), lecture (40 minutes), free-time (10 minutes), examination (20 minutes) and recovery session (20 minutes). We did not use the free-time session which might create a bias on the results. The reason that we had these different scenarios is to create a daily life sequence. A system should take different states into consideration, because HRV can be affected by valance and arousal. During the free-time participants were allowed to take a break from the lecture. We applied our implementation of Trier Social Stress Test [45] (TSST) which is frequently used for inducing stress. We selected questions from the mathematics Olympics (which is very hard for the normal population). We told the subjects that this is a test for measuring their intelligence, and we said that a moderate person achieves at least a 75% score. Subjects participated in every session and they did not know the objective of the study. The physiological data is gathered with different brands of commercial smartwatches (8 Empatica E4, 3 Samsung Gear S and 17 Samsung Gear S2).
Ethics
The procedure of the methodology used in this study is approved by the Institutional Review Board for Research with Human Subjects of Bogaziçi University with the approval number 2018/16. Prior to the data acquisition, each participant received a consent form which explains the experimental procedure and its benefits and implications to both the society and the subject. The procedure was also explained vocally to the subject. The data collection procedure and all of the interventions in this research fully meet the 1964 Declaration of Helsinki [46]. The data is stored anonymously.
VI Experimental Results and Discussion
We examined the results in two different subsections. In the first one, we presented and evaluated the authentication results of different devices and the whole system performance. In the second part, by applying a signal data quality filter, we improved the performance of the system.
VI-A Effect of Device Type on the Biometric Authentication Performance
EER results for all 28 subjects are given in Table III. These results are calculated by one vs. all tests for all subjects. Average EER results for four different classifiers are presented in Table IV. We also added the device type and average data quality columns to this table. Data quality presents the non-interpolated percentage of the data after the removal of artifacts. As an example, if the average data quality is 70%, the remaining 30% of the data is interpolated. Data quality along with the device type affects the EER results significantly (see Figure 7). We achieved the best performance with Gear S as 98.48% and 3.96% EER. The selection of classifier has also an important effect on the EER results. For example, Empatica E4 achieves 19.43% EER with kNN and 6.77% with RF classifier. The best classifier is selected as RF in terms of EER. Design of the watch strap as shown in Figure 1, PPG sensor quality, built-in processing algorithms of devices might be the factors for the difference in EER results.
VI-B Effect of Data Quality Constraint Filter
Participant/Classifier kNN RF MLP LDA Device Average Quality P1 20.00 1.67 3.30 5.00 E4 96.00 P2 22.84 5.00 10.00 8.73 E4 94.00 P3 5.68 3.23 5.65 9.95 E4 96.00 P4 31.30 12.52 15.52 15.52 E4 93.00 P5 30.17 9.45 27.27 27.27 E4 91.50 P6 23.96 8.30 15.87 19.05 E4 97.00 P7 17.96 11.03 22.22 25.04 E4 92.00 P8 3.58 2.99 4.48 5.97 E4 93.00 P9 4.00 5.33 5.33 6.67 Gear S 87.00 P10 1.33 2.67 4.00 5.33 Gear S 95.00 P11 9.20 3.39 5.08 9.32 Gear S 80.00 P12 37.47 18.73 23.26 21.13 Gear S2 85.00 P13 30.15 10.41 21.13 22.54 Gear S2 80.00 P14 13.52 3.80 8.45 9.86 Gear S2 62.00 P15 31.35 4.69 12.50 17.19 Gear S2 68.00 P16 18.43 6.78 20.59 20.59 Gear S2 54.00 P17 36.25 18.23 27.78 29.17 Gear S2 64.00 P18 43.34 24.55 43.75 40.63 Gear S2 79.00 P19 21.88 2.82 8.45 11.27 Gear S2 69.00 P20 34.50 11.43 18.75 20.31 Gear S2 66.00 P21 39.30 19.55 21.13 22.54 Gear S2 66.00 P22 25.60 13.41 18.75 18.75 Gear S2 68.00 P23 31.67 14.08 23.94 21.13 Gear S2 62.00 P24 33.10 14.10 23.44 31.25 Gear S2 53.00 P25 20.81 7.04 15.49 19.72 Gear S2 65.00 P26 33.22 16.45 24.23 23.44 Gear S2 69.00 P27 37.48 20.54 28.17 29.58 Gear S2 76.00 P28 36.63 19.18 23.44 26.56 Gear S2 64.00
Device kNN RF MLP LDA Average Quality Empatica E4 19.43% 6.77% 13.03% 14.56% 94.06% Gear S 4.84% 3.96% 4.80% 7.10% 87.33% Gear S2 30.86% 13.28% 21.36% 22.68% 67.64% All Devices 24.37 % 10.08% 16.98% 18.69 % 77.30%
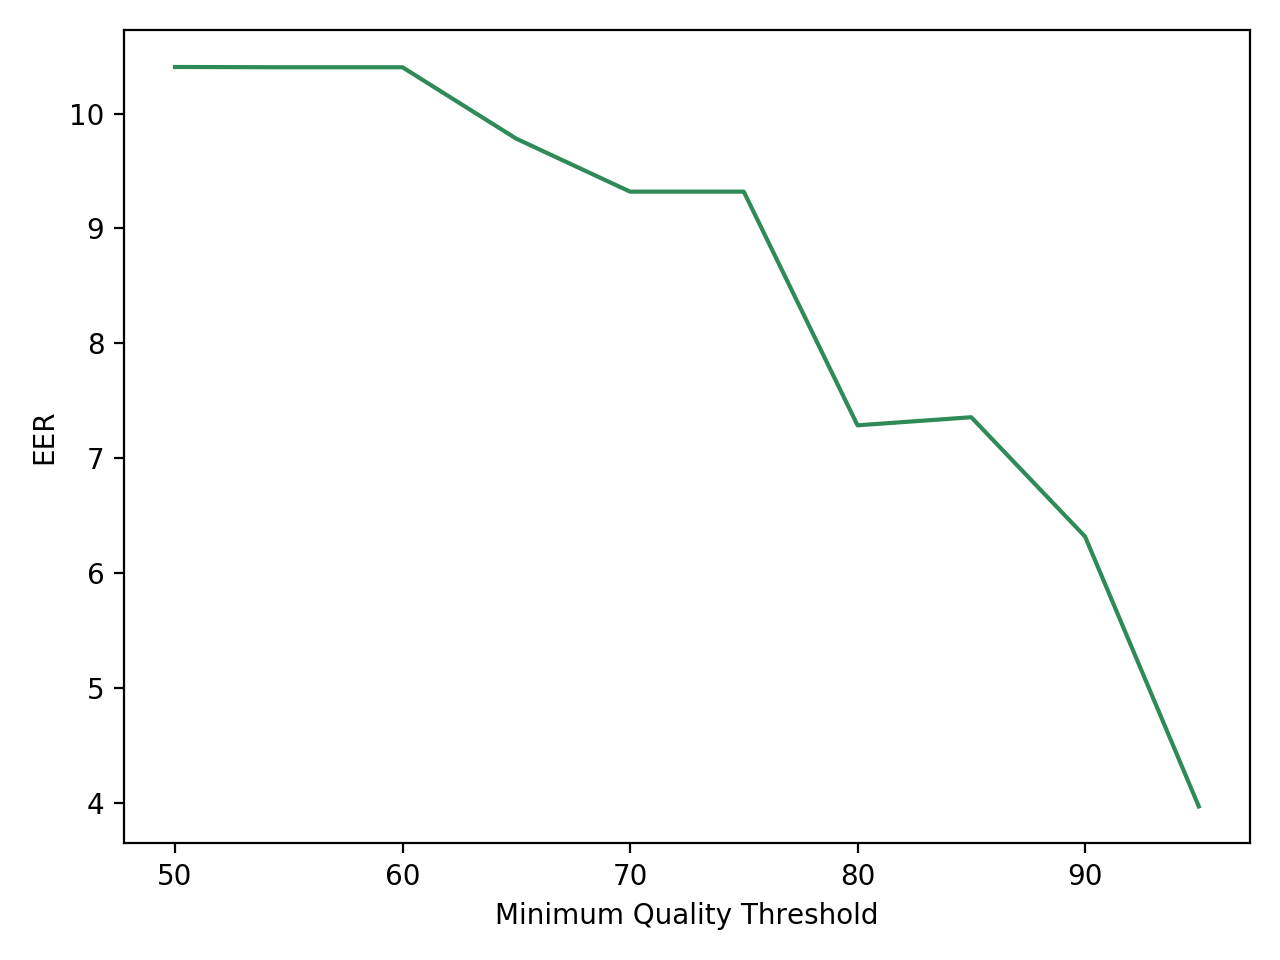
In daily life, seamless wrist-worn devices can get noisy signals, which drops the quality of the derived features. It is not possible to collect high-quality data all the time during a day because of various reasons such as high activity level and improper use of smartwatches. After observing that the data quality has a major effect on the authentication performance, we applied a data quality constraint on our data. Suppose that the data quality of a device is 50%. This means that the other half of the data is obtained by synthetic cubic interpolation data. Therefore, we expect that when the data is compared with other participants’ data, it could not be discriminated, because it lost most of the unique characteristics of the PPG data. In Figure 7, we evaluated the effect of a quality threshold on EER. As we investigate the EER results of different device types, Samsung Gear S gives the smallest error rate 3.796% when compared to Empatica E4 (6.77%) and Samsung Gear S2 (13.66%) in low data qualities. As the quality increases, while the error rates of Samsung Gear S (2.67%) and Empatica E4 (4.4%) decrease at 95% quality threshold, Samsung Gear S2 is unable to show the same progress and eventually reaches 18.557% equal error rate. None of the windows of Samsung Gear S2 has a higher than 95% quality. The performance evaluation shows that the proposed system can effectively authenticate with small and consistent error rate which makes it reliable.
VII Conclusion
We proposed a scalable, unobtrusive and seamless continuous authentication system with commercial grade smartwatches and smartbands. We collected physiological data from 28 participants and demonstrated the EER measures for each of the participants in a real-life scenario. We proposed state-of-the art preprocessing for signals coming from real-life data with artifacts due to the physical construction of the smartwatches. We achieved promising results by using our system (4.4% EER with Empatica E4). We showed the effect of different smartwatches. The selection of the classifier for the proposed system is very important. We applied feature based signal processing along with machine learning classifiers (kNN, RF, MLP and LDA). Even-though, Gear S2 is a newer model of Gear S, due to its leather strap, the signals coming from the heart rate monitoring unit contained higher amount of artifacts, therefore it affects the overall quality of the RR intervals and the authentication system’s performance. For the authentication systems based on PPG sensors, sport straps can be a better choice, as shown in Figure 1. We showed that HRV can be used for continuous authentication without interrupting the activity of the user. We applied a signal removal procedure by using the overall RR interval quality measure, a higher quality leads to better performance after 80% quality threshold. The performance of the scheme varies between individuals. This conclusion is aligned with the literature [14, 8]. The minimum required amount of recording to apply our system for authentication is 2 minutes, once that is satisfied, authentication can be validated in seconds thanks to the sliding window approach. It logouts the user, once he/she leaves off the watch. Our system can be implemented on any wrist-worn device which can provide RR intervals without a need for the raw PPG. The proposed methodology can be used with various applications requiring continuous authentication. This study also has some limitations. The performance of the system on the data coming from different days is still unknown. As future works, we plan to apply our system completely in the wild settings with more participants and longer physiological recordings and show the performance of the framework. All of the evaluations are done in the same context, therefore in different types of contexts, the system might achieve better performance.
References
- [1] A. C. Baktir, C. Tunca, A. Ozgovde, G. Salur, and C. Ersoy, “SDN-Based Multi-Tier Computing and Communication Architecture for Pervasive Healthcare,” IEEE Access, vol. 6, pp. 56765–56781, 2018.
- [2] C. Ntantogian, S. Malliaros, and C. Xenakis, “Gaithashing: A two-factor authentication scheme based on gait features,” Computers & Security, vol. 52, 04 2015.
- [3] Statista Research Department, “Internet of Things (IoT) connected devices installed base worldwide from 2015 to 2025 (in billions),” 2016.
- [4] S. W. Shah and S. S. Kanhere, “Recent trends in user authentication – a survey,” IEEE Access, vol. 7, pp. 112505–112519, 2019.
- [5] A. Ross, K. Nandakumar, and A. K. Jain, “Introduction to multibiometrics,” in Handbook of biometrics, pp. 271–292, Springer, 2008.
- [6] N. Akhter, H. Gite, G. Rabbani, and K. Kale, “Heart rate variability for biometric authentication using time-domain features,” in International Symposium on Security in Computing and Communication, pp. 168–175, Springer, 2015.
- [7] N. Akhter, J. F. Mahdi, and G. R. Manza, “Microcontroller based data acquisition system for heart rate variability (hrv) measurement,” International Journal of Applied Science and Engineering Research, vol. 1, no. 4, pp. 576–583, 2012.
- [8] D. Ramli, M. Hooi, and K. Chee, “Development of heartbeat detection kit for biometric authentication system,” vol. 96, pp. 305–314, 12 2016.
- [9] Y. S. Can, N. Chalabianloo, D. Ekiz, and C. Ersoy, “Continuous stress detection using wearable sensors in real life: Algorithmic programming contest case study,” Sensors, vol. 19, p. 1849, Apr. 2019.
- [10] K. Phua, J. Chen, T. H. Dat, and L. Shue, “Heart sound as a biometric,” Pattern Recognition, vol. 41, no. 3, pp. 906–919, 2008.
- [11] S. Pirbhulal, H. Zhang, S. Mukhopadhyay, C. Li, Y. Wang, G. Li, W. Wu, and Y.-T. Zhang, “An efficient biometric-based algorithm using heart rate variability for securing body sensor networks,” Sensors, vol. 15, no. 7, pp. 15067–15089, 2015.
- [12] Empatica, 2018. accessed at December 2019.
- [13] Samsung, 2019. accessed at December 2019.
- [14] S. Vhaduri and C. Poellabauer, “Multi-modal biometric-based implicit authentication of wearable device users,” IEEE Transactions on Information Forensics and Security, vol. 14, pp. 3116–3125, Dec. 2019.
- [15] Y. Sun and N. Thakor, “Photoplethysmography revisited: From contact to noncontact, from point to imaging,” IEEE Transactions on Biomedical Engineering, vol. 63, pp. 463–477, Mar. 2016.
- [16] M. Malik, J. T. Bigger, A. J. Camm, R. E. Kleiger, A. Malliani, A. J. Moss, and P. J. Schwartz, “Heart rate variability: Standards of measurement, physiological interpretation, and clinical use,” European Heart Journal, vol. 17, pp. 354–381, 03 1996.
- [17] “Kubios user guide,” 2019.
- [18] S. A. Elkader, M. Barlow, and E. Lakshika, “Wearable sensors for recognizing individuals undertaking daily activities,” in Proceedings of the 2018 ACM International Symposium on Wearable Computers - ISWC, ACM Press, 2018.
- [19] Y. Zeng, A. Pande, J. Zhu, and P. Mohapatra, “WearIA: Wearable device implicit authentication based on activity information,” in 2017 IEEE 18th International Symposium on A World of Wireless, Mobile and Multimedia Networks (WoWMoM), IEEE, June 2017.
- [20] S. Vhaduri and C. Poellabauer, “Wearable device user authentication using physiological and behavioral metrics,” Oct. 2017.
- [21] Y. Matsuyama, M. Shozawa, and R. Yokote, “Brain signal’s low-frequency fits the continuous authentication,” vol. 164, 03 2015.
- [22] S. Sarkar, V. M. Patel, and R. Chellappa, “Deep feature-based face detection on mobile devices,” in 2016 IEEE International Conference on Identity, Security and Behavior Analysis (ISBA), pp. 1–8, Feb 2016.
- [23] P. Musale, D. Baek, N. Werellagama, S. S. Woo, and B. J. Choi, “You walk, we authenticate: Lightweight seamless authentication based on gait in wearable IoT systems,” vol. 7, pp. 37883–37895, 2019.
- [24] G. Peng, G. Zhou, D. T. Nguyen, X. Qi, Q. Yang, and S. Wang, “Continuous authentication with touch behavioral biometrics and voice on wearable glasses,” IEEE Transactions on Human-Machine Systems, vol. 47, pp. 404–416, June 2017.
- [25] M. Ghayoumi, “A review of multimodal biometric systems: Fusion methods and their applications,” in 2015 IEEE/ACIS 14th International Conference on Computer and Information Science (ICIS), IEEE, June 2015.
- [26] R. Brunelli and D. Falavigna, “Person identification using multiple cues,” IEEE Transactions on Pattern Analysis and Machine Intelligence, vol. 17, pp. 955–966, Oct. 1995.
- [27] E. Camlikaya, A. Kholmatov, and B. Yanikoglu, “Multi-biometric templates using fingerprint and voice,” in Biometric Technology for Human Identification V (B. V. Kumar, S. Prabhakar, and A. A. Ross, eds.), SPIE, Mar. 2008.
- [28] M. Hammad, Y. Liu, and K. Wang, “Multimodal biometric authentication systems using convolution neural network based on different level fusion of ECG and fingerprint,” IEEE Access, vol. 7, pp. 26527–26542, 2019.
- [29] M. D. Bugdol and A. W. Mitas, “Multimodal biometric system combining ECG and sound signals,” Pattern Recognition Letters, vol. 38, pp. 107–112, Mar. 2014.
- [30] Q. Gui, Z. Jin, and W. Xu, “Exploring EEG-based biometrics for user identification and authentication,” in 2014 IEEE Signal Processing in Medicine and Biology Symposium (SPMB), IEEE, Dec. 2014.
- [31] M. Rangoussi, N. Alexandris, A. Evangelou, and M. Poulos, “Person identification from the EEG using nonlinear signal classification,” Methods of Information in Medicine, vol. 41, no. 01, pp. 64–75, 2002.
- [32] C. ZHANG, Y.-M. TIAN, and H.-W. WANG, “Review of ECG signal identification research,” DEStech Transactions on Computer Science and Engineering, Mar. 2017.
- [33] H.-S. Choi, B. Lee, and S. Yoon, “Biometric authentication using noisy electrocardiograms acquired by mobile sensors,” IEEE Access, vol. 4, pp. 1266–1273, 2016.
- [34] A. Sarkar, A. L. Abbott, and Z. Doerzaph, “Biometric authentication using photoplethysmography signals,” in 2016 IEEE 8th International Conference on Biometrics Theory, Applications and Systems (BTAS), IEEE, Sept. 2016.
- [35] A. Acar, H. Aksu, A. S. Uluagac, and K. Akkaya, “Waca: Wearable-assisted continuous authentication,” in 2018 IEEE Security and Privacy Workshops (SPW), pp. 264–269, May 2018.
- [36] Tizen, Tizen API, 2015. accessed at December 2018.
- [37] MATLAB, version 7.10.0 (R2010a). Natick, Massachusetts: The MathWorks Inc., 2010.
- [38] B. Cinaz, B. Arnrich, R. Marca, and G. Tröster, “Monitoring of mental workload levels during an everyday life office-work scenario,” Personal Ubiquitous Comput., vol. 17, pp. 229–239, Feb. 2013.
- [39] M. Vollmer, MarcusVollmer/HRV Toolbox, 2017. accessed at December 2019.
- [40] M. Gjoreski, M. Luštrek, M. Gams, and H. Gjoreski, “Monitoring stress with a wrist device using context,” Journal of biomedical informatics, vol. 73, pp. 159–170, 2017.
- [41] D. Barber, Bayesian Reasoning and Machine Learning. Cambridge University Press, 2012.
- [42] F. Eibe, M. Hall, and I. Witten, “The weka workbench. online appendix for” data mining: Practical machine learning tools and techniques,” Morgan Kaufmann, 2016.
- [43] S. Kotsiantis, D. Kanellopoulos, and P. Pintelas, “Handling imbalanced datasets: A review,” GESTS International Transactions on Computer Science and Engineering, vol. 30, pp. 25–36, 11 2005.
- [44] S. Mondal, “Performance evaluation of continuous authentication systems,” IET Biometrics, 09 2015.
- [45] C. Kirschbaum, K.-M. Pirke, and D. H. Hellhammer, “The ‘trier social stress test’–a tool for investigating psychobiological stress responses in a laboratory setting,” Neuropsychobiology, vol. 28, no. 1-2, pp. 76–81, 1993.
- [46] W. M. Association et al., “World medical association declaration of helsinki. ethical principles for medical research involving human subjects.,” Bulletin of the World Health Organization, vol. 79, no. 4, p. 373, 2001.
![[Uncaptioned image]](/html/1912.04760/assets/image1.jpg) |
Deniz Ekiz received the MS degree from Computer Engineering Department, Bogazici University, Turkey in 2019. He is a Ph.D. candidate in the Computer Engineering Department of Bogaziçi University, Turkey. His research is focused on the health-related applications of wearable technology |
![[Uncaptioned image]](/html/1912.04760/assets/image2.jpg) |
Yekta Said Can studied Computer Engineering in Bogazici University, Istanbul, Turkey where he obtained his B.Sc Degree in 2012. He obtained his M.Sc degree in the same department, in 2014 while working as a researcher at TUBITAK BILGEM for two years. He is pursuing a PhD degree right now in Computer Engineering at Bogazici University. His research interest includes watermarking, speech and speaker recognition, physiological signal processing and machine learning. |
![[Uncaptioned image]](/html/1912.04760/assets/image3.jpg) |
Yagmur Ceren Dardagan is a senior student in Computer Engineering Department of Bogazici University, Turkey. Her research interests include physiological signal processing, machine learning and pervasive health applications. |
![[Uncaptioned image]](/html/1912.04760/assets/image4.jpg) |
Cem Ersoy received the Ph.D. degree from Polytechnic University, New York in 1992. He was an R&D Engineer in NETAS A. S. from 1984 to 1986. He is a Professor of computer engineering at Bogazici University, Turkey. He is also the Vice Director of the Telecommunications and Informatics Technologies Research Center, TETAM. His research interests include wireless/cellular/ad-hoc/sensor networks, activity recognition, and ambient intelligence for pervasive health applications, green 5G and beyond networks, and mobile cloud/edge/fog computing. He was the Chairman of the IEEE Communications Society Turkish Chapter eight years. He is a member of the IFIP. |