Acoustic response of a laser-excited polycrystalline Au-film studied by ultrafast Debye-Scherrer diffraction at a table-top short-pulse X-ray source
Abstract
The transient acoustic response of a free-standing, polycrystalline thin Au film upon femtosecond optical excitation has been studied by time-resolved Debye-Scherrer X-ray diffraction using ultrashort Cu Kα X-ray pulses from a laser-driven plasma X-ray source. The temporal strain evolution has been determined from the transient shifts of multiple Bragg diffraction peaks. The experimental data are in good agreement with the results of calculations based on the two-temperature model and an acoustic model assuming uni-axial strain propagation in the laser-excited thin film.
I Introduction
Due to the rapid progress in the development of short pulse X-ray and electron sources the field of ultrafast structural dynamics has seen dramatic progress in the last two decades (e.g. refs. 1; 2 and references therein). With respect to X-rays large-scale facilities as X-ray free electron lasers (XFELs) define the current state-of-the-artBostedt et al. (2016); Dunne (2018); Chapman (2019), but laser-plasma based X-ray sources still represent an interesting alternative due to their simplicity, versatility, low cost and accessibility. In fact, these table-top, lab-scale sources have enabled the first ultrafast (i.e. femtosecond) time-resolved X-ray diffraction experiments (e.g. refs. 6; 7; 8; 9) and are still the subject of intense developments to improve their efficiency Weisshaupt et al. (2014) or to reach higher photon energiesFourmaux and Kieffer (2016); Azamoum et al. (2018a, b).
Due to their comparably much lower X-ray flux these sources have been mainly used to study single-crystalline materials which provide strong diffraction signals in a reflective Bragg-geometry. However, laser-pump X-ray probe experiments often require thin film samples to match the thickness of the optically excited layer to the X-ray probing depth. Since not all materials can be grown as high quality single crystals in thin film form the range of materials, that can be studied with this approach, is limited.
In contrast, for most materials polycrystalline films can be prepared much easier. In this case the random orientation of crystallites in the sample allows to use the well-known Debye-Scherrer schemeDebye and Scherrer (1916). While the scattering signal is distributed over a diffraction ring (instead of localized diffraction spots) this scheme represents a much simpler approach since no precise sample adjustments (i.e. Bragg-angle) are necessary and the signal of several Bragg-peaks can be recorded simultaneously. Debye-Scherrer diffraction is easy to realize at sources that provide high X-ray flux as well as a collimated beam like synchrotrons or XFELs, enabling even single-pulse detection of diffraction patterns with high signal-to-noise (e.g. refs. 15; 16; 17).
The situation is much more challenging for laser-plasma based X-ray sources not only due to their lower X-ray flux, but also because of their spatially incoherent, full-solid-angle emission. Therefore, use of an appropriate X-ray optic, which collects and (quasi-)collimates the radiation is mandatory to enable this approach Bargheer et al. (2005); Shymanovich et al. (2008, 2009); Zamponi et al. (2010); Rathore et al. (2017); Schollmeier et al. (2018). Successful application of ultrafast Debye-Scherrer diffraction at a laser-plasma based X-ray source has been recently demonstrated by measuring transient changes of electron density for thick (10 -100 m) powder samples of ionic crystalsZamponi et al. (2010, 2012); Hauf et al. (2019).
Here we present the application of time-resolved Debye-Scherrer diffraction at a femtosecond laser-plasma based X-ray source for the study of structural dynamics in a thin sample, namely the acoustic response of a 200 nm, polycrystalline Au-film upon ultrafast optical excitation. From the measured changes of the Debye-Scherrer diffraction patterns, in particular the time-dependent shift of multiple Bragg-peaks, we determine the transient strain evolution in the sample. The measured data are in good agreement with calculations using the two-temperature-model to estimate the time-dependent pressure/stress and an acoustic model assuming uni-axial strain wave propagation in the film.
II Experimental scheme and data
The experiments were performed using a table-top laser-plasma based Cu Kα X-ray source and the principle scheme of the experimental setup is shown in Fig. 1(a). Short bursts of Cu Kα radiation at 8 keV were produced by focusing femtosecond laser pulses (repetition rate 10 Hz, pulse energy 150 mJ, pulse duration 120 fs, wavelength 800 nm) onto the surface of a moving 10 m thick copper tape housed in a small vacuum chamber. A pre-pulse scheme is employed to optimize X-ray production Bastiani et al. (1997); Lu et al. (2009), resulting in a total Cu Kα-flux of more than photons per pulse.
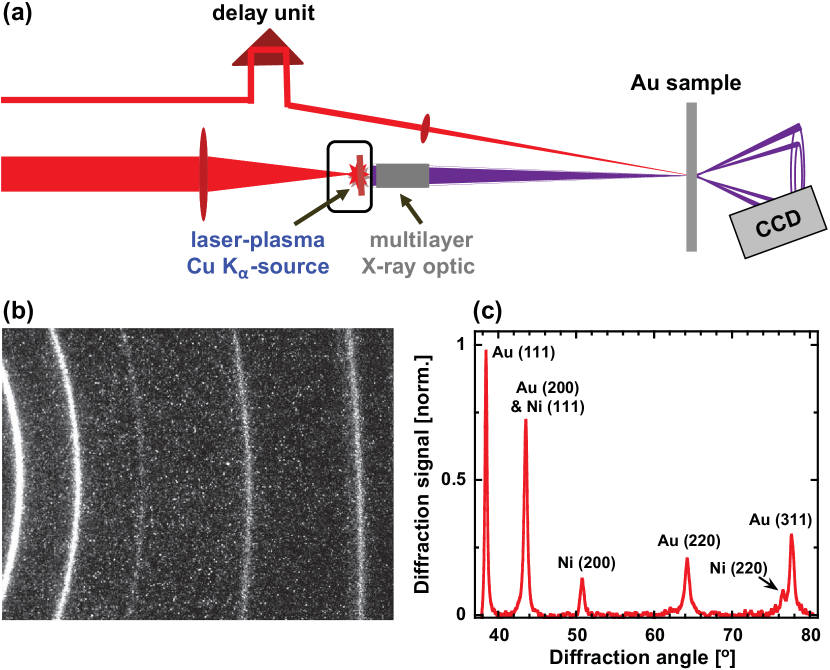
Since the X-rays are emitted into the full solid angle we used a graded multi-layer Montel-type X-ray mirrorosm to collect the emitted Kα radiation from the backside of the tape-target and to image the source onto the sample under study. With a magnification of 5 more than Kα photons per pulse are delivered to the sample in a quasi-collimated beam of 0.23∘ con-/divergence and a spot size of about 140 m. The sample - a 200 nm free standing polycrystalline Au film supported by a Ni-meshleb - is optically excited by a small fraction split off from the main laser beam. With a laser spot diameter (FWHM) of 400 m on the sample, which is approximately 3 larger than the X-ray probe beam, the measured X-ray signals represent the response of a homogeneously excited region. Transient diffraction patterns, typically accumulated over 3000 pulses (5 min. integration time), were recorded with a single-photon sensitive phosphor-based X-ray area detector (Photonic Science X-Ray Gemstar HS) as a function of time delay between the optical pump pulse (peak fluence 160 mJ/cm2) and the X-ray probe. In order to simultaneously record as many diffraction orders as possible, the detector was placed close to the sample (distance 38 mm) and not normal to the direct X-ray beam, but at a shallow angle of 28∘. This allowed us to cover an angular range of (: diffraction angle measured with respect to the incoming X-ray beam; see also Fig. 3(a)).
A typical Debye-Scherrer diffraction pattern of the Au-film, as recorded by the X-ray area detector, is depicted in Fig. 1(b). The corresponding diffraction profile , obtained by azimuthal integration, is presented in Fig. 1(c). The four lowest order diffraction peaks of Au can be clearly identified, as well as some (weaker) diffraction peaks of the supporting Ni-mesh (all diffraction peaks are labelled by their Miller indices in Fig. 1c).
In the analysis of the time-resolved data we focused on the two higher order diffraction peaks, namely the (220)- and the (311)-reflection, because of the larger magnitude of the laser-induced changes as compared to the low order peaks. For the (111)-reflection we determined only the maximum shift (see Fig. 3(b)), while the (200)-reflection could not be properly analyzed due to overlap with the Ni (111)-reflection. Results are presented in Fig. 2(a), which shows a zoom-in of the diffraction profiles of the (220)- and (311)-reflection without (blue data points) and with (red data points) laser-pumping at a pump-probe time delay of 70 ps.
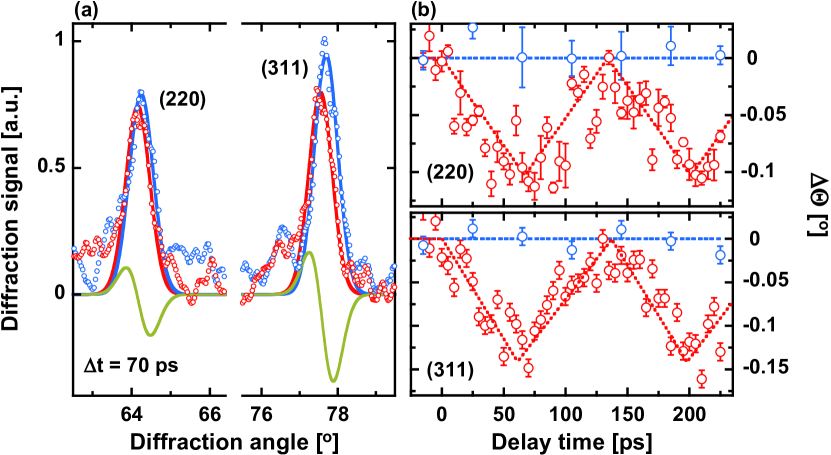
Upon pumping both diffraction peaks shift towards smaller diffraction angles and are also slightly reduced in amplitude. To quantify the shift, the Bragg-peaks have been fitted by a Gaussian function. However, to eliminate any effects on the fitting due to the noisy background as well as the adjacent Ni (220)-peak, only data points with an intensity above 30% of the corresponding peak maximum have been used for fitting. The results of such fits are shown as red (with pump) and blue (without pump) solid lines in Fig. 2(a). The derivative-like shape of the difference of these fits (green solid curve in Fig. 2(a)) emphasizes that the peak shift represents the main pump-induced effectDW and the following analysis will focus on this.
Fig. 2(b) shows the angular shift (red data points) of the (220) (top) and the (311) Bragg peaks, respectively, as a function of time delay, as obtained from the fitting procedure described above. The blue data points are the results of reference measurements without pumping made over the course of the experiment at the given delay setting. The dashed curves represent guides to the eye. The temporal evolution of the angular position of both diffraction peaks exhibits a pronounced oscillatory behavior with a half-period of ps. As will be discussed in the following section, this can be attributed to strain waves propagation back and forth in the thin Au-film.
III Strain analysis and modelling
A shift of the diffraction peaks towards smaller diffraction angles indicates lattice expansion, i.e. positive strain (: lattice constant). This expansion is driven by a fast, laser-induced increase of pressure, which has electronic and thermal contributionsWright (1994), as will be outlined in more detail below. Relaxation of the excess pressure/stress occurs by one-dimensional, longitudinal strain waves propagating normal to the surfaceThomsen et al. (1986), because the film thickness of nominal 200 nm is much smaller than the laser excited area (diameter 400 m). To deduce the transient strain from the measured peak shift one needs to consider, that in Debye-Scherrer configuration scattering at a particular scattering angle occurs by a subset of all crystallites which are oriented such that the Bragg-condition is fulfilled for a particular Bragg-peak (hkl) with . The corresponding scattering diagram is depicted in Fig. 3(a).
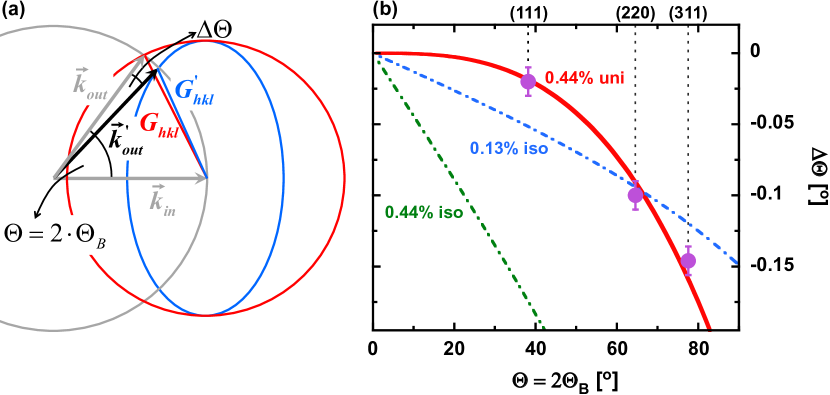
Herein and (grey) denote the wave-vector of the incoming and scattered X-rays, respectively. There end-points lie on the so-called Ewald-sphere (grey circle). For a polycrystalline sample with randomly orientied crystallites, the corresponding reciprocal lattice vectors lie on a sphere with radius (red circle). Where this sphere cuts the Ewald-sphere, the Bragg-condition is fulfilled, leading to scattering at .
When the film is uniaxially expanded () along the surface normal, which equals the direction of , the sphere with radius is compressed in this direction into an ellipsoid (blue) with short axis . Now the Bragg-condition is fulfilled where this ellipsoid cuts the Ewald-sphere corresponding to a differently oriented subset of crystallites. Scattering, therefore, occurs at a different direction (black) leading to an angular shift . According to Fig. 3(b) simple geometrical considerations lead toLu (2013); Wittenberg et al. (2014):
| (1) |
Fig. 3(b) compares the measured maximum shift of the (111)-, (220)-, and (311)-reflection (violet data points; the (200)-peak could not be analyzed due to overlap with the strong (111)-peak of Ni) to calculations for different strain conditions. The blue and green-dashed curves represent the expected angular shifts assuming isotropic strain of 0.13% (blue) and 0.44% (green) (), respectively, which are obviously unable to describe the measured data. In contrast, good agreement is found using eq. 1 with a strain of 0.44% (red solid curve), giving clear evidence that the laser-driven expansion of the film is indeed uniaxial. Applying eq. 1 also to the measured time-dependent shifts of the (220)- and (311)-peaks (compare Fig. 2(b)) the strain as a function of pump-probe time-delay can be obtained, as depicted in Fig. 4(a). Similar as the measured angular shifts the time dependent strain exhibits an (undamped - over the measured delay range) of oscillatory behavior with a half-period of ps.
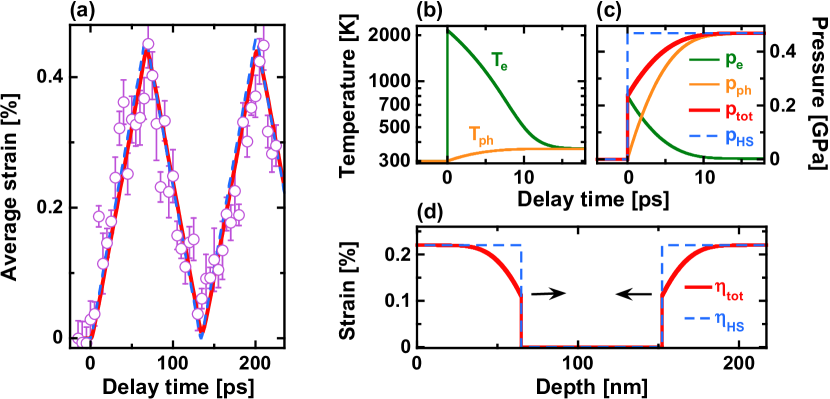
As mentioned above, this oscillatory behavior is caused by strain waves travelling back and forth in the Au film. The half-period of ps corresponds to the time such a strain wave needs to propagate (with the speed of sound ) through the full film thickness once. With = 3.24 km/s for polycrystalline AuLide (2005) this allows to determine the actual film thickness nm, in good agreement with the nominal film thickness and the 10% thickness tolerance specified by the manufacturer.
To quantitatively model the response of the Au-film we applied the two-temperature-modelAnisimov, Kapeliovich, and Perel’man (1974) (TTM) in combination with a solution of the one-dimensional elastic equationsThomsen et al. (1986). The relevant TTM-parameters are a constant lattice specific heat of MJ/(m3K)Lide (2005), an electronic specific heat with J/(m3K2)Wright (1994) and an electron-phonon coupling paramter W/(m3K)Sokolowski-Tinten et al. (2017). For simplicity we assume that laser excitation leads to an (i) instantaneous and (ii) spatially homogenous increase of the electronic temperature in the film, which is justified by (i) the relatively weak electron-phonon coupling, leading to correspondingly long electron-lattice equilibration times of a few psSokolowski-Tinten et al. (2017), and (ii) the very efficient, ballistic/superdiffusive electronic transport in AuHohlfeld et al. (1997, 2000). Results of such calculations are shown in Fig. 4(b) for an asymptotic rise in lattice temperature K (see below), corresponding to an initial electron temperature K.
Both, the changes of the electronic and the lattice temperature cause an increase of pressure (isotropic stress) in the material, which can be expressed asWright (1994) . Herein and denote the electronic and lattice Grüneisen parameter, respectively, with Barron, Collins, and White (1980) and Sokolowski-Tinten et al. (2017). The resulting time-dependent electronic () and thermal () pressure contributions are depicted in Fig. 4(c) as the green and orange curve, respectively. The total pressure (red curve) is then used to solve the one-dimensional elastic equationsThomsen et al. (1986). In this model the peak strain is given by:
| (2) |
Herein GPa denote the bulk modulusAnderson, Isaak, and Yamamoto (1989), K-1 the linear thermal expansion coefficientAnderson, Isaak, and Yamamoto (1989), g/cm3 the density, and = 3.24 km/s the sound velocityLide (2005) of Au. Eq. 2 together with the measured % results in K, the value that has been used in the TTM-calculations.
Results of the acoustic modelling are presented in Fig. 4(d), which shows the calculated strain profile at ps. Since the experiments have been carried out on a free-standing film, strain waves with an equal amplitude of are launched at both film surfaces, which propagate into the film. At the chosen time of ps they have travelled less than 1/3 of the film thickness and are, therefore, still spatially separated. The spatial shape of each pulse reflects the temporal evolution of the total pressure . At later times both pulses overlap and when approaching the opposite (free) surface they are reflected with a sign change (wave reflection at an open end).
Since the time-dependent spatial strain distribution is inhomogeneous, the changes of the X-ray diffraction patterns are characterized by angular shifts as well as changes in shape (e.g. broadening) of the rocking curves of individual diffraction peaksNicoul et al. (2011). However, due to the large angular width of the Bragg-peaks of about 0.7∘ in our experiment such shape changes of the rocking curves can not be resolved. As a result, the measured shifts represent the average strain in the film at a given time, as presented in Fig. 4(a). The average strain, as determined from the acoustic model calculations (red solid curve in Fig. 4(a)) agrees very well with the experimental data.
Over the measured delay range the strain oscillations are undamped, as has been already emphasized above. This is a consequence of having a free-standing film as sample, where the acoustic pulses exhibit total reflection at the free surfaces. In contrast, strain waves in thin films on substrates are (partially - depending on the difference in acoustic impedance between film and substrate) transmitted into the substrate upon each round-trip and experience, therefore, dampingNicoul et al. (2011).
We also performed the acoustic modelling with a simplified pressure evolution, namely an instantaneous increase at (equivalent to an infinitely fast electron-phonon coupling and/or equal Grüneisen parameters), as indicated by the blue-dashed curve in Fig. 4(c). The resulting strain pulses (now exhibiting a rectangular shape) and the corresponding time-dependence of the average strain are depicted by the blue-dashed curves in Figs. 4(d) and 4(a), respectively. With the given accuracy our current data do not allow to discriminate between the two scenarios. However, our previous experiments on an epitaxial Au-filmNicoul et al. (2011) provided clear evidence, that the finite electron-phonon coupling as well as the difference of the Grüneisen parameters need to be taken into account to properly interpret the observed acoustic response.
IV Summary
In summary, we have used ultrafast time-resolved Debye-Scherrer diffraction to study the acoustic response of a free standing polycrystalline Au film upon femtosecond optical excitation. From the measured shifts of different Bragg-peaks the transient strain evolution in the film has been determined, which follows the behavior expected from longitudinal acoustic waves propagating normal to the surface of the free standing sample. Very good quantitative agreement is found with the results of calculations based on the two-temperature model and a solution of the one-dimensional acoustic equations taking into account electronic and thermal contributions to the laser-induced pressure/stress. Our results demonstrate the feasibility of time-resolved Debye-Scherrer diffraction experiments on thin solid samples (where film thickness and excitation depth are matched) using a laser-plasma based X-ray source. This considerably extends the range of materials for which Debye-Scherrer diffraction at such sources can be applied, in particular when future prospects to increase their efficienyWeisshaupt et al. (2014) are considered.
Acknowledgements.
Financial support by the Deutsche Forschungsgemeinschaft (DFG, German Research Foundation) through project C01 Structural Dynamics in Impulsively Excited Nanostructures of the Collaborative Research Center SFB 1242 Non-Equilibrium Dynamics of Condensed Matter in the Time Domain (project number 278162697) is gratefully acknowledged.References
- Schoenlein et al. (2019) R. Schoenlein, T. Elsaesser, K. Holldack, Z. Huang, H. Kapteyn, M. Murnane, and M. Woerner, “Recent advances in ultrafast X-ray sources,” Philosophical Transactions of the Royal Society A: Mathematical, Physical and Engineering Sciences 377, 20180384 (2019).
- Sciaini (2019) G. Sciaini, “Recent advances in ultrafast structural techniques.” Appl. Sci. 9, 1427 (2019).
- Bostedt et al. (2016) C. Bostedt, S. Boutet, D. M. Fritz, Z. Huang, H. J. Lee, H. T. Lemke, A. Robert, W. F. Schlotter, J. J. Turner, and G. J. Williams, “Linac Coherent Light Source: The first five years,” Rev. Mod. Phys. 88, 015007 (2016).
- Dunne (2018) M. Dunne, “X-ray free-electron lasers light up materials science,” Nature Rev. Mat. 3, 290 (2018).
- Chapman (2019) H. N. Chapman, “X-ray free-electron lasers for the structure and dynamics of macromolecules,” Annu. Rev. Biochem. 88, 35 (2019).
- Rischel et al. (1997) C. Rischel, A. Rousse, I. Uschmann, P.-A. Albouy, J.-P. Geindre, P. Audebert, J.-C. Gauthier, E. Fröster, J.-L. Martin, and A. Antonetti, “Femtosecond time-resolved X-ray diffraction from laser-heated organic films,” Nature 390, 490 (1997).
- Rose-Petruck et al. (1999) C. Rose-Petruck, R. Jimenez, T. Guo, A. Cavalleri, C. W. Siders, F. Rksi, J. A. Squier, B. C. Walker, K. R. Wilson, and C. P. J. Barty, “Picosecond–milliångström lattice dynamics measured by ultrafast X-ray diffraction,” Nature 398, 310 (1999).
- Rousse et al. (2001) A. Rousse, C. Rischel, S. Fourmaux, I. Uschmann, S. Sebban, G. Grillon, P. Balcou, E. Förster, J. P. Geindre, P. Audebert, J. C. Gauthier, and D. Hulin, “Non-thermal melting in semiconductors measured at femtosecond resolution,” Nature 410, 65 (2001).
- Sokolowski-Tinten et al. (2003) K. Sokolowski-Tinten, C. Blome, J. Blums, A. Cavalleri, C. Dietrich, A. Tarasevitch, I. Uschmann, E. Förster, M. Kammler, M. Horn-von Hoegen, and D. von der Linde, “Femtosecond X-ray measurement of coherent lattice vibrations near the lindemann stability limit,” Nature 422, 287 (2003).
- Weisshaupt et al. (2014) J. Weisshaupt, V. Juvé, M. Holtz, S. Ku, M. Woerner, T. Elsaesser, S. Ališauskas, A. Pugžlys, and A. Baltuška, “High-brightness table-top hard X-ray source driven by sub-100-femtosecond mid-infrared pulses,” Nat. Photonics 8, 927 (2014).
- Fourmaux and Kieffer (2016) S. Fourmaux and J. C. Kieffer, “Laser-based Kα X-ray emission characterization using a high contrast ratio and high-power laser system,” Appl. Phys. B 122, 162 (2016).
- Azamoum et al. (2018a) Y. Azamoum, R. Clady, A. Ferré, M. Gambari, O. Utéza, and M. Sentis, “High photon flux Kα Mo X-ray source driven by a multi-terawatt femtosecond laser at 100 Hz,” Opt. Lett. 43, 3574 (2018a).
- Azamoum et al. (2018b) Y. Azamoum, V. Tcheremiskine, R. Clady, A. Ferré, L. Charmasson, O. Utéza, and M. Sentis, “Impact of the pulse contrast ratio on Molybdenum Kα generation by ultrahigh intensity femtosecond laser solid interaction,” Sci. Rep. 8, 4119 (2018b).
- Debye and Scherrer (1916) P. Debye and P. Scherrer, “Interferenz an regellos orientierten Teilchen im Röntgenlicht i,” Physikalische Zeitschrift 17, 277 (1916).
- Wittenberg et al. (2014) J. S. Wittenberg, T. A. Miller, E. Szilagyi, K. Lutker, F. Quirin, W. Lu, H. Lemke, D. Zhu, M. Chollet, J. Robinson, H. Wen, K. Sokolowski-Tinten, A. P. Alivisatos, and A. M. Lindenberg, “Real-time visualization of nanocrystal solid–solid transformation pathways,” Nano Lett. 14, 1995 (2014).
- Gleason et al. (2015) A. E. Gleason, C. A. Bolme, H. J. Lee, B. Nagler, E. Galtier, D. Milathianaki, J. Hawreliak, R. G. Kraus, J. H. Eggert, D. E. Fratanduono, G. W. Collins, R. Sandberg, W. Yang, and W. L. Mao, “Ultrafast visualization of crystallization and grain growth in shock-compressed SiO2,” Nat. Commun. 6, 8191 (2015).
- Zalden et al. (2019) P. Zalden, F. Quirin, M. Schumacher, J. Siegel, S. Wei, A. Koc, M. Nicoul, M. Trigo, P. Andreasson, H. Enquist, M. J. Shu, T. Pardini, M. Chollet, D. Zhu, H. Lemke, I. Ronneberger, J. Larsson, A. M. Lindenberg, H. E. Fischer, S. Hau-Riege, D. A. Reis, R. Mazzarello, M. Wuttig, and K. Sokolowski-Tinten, “Femtosecond X-ray diffraction reveals a liquid–liquid phase transition in phase-change materials,” Science 364, 1062 (2019).
- Bargheer et al. (2005) M. Bargheer, N. Zhavoronkov, R. Bruch, H. Legall, H. Stiel, M. Woerner, and T. Elsaesser, “Comparison of focusing optics for femtosecond X-ray diffraction,” Appl. Phys. B 80, 715 (2005).
- Shymanovich et al. (2008) U. Shymanovich, M. Nicoul, K. Sokolowski-Tinten, A. Tarasevitch, C. Michaelsen, and D. von der Linde, “Characterization and comparison of X-ray focusing optics for ultrafast X-ray diffraction experiments,” Appl. Phys. B 92, 493 (2008).
- Shymanovich et al. (2009) U. Shymanovich, M. Nicoul, W. Lu, S. Kähle, A. Tarasevitch, K. Sokolowski-Tinten, and D. von der Linde, “Toward ultrafast time-resolved Debye–Scherrer X-ray diffraction using a laser-plasma source,” Rev. Sci. Instrum. 80, 083102 (2009).
- Zamponi et al. (2010) F. Zamponi, Z. Ansari, M. Woerner, and T. Elsaesser, “Femtosecond powder diffraction with a laser-driven hard X-ray source,” Opt. Express 18, 947 (2010).
- Rathore et al. (2017) R. Rathore, V. Arora, H. Singhal, T. Mandal, J. A. Chakera, and P. A. Naik, “Experimental and numerical study of ultra-short laser-produced collimated Cu Kα X-ray source,” Laser Part. Beams 35, 442 (2017).
- Schollmeier et al. (2018) M. Schollmeier, T. Ao, E. S. Field, B. R. Galloway, P. Kalita, M. W. Kimmel, D. V. Morgan, P. K. Rambo, J. Schwarz, J. E. Shores, I. C. Smith, C. S. Speas, J. F. Benage, and J. L. Porter, “Polycapillary X-ray lenses for single-shot, laser-driven powder diffraction,” Rev. Sci. Instrum. 89, 10F102 (2018).
- Zamponi et al. (2012) F. Zamponi, P. Rothhardt, J. Stingl, M. Woerner, and T. Elsaesser, “Ultrafast large-amplitude relocation of electronic charge in ionic crystals,” Proc. Nat. Acad. Sc. 109, 5207 (2012).
- Hauf et al. (2019) C. Hauf, A.-A. Hernandez Salvador, M. Holtz, M. Woerner, and T. Elsaesser, “Phonon driven charge dynamics in polycrystalline acetylsalicylic acid mapped by ultrafast X-ray diffraction,” Structural Dynamics 6, 014503 (2019).
- Bastiani et al. (1997) S. Bastiani, A. Rousse, J. P. Geindre, P. Audebert, C. Quoix, G. Hamoniaux, A. Antonetti, and J. C. Gauthier, “Experimental study of the interaction of subpicosecond laser pulses with solid targets of varying initial scale lengths,” Phys. Rev. E 56, 7179 (1997).
- Lu et al. (2009) W. Lu, M. Nicoul, U. Shymanovich, A. Tarasevitch, P. Zhou, K. Sokolowski-Tinten, D. von der Linde, M. Mašek, P. Gibbon, and U. Teubner, “Optimized Kα X-ray flashes from femtosecond-laser-irradiated foils,” Phys. Rev. E 80, 026404 (2009).
- (28) Manufacturer: OSMIC - Rigaku (www.rigaku.com/en/products/optics/cmf).
- (29) Manufacturer: Lebow Company.
- (30) The limited accuracy of the experiment did not allow to determine the reduction of the Bragg-peak intensities due to the Debye-Waller effect. In fact, using published temperature-dependent Debye-Waller factors for AuSyneček, Chessin, and Simerska (1970); Gao and Peng (1999) the reduction of the peak intensity expected for a temperature rise of 61 K is only 4% for the (311)-reflection, the highest order reflection we did measure.
- Syneček, Chessin, and Simerska (1970) V. Syneček, H. Chessin, and M. Simerska, “The temperature dependence of lattice vibrations in Gold from X-ray diffraction measurements,” Act. Cryl. A 26, 108 (1970).
- Gao and Peng (1999) H. X. Gao and L.-M. Peng, “Parameterization of the temperature dependence of the Debye–Waller factors,” Act. Cryst. A 55, 926 (1999).
- Wright (1994) O. B. Wright, “Ultrafast nonequilibrium stress generation in Gold and Silver,” Phys. Rev. B 49, 9985 (1994).
- Thomsen et al. (1986) C. Thomsen, H. T. Grahn, H. J. Maris, and J. Tauc, “Surface generation and detection of phonons by picosecond light pulses,” Phys. Rev. B 34, 4129 (1986).
- Lu (2013) W. Lu, Ultrafast time-resolved X-ray diffraction using an optimized laser-plasma based X-ray source, Ph.D. thesis, University of Duisburg-Essen (2013).
- Lide (2005) D. R. Lide, ed., CRC Handbook of Chemistry and Physics (CRC Press, 2005).
- Anisimov, Kapeliovich, and Perel’man (1974) S. Anisimov, B. Kapeliovich, and T. Perel’man, “Electron emission from metal surfaces exposed to ultrashort laser pulses,” Sov. Phys.-JETP 39, 375 (1974).
- Sokolowski-Tinten et al. (2017) K. Sokolowski-Tinten, X. Shen, Q. Zheng, T. Chase, R. Coffee, M. Jerman, R. K. Li, M. Ligges, I. Makasyuk, M. Mo, A. H. Reid, B. Rethfeld, T. Vecchione, S. P. Weathersby, H. A. Dürr, and X. J. Wang, “Electron-lattice energy relaxation in laser-excited thin-film Au-insulator heterostructures studied by ultrafast MeV electron diffraction,” Struct. Dynamics 4, 054501 (2017).
- Hohlfeld et al. (1997) J. Hohlfeld, J. Müller, S.-S. Wellershoff, and E. Matthias, “Time-resolved thermoreflectivity of thin Gold films and its dependence on film thickness,” Appl. Phys. B 64, 387 (1997).
- Hohlfeld et al. (2000) J. Hohlfeld, S.-S. Wellershoff, J. Güdde, U. Conrad, V. Jähnke, and E. Matthias, “Electron and lattice dynamics following optical excitation of metals,” Chem. Phys. 251, 237 (2000).
- Barron, Collins, and White (1980) T. Barron, J. Collins, and G. White, “Thermal expansion of solids at low temperatures,” Adv. Phys. 29, 609 (1980).
- Anderson, Isaak, and Yamamoto (1989) O. L. Anderson, D. G. Isaak, and S. Yamamoto, “Anharmonicity and the equation of state for Gold,” J. Appl. Phys. 65, 1534 (1989).
- Nicoul et al. (2011) M. Nicoul, U. Shymanovich, A. Tarasevitch, D. von der Linde, and K. Sokolowski-Tinten, “Picosecond acoustic response of a laser-heated Gold-film studied with time-resolved X-ray diffraction,” Appl. Phys. Lett. 98, 191902 (2011).