A study of the blue straggler population of the old open cluster Collinder 261
Abstract
Blue Stragglers are stars located in an unexpected region of the color-magnitude diagram of a stellar population,
as they appear bluer and more luminous than the stars in the turnoff region. They are ubiquitous, since they have been found among Milky Way field stars, in open and globular clusters, and also in other galaxies of the Local Group.
Here we present a study on the blue straggler population of the old and metal-rich open cluster
Collinder 261 (catalog Collinder~261), based on Gaia DR2 data and on a multi-epoch radial velocity survey conducted with FLAMES@VLT. We also analyze the radial distribution of the blue straggler population to probe the dynamical status of the cluster.
Blue straggler candidates were identified first with Gaia DR2, according to their position on the CMD, proper motions, and parallaxes. Their radial distribution was compared with those of the main sequence, red giant, and red clump stars, to evaluate mass segregation. Additionally, their radial velocities (and the associated uncertainties) were compared with the mean radial velocity and the velocity dispersion of the cluster. When possible, close binaries and long-period binaries were also identified, based on the radial velocity variations for the different epochs. We also looked for yellow stragglers, i.e., possible evolved blue stragglers.
We found 53 blue stragglers members of Collinder 261, six of them already identified in previous catalogs. Among the blue straggler candidates with radial velocity measurements, we found one long-period binary, five close-binary systems, three non-variable stars; we also identified one yellow straggler.
1 Introduction
Blue Stragglers (BSs) are stars located in an unexpected region of the color-magnitude diagram (CMD) of a relatively old stellar population, since they appear bluer and more luminous than stars in the turnoff (TO) region. Their existence is incompatible with the standard stellar evolution theory, which predicts that stars in this region of the CMD should have already left the main sequence because of their mass. Thus, these stars somehow managed to gain mass and become a “rejuvenated” object. The formation mechanisms for the BSs are not yet fully understood; however, at present, there are two main leading scenarios: BSs could be the products of either direct stellar collisions (Hills & Day, 1976), or mass-transfer activity in close binary systems (McCrea, 1964). Therefore, BSs can give information about the dynamical history of the cluster, the role of the dynamics on stellar evolution, the frequency of binary systems, and the contribution of binaries to cluster evolution. Hence, BSs certainly represent the link between standard stellar evolution and cluster dynamics. Additionally, they are rather ubiquitous as they have been found in all kinds of stellar environments: in the field, in open and globular clusters, and in galaxies of the Local Group. An extensive review of their properties has been presented by Boffin et al. (2014).
Open clusters seem to be stellar systems where BSs find themselves particularly comfortable. The reason for this is not yet clear, and deserves more attention. The study of BS stars in open clusters is still limited to just a few cases, preventing their use as potential dynamical clocks, as it has been done in globular cluster (GC) environments (Dalessandro, 2014). Ferraro et al. (2012, hereafter, F12) showed that GCs can be grouped into three different families based on the radial profile of their BS distributions. Clusters of Family I, or dynamically young GCs, show a flat distribution; in these systems the dynamical friction has not yet caused visible effects, even in the innermost regions. In Family II GCs, the dynamical friction has become more efficient and the mass segregation has started, which has led to the presence of a peak at the center, and a minimum at small radii of the BS distribution. The outskirts of Family II clusters have still not been affected by the dynamical friction, i.e., it has not reached the most remote BSs, and therefore there is a rise of the BS density in these outer regions. Bhattacharya et al. (2019) recently studied the radial distribution of the very old open cluster Berkeley 17 ( 10 Gyr, Kaluzny, 1994), and placed it in the Family II class of GCs. Finally, when the system is highly evolved, the external maximum disappears, and the only noticeable peak in the distribution is the central one; GCs showing this profile are grouped in the Family III.
A few catalogs of BS stars in open clusters are available, but they are based on a purely photometric selection (de Marchi et al., 2006; Ahumada & Lapasset, 2007, hereafter d06 and AL07). While useful, the photometric selection is not reliable enough to allow the derivation of statistical properties of BS stars, since their membership is uncertain, and field stars tend to occupy the very same region of BS stars in the CMD (Carraro et al., 2008). Only an accurate membership assessment may let us know the real number of BS stars in a given cluster, and the evolutionary status of each of them. So far, this has been done only for a handful of clusters. A very well studied cluster is M67, which harbors 24 BS stars (Leonard, 1996, and references therein). In this respect, however, perhaps the best studied case is NGC 188 (Geller, 2010; Geller & Mathieu, 2011; Geller et al., 2013). These authors have found 21 bona fide BS stars, with a binary fraction of 76% 19%. Among the 21 BSs, only four do nor show velocity variations, although it cannot be discarded that they might be long-period variables ( days), or that they are being seen pole-on. Some binary BSs in open clusters belong to very long-period systems, and hence are difficult to detect spectroscopically and almost impossible to detect photometrically. The percentage of binaries among BS stars is significantly larger than in the cluster main sequence (MS), where it is of about 20% (Mathieu & Geller, 2009; Geller & Mathieu, 2012). For all the BS binaries, the cited works derive period solutions. They find that the orbital period distribution of BS stars is quite different from that of MS binaries, with the majority of BS having orbital periods close to 1000 days, with most of them likely having a white dwarf companion. Recently, white dwarf companions have been detected for seven BSs in NGC 188 using far-ultraviolet HST observations (Gosnell et al., 2015). Similarly, five of the six binary BSs of M67 have periods from 800 to 5000 days (Latham & Milone, 1996; Pribulla et al., 2008). Besides these two clusters, spectroscopic studies of BSs in open clusters are available only for individual stars, for example: NGC 6791, Brogaard et al. (2018); NGC 6087, NGC 6087, NGC 6530, and Collinder 223, Aidelman et al. (2018); NGC 2141, (Luo, 2015).
Collinder 261, or Harvard 6 (C1234682, 37m57s,°22′00, J2000.0), is one of the oldest open clusters of the Milky Way, having an age from 7 to 9.3 Gyr (Bragaglia & Tosi, 2006; Dias et al., 2014). The cluster metallicity is close to solar, and reported values for the distance lie between 2.2 and 2.9 kpc, while its reddening has been estimated between 0.25 and 0.34 mag (Mazur et al., 1995; Gozzoli et al., 1996; Bragaglia & Tosi, 2006; Dias et al., 2014; Cantat-Gaudin et al., 2018). The cluster parameters are summarized in Table 1.
Due to the cluster location towards the galactic center, its color-magnitude diagram is heavily contaminated by field stars. In this sense, the second and latest data release of Gaia (DR2), which provides precise five-parameter astrometry (positions, parallaxes, and proper motions), as well as three-band photometry (, , and magnitudes) for more than one billion stars (Lindegren et al., 2018), allows a proper study of Collinder 261 members and BS population with great confidence. Gao (2018) and Cantat-Gaudin et al. (2018) (hereafter CG18), estimate 2000 members on the Collinder 261 area by applying the unsupervised clustering technique on the Gaia data.
The layout of the paper is as follows. In Section 2 we present the datasets used in this work. In section 3 we describe the photometric analysis and the selection criteria of BS stars in open clusters, and the results of such selection
for Collinder 261. Section 4 explains how the spectra were reduced and the radial velocities
extracted; in this section we also define the criteria to establish membership and binary status of our targets. In Section 5 we discuss the results of the photometric and spectroscopic detection. Finally, in Section 6, after a brief summary we give the conclusions of this study.
2 Datasets
2.1 Photometric data
We used the Data Release 2 Archive111https://gea.esac.esa.int/archive/ of the European Space Agency mission Gaia (Gaia Collaboration et al., 2016, 2018). For more than a billion stars, this survey provides a five-parameter astrometric solution: position, trigonometric parallax, and proper motion, as well as photometry in three broad-band filters (, , and ). The Gaia catalog also gives radial velocities for about 7 million stars, mostly brigther than . The astrometric solution, the photometric contents and validation, and the properties and validation of radial velocities are described in Lindegren et al. (2018), Evans et al. (2018), and Katz et al. (2019), respectively.
2.2 Spectroscopic data
Collinder 261 was observed with the fiber-fed spectrograph FLAMES222http://www.eso.org/sci/facilities/paranal/instruments/flames.html at the Very Large Telescope (VLT) of the European Southern Observatory (ESO, Paranal Observatory, Chile), using the combination of the mid-resolution spectrograph GIRAFFE and the fiber link UVES. The data were collected in two periods: October 2011 to March 2012, and October 2017 to April 2018, under ESO programs 088.D-0045(A) and 0100.D-0052(A).
The UVES fibers were allocated to the cluster’s clump stars, whose membership is very solid, to set the zero point of the radial velocity. The reduction and analysis of the UVES data are described by Mishenina et al. (2015). GIRAFFE was used with the setup HR8, which covers the wavelength range 491.7–516.3 nm, with a spectral resolution 20,000. The integration time was 2,400 sec for all spectra. In total, Collinder 261 was observed in 4 epochs; some details of the observations are given in Table 2. For the GIRAFFE data we just performed the sky-subtraction and normalization using the IRAF333IRAF is distributed by the National Optical Astronomy Observatory, which is operated by the Association of Universities for Research in Astronomy, Inc.., under cooperative agreement with the National Science Foundation. packages sarith and continuum, since the data were already reduced in Phase 3.
| Epoch | MJD | MJD | Exposure |
|---|---|---|---|
| (days) | (days) | (sec) | |
| 1 | 55982.277794959 | 55982.3055727877 | 2400.0044 |
| 2 | 55988.222295996 | 55988.2500738154 | 2400.0036 |
| 3 | 55993.234082174 | 55993.2618600004 | 2400.0042 |
| 4 | 58153.314142684 | 58153.3419204942 | 2400.0028 |
a Modified Julian date JD24,00000.5)
3 Photometric Analysis
For our photometry-based analysis, we took advantage of the selection of cluster members already performed by CG18, who used the membership assignment code UPMASK444https://cran.r-project.org/web/packages/UPMASK/index.html (Unsupervised Photometric Membership Assignment in Stellar Clusters, Krone-Martins & Moitinho 2014). This procedure is based on proper motions and parallax selection criteria. They considered as cluster members those stars located over a radius twice as large as the value of reported by Dias et al. (2014) (hereafter DAML02), with proper motions within 2 mas/yr, and with parallaxes within 0.5 mas from the cluster centroid. In this way, they selected about 2000 members of Collinder 261. For every star they estimated a membership probability from 0 to 100%. To calculate the cluster mean proper motion and parallax, they used only stars with probabilities above 50%.
Cantat-Gaudin et al. (2018) report the mean values (0.004) mas/yr, (0.004) mas/yr, and (0.002) mas. Just to be cautious, we calculated our own proper motions values following a similar procedure as that of Bhattacharya et al. (2019). We employed the table access protocol (TAP) and the astronomical data query language (ADQL), together with the Tool for OPerations on Catalogues And Table (TOPCAT),555http://www.starlink.ac.uk/topcat/ to access the Gaia data; for this, we identified the Gaia DR2 counterparts of confirmed Collinder 261 members, as follows. De Silva et al. (2007) measured radial velocities, metallicities, and chemical abundances (Mg, Si, Ca, Mn, Fe, Ni, Zr, and Ba) of 12 giant stars, and confirmed their membership; we cross-correlated the position on the sky of these stars and the Gaia DR2 catalog, looking for the nearest neighbors within 1′′. Our mean proper motions and parallax values are: mas/yr, mas/yr, and mas, which are in complete agreement with those of CG18 and Gao (2018) ( mas/yr, mas/yr, and mas). On the other hand, even considering the errors, our results are far from the values given by DAML02, namely, mas/yr, and mas/yr.
Arenou et al. (2018) report the differences between the average zero points of proper motions and parallaxes from DAML02 and Gaia catalogs. They found mas/yr and mas/yr for and respectively, and mas for the parallaxes. Arenou et al. (2018) do not find evidence for the presence of significant systematic errors in the Gaia DR2 proper motions. Therefore, the differences between our results and the published values of DAML02 seem unlikely to be caused by systematic errors in the Gaia data. Since our values were calculated using giant stars of confirmed membership, we suggest that the DAML02 proper motions might suffer from the lack of reliable cluster membership, as well as from significant contamination by field stars; these may be the main reasons of the discrepancies noted above.
3.1 Identification of the stragglers
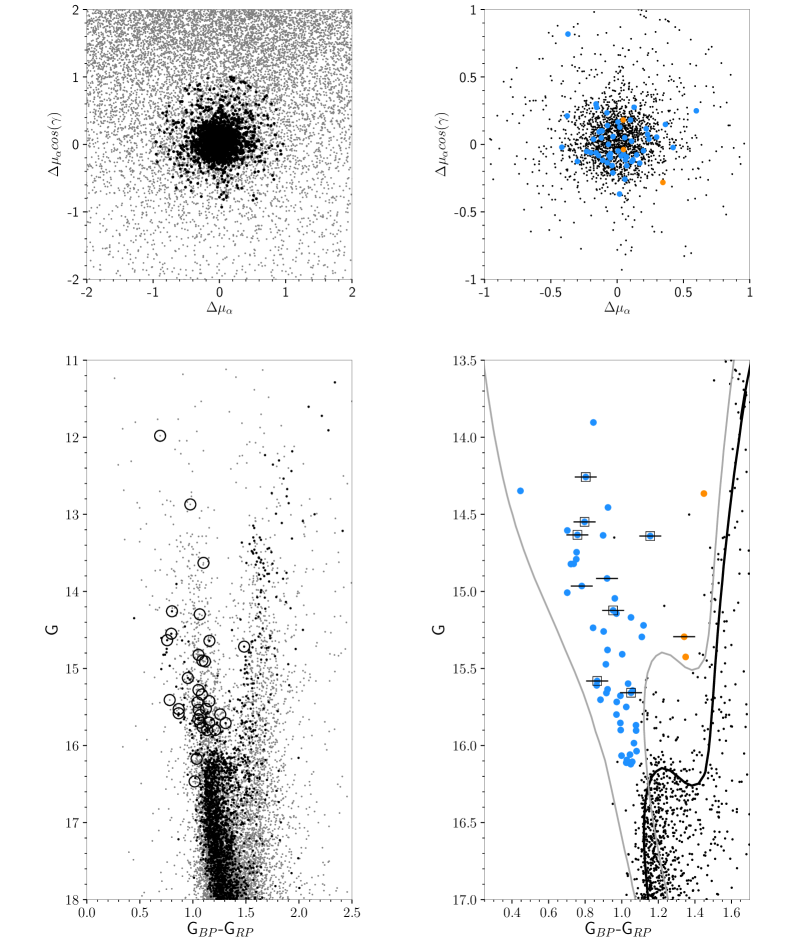
The region populated by the BSs in a CMD is well known today. According to Ahumada & Lapasset (1995, 2007) this area is delimited, to the left, by the zero-age main sequence (ZAMS); to the right, by the turnoff color; and down, by the magnitude at which the observed sequence of the cluster separates from the ZAMS. After applying a membership selection criterion, all stars falling in this region can be considered as genuine blue stragglers with good certainty. Following AL07, we superimposed an 8.7 Gyr isochrone and a ZAMS of solar metallicity from Bressan et al. (2012), using and , to the observed CMD (Figure 1). To not include spurious stars, we further constrained this region by plotting the equal-mass binary locus (dashed line) obtained by shifting the isochrone by 0.753 in toward brighter magnitudes; in this way, we expect that binaries containing normal main-sequence TO stars are excluded. These stars may appear as stragglers, but their components may not be such—see, e.g., Hurley & Tout (1998) for a discussion of this sequence.
Ahumada & Lapasset (2007) estimated a red limit of for the BS area of Collinder 261. To impose the same limit in the Gaia system, we used the relation of Jordi et al. (2010):
| (1) |
With , it results . Stars redder than this limit can be considered as possible yellow stragglers.
Finally, we adopted an upper limit of 2.5 magnitudes above the TO for massive BSs.
In the top panel of Fig. 1 we plotted the distribution of proper motions for stars in the Collinder 261 area. Gray dots represent Gaia DR2 stars within of the cluster center. Black filled circles are the cluster members of CG18. Light blue filled circles are the BS candidates, and orange filled circles are the yellow stragglers candidates. In the bottom panel of Fig. 1 we plotted the color-magnitude diagram of Collinder 261. The symbols are the same of the top panel. Open black circles are the BS candidates identified by AL07. Only 6 of 54 are classified as members according to Gaia data. The BS sample of AL07 follows the galactic field trend and is very different from the BS population found with Gaia. In total we identified 55 BS and five YS candidates.
Most of the BSs are within 0.5 mas/yr from the cluster mean, while only four candidates lie outside this region. The membership probabilities of the latter are: 10%, 30%, 50%, and 70%. The remaining candidates have probabilities above 70%, so we decided to leave out all the stars with probability below 50% to define a bona fide, non-spurious BS population. The same criterion was applied to the yellow straggler candidates, from the five candidates, two stars lie outside the region mentioned above; they have membership probabilities of 30% and 40%, and were left out of our sample.
Summing up the results of this Section, Collinder 261 has 53 BS and three YS candidates. These are listed in Table 3. When available, additional classification according to their binary nature, as reported in the astronomical database SIMBAD (Wenger et al., 2000), is also listed. The eclipsing, close binaries found among the BSs of Collinder 261 are of the following types: Lyrae, Algol, and W Ursae Majoris (W UMa). Binaries classified as Lyrae are semidetached systems, i.e., one of the components of the pair is filling its critical Roche lobe, the stars are close enough that they are gravitationally distorted, and the periods are usually longer than 1 day. Algol variables are also semidetached binaries, whose components have spherical or slightly ellipsoidal shapes. These stars have an extremely wide range of observed periods, from 0.2 to over 10,000 days. In the W UMa-type stars the components are in contact or almost in contact, and share a common envelope of material; the orbital period can be of just a few hours.
4 Spectroscopic Analysis
This is the first high-resolution spectroscopic analysis of the BS population in Collinder 261. Unfortunately, not all the candidates were observed with FLAMES since, when we were allocated the observational time, we used the BS list of AL07 to select the targets, a list very different from that found in this work using Gaia. The spectroscopic analysis was carried out on nine out of the 53 BS in our list, and on one of the three YS candidates identified.
4.1 Radial Velocities
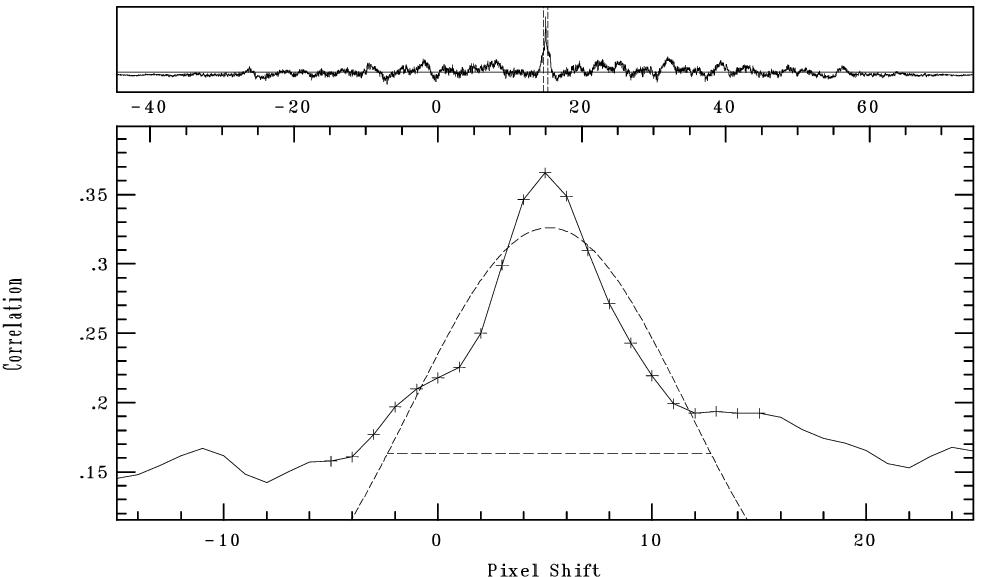
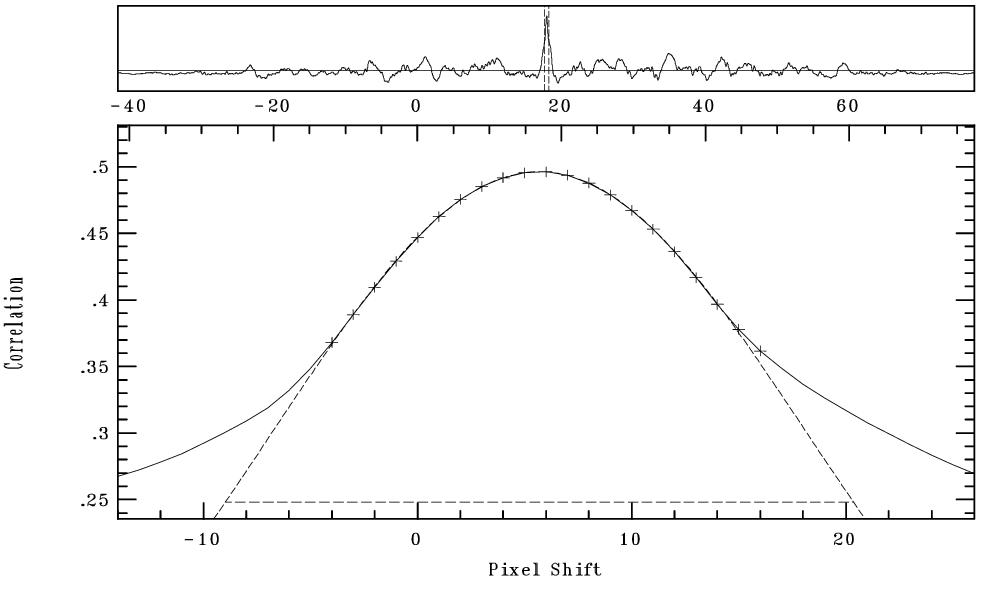
For each spectrum, radial velocities were determined with the IRAF fxcor cross-correlation task (Tonry & Davis, 1979). Stellar spectra were cross-correlated with synthetic templates obtained with the SPECTRUM code666http://www.appstate.edu/~grayro/spectrum/spectrum.html (Gray & Corbally, 1994). Each synthetic spectrum was computed adopting the atomic and molecular data file stdatom.dat, which includes solar atomic abundances from Grevesse & Sauval (1998), and the linelist luke.lst, suitable for mid-B- to K-type stars. Model atmospheres were calculated with the code ATLAS9 (Castelli & Kurucz, 2003).
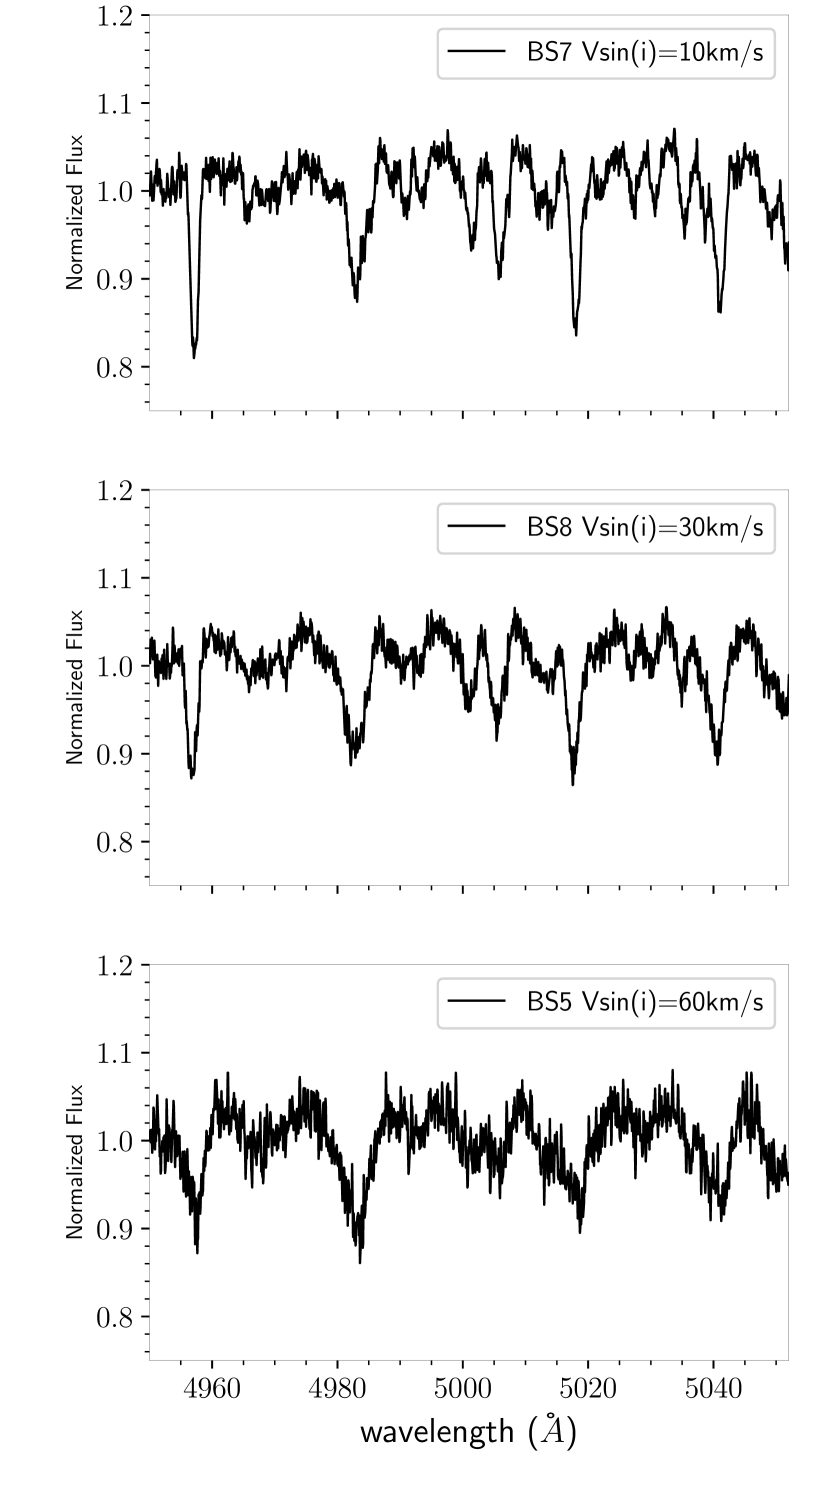
In Figure 3 we plotted, as an example, the spectra of three of our targets. The selection of a proper template for each star was mandatory because the targets have different rotational velocities (see Mucciarelli et al. 2014 for more information). We computed a set of templates with different rotational velocities ranging from 10 to 100 km/s, adopting the values: for the effective temperature, K, for the surface gravity, cm/s2, and for the micro-turbulence, km/s. We carefully compared the spectrum of each star with the templates, and we visually estimated the rotation rate from the profiles of the spectral lines. However, if the template had too low a rotational velocity, the shape turned out to be very noisy because the profiles of the lines and the spectrum noise were mapped together. In these cases, we had to increase the rotational velocity of the template for the cross-correlation procedure. The derived rates are considered as upper limits. An example of this procedure is illustrated in Figure 3.
The radial velocities measurements for the blue and yellow stragglers are reported in Table 4.
| Gaia DR2 Source Id. | Parallax | Classa | ||||||
|---|---|---|---|---|---|---|---|---|
| (mag) | (mag) | (mag) | (mas/yr) | (mas/yr) | (mas) | (%) | ||
| 5856432828647768960 | 15.00 | 15.28 | 14.57 | 6.485 0.038 | 2.636 0.043 | 0.304 0.024 | 100 | BS |
| 5856437089255328384 | 15.23 | 15.57 | 14.73 | 6.302 0.050 | 2.800 0.044 | 0.372 0.029 | 100 | BS |
| 5856511271928032256 | 14.74 | 15.03 | 14.28 | 6.399 0.037 | 2.799 0.041 | 0.318 0.028 | 100 | BS |
| 5856530272864404224 | 15.40 | 15.80 | 14.80 | 6.291 0.052 | 2.988 0.052 | 0.306 0.036 | 100 | BS |
| 5856527455365735680 | 15.26 | 15.61 | 14.71 | 6.278 0.053 | 2.821 0.056 | 0.290 0.037 | 100 | BS |
| 5856516597687652352 | 15.89 | 16.31 | 15.31 | 6.424 0.057 | 2.865 0.068 | 0.295 0.042 | 90 | BS |
| 5856527455365740032 | 15.16 | 15.59 | 14.54 | 6.464 0.042 | 2.630 0.042 | 0.337 0.028 | 90 | BS |
| 5856527386646253312 | 14.54 | 14.85 | 14.05 | 6.383 0.034 | 2.940 0.036 | 0.297 0.024 | 90 | BS |
| 5856527386646253440 | 15.12 | 15.45 | 14.50 | 6.423 0.043 | 2.589 0.055 | 0.333 0.032 | 100 | BS |
| 5856527524085206656 | 13.90 | 14.24 | 13.39 | 6.319 0.030 | 2.815 0.030 | 0.297 0.020 | 100 | BS |
| 5856517010004497792 | 15.65 | 16.03 | 15.11 | 6.649 0.053 | 2.855 0.060 | 0.340 0.036 | 90 | BS, EB Lyrae |
| 5856528348719355648 | 14.63 | 14.92 | 14.16 | 6.388 0.038 | 2.886 0.039 | 0.351 0.026 | 100 | BS |
| 5856528623597294720 | 14.82 | 15.08 | 14.34 | 6.766 0.044 | 2.751 0.043 | 0.334 0.032 | 70 | BS |
| 5856517078723954944 | 15.29 | 15.68 | 14.57 | 6.489 0.046 | 2.813 0.049 | 0.322 0.032 | 100 | BS |
| 5856527558444960128 | 14.60 | 14.86 | 14.16 | 6.110 0.037 | 2.691 0.041 | 0.377 0.026 | 100 | BS |
| 5856527455365743488 | 14.82 | 15.09 | 14.37 | 6.427 0.044 | 2.495 0.050 | 0.277 0.033 | 100 | BS |
| 5856527661524172800 | 14.91 | 15.28 | 14.36 | 6.343 0.041 | 2.564 0.045 | 0.283 0.028 | 100 | BS, EB Lyrae |
| 5856527730243676800 | 15.60 | 15.94 | 15.07 | 6.330 0.055 | 2.601 0.051 | 0.331 0.036 | 100 | BS |
| 5856528383078700288 | 15.71 | 16.11 | 15.14 | 6.381 0.059 | 2.671 0.063 | 0.281 0.039 | 100 | BS, EB Algol |
| 5856528726676132096 | 15.85 | 16.23 | 15.24 | 6.242 0.060 | 2.705 0.063 | 0.345 0.042 | 100 | BS |
| 5856528520517692032 | 15.64 | 16.06 | 15.00 | 6.548 0.059 | 2.790 0.053 | 0.320 0.037 | 100 | BS |
| 5856528589237173120 | 15.22 | 15.65 | 14.53 | 6.222 0.046 | 2.455 0.047 | 0.374 0.032 | 100 | BS |
| 5856529242072194816 | 15.65 | 16.09 | 15.04 | 6.402 0.063 | 2.829 0.060 | 0.310 0.041 | 100 | BS |
| 5856517284882496128 | 14.63 | 15.00 | 14.10 | 6.411 0.037 | 2.811 0.038 | 0.268 0.025 | 100 | BS |
| 5856528348719366528 | 15.47 | 15.83 | 14.91 | 5.985 0.052 | 2.582 0.054 | 0.344 0.034 | 90 | BS |
| 5856515601255190272 | 14.25 | 14.57 | 13.76 | 6.293 0.031 | 2.679 0.033 | 0.313 0.023 | 100 | BS, EB Algol |
| 5856514879700797696 | 14.34 | 14.49 | 14.05 | 6.415 0.032 | 2.729 0.035 | 0.322 0.021 | 100 | BS |
| 5856528550550957184 | 14.96 | 15.25 | 14.47 | 6.278 0.043 | 2.888 0.042 | 0.281 0.030 | 90 | BS, EB Algol |
| 5856529379511194240 | 14.79 | 15.07 | 14.32 | 6.120 0.038 | 2.655 0.039 | 0.297 0.026 | 100 | BS |
| 5856527524085202048 | 15.58 | 15.90 | 15.04 | 6.579 0.051 | 2.782 0.051 | 0.307 0.034 | 100 | BS |
| 5856432656849042688 | 16.03 | 16.50 | 15.41 | 6.529 0.068 | 2.692 0.060 | 0.290 0.037 | 100 | BS |
| 5856420729693697408 | 16.12 | 16.57 | 15.52 | 6.473 0.064 | 2.631 0.064 | 0.334 0.040 | 100 | BS |
| 5856419531427900672 | 15.90 | 16.36 | 15.28 | 6.469 0.059 | 2.681 0.059 | 0.304 0.040 | 80 | BS |
| 5856437742090215680 | 15.79 | 16.20 | 15.22 | 6.727 0.069 | 2.519 0.055 | 0.245 0.038 | 80 | BS |
| 5856436298981175168 | 16.09 | 16.52 | 15.49 | 6.504 0.064 | 2.456 0.057 | 0.343 0.037 | 100 | BS |
| 5856436367700747392 | 15.98 | 16.43 | 15.37 | 6.249 0.073 | 2.549 0.066 | 0.436 0.039 | 80 | BS |
| 5856483303104274560 | 15.12 | 15.54 | 14.57 | 5.753 0.047 | 2.481 0.040 | 0.403 0.026 | 50 | BS |
| 5856512680677308160 | 16.10 | 16.55 | 15.49 | 6.342 0.065 | 2.779 0.270 | 0.270 0.050 | 100 | BS |
| 5856528962867671936 | 16.06 | 16.46 | 15.46 | 6.509 0.075 | 2.793 0.069 | 0.204 0.047 | 100 | BS |
| 5856528486157936384 | 16.05 | 16.47 | 15.42 | 6.131 0.071 | 2.614 0.064 | 0.412 0.045 | 100 | BS |
| 5856528486157941376 | 16.11 | 16.52 | 15.50 | 6.240 0.074 | 2.866 0.066 | 0.320 0.044 | 100 | BS |
| 5856527764603421184 | 15.86 | 16.31 | 15.23 | 6.152 0.073 | 2.777 0.062 | 0.278 0.041 | 100 | BS |
| 5856529001554008064 | 14.64 | 15.12 | 13.97 | 6.288 0.037 | 2.845 0.040 | 0.306 0.026 | 100 | BS |
| 5856528761035882496 | 15.38 | 15.74 | 14.82 | 6.203 0.053 | 2.808 0.053 | 0.226 0.035 | 100 | BS, EB W UMa |
| 5856529276431965696 | 16.37 | 16.76 | 15.81 | 6.194 0.077 | 2.974 0.077 | 0.304 0.053 | 100 | BS |
| 5856517211839051392 | 15.59 | 16.00 | 14.96 | 6.721 0.063 | 1.912 0.066 | 0.488 0.043 | 70 | BS |
| 5856527558444963200 | 15.67 | 16.06 | 15.07 | 6.231 0.057 | 2.845 0.069 | 0.236 0.038 | 100 | BS |
| 5856529276431950080 | 15.04 | 15.43 | 14.47 | 6.460 0.046 | 2.848 0.047 | 0.259 0.031 | 100 | BS |
| 5856527558444950656 | 15.74 | 16.10 | 15.08 | 6.052 0.093 | 2.676 0.093 | 0.178 0.062 | 100 | BS |
| 5856533326555127168 | 16.11 | 16.52 | 15.48 | 6.332 0.070 | 3.098 0.068 | 0.254 0.047 | 100 | BS |
| 5856515665648722688 | 15.63 | 15.99 | 15.07 | 6.180 0.056 | 2.869 0.054 | 0.216 0.038 | 100 | BS, EB Algol |
| 5856515669974676480 | 15.70 | 16.01 | 15.13 | 5.928 0.081 | 2.753 0.074 | 0.440 0.056 | 90 | BS |
| 5856519037229366144 | 14.45 | 14.83 | 13.90 | 5.575 0.030 | 2.430 0.031 | 0.530 0.021 | 80 | BS |
| 5856435130750056576 | 14.36 | 15.02 | 13.57 | 6.005 0.03 | 3.012 0.029 | 0.145 0.018 | 60 | YS |
| 5856527622837778176 | 15.29 | 15.89 | 14.55 | 6.302 0.05 | 2.768 0.049 | 0.304 0.033 | 100 | YS |
| 5856515601255187712 | 15.42 | 16.02 | 14.67 | 6.304 0.04 | 2.549 0.048 | 0.278 0.033 | 100 | YS |
a Classification of the stars according to their binary nature, as reported in the astronomical database SIMBAD (Wenger et al., 2000)
| IDa | Gaia DR2 Source Id. | RV1 | RV2 | RV3 | RV4 | Classificationa | |
|---|---|---|---|---|---|---|---|
| (km/s) | (km/s) | (km/s) | (km/s) | (km/s) | |||
| BS1 | 5856527386646253312 | M, CB | 30 | ||||
| BS2 | 5856528348719355648 | M | 10 | ||||
| BS3 | 5856527524085202048 | M, CB | 30 | ||||
| BS4 | 5856528550550957184 | M, CB | 40 | ||||
| BS5 | 5856527661524172800 | M, CB | 60 | ||||
| BS6 | 5856527386646253440 | M, LP | 30 | ||||
| BS7 | 5856529242072194816 | M | 10 | ||||
| BS8 | 5856515601255190272 | M, CB | 30 | ||||
| BS9 | 5856529001554008064 | M | 10 | ||||
| YS1 | 5856527622837778176 | M | 10 |
a This work.
4.2 Errors
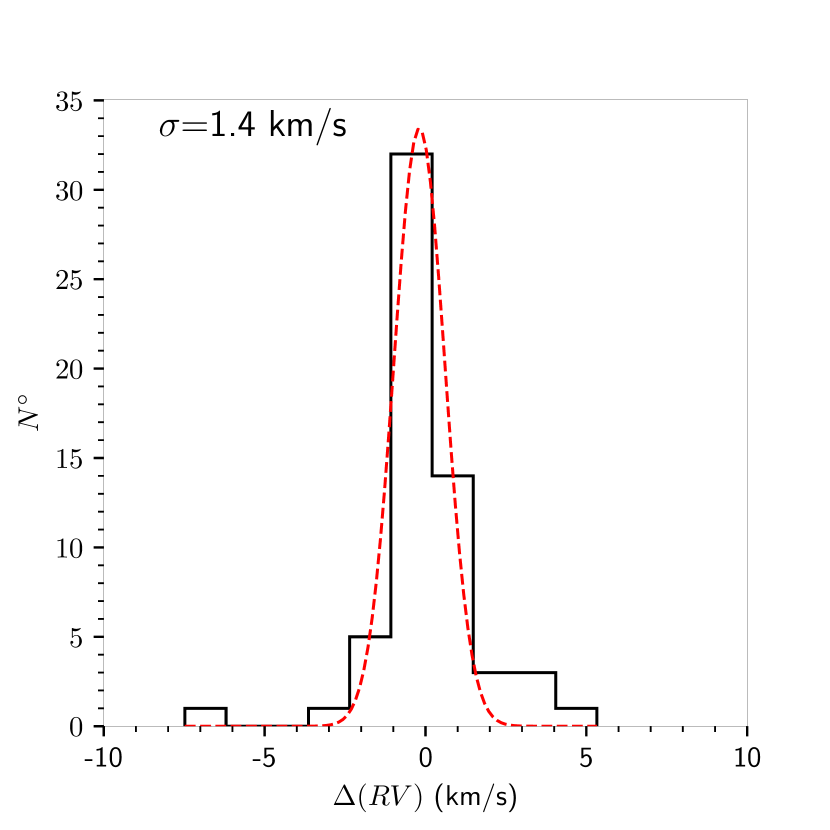
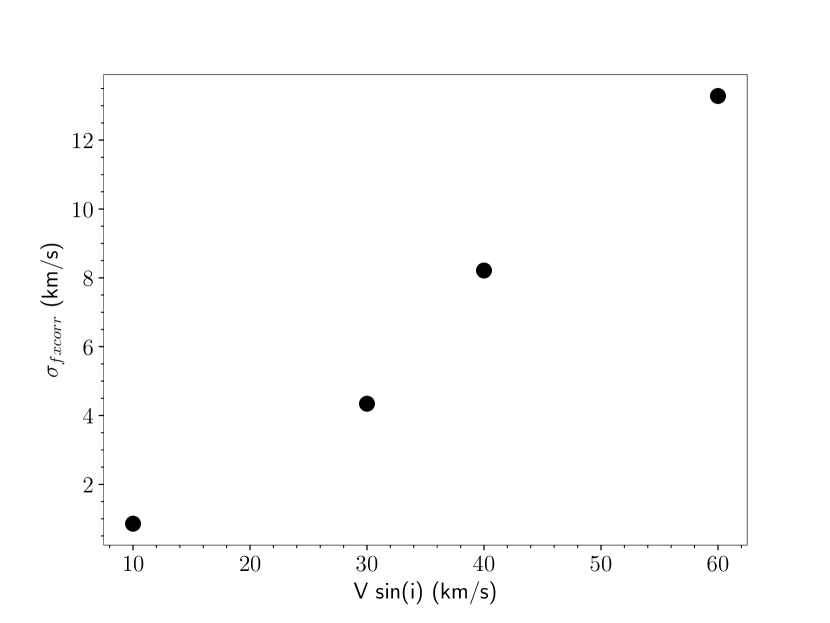
We consider the errors returned by fxcor as conservative estimates of the true uncertainties of the radial velocity. For each star we have four radial velocity measurements and fxcor error estimations. We computed the fxcor error for each star, and for each pair of measurements we calculated the radial velocity difference divided by the root square of 2. We then built the distribution histogram and fitted a Gaussian. We take the standard dispersion of the Gaussian as the true radial velocity error. We plotted the histograms together with the Gaussian fit and the true error in the upper panel of Figure 4. Additionally, we calculated the mean fxcor error for each rotational rate (estimated as we described above in Subsection 4.1). Our results are plotted in the bottom panel of Figure 4. The typical uncertainties for the slow rotators stars ( km/s) is about 1 km/s. Stars rotating with velocities ranging approximately between 30 and 60 km/s have errors from 4 to 14 km/s. Similar uncertainties values were found by Mucciarelli et al. (2014) on their BS sample. Therefore, we decided to adopt the fxcor error as a conservative estimation for the radial velocity uncertainty.
4.3 Membership and evolutionary status
Comparing our radial velocities with the mean value derived by Mishenina et al. (2015) for the clump stars, we can now try to determine the membership status of the objects in our sample. In what follows we will assume that BSs are the result of collisions, or that they are binary systems, with either relatively short periods (a few days or less), or rather long ones (about 1000 days). Tree epochs of observation are separated by a few days (6), and the fourth epoch is about 6 years later. To assess membership, the radial velocities of the stars can be compared to the mean radial velocity of the cluster, taking into account the error bars—as derived in Section 4.1—and the possibility of binarity.
The TO mass of Collinder 261 is about 1.1 (Bragaglia & Tosi, 2006); if the companions are main-sequence stars, they have to be less massive since, by definition, they are the secondary components. If the systems are post-mass-transfer ones containing a white dwarf (e.g., Gosnell et al. 2014), then the mass of the companions are more likely peaked around 0.6 , as found in NGC 188 (Geller & Mathieu, 2011). We can thus assume, for illustration purposes, that the binary would have a mass ratio of 0.5. For the system not to fill its Roche lobe—as this would imply a mass transferring system showing signs of accretion, which are not seen—the separation between the two stars should be larger than 3.5 , with a minimal orbital period of the order of 0.5 days. In that case, the maximum orbital period would be 100 km/s. Thus, a star whose radial velocity differs from that of the cluster by up to 100 km/s could still be a member, if it were a close binary; in this case, however, we would expect that its radial velocity would change between two epochs. If we now consider the typical, post-mass-transfer, long-period binaries, with periods around 1000 days like those found to constitute the bulk of the BSs in NGC 188, we would expect a maximum radial velocity of 10–13 km/s. In this case, the difference in velocities between two epochs should be very small, i.e., below 1 km/s. Of course, it is possible to have a binary system in between these two cases. These considerations led us to define the following, rather conservative approach to confirm membership of BS stars in Collinder 261:
-
•
If the individual radial velocities are, given their error bars, compatible with the cluster mean , and do not change significantly over the four epochs, it is considered a possible single-star member, the outcome of a collision or a merger. It could of course also be a binary with a long period—greater than days. These stars are classified “M”.
-
•
On the other hand, if the individual radial velocities are, given their error bars, within 100 km/s with respect the cluster mean , then:
-
1.
If the velocities differ more than 20 km/s from and change significantly between two epochs, we can consider the star as a candidate for being a close-binary member of the cluster, “M, CB”.
-
2.
If the velocities are within 20 km/s from and do not change by more than a few km/s between epochs (depending on the possible period, which is constrained by the difference with ), we possibly have a long-period member (period above 100 days): “M, LP”.
-
1.
-
•
The membership status of the binaries (CB and LP) can only be secured once we have determined the full orbital solution, and thus derived the systemic velocity. If none of the above apply, we consider the star to be a non-member, “NM”.
5 RESULTS
5.1 Photometric detections
We identified 53 possible blue stragglers. Only six of them are in common with the BS population listed by AL07 for Collinder 261. Seven of our stars have already been noted as blue stragglers and binaries in previous studies (Mazur et al., 1995; Vats & van den Berg, 2017), see Table 3.
5.1.1 Radial distribution
The BS radial distribution has been found to be a powerful tool to estimate the dynamical age of stellar systems (F12 and Beccari et al. 2013). In fact, due to their masses—significantly larger than the average—and their relatively high luminosities, BSs are the ideal objects to measure the effect of dynamical processes, like dynamical friction and mass segregation (Mapelli et al., 2006). In order to investigate the cluster dynamical state, we studied the BS radial distribution and compared it to those of red giant branch (RGB), red clump (RC), and main sequence (MS) stars, taken as representatives of the normal cluster population, and that therefore are expected to follow the cluster distribution.
Main sequence stars were selected from a region free of binary contamination. We considered as MS stars all those
in the range . For RGB stars, we selected stars lying in the region , with (see Figure 1). This allowed us to obtain a populous sample of
reference stars in the same range of magnitude of BSs, i.e., in the same degree of completeness. Red clump stars were selected from the region between . As we already
mentioned, the accurate astrometric solutions of Gaia let us identify the stellar population of Collinder 261 in a very reliable way. We identified 53 BS, 79 RGB, 37 RC, and 833 MS stars.
The cumulative spatial distribution of the samples are shown in Figure 5, where the different panels show the normalized cumulative distribution of the BS candidates (black solid line),
compared to those of MS stars (green dashed line), RGB stars (red dashed line) and RC stars (magenta dashed line). The BSs appear more centrally concentrated than the MS and RGB stars. The higher concentration of BSs that we find in the cluster internal region relative to the evolved stars, has already been observed in other open clusters (Geller et al., 2008; Bhattacharya et al., 2019). The BS population in Collinder 261 is centrally concentrated, within about 5′ with respect to MS an RGB stars. In the right panel of Figure 5, clump stars and BSs have approximately the same distribution. In terms of mass segregation, BSs should be more centrally concentrated, given their combined masses—higher than that of TO stars, than RC stars—slightly less massive than TO stars. We suggest that the similarity of the radial profiles of BSs and RC stars is possibly due to the small-number statistics in our sample for both populations. It is worth mentioning that
Carraro et al. (2014) found marginal evidence that the BSs of the old open cluster Melotte 66
are more concentrated than its clump stars, as in Collinder 261.
To quantify whether the radial distributions of BS, RGB, RC, and MS stars are extracted from the same parent distribution, thus indicating an absence of segregation, we used the -sample Anderson-Darling test (Scholz & Stephens, 1987, hereafter A-D test). The A-D test is similar to the more widespread Kolmogorov-Smirnov test, but has a greater sensitivity to the tails of the cumulative distribution. The A-D test indicates a difference of 99.9% between the distributions of BS and MS stars, and a difference of 86.9% between the distributions of BS and RGB stars, which therefore favor the existence of a real mass segregation in Collinder 261. On the contrary, we do not find the population of BS stars to be centrally concentrated with respect to RC stars, as the A-D test gives a probability of 16.0% that both populations do not originate from the same distribution. The same observation was found by Carraro et al. (2014) in Melotte 66. Mazur et al. (1995) discovered 45 short-period eclipsing binaries in the Collinder 261 field, and estimated the frequency of the binary BSs among their sample within 6 arcmin from the cluster center. They found a frequency of between 11% and 28%, supporting the hypothesis that a significant fraction of BSs formed as a result of mass transfer in close binary systems. Our analysis also supports this scenario, in which BS stars in Collinder 261 are primordial binaries sinking towards the cluster center due to their combined mass, much larger than that of normal cluster stars.
A further indicator of segregation is the number of BSs normalized to the number of a reference population. We divided the field of view in 5 concentric annuli, each one containing approximately the same number of BSs (). Star counts are in Table 5. Figure 6 plots the number of BS candidates with respect to that of reference stars in each annulus, as a function of the radial distance in arcmin, and the colors are the same described above. When we compare the RC population and BS stars, we note a maximum at (see right panel of Figure 6); however, when we consider the errors (Poisson errors) this peak disappears and the distribution becomes flat. The same behavior was observed when comparing BS with MS and RGB populations. Both ratios show a maximum value in the annuli closer to the center, followed by a minimum. The ratios within display two minima at and , and two maximum peaks at and . As in the previous case, these distributions become flat considering the errors. A statistical test needs to be performed in the future, to evaluate the degree of BSs segregation with respect to the reference populations.
| Range (′′) | / | / | / | ||||
|---|---|---|---|---|---|---|---|
| 0–42 | 10 | 62 | 7 | 8 | 0.161 | 1.42 | 1.25 |
| 42–96 | 10 | 156 | 8 | 14 | 0.064 | 1.25 | 0.71 |
| 96–138 | 11 | 100 | 5 | 11 | 0.110 | 2.20 | 1.00 |
| 138–282 | 11 | 179 | 9 | 20 | 0.061 | 1.22 | 0.55 |
| 282–900 | 11 | 326 | 7 | 26 | 0.033 | 1.57 | 0.42 |
A cluster made up of stars of the same mass is dynamically relaxed on a timescale of , where is the crossing time, is the total number of stars, and is the velocity dispersion (Binney & Tremaine, 2008). The time is the characteristic scale in which the cluster reaches some level of kinetic energy equipartition with massive stars sinking to the core, and low-mass stars being transferred to the halo, so mass segregation in a star cluster scales with the relaxation time. Using the standard deviations of the projected proper motions ( mas/yr and mas/yr), and the sizes of the cluster core and half-mass radius reported in Table 1, we obtain, for the cluster core, Myr, and for the half-mass radius Myr. These values are significantly smaller than the estimated age of Collinder 261 ( 6–7 Gyr). Consequently, this could explain the presence of mass segregation in this cluster, particularly in the core.
We made and attempt to link our findings for Collinder 261 with those of F12 for globular clusters. We could not classify this cluster into any of the three families defined by F12 (Section 1), given the small number of BSs we have. Ferraro et al. (2012) discovered a tight anti-correlation between the core relaxation time and the shape of the radial distribution. Clusters with a flat distribution—i.e., that show no signs of segregation of its BSs—should have a relaxation time of the order of the age of the Universe. Our findings do not match with their results, given that the small relaxation time we derive for the core of Collinder 261 is not compatible with a flat distribution.
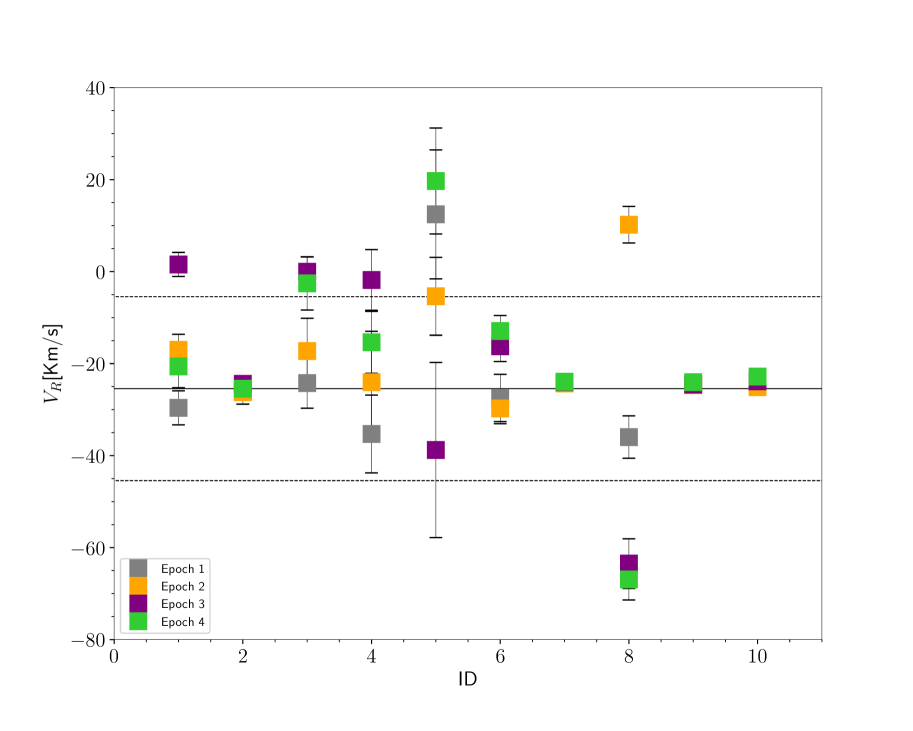
5.2 Spectroscopic detections
There are 10 stars in common between those observed with FLAMES and those in our proper motion and parallax selection. Out of our 53 BS candidates, only nine were observed with FLAMES. One YS candidate was also observed, and we decided to study its variability as well. Based on their radial velocity variations, we attempted to roughly assess their binary nature, namely, to decide if they may be close or long-period binaries. Our results are plotted in Figure 7. All the probable binaries would need additional spectroscopic follow-up to be properly characterized, given the small number of observations. In total we found one long-period system, five close-binary systems, and three BS and one YS candidates without variations in their radial velocity measurements.
5.2.1 Long-period binaries
Previous studies have revealed that the BS population in open clusters mostly contains long-period binaries (Geller et al., 2009). This kind of stars have periods ranging from a few days to decades, or even centuries, and it is very difficult to detect them spectroscopically and photometrically.
Star BS6 (%100) is a member according to our astrometric criteria and, according with Figure 7, is a possible long-period binary stars (M, LP), is the only M, LP we found among our sample. This star is at 2.55′ from the cluster center.
5.2.2 Close binaries
Stars BS1, BS3, BS4, BS5 and BS8 are cluster members and are also classified as possible close-binary systems (M, CB). The presence of these stars within the BS populations is quite unknown; according with previous studies perform in OCs, they are less numerous than long-period binaries (e.g., NGC 188 (Mathieu & Geller, 2015), M67 (Latham, 2007)), and their evolutionary histories involve dynamical encounters. According to Mazur et al. (1995), Collinder 261 is the star cluster that possesses the richest and most diversified population of short-period binaries found so far.
Stars BS1 (90%) and BS3 (%100) are at 2.50′, 2.58′ respectively from the cluster center.
Star BS4 (90%) has already been classified as an eclipsing binary of Algol type (i.e., detached, cf. Table 3). The ASAS-SN Variable Stars Database777https://asas-sn.osu.edu/variables (Jayasinghe et al., 2019) gives an amplitude value of 1.87 mag. Mazur et al. (1995) give a period value of days. This star is at 0.53′ from the cluster center.
Star BS5 (100%) is a very well studied member of Collinder 261. It has already been classified as a semi-detached, eclipsing binary of Lyrae type (Avvakumova et al., 2013). According to Samus’ et al. (2017) and Jayasinghe et al. (2019), this binary has a period of days and a amplitude of 0.44 mag. This star lies at 1.70′ from the cluster center and, according to its upper limit of , it is a fast rotator (see Table 4)
Star BS8 (100%) is a completely different case. In the literature it has been cataloged
as a detached, eclipsing binary of Algol type (Mazur et al., 1995; Avvakumova et al., 2013; Samus’ et al., 2017), and also as a genuine BSS according to AL07.
Most Algol variables are quite close binaries, and therefore their periods are short, of typically
a few days. Is also very well known that these stars are among the most active and X-ray luminous. Vats & van den Berg (2017) give an X-ray luminosity 8.05 (unidades), and Mazur et al. (1995) a
preliminary value of the period days. This star lies at 3.29′ from the cluster
center.
5.2.3 Non-radial velocity variables BSS
There are three blue stragglers in Collinder 261 that do not show significant radial-velocity variability: BS2 (100%), BS7 (100%) and BS9 (100%). They lie at 1.43′, 0.49′ and 0.46′ respectively from the cluster center. The upper limit we obtained for their rotational velocities are reported in Table 4. Is possible that these non-velocity-variable blue stragglers are indeed long-period binaries, perhaps outside of our detection limit. Star BS2 is the bluest BS in our sample and BS7 is the reddest.
5.2.4 Yellow Straggler
Star YS1 (100%) is considered to be a yellow straggler according to its position in the color-magnitude diagram, and because it lies beyond the red limit for the BSs and red giants (see Section 3.1). This star is located at 1.67′ from the center.
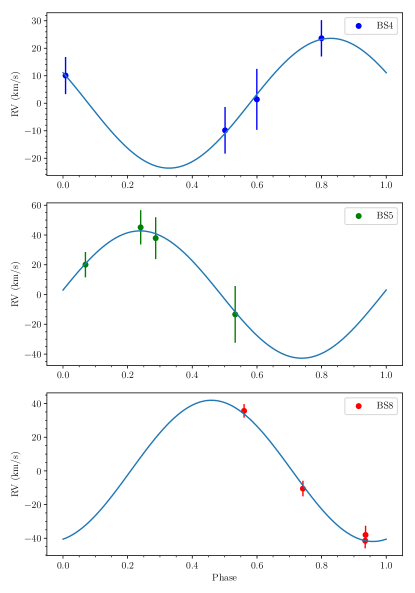
5.3 Mass estimations
We performed a mass estimation for BS4, BS5, and BS8. These stars are identified in the literature as eclipsing binaries, and are briefly described in Subsection 3.1. To fit the orbits we used the radial velocities we obtained in Subsection 4.1 and the periods reported in the literature (Subsection 5.2.2). For BS5 we divided the period by 2 (i.e., days). For all stars we assumed that they are members, and that the mean velocity of the cluster as the systemic velocity of the binary.
To obtain the mass of the secondary () stars, we first estimated the masses of the primaries () from the color-magnitude diagram. The masses we finally derived for BS4 are 1.5 M⊙ and M2= 0.118 0.005 M⊙, for BS5 are 1.51 M⊙ and M2= 0.21 0.01 M⊙, and for BS8 are 1.51 M⊙ and M2= 0.42 0.02 M⊙. Figure 8 shows the radial velocity curve for each star.
6 SUMMARY AND CONCLUSIONS
With the accurate data available from the Gaia DR2 we have studied the blue straggler population of the old open cluster Collinder 261. We found 53 blue stragglers and three yellow stragglers among the cluster members. Using red clump stars we calculated the mean proper motions and parallax values, and obtained mas/yr, mas/yr, and mas, in agreement with the literature. Our results are shown in Figure 1 and Table 3.
Following Bhattacharya et al. (2019), we used our candidates as test-particles to probe the dynamical state of Collinder 261. In particular, we found that BSs are more centrally concentrated than RGB and MS stars (see Figure 5), and that they follow almost the same distribution than RC stars. To search for mass segregation, we normalized the BS population to several reference populations (RGB, MS, and RC stars, see Table 5); before each comparison, we performed an A-D test to check that the populations are not extracted from the same parent distribution, which should also indicate the presence of segregation. The test gives 99.9%, 86.9% and 16.0% of MS, RGB and, RC respectively are not drawn from the same distribution than BSs. We found pronounced peaks and minima in the central regions of the cluster, similar to the ones found by Bhattacharya et al. (2019) in Berkeley 7. However, when taking into account the errors involved, these results were dismissed. We calculated the relaxation time of our cluster and found Myr for the core, and Myr for the half-light radius. Both values are quite small compared with the evolutionary age of our cluster (6–7 Gyr). Given these results, we were not able to place Collinder 261 in any of the families defined for globular clusters by Ferraro et al. (2012).
On the second part of the paper, we have presented the first high-resolution spectroscopic study of the BS population of Collinder 261, adopting membership criteria more solid than the simple photometric ones. So far, spectroscopic studies have been limited to a very small number of clusters. This is mostly because open clusters are believed to harbor many BS stars (Ahumada & Lapasset, 2007), and therefore studying them in detail represents a huge observational challenge. The reason, however, for which they host so many BS stars, has not been fully deciphered yet. For this study we obtained four epochs of radial velocities; based on their variations, we separated these stars into candidate members, probable close binaries, and long-period binaries. All the probable binaries would need additional spectroscopic follow-up to be properly characterized, given the small number of epochs available. Unfortunately, the data that we have just presented cover only nine stars of the 53 possible BSs found in our analysis with Gaia, and one star of the three YS candidates we identified. This is so because we originally used the photometric-based list of Ahumada & Lapasset (2007) to select the objects to be observed with FLAMES, a list that differs significantly from that defined in this work.
Collinder 261 is a cluster of intermediate richness (see Figure 1). Our spectroscopic results are shown in Figure 7 and Table 4. Radial velocities for four epochs are available for 10 stars, among which we identified five as probable CB, and only one as LP binaries. Four stars did not show radial velocity variations, among them one yellow straggler and three blue stragglers. We performed an estimation of the masses of BS4, BS5 and BS8 we obtain 0.118 0.005 M⊙, 0.21 0.01 M⊙ and M2= 0.42 0.02 M⊙ respectively. We strongly suggest that at least one attempt to fit an orbit solution for the others BSs be made, since it will definitely help understand better the formation history and survival channels of blue straggler stars.
7 Acknowledgements
We are grateful to the anonymous referee for helpful comments which significantly helped improve the paper.
MJ. R is supported by CONICY PFCHA through Programa de Becas de Doctorado en el extranjero- Becas Chile / 2018-72190617.
S. V gratefully acknowledges the support provide by Fondecyt reg. n. 1170518.
J. A. wishes to thank ESO for stays in the Santiago Headquarters in January 2010, November 2011, and October 2015, where part of this work was originally developed.
References
- Ahumada & Lapasset (1995) Ahumada, J., & Lapasset, E. 1995, A&AS, 109, 375
- Ahumada & Lapasset (2007) Ahumada, J. A., & Lapasset, E. 2007, A&A, 463, 789, doi: 10.1051/0004-6361:20054590
- Aidelman et al. (2018) Aidelman, Y., Cidale, L. S., Zorec, J., & Panei, J. A. 2018, A&A, 610, A30, doi: 10.1051/0004-6361/201730995
- Arenou et al. (2018) Arenou, F., Luri, X., Babusiaux, C., et al. 2018, A&A, 616, A17, doi: 10.1051/0004-6361/201833234
- Avvakumova et al. (2013) Avvakumova, E. A., Malkov, O. Y., & Kniazev, A. Y. 2013, Astronomische Nachrichten, 334, 860, doi: 10.1002/asna.201311942
- Beccari et al. (2013) Beccari, G., Dalessandro, E., Lanzoni, B., et al. 2013, ApJ, 776, 60, doi: 10.1088/0004-637X/776/1/60
- Bhattacharya et al. (2019) Bhattacharya, S., Vaidya, K., Chen, W. P., & Beccari, G. 2019, A&A, 624, A26, doi: 10.1051/0004-6361/201834449
- Binney & Tremaine (2008) Binney, J., & Tremaine, S. 2008, Galactic Dynamics: Second Edition (Princeton University Press)
- Boffin et al. (2014) Boffin, H. M. J., Carraro, G., & Beccari, G. 2014, arXiv e-prints, arXiv:1406.3909. https://arxiv.org/abs/1406.3909
- Bragaglia & Tosi (2006) Bragaglia, A., & Tosi, M. 2006, AJ, 131, 1544, doi: 10.1086/499537
- Bressan et al. (2012) Bressan, A., Marigo, P., Girardi, L., et al. 2012, MNRAS, 427, 127, doi: 10.1111/j.1365-2966.2012.21948.x
- Brogaard et al. (2018) Brogaard, K., Christiansen, S. M., Grundahl, F., et al. 2018, MNRAS, 481, 5062, doi: 10.1093/mnras/sty2504
- Cantat-Gaudin et al. (2018) Cantat-Gaudin, T., Jordi, C., Vallenari, A., et al. 2018, A&A, 618, A93, doi: 10.1051/0004-6361/201833476
- Carraro et al. (2014) Carraro, G., de Silva, G., Monaco, L., Milone, A. P., & Mateluna, R. 2014, A&A, 566, A39, doi: 10.1051/0004-6361/201423714
- Carraro et al. (2008) Carraro, G., Vázquez, R. A., & Moitinho, A. 2008, A&A, 482, 777, doi: 10.1051/0004-6361:20078629
- Castelli & Kurucz (2003) Castelli, F., & Kurucz, R. L. 2003, in IAU Symposium, Vol. 210, Modelling of Stellar Atmospheres, ed. N. Piskunov, W. W. Weiss, & D. F. Gray, A20. https://arxiv.org/abs/astro-ph/0405087
- Dalessandro (2014) Dalessandro, E. 2014, in Astronomical Society of the Pacific Conference Series, Vol. 482, Tenth Pacific Rim Conference on Stellar Astrophysics, ed. H. W. Lee, Y. W. Kang, & K. C. Leung, 257. https://arxiv.org/abs/1310.6860
- de Marchi et al. (2006) de Marchi, F., de Angeli, F., Piotto, G., Carraro, G., & Davies, M. B. 2006, A&A, 459, 489, doi: 10.1051/0004-6361:20064898
- De Silva et al. (2007) De Silva, G. M., Freeman, K. C., Asplund, M., et al. 2007, AJ, 133, 1161, doi: 10.1086/511182
- Dias et al. (2014) Dias, W. S., Alessi, B. S., Moitinho, A., & Lepine, J. R. D. 2014, VizieR Online Data Catalog, 1
- Evans et al. (2018) Evans, D. W., Riello, M., De Angeli, F., et al. 2018, A&A, 616, A4, doi: 10.1051/0004-6361/201832756
- Ferraro et al. (2012) Ferraro, F. R., Lanzoni, B., Dalessandro, E., et al. 2012, Nature, 492, 393, doi: 10.1038/nature11686
- Gaia Collaboration et al. (2016) Gaia Collaboration, Prusti, T., de Bruijne, J. H. J., et al. 2016, A&A, 595, A1, doi: 10.1051/0004-6361/201629272
- Gaia Collaboration et al. (2018) Gaia Collaboration, Brown, A. G. A., Vallenari, A., et al. 2018, A&A, 616, A1, doi: 10.1051/0004-6361/201833051
- Gao (2018) Gao, X.-h. 2018, PASP, 130, 124101, doi: 10.1088/1538-3873/aae0d2
- Geller (2010) Geller, A. M. 2010, PhD thesis, The University of Wisconsin - Madison
- Geller et al. (2013) Geller, A. M., Hurley, J. R., & Mathieu, R. D. 2013, AJ, 145, 8, doi: 10.1088/0004-6256/145/1/8
- Geller & Mathieu (2011) Geller, A. M., & Mathieu, R. D. 2011, Nature, 478, 356, doi: 10.1038/nature10512
- Geller & Mathieu (2012) —. 2012, AJ, 144, 54, doi: 10.1088/0004-6256/144/2/54
- Geller et al. (2008) Geller, A. M., Mathieu, R. D., Harris, H. C., & McClure, R. D. 2008, AJ, 135, 2264, doi: 10.1088/0004-6256/135/6/2264
- Geller et al. (2009) —. 2009, AJ, 137, 3743, doi: 10.1088/0004-6256/137/4/3743
- Gosnell et al. (2014) Gosnell, N. M., Mathieu, R. D., Geller, A. M., et al. 2014, ApJ, 783, L8, doi: 10.1088/2041-8205/783/1/L8
- Gosnell et al. (2015) —. 2015, ApJ, 814, 163, doi: 10.1088/0004-637X/814/2/163
- Gozzoli et al. (1996) Gozzoli, E., Tosi, M., Marconi, G., & Bragaglia, A. 1996, MNRAS, 283, 66, doi: 10.1093/mnras/283.1.66
- Gray & Corbally (1994) Gray, R. O., & Corbally, C. J. 1994, AJ, 107, 742, doi: 10.1086/116893
- Grevesse & Sauval (1998) Grevesse, N., & Sauval, A. J. 1998, Space Sci. Rev., 85, 161, doi: 10.1023/A:1005161325181
- Hills & Day (1976) Hills, J. G., & Day, C. A. 1976, Astrophys. Lett., 17, 87
- Hurley & Tout (1998) Hurley, J., & Tout, C. A. 1998, MNRAS, 300, 977, doi: 10.1046/j.1365-8711.1998.01981.x
- Jayasinghe et al. (2019) Jayasinghe, T., Stanek, K. Z., Kochanek, C. S., et al. 2019, MNRAS, 486, 1907, doi: 10.1093/mnras/stz844
- Jordi et al. (2010) Jordi, C., Gebran, M., Carrasco, J. M., et al. 2010, A&A, 523, A48, doi: 10.1051/0004-6361/201015441
- Kaluzny (1994) Kaluzny, J. 1994, Acta Astronomica, 44, 247
- Katz et al. (2019) Katz, D., Sartoretti, P., Cropper, M., et al. 2019, A&A, 622, A205, doi: 10.1051/0004-6361/201833273
- Krone-Martins & Moitinho (2014) Krone-Martins, A., & Moitinho, A. 2014, A&A, 561, A57, doi: 10.1051/0004-6361/201321143
- Latham (2007) Latham, D. W. 2007, Highlights of Astronomy, 14, 444, doi: 10.1017/S1743921307011295
- Latham & Milone (1996) Latham, D. W., & Milone, A. A. E. 1996, in Astronomical Society of the Pacific Conference Series, Vol. 90, The Origins, Evolution, and Destinies of Binary Stars in Clusters, ed. E. F. Milone & J. C. Mermilliod, 385
- Leonard (1996) Leonard, P. J. T. 1996, ApJ, 470, 521, doi: 10.1086/177884
- Lindegren et al. (2018) Lindegren, L., Hernández, J., Bombrun, A., et al. 2018, A&A, 616, A2, doi: 10.1051/0004-6361/201832727
- Luo (2015) Luo, Y.-P. 2015, Research in Astronomy and Astrophysics, 15, 733, doi: 10.1088/1674-4527/15/5/010
- Mapelli et al. (2006) Mapelli, M., Sigurdsson, S., Ferraro, F. R., et al. 2006, MNRAS, 373, 361, doi: 10.1111/j.1365-2966.2006.11038.x
- Mathieu & Geller (2009) Mathieu, R. D., & Geller, A. M. 2009, Nature, 462, 1032, doi: 10.1038/nature08568
- Mathieu & Geller (2015) Mathieu, R. D., & Geller, A. M. 2015, in Ecology of Blue Straggler Stars, Vol. 413, 29, doi: 10.1007/978-3-662-44434-4_3
- Mazur et al. (1995) Mazur, B., Krzeminski, W., & Kaluzny, J. 1995, MNRAS, 273, 59, doi: 10.1093/mnras/273.1.59
- McCrea (1964) McCrea, W. H. 1964, MNRAS, 128, 147, doi: 10.1093/mnras/128.2.147
- Mishenina et al. (2015) Mishenina, T., Gorbaneva, T., Pignatari, M., Thielemann, F.-K., & Korotin, S. A. 2015, MNRAS, 454, 1585, doi: 10.1093/mnras/stv2038
- Mucciarelli et al. (2014) Mucciarelli, A., Lovisi, L., Ferraro, F. R., et al. 2014, ApJ, 797, 43, doi: 10.1088/0004-637X/797/1/43
- Pribulla et al. (2008) Pribulla, T., Rucinski, S., Matthews, J. M., et al. 2008, MNRAS, 391, 343, doi: 10.1111/j.1365-2966.2008.13889.x
- Samus’ et al. (2017) Samus’, N. N., Kazarovets, E. V., Durlevich, O. V., Kireeva, N. N., & Pastukhova, E. N. 2017, Astronomy Reports, 61, 80, doi: 10.1134/S1063772917010085
- Scholz & Stephens (1987) Scholz, F. W., & Stephens, M. A. 1987, Journal of the American Statistical Association, 82, 918, doi: 10.1080/01621459.1987.10478517
- Tonry & Davis (1979) Tonry, J., & Davis, M. 1979, AJ, 84, 1511, doi: 10.1086/112569
- Vats & van den Berg (2017) Vats, S., & van den Berg, M. 2017, ApJ, 837, 130, doi: 10.3847/1538-4357/aa5eba
- Wenger et al. (2000) Wenger, M., Ochsenbein, F., Egret, D., et al. 2000, A&AS, 143, 9, doi: 10.1051/aas:2000332