Driving the Last Mile: Characterizing and Understanding Distracted Driving Posts on Social Networks
Abstract
In 2015, , people were injured due to distracted driving in the US. One of the major reasons behind distracted driving is the use of cell-phones, accounting for of fatal crashes. Social media applications have enabled users to stay connected, however, the use of such applications while driving could have serious repercussions - often leading the user to be distracted from the road and ending up in an accident. In the context of impression management, it has been discovered that individuals often take a risk (such as teens smoking cigarettes, indulging in narcotics, and participating in unsafe sex) to improve their social standing. Therefore, viewing the phenomena of posting distracted driving posts under the lens of self-presentation, it can be hypothesized that users often indulge in risk-taking behavior on social media to improve their impression among their peers. In this paper, we first try to understand the severity of such social-media-based distractions by analyzing the content posted on a popular social media site where the user is driving and is also simultaneously creating content. To this end, we build a deep learning classifier to identify publicly posted content on social media that involves the user driving. Furthermore, a framework proposed to understand factors behind voluntary risk-taking activity observes that younger individuals are more willing to perform such activities, and men (as opposed to women) are more inclined to take risks. Grounding our observations in this framework, we test these hypotheses on cities across the world. We conduct spatial and temporal analysis on a city-level and understand how distracted driving content posting behavior changes due to varied demographics. We discover that the factors put forth by the framework are significant in estimating the extent of such behavior.
Introduction
Distracted driving is any non-driving activity that the driver engages in, which can lead to visual (taking eyes off the road), manual (taking hands off the driving wheel) or cognitive (taking the mind off driving) distractions (?). Distracted driving is particularly risky: In 2015, fatal crashes involving distracted drivers resulted in the deaths of individuals and , injuries in the US alone (?).
Usage of cell-phones while driving has been a primary reason for distraction-affected crashes, resulting in 69,000 total crashes in 2015 (?). Texting while driving can be particularly devastating as it combines all three types of distractions (visual, manual, and cognitive) (?; ?; ?; ?). Among cell-phone users, teenagers and young adults are especially at risk. Studies show that % of high schoolers text multiple times while driving (?), and teenagers and young adults comprise % of distracted drivers using cell phones (?).
We argue that social media use can have similar effects. Individuals spend % of their weekly online time on social networking applications (?), with % of traffic coming from smartphones (?). For instance, an average Snapchat user spends minutes daily on the platform (?). However, while many studies investigated the risk of using cell phones while driving, prior work generally focused on texting and emailing; thus, the impact of social media use remains relatively unknown.
We address this gap in our paper, by using large-scale data from Snapchat to develop a deep-learning based classifier to classify a post as distracted driving content or not. Then, grounded in Lyng’s edgework theory (?) (details in the next section), we investigate the extent to which people create and post content while driving and characterize the users and spatial and temporal patterns associated with higher incidence of such content.
We discover that (1) a deep learning classifier trained on content has a good performance in detecting distracted driving content, (2) distracted driving content posting behavior is widespread - 23% of snaps posted are related to distracted driving. Further, by analyzing the spatial and temporal patterns, we discovered that (3) distracted driving content is generally posted in night-time and regional affects are visible in the temporal patterns of such behavior and (4) distracted driving content posts are concentrated to only certain spots in the city. Finally, we also discovered that age and gender play a key role in inferring who is more likely to participate in such risk-taking behavior.
In summary, we make the following main contributions: (1) a classifier to detect distracted driving content posting behavior on Snapchat; (2) an empirical study characterizing the extent of distracted driving content behavior across cities around the world, the types of users more likely to engage in such behavior, and spatial and temporal patterns of distracted driving content snaps in these cities.
Our results have implications for platform designers and policymakers. Our proposed deep-learning based classifier can identify distracted driving content content posted on social media. Furthermore, the spatial and temporal patterns and individual user characteristics we uncover can inform the design of region-specific interventions for certain cities where such behavior is common, and for specific times when users generate these posts; as well as the design of individual-level interventions and educational campaigns for at-risk populations.
Privacy and Ethics: We collect data from SnapMaps, a geographical interface for Snapchat, which is publicly available. The data posted on the platform is already anonymized, and we neither collect nor use any personally identifiable information for our analysis. For variables extracted from the census, we only use the variables as is collected by the respective country’s census department.
Data and Code: Our code and data is publicly available at http://precog.iiitd.edu.in/research/distracted˙driving/.
Development of Research Questions
Our work is grounded in two theoretical frameworks. First, Goffman’s dramaturgical theory (?) describes how individuals may engage in risk-taking behavior to improve their peers’ impressions of them, even when interacting through online social media platforms (?). Goffman introduced the term “impression management”, which has been widely used to explain how an individual presents an idealized rather than a more authentic version of themselves (?). In the context of risk-taking behavior, Leary et al. (?) analyzed voluntary risk-taking activities such as avoiding condoms, indulging in narcotics and steroid use, and reckless driving, and suggested that such risk-taking activities are undertaken to improve the impression of individuals among their peers (?). Hogan (?) extended Goffman’s concept of impression management to online social media websites and considered the online social media platforms as a stage that allows users to control their impressions via status messages, pictures posted, and social media profiles. Similarly, we expect that social media users could post distracted driving content. Therefore, we ask our first research question:
RQ1. [Extent] What is the extent of distracted driving content posting behavior on Snapchat?
Second, Lyng’s edgework theory (?) characterizes voluntary risk-taking behavior (or, edgework) and identifies a range of individual and social factors that characterize the edgeworkers. The framework defines edgework activities as those where there is a “clearly observable threat to one’s physical or mental well-being”, such as rock-climbing, auto-racing, criminal behavior, drug use, etc. Edgework theory is social psychological, resting on the idea that individuals indulge in such activity to maintain the “illusion of control.” Treating illusory sense of control as a factor, Lyng observed that edgework is more common among young people than among older people and among males than females. Other studies have found similar evidence related to the gender and age of the risk-takers (?; ?). Building on this line of work, we also investigate if the demographic factors put forward by edgework framework also hold for distracted driving content posting behavior on Snapchat. We therefore ask:
RQ2. [Demographics] Which user demographic characteristics correlate with posting distracted driving content?
Besides the individual characteristics, Lyng also noted that individuals who are under pressure from external social forces are also more inclined to do edgework, as a way to exhibit control over experiences that are potentially even more dangerous. We expect that different geographic locations can give indications about the culture in that particular part of the world and hence the social forces at play. In addition, social media use is known to vary across geographies (?; ?; ?). For example, Kim et al. (?) studied how cultural contexts influence usage of social network sites among teenagers from US and Korea, finding that Korean participants used it for receiving acceptance from their peers, while US participants used the websites only for entertainment purposes. Similar studies were carried out by Hochman et al. (?) and Tifentale et al. (?), where they noticed different patterns across geographies in terms of photo-sharing behavior. A better understanding of the geographic patterns can help in designing more appropriate and effective interventions for the at-risk population in such regions. We, thus ask:
RQ3. [Spatial Analysis] How does distracted driving content posting behavior vary across cities worldwide?
There is much variability in the temporal patterns of social media usage. For example, Golder et al. (?) analyzed Facebook messaging pattern across universities and discovered temporal rhythms. They showed that students across all universities followed a “weekday” and a “weekend” pattern and further showed that students in the same university behaved similarly. Grinberg et al. (?) discovered interpretable temporal patterns for mention of different terms related to nightlife, coffee, etc. on Twitter and Foursquare checkins. Golder et al. (?) further analyzed the temporal patterns of Twitter messages and were able to identify diurnal and seasonal mood rhythms, such as observing that people were generally happier on weekends; and that the morning peak in the number of messages was delayed by 2 hours on weekends. We investigate whether we can derive similar diurnal patterns for distracted driving content posting behavior, and ask:
RQ4. [Temporal Analysis] How does distracted driving content posting behavior vary with time?
However, before we can begin to study distracted driving content posting behavior on Snapchat empirically, we first need to be able to detect such behavior. A major component of our work building a classifier to identify distracted driving content , where the content creator is driving or is distracted while driving. A popular stream of work in the area of classifying videos is to apply multiple image-based classifiers on the frames of the given video. To this end, He et al. (?) proposed a deep learning model that learns the residual functions and out-perform previous competitors in a widely popular ImageNet challenge. Zagoruyko et al. (?) further improved the ResNet model and proposed a Wide Residual Network (WRN), which uses the increased width of the network to improve accuracy. Xie et al. (?) modified the ResNet model by introducing a new hyper-parameter called cardinality to better tune the depth and width of the model. We use some of these architectures as candidate models for our deep learning classifiers. Among the video classification approaches used for action recognition, an approach that operates on spatio-temporal 3D CNNs stands out (?) by having high accuracy on standard action recognition datasets such as Kinetics and UCF101. Based on the above insights, we explore the feasibility of learning a robust classifier to distinguish between distracted driving content and non-distracted driving content, asking:
RQ5. [Detection] How can we use Snapchat content to distinguish between distracted driving and other videos? Moreover, how accurate is such a classifier?
Data Collection and Dataset
In this work, we study a widely used social media platform, Snapchat. Snapchat is a popular platform that allows users to post multimedia content(snaps) that can be shared with other users - visible by all or only by friends. Our dataset is based on SnapMap - a unique feature where any content can be posted publicly anonymously. The content posted on Snap Map is automatically geo-tagged and is shown in a localized region, though not giving the exact location.
| City | Economic Status111https://www.cia.gov/library/publications/the-world-factbook/appendix/appendix-b.html | Pop. | Male (% age) | Pop.() |
| Cape Town | Developed | M | ||
| London | Developed | M | ||
| Melbourne | Developed | M | ||
| New York | Developed | M | ||
| Rio De | Developing | M | ||
| Janeiro | ||||
| Riyadh | Developing | M |
Data Collection
For obtaining the data through SnapMap, we leverage the underlying API to collect data across cities. We select these cities such that they give us a wide coverage over the entire world and they were constrained on having a minimum population of each. Further, we filter out cities where there is limited or restricted Snapchat usage (for example, Chinese metropolises). A sampled list of some of the cities selected for this analysis, with certain attributes (that we use for future analysis) is provided in Table 1.222A full list of cities is available in the Supplementary, to be uploaded on acceptance. We utilize the shapefiles obtained from OpenStreetMap333https://www.openstreetmap.org to precisely define the region enclosed by a city. In the absence of a city’s shapefile, we use its bounding box values instead.
This overall city’s region/bounding box is divided into smaller tiles using a grid such that each tile is . A similar approach has been previously used in geographical studies on Snapchat (?) which utilizes a tile of size km respectively. We periodically collect snaps posted in each of these grid tiles, crawling each city once every 8 hours. The data collected lists the time at which the snap was posted in Coordinated Universal Time (UTC), which we then convert to the local time-zone of the corresponding city to allow for uniformity in the temporal analysis.
| Number of Snaps collected | 6,431,553 |
|---|---|
| Number of cities scraped | |
| Time of first Snap | 16-03-2019 00:00:00 |
| Time of last Snap | 15-04-2019 23:38:57 |
| Most active city | Riyadh (,,) |
| Least active city | Havana |
| Most active day | 13th April, 2019 () |
| Least active day | 30th March, 2019 () |
| % Snaps deleted |
Overall, a brief statistics of the collected dataset is given in Table 2. We observed that , snaps were deleted after posting and were not used in our analysis. Though our work is concentrated on Snapchat, it can be easily extended to most social media platforms where users post multimedia content (images/videos).
Detecting Distracted Driving Content
| Type | Architecture | Accuracy | Precision | Recall | F1 Score |
|---|---|---|---|---|---|
| Image-Based (Single Voting) | ResNeXt-50 | ||||
| ResNet-34 | |||||
| WideResNet | |||||
| Image-Based (Majority Voting) | ResNeXt-50 | ||||
| ResNet-34 | |||||
| WideResNet | |||||
| Video-Based | ResNet-34 | ||||
| ResNeXt-101 |
To be able to build a classification model, we need to have a ground truth dataset of snaps with labels marking each as either distracted driving content or non-distracted driving content. We built an annotation portal (details of the portal provided in Supplementary), and asked annotators to provide labels for over K snaps, randomly sampled from our dataset. We annotate each snap for distracted driving content 444This annotations might sometimes contain content shot by the passenger of the car. Arguably a front-seat passenger creating social media content, e.g., a video, could also be a source of distraction for the driver. or non-distracted driving content and ensure that at least three annotators annotated each snap. We obtained a Fleiss-Kappa inter-annotator agreement rate of , which signifies almost perfect agreement (?). A snap was assigned a ground-truth label of distracted driving content if two or more annotators agree that it is a distracted driving content snap. An anonymized example of distracted driving content snap can be viewed at https://rebrand.ly/driving-snap. This snap is clearly dangerous as it is created by an individual who is driving and hence is classified as an example of distracted driving.555Annotation portal screenshot in Supplementary
Dataset. We randomly sample and split the manually annotated snaps into training and test set of , (6,392 negative, 2,242 positive) and , snaps (1,118 negative, 361 positive) respectively. We train our model using fold cross-validation on this so obtained dataset. The number of positive samples (distracted driving) in our training dataset is much less than the number of negative samples (non-distracted driving) which creates a class imbalance.
We experiment with two different kinds of classifiers - image-based and video-based. The main distinction between both types of approaches is that the image-based classifiers first converts the snap (a video) into frames, and then each frame is classified independently as either distracted driving content or non-distracted driving content. Post classification of each frame, various aggregation techniques (single and majority voting) are used to obtain a single label for the entire snap. On the other hand, the video-based classification methods use the entire video as an input.
Image Based Methods. We build our image-based methods over existing image-based deep learning architectures. We leverage the best-performing classifiers that have achieved high accuracy on ImageNet Large Scale Visual Recognition Challenge (?). The challenge consisted of 1.2M images covering , classes. Specifically, we experiment with ResNet-34 (?) ( top 1 error), ResNeXt-50 (?) ( top 1 error) and WideResNet-50 (WRN) (?) (% top 1 error). The wide residual networks perform well as they decrease the depth of the network and increase its width to increase the representational power of the residual blocks. We pre-train these architectures on the ImageNet dataset, following which we fine-tune them on our annotated dataset using transfer learning. Such a technique is based on transfer learning and is efficient even when a small number of samples are used to fine-tune (?). The number of training samples in our dataset after converting the videos to frames is ,, which is sufficient for transfer learning. To solve the class imbalance issue, we use data augmentation techniques such as random cropping and horizontal flipping to increase the number of driving frames shown to the network during training. For converting the snaps (videos) to frames, we sample a frame every second - every 30th frame per second (video’s original playback rate is 30fps). For each frame, we obtain a label of whether it is distracted driving content or non-distracted driving content. To obtain a single label for the entire snap, we use two aggregation techniques - (a) Majority voting and (b) Single voting. For majority voting, we classify the entire snap to be distracted driving content if the majority of the frames are assigned to distracted driving class, whereas for single voting, we classify the entire snap as distracted driving content content if we classify even a single frame as distracted driving content. We tune the hyper-parameters of these models using 5-fold cross-validation and report their accuracy, precision, recall and F1 score 666We report the precision, recall and F1 score of the minor class in all our results on the test set in Table 3.
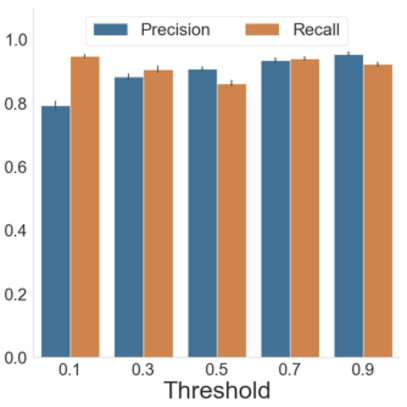
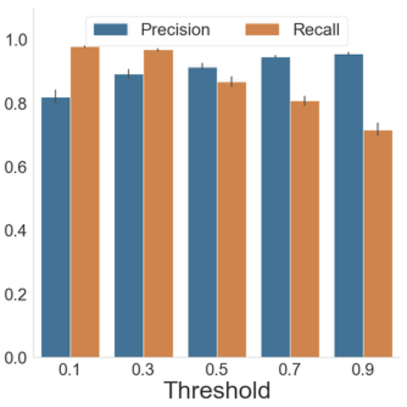
To measure the robustness of the frame selection, we compare our frame sampling strategy with that of a random frame sampling every second. We discover that the random frame sampling-based approach performs worse than our frame sampling strategy (random sampling has , compared to our frame sampling’s accuracy). Similarly, we also experiment with different voting aggregation techniques - where a snap is assigned a label if more than , , , and of the frames have the same label. We report these results in Figure 1.
Video Based Methods. For video-based classifiers, we again use state of the art architectures for a video classification task. Karpathy et al. explored multiple ways to fuse temporal information from consecutive frames using 2D pre-trained convolutions (?). Similarly, Hara et al. proposed spatiotemporal 3D CNNs for video classification (?). They examined deep architectures based on 3D Res-Net backbones for several datasets, achieving a top-5 accuracy of on the Kinetics dataset(?). The Kinetics dataset consists of more than 300K videos with 400 class labels. To adapt these architectures for our classification task, we re-train two of their pre-trained models, which are based on ResNet34 and ResNeXt-101 architectures over our annotated dataset. Similar to the image-based methods, we utilize random cropping to solve the class imbalance issue.
The image classifiers perform better than the video classifiers, as shown in Table 3. We hypothesize that this might be because the image classifiers are pre-trained on the ImageNet dataset, which allows the classifiers to gain a much better internal representation of outdoor driving scenes. On the other hand, the Kinetics dataset on which the video classifier is pre-trained contains labels for action recognition tasks which do not transfer well to our task. Another reason why the video classifier does not perform as well as the image classifier is that the video classifiers require large amounts of data to train properly which, due to manual annotation limits, is not available for our dataset.
Training Details We train all our image-based models using Adam optimizer. The best model was trained with learning rate of , batch size , and utilized weight decay for regularization purposes. We train all the models for a maximum of epochs with the total training time of around hours on Nvidia GTX 1080Ti GPU.
For the video classifier models, we use SGD (Stochastic Gradient Descent) with momentum and set the learning rate to . We use a batch size of for the video classifiers and train both the models for a maximum of epochs each. We also use weight decay as a means of regularization for the model.
Validation and Robustness of Classifier To validate the generalizability of our proposed method, we create a held-out test set from our collected dataset (dataset that was not previously used in any step of training). We randomly sampled , snaps from our collected dataset ( positive, negative). We did not place any geographic/temporal constraints on selecting these posts. On this held-out set, we see that all methods achieve a high accuracy of at least , as shown in Table 4.
| Type | Architecture | Accuracy | F1-Score |
|---|---|---|---|
| Image-Based (Majority Voting) | ResNeXt-50 | ||
| ResNet-34 | |||
| WideResNet | |||
| Video-Based | ResNet-34 | ||
| ResNeXt-101 |
In the above section, we show that our proposed deep learning approach that leverages the content of the snap can be used to detect distracted driving content snaps successfully (RQDevelopment of Research Questions).
Characterizing Temporal and Spatial Patterns
In this section, we first measure the extent of distracted driving content posting behavior across various cities on the platform. Temporal patterns have proven to be useful for analyzing trends; we perform temporal analysis on our dataset to understand when such type of behavior (posting distracted driving content) is prevalent. Further, we conduct spatial analysis to explore interesting patterns across and within each city to determine if such behavior is concentrated on certain parts of the city or is spread across uniformly.
Extent of distracted driving content
Related to RQDevelopment of Research Questions, we want to understand the extent of posting distracted driving content across various cities. To measure this, we applied our deep-learning classifier built in the previous section on all the snaps (M) we collected. We discovered that around of the snaps in our dataset consisted of distracted driving content. Further, we analyzed which cities were exhibiting such behavior the most, and present it in Figure 2.
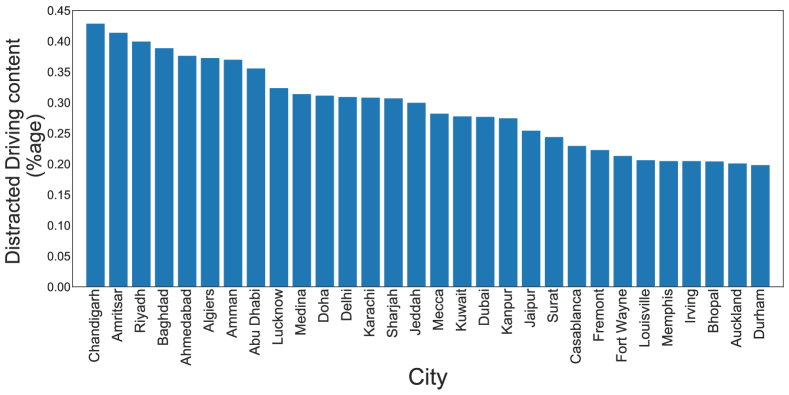
We observe that middle-eastern (Riyadh, Baghdad) and Indian cities (Chandigarh, Amritsar, Ahmedabad) were posting such content in high percentages (). Such behavior was found to be lower in European and American cities, and we find that there is not even a single European or American city in the list of top- cities. Moreover, the first American city (Fremont, CA) that has a high percentage () of distracted-driving content has only very few total numbers of snaps (,).
Insight 1 (Regional Effect)
The trend of posting distracted driving content on Snapchat is predominantly higher in Middle-Eastern and cities in Indian sub-continent, as compared to other cities across the world.
Temporal Analysis
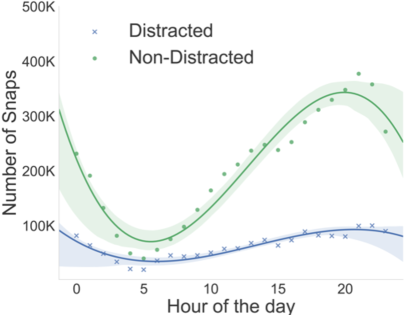
We investigate how driving content posting behavior differs across time. In Figure 3(a), we present the hour-wise distribution of (i) when users post distracted driving content, (ii) when users post any form of content. We can see that the distracted driving content is approximately a uniform fraction of all the posts across the day. Users are often more active during the night-time (6PM-2AM), posting % more posts per hour in this period relative to the frequency of posting over other hours of the day. We observe a similar trend for driving snaps, where the number of driving snaps posted per hour during the evening to night window is found to be % more than the rest of the day.
Further, to show that the driving snaps are a uniform fraction of the overall snaps, we compute the correlation between the number of driving snaps posted and the number of total snaps posted in every hour for the entire month of the data collected and find it highly correlated with a Pearson correlation coefficient of . We can also observe that a sharp drop in non-distracted-driving content is not complemented with a similar drop in the distracted driving content posting. Due to this, we observe a pattern of higher distracted driving content posting activity through the night, and into the hours of the morning.
Insight 2 (Night-time Driving)
The incidence of posting while driving behavior over the night is more pronounced than other forms of content posting during the same hours.
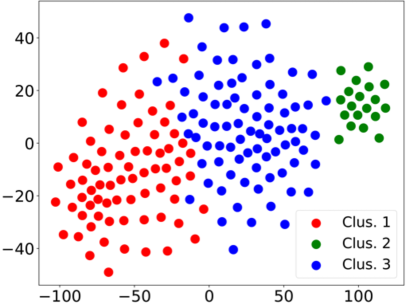
We further investigate the different temporal patterns that exist across different cities. We cluster the fraction of distracted driving snaps posted per hour over the entire week for each city. Using silhouette score coefficient (?) and also Elbow method (?), we estimated the number of clusters to be for K-means clustering. We show the two-component T-SNE representation (?), along with the cluster label for each city to show the efficacy of the clustering in Fig 3 (b). From the figure, we can see that the clustering so obtained separates the cities well. In the clusters we obtained, we observed that first cluster corresponded to most European cities (containing of European cities we analyzed). The second cluster consisted only of Indian () and Middle-Eastern cities (). The final cluster consisted of primarily American cities (containing of American cities we analyzed.
Insight 3 (Temporal Clustering)
Temporal patterns exhibited by different cities can be meaningfully clustered, and indicate overall geographical and cultural patterns.
We can observe the presence of temporal patterns in distracted driving content posting behavior, which answers RQDevelopment of Research Questions. This analysis could be used by platform designers or policy makers to target cities at a specific time of the day by discouraging or warning users about this type of behavior.
Spatial Analysis
Previously, spatial analysis on SnapMaps has been used to show that usage of Snapchat, while posting publicly to maps has been concentrated (?). We use spatial analysis to investigate these insights further while focusing on distracted driving content posting behavior.
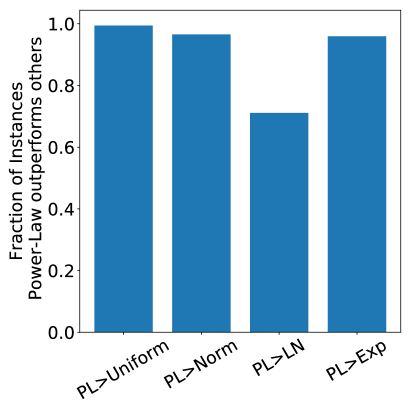
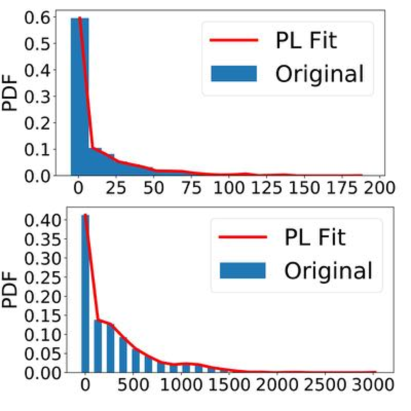
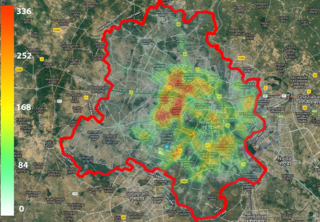
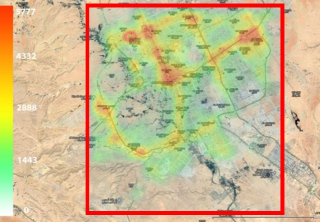
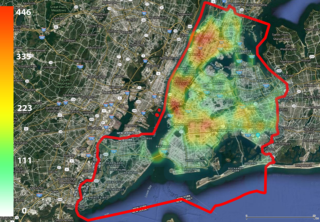
In Figure 4, we show the spatial distribution of distracted driving content snaps for three popular cities ((a) Delhi, (b) Riyadh and (c) New York City). We can see that for these cities the distribution is concentrated on small regions on the map. To measure if the distracted driving content snaps are concentrated or not, we model the distribution of the number of distracted driving content snaps per tile for each city with a known parametric family of distributions. Concentrated distracted driving content snaps will follow a power-law (PL) distribution, as compared to uniform distracted driving content snaps which will follow a uniform distribution. We try to fit multiple distributions (power-law, gaussian, log-normal, and exponential) on all cities per tile to model distracted driving content content distribution. We discover that power-law distribution fits better than all the other candidate distributions for the majority of the cities when compared using log-likelihood and BIC metrics. We plot the percentage of instances for which power-law distribution fits better than other candidate distributions in Figure 5(a). We also show power-law distribution fit for two cities - Riyadh (top) and Delhi (bottom) and observe that the fits are visually accurate.
Insight 4 (Concentrated Driving Content)
For most of the cities across the world, the distracted driving content posting behavior is geographically concentrated to only a few tiles and not uniformly distributed across the city.
Another interesting pattern that we observe was that for certain cities, the distracted driving content was observed to be higher on major roads. For example, in Riyadh’s heatmap (Figure 4(b)), we can see two major roads having a higher concentration of distracted driving snaps. However, we cannot quantify this pattern across all cities as we do not have access to underlying road and highway data and leave this pattern quantification as future work.
We discovered useful insights about distracted driving content posting behavior within and across cities, thus answering RQDevelopment of Research Questions. Such insights can be used to develop interventions based on geographic areas.
Characterizing Users
For our investigation into the demographics of the user (RQDevelopment of Research Questions), we aim to understand how the demographics of a particular city affect the number of driving snaps.
Explanatory Variables
Most previous work in risk-taking has focused on two important characteristics of individuals indulging in risk-taking activities (?; ?), namely gender and age. In this work, we extend their work and investigate the role of gender and age in a user’s proclivity to create distracted driving content. Therefore, we examine these two features - gender and age distribution for each city. Additionally, since Snapchat is a popular Internet-based platform, it is imperative to understand the economic influences that might affect the type of usage of the platform. Therefore, we use the development status of a country in which the city is as one of the control variables. We classify the countries of the world in our dataset as either developed or developing based on the definition of developed nations given in CIA’s world factbook (?). The economic status of the city further acts as a proxy for various other additional variables for which data is less readily available such as smartphone penetration, social media usage, and availability of public transportation facilities. We also account for certain control variables such as the total number of snaps posted in the city and the population of the city. We obtain the population estimate for each city from worldpopulationreview.com, where we use the latest estimate available. Similarly, we obtain the gender ratio statistic from the latest available census data that has been aggregated on citypopulation.de. However, the website does not provide us with the latest data for all the cities. In such cases, we take the latest gender ratio available and assume that it remains constant for the city. For computing the age-distribution, we used the statistics from citypopulation.de, and for cities where the data was not available - census data for the respective country was obtained. It is possible that for statistics such as gender and age, the statistics across cities might have been computed for different years. To account for this discrepancy, we use age and gender variables as a percentage over the total population. Finally, we did not include cities for which we did not have satisfactory census data, which left us with cities.
Effect of Variables
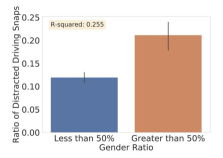
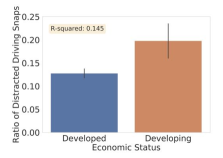
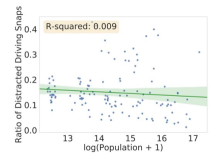
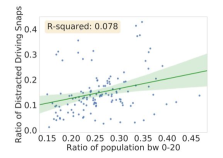
We investigate the relationship between the variables mentioned above and the number of distracted driving snaps posted from each city, based on which we observe some interesting patterns. From Figure 6(a), we can observe that the distracted driving snaps ratio for cities where the gender ratio is in favor of males is roughly more than that of the cities where the gender ratio is in favor of females (, . Similarly, from Figure 6(b), we observe that distracted driving snaps ratio posted in the developing cities is roughly more than that of the developed cities (, ). In Figure 6(c), we present the scatter plot of the population of a city (log scale) with the number of driving snaps posted. We can see that there is a small negative slope, possibly implying that cities with the larger population have a lower number of driving snaps. Interestingly, we note that the slope in the case of the ratio of the population below is positive (, ), suggesting that cities with a higher ratio of population in the age group of have a higher number of driving snaps.
Statistical Model
We are interested in explaining the number of distracted driving snaps posted from every city. We assume a linear relationship between the number of distracted driving snaps and the other variables discussed previously. We transform all the count variables to log-scale to stabilize their variances. The explaining variables (or independent variables) along with the dependent variable we use to model are shown in Table 5. Besides the explaining variables - we also use the number of total snaps as a natural control for the popularity of Snapchat in the city. We present the results of the regression on all the cities for which we were able to get satisfactory data in Table 6.
| Variable Name | Description | Min. | Max. |
|---|---|---|---|
| Independent Variables | |||
| Population | |||
| % of pop. <20 | |||
| 20 >% of pop. <40 | |||
| % of pop. >40 | |||
| Male ratio | Ratio of Male pop. | ||
| # Total Snaps | |||
| Dependent Variable | |||
| # Driving Snaps | |||
| Dependent variable | ||
| Coeffs(Err.) | LR ChiSq | |
| Intercept | ||
| coefficient | ||
| Note:, , | ||
Analyzing the results, we can see that the term Total Snaps (TS) introduced as a control variable behaves as expected. The effect of the variable is significant and positively related, with a one percent rise in the log number of snaps posted associated with a rise in the log number of distracted driving snaps. We can also see that the population of a city has a significant negative effect. This could perhaps be explained by the fact that as the cities grow in population, the traffic and congestion on the road also increases, leading to more time spent on paying attention to the road as compared to that spent on a phone.
Connecting back to our RQDevelopment of Research Questions, we want to figure out what demographics of users are more inclined to indulge in distracted driving content posting behavior. We first investigate the role of gender and its contribution to the number of distracted driving snaps across cities. It has often been shown that proclivity of taking risk is higher among males (?; ?). We verify the same hypothesis in our regression model, where we observe that the percentage of the male population has a significant, positive, and large effect. A one percent increase in the male ratio would lead to a 0.05% rise in the log number of distracted driving snaps.
Insight 5 (Role of Gender)
Cities with higher male ratio are more likely to produce more distracted driving snaps.
Another popular result of the edgework framework is that younger people are more likely to participate and indulge in risk-taking activities. In our model, we introduced variables as percentage of individuals less than 20 years of age (), between 20 and 40 years of age (), and above 40 (). We discovered that has a significant positive effect on the number of distracted driving snaps posted in the city. However, the other two variables did not have any significant effect. Though this result is significant, it is also probably biased as Snapchat is a platform that is primarily used by young people; hence, there is a possibility that this observation just might be capturing that effect.
Insight 6 (Role of Age)
Cities with higher proportion of young people are more likely to post distracted driving snaps than cities with higher proportion of older people.
Additionally, we see that there is an effect of whether the city is developed or developing () on the number of distracted driving snaps that get posted. We discover that if a city is in a developing nation, then there are higher chances of distracted driving snap posting behavior. This is in accordance with the overall spatial and temporal pattern observed, the cities being ranked consistently higher in distracted driving snap posting behavior were mostly cities from developing countries.
Insight 7 (Effect of Development)
Users from cities in developing world are more likely to post distracted driving snaps.
Discussion
Research Questions
RQDevelopment of Research Questions relates to the extent of distracted driving snaps are posted on Snapchat across cities. The question tries to estimate the prevalence of such type of risk-taking behavior on social media platforms, thus quantifying the importance of studying such problems. We discovered that distracted driving snaps form of total snaps posted across cities. Further, we also noticed that such behavior is more prevalent in Middle-Eastern and sub-continent Indian cities(accounting for % of distracted driving snaps overall). By answering RQDevelopment of Research Questions, we investigated the spatial patterns of distracted driving content posting behavior. We discovered that such content is posted in certain regions of the city; and is not uniform across the city, thus, showing that distracted driving content posting behavior is concentrated. However, we were unable to analyze these hotspots for the underlying demographic and geographical features to understand the reason behind such concentration - largely due to the lack of data at that granularity. RQDevelopment of Research Questions is focused on determining temporal patterns behind distracted driving content posting behavior. We made key observations based on temporal analysis of the behavior across cities. We discovered that most of such content is posted heavily during night-time. Further, we were also able to discover strong regional effects - where the clusters formed on clustering the fraction of snaps posted each hour of the week segmented into clusters comprising majorly of European, American and Mid-Eastern cities.
One of the key frameworks proposed by sociologists to explain risk-taking literature has been edgework. The framework, besides defining voluntary risk-taking behavior and applying it to different settings, also proposed characteristics that define the users who are inclined to take such risks. The observations made about such voluntary risk-takers was based on the concept of an illusory sense of control, where a user feels that they have more control of the situation than they actually do. The theory discovered that males and young people generally felt more of such an illusory sense of control. We tested whether the theories put forward by the edgework framework also hold for the case of distracted driving content posting behavior on social media platforms. We attempted to answer this in RQDevelopment of Research Questions. We discovered, in concurrence with the theory, that males are more inclined to participate in such voluntary risk-taking behavior. Further, we also discovered that younger people are more inclined to exhibit such behavior, another key characteristic proposed by the framework. Another key point put forth by the theory was that individuals who were of a social system that exhibited much larger control over their life ended up participating in such behavior in seek of a high-stakes feeling of control over the situation. We hypothesized that this could relate to the economic situation of a particular city - and tested if individuals from developing regions (instead of developed) were more likely to participate in risks or not. We discovered that we do see the effect of the economic status of the city. However, we only treat economic status as a proxy for control; many other factors such as political and cultural could be considered, which are hard to obtain and quantify.
Finally, to be able to answer any of the RQs as mentioned earlier, we needed to figure out how can we detect if a particular snap is an example of distracted driving content or not. Due to the large scale of our study, it is infeasible to label the entire dataset manually. Hence, we answered RQDevelopment of Research Questions by proposing a deep learning classifier and were able to achieve high precision and recall. Further, we even tested the robustness of the trained classifier to show that the proposed method performs robustly on an held-out set.
Implications
Our paper provides a robust way of detecting if the content posted on Snapchat is an instance of distracted driving content or not. Further, our results provide insights into the extent of such behavior on a popular social media platform Snapchat, and spatial, temporal and demographics related patterns. We believe that the platform owners and policymakers can leverage insights put forward by our work to develop educational campaigns and interventions. We discuss some of the suggestions below:
Location-Based: One of our key insights (Insight 1) was that distracted driving content posting behavior is prevalent mostly in Middle Eastern and Indian cities. Thus, some of the educational campaigns could be focused only on these regions and can be disseminated within the platform itself. Another insight that could be crucial in designing platform-based interventions is that such behavior is concentrated only in certain regions of cities. The platform owners can analyze the content posted around these hotspots with the proposed deep learning classifier to determine if the content posted are instances of distracted driving or not, and make a decision of not showing such content at all. In the case of Snapchat specifically, users post such content on SnapMaps to gain popularity from the general public; however, if such content is not allowed to be posted on the platform from these regions, there is a possibility that it might discourage the individuals from creating such content. However, this requires more experimentation to determine if such a form of intervention can be useful or not.
Time-Based: Our work made a useful insight about nighttime driving, indicating that such content is generally posted late in the night (insight 2). This insight could be leveraged to issue educational notifications at that time of the day when such at-risk users could be active.
Demographics-Based: The major insight we draw from our regression analysis was the role of age and gender in characterizing the users who participate in such behavior. We discovered through insights 5 and 6 that young individuals and males are more likely to participate in such behavior. If a platform has a way of inferring identities of their users, it could be leveraged in combination with the other insights to create targeted interventions and educational campaigns for these specific demographics.
We are aware that a social media platform has other constraints while issuing notifications, such as the number of them, and restricting users not to share certain types of content, which could potentially lead to violation of their freedom to express. All the above mentioned interventions can be combined with the proposed deep learning classifier to give the platform owners more flexibility to design interventions and educational campaigns. Since such interventions can also act in unintended ways (such as suggesting risk-takers not to perform risk-taking behavior; hence, actually motivating them), more analysis needs to be done before proceeding forward.
Threats to Validity
Like any quantitative study, our work is subject to threats to validity. We try to enumerate biases, issues, and threats to the validity of our study by following a framework for inferring biases and pitfalls while analyzing social data by Olteanu et al.(?). First, our work is based on the data collected on Snapchat, mostly through SnapMap. A key data issue is that of representativeness - our collected data, though might not be geographically or temporally biased (since we collected data across the world and for a large amount of time), it can still be that we are collecting data disproportionately from regions that post more frequently publicly on SnapMaps rather than Snapchat in general. Another representative issue is that we are linking Snapchat usage data with that of census data in general; where Snapchat users might not be representative of the entire cities population. We try to discount this representation bias by including appropriate control variables, but still, some of the bias might exist in our analysis. Additionally, our dataset might also contain temporal bias as during our one-month long data collection; it might be possible that some cities might be observing festival-related holidays or some events. This might have introduced a disproportion in the number of snaps collected from each city. A significant source of data bias in our analysis is the use of census data. Firstly, we were not able to obtain data for each city and thus had to omit certain cities from our analysis. Secondly, census data is obtained from different years, and finally, the census data for different cities are taken from different sources.
For the annotation required for training deep learning classifier, we used a limited number of annotators, which might result in subjective interpretation. We attempted to mitigate this threat by using majority voting and computing inter-annotator agreement rate. Finally, our statistical modeling required multiple parameters that were related to the operationalization of theories that exist in literature. Some of these parameters might not be capturing the factors that we intended to capture or that the theories captured. Additionally, we made an assumption where we posited content posted by a front seat passenger also as a form of distracted driving content, which might not be true. It could be possible that our analysis might be applicable only for Snapchat and might not generalize well for other platforms and also for other risk-taking behavior.
Related Work
Besides the relevant theories and framing discussed in “Development of Research Questions”, there are other related work that should be discussed. We discuss them here:
Recently, there have been some studies on analyzing risk-taking behavior on social media for different voluntary activities. Lamba et al. covered a much broader case of dangerous selfies, where users posted a perilous self-portrait in dangerous situations such as at an elevation, with a firearm, or inside a water body(?). They also showed that users often engage in risk-taking activities while taking selfies to post on social media. Of the 232 deaths due to taking dangerous selfies, could be attributed to driving-related incidents. The authors presented deep-learning models to distinguish between potentially dangerous and non-dangerous selfies (?). Similarly, Hart examined young individuals’ participation in posting nude self-portraits on Tumblr (?). There has been a normative increase in individuals dabbling in risk-taking behavior as a result of various other social media trends such as the Tide Pod Challenge (?), the Cinnamon Challenge (?), the Salt and Ice Challenge (?) and the Fire Challenge (?; ?). However our work is the first in analyzing the specific behavior of distracted driving content posting on social media. Further we extend the popular voluntary risk-taking edgework framework to social media platforms.
Future Work
In this work, we concentrated on characterizing the extent of distracted driving content posted on Snapchat. However, this study could be extended to other platforms as well. Additionally, we concentrated on corroborating edgework framework for distracted driving content - this could potentially be extended to other edgework activities that can be observed on online social platforms. Technically, we made the assumption that front seat passenger posted video can potentially be also dangerous - however the classifier can be made only to annotate driver posted content as true positive by making the architecture either more hierarchical (first classify whether the content is about driving and then if it is posted by driver or not) or by carefully annotating the training set.
Conclusions
In this work, we investigate the widespread prevalence of distracted driving content posting behavior. We specifically focus on a popular social media platform, Snapchat, and by analyzing the publicly posted stories, we characterized the extent of distracted driving content that exists on such platforms.
Our first contribution is proposing a deep learning based classifier to detect if a content posted is distracted driving or not. Grounding our work in risk-taking literature, we aim to test out the theories put forth by sociologists in terms of risk-taking behavior in the offline world in the context of distracted driving content posting behavior on social media platforms and test them. To this end, we proposed and answered multiple RQs related to extent, spatial, temporal and demographic patterns of such behavior across cities.
We made the following key observations related to the few RQs - the demographics such as age and gender play a key role in the proclivity to post distracted driving content. Further, we also discovered that there exists spatial and temporal patterns in distracted driving content behavior posting across cities. We hypothesize that the insights derived from this study can be used to design targeted intervention and educational campaigns to curb such risk-taking behavior.
Acknowledgements We are very thankful to Bogdan Vasilescu for his comments on the draft. We are also very thankful to the anonymous reviewers for their thoughtful suggestions and comments.
References
- [Agency 2009] Agency, C. I. 2009. The CIA world factbook 2010. Skyhorse Publishing Inc.
- [Ahern, Sauer, and Thacker 2015] Ahern, N. R.; Sauer, P.; and Thacker, P. 2015. Risky behaviors and social networking sites: how is youtube influencing our youth? Journal of psychosocial nursing and mental health services 53(10):25–29.
- [Avery et al. 2016] Avery, A. H.; Rae, L.; Summitt, J. B.; and Kahn, S. A. 2016. The fire challenge: a case report and analysis of self-inflicted flame injury posted on social media. Journal of Burn Care & Research 37(2):e161–e165.
- [Caird et al. 2008] Caird, J. K.; Willness, C. R.; Steel, P.; and Scialfa, C. 2008. A meta-analysis of the effects of cell phones on driver performance. Accident Analysis & Prevention 40(4):1282–1293.
- [Doyle 1995] Doyle, J. A. 1995. The male experience. Brown & Benchmark.
- [Fleiss and Cohen 1973] Fleiss, J. L., and Cohen, J. 1973. The equivalence of weighted kappa and the intraclass correlation coefficient as measures of reliability. Educational and psychological measurement 33(3):613–619.
- [GlobalWebIndex 2018] GlobalWebIndex. 2018. Social report https://www.nielsen.com/content/dam/corporate/us/en/reports-downloads/2017-reports/2016-nielsen-social-media-report.pdf.
- [Goffman 1959] Goffman, E. 1959. The presentation of self in. Butler, Bodies that Matter.
- [Golder and Macy 2011] Golder, S. A., and Macy, M. W. 2011. Diurnal and seasonal mood vary with work, sleep, and daylength across diverse cultures. Science 333(6051):1878–1881.
- [Golder, Wilkinson, and Huberman 2007] Golder, S. A.; Wilkinson, D. M.; and Huberman, B. A. 2007. Rhythms of social interaction: Messaging within a massive online network. In Communities and technologies 2007. Springer. 41–66.
- [Grant-Alfieri, Schaechter, and Lipshultz 2013] Grant-Alfieri, A.; Schaechter, J.; and Lipshultz, S. E. 2013. Ingesting and aspirating dry cinnamon by children and adolescents: the “cinnamon challenge”. Pediatrics 131(5):833–835.
- [Grinberg et al. 2013] Grinberg, N.; Naaman, M.; Shaw, B.; and Lotan, G. 2013. Extracting diurnal patterns of real world activity from social media. In Seventh International AAAI Conference on Weblogs and Social Media.
- [Hara, Kataoka, and Satoh 2018] Hara, K.; Kataoka, H.; and Satoh, Y. 2018. Can spatiotemporal 3d cnns retrace the history of 2d cnns and imagenet. In Proceedings of the IEEE Conference on Computer Vision and Pattern Recognition, Salt Lake City, UT, USA, 18–22.
- [Hart 2017] Hart, M. 2017. Being naked on the internet: young people’s selfies as intimate edgework. Journal of Youth Studies 20(3):301–315.
- [He et al. 2016] He, K.; Zhang, X.; Ren, S.; and Sun, J. 2016. Deep residual learning for image recognition. 2016 IEEE Conference on Computer Vision and Pattern Recognition (CVPR).
- [Hochman and Schwartz 2012] Hochman, N., and Schwartz, R. 2012. Visualizing instagram: Tracing cultural visual rhythms. In Sixth International AAAI Conference on Weblogs and Social Media.
- [Hogan 2010] Hogan, B. 2010. The presentation of self in the age of social media: Distinguishing performances and exhibitions online. Bulletin of Science, Technology & Society 30(6):377–386.
- [Horrey and Wickens 2006] Horrey, W. J., and Wickens, C. D. 2006. Examining the impact of cell phone conversations on driving using meta-analytic techniques. Human factors 48(1):196–205.
- [Juhász and Hochmair 2018] Juhász, L., and Hochmair, H. H. 2018. Analyzing the spatial and temporal dynamics of snapchat. VGI-ALIVE pre-conference workshop – AGILE.
- [Kann et al. 2016] Kann, L.; McManus, T.; Harris, W. A.; Shanklin, S. L.; Flint, K. H.; Hawkins, J.; Queen, B.; Lowry, R.; Olsen, E. O.; Chyen, D.; Whittle, L.; Thornton, J.; Lin, C.; Yamakawa, Y.; Berner, N.; and Zaza, S. 2016. Youth risk behavior surveillance—united states, 2015. MMWR Surveillance Summaries 65(6):1–180.
- [Karpathy et al. 2014] Karpathy, A.; Toderici, G.; Shetty, S.; Leung, T.; Sukthankar, R.; and Fei-Fei, L. 2014. Large-scale video classification with convolutional neural networks. In Proceedings of the IEEE conference on Computer Vision and Pattern Recognition, 1725–1732.
- [Kay et al. 2017] Kay, W.; Carreira, J.; Simonyan, K.; Zhang, B.; Hillier, C.; Vijayanarasimhan, S.; Viola, F.; Green, T.; Back, T.; Natsev, P.; et al. 2017. The kinetics human action video dataset. arXiv preprint arXiv:1705.06950.
- [Kim, Sohn, and Choi 2011] Kim, Y.; Sohn, D.; and Choi, S. M. 2011. Cultural difference in motivations for using social network sites: A comparative study of american and korean college students. Computers in human behavior 27(1):365–372.
- [Lamba et al. 2017] Lamba, H.; Bharadhwaj, V.; Vachher, M.; Agarwal, D.; Arora, M.; Sachdeva, N.; and Kumaraguru, P. 2017. From camera to deathbed: Understanding dangerous selfies on social media. In ICWSM, 576–579.
- [Leary, Tchividijian, and Kraxberger 1994] Leary, M. R.; Tchividijian, L. R.; and Kraxberger, B. E. 1994. Self-presentation can be hazardous to your health: Impression management and health risk. Health Psychology 13(6):461.
- [Lipovac et al. 2017] Lipovac, K.; Derić, M.; Tešić, M.; Andrić, Z.; and Marić, B. 2017. Mobile phone use while driving-literary review. Transportation research part F: traffic psychology and behaviour 47:132–142.
- [Lyng 1990] Lyng, S. 1990. Edgework: A social psychological analysis of voluntary risk taking. American Journal of Sociology 95(4):851–886.
- [Maaten and Hinton 2008] Maaten, L. v. d., and Hinton, G. 2008. Visualizing data using t-sne. Journal of machine learning research 9(Nov):2579–2605.
- [Murphy 2018] Murphy, R. 2018. The rationality of literal tide pod consumption. SSRN.
- [Nanda et al. 2018] Nanda, V.; Lamba, H.; Agarwal, D.; Arora, M.; Sachdeva, N.; and Kumaraguru, P. 2018. Stop the killfies! using deep learning models to identify dangerous selfies. In Companion of the The Web Conference 2018 on The Web Conference 2018, 1341–1345. International World Wide Web Conferences Steering Committee.
- [NCSA 2017] NCSA. 2017. Distracted driving 2015: traffic safety facts research note (rep. no. dot hs 812 381).
- [NHTSA 2017] NHTSA. 2017. Policy statement and compiled faqs on distracted driving.
- [Nielsen 2017] Nielsen. 2017. 2016 nielsen social media report https://www.nielsen.com/content/dam/corporate/us/en/reports-downloads/2017-reports/2016-nielsen-social-media-report.pdf.
- [Olteanu et al. 2019] Olteanu, A.; Castillo, C.; Diaz, F.; and Kiciman, E. 2019. Social data: Biases, methodological pitfalls, and ethical boundaries. Frontiers in Big Data 2:13.
- [Rousseeuw 1987] Rousseeuw, P. J. 1987. Silhouettes: a graphical aid to the interpretation and validation of cluster analysis. Journal of computational and applied mathematics 20:53–65.
- [Roussel and Bell 2016] Roussel, L. O., and Bell, D. E. 2016. Tweens feel the burn:“salt and ice challenge” burns. International journal of adolescent medicine and health 28(2):217–219.
- [Russakovsky et al. 2015] Russakovsky, O.; Deng, J.; Su, H.; Krause, J.; Satheesh, S.; Ma, S.; Huang, Z.; Karpathy, A.; Khosla, A.; Bernstein, M.; and et al. 2015. Imagenet large scale visual recognition challenge. International Journal of Computer Vision 115(3):211–252.
- [Snapchat 2018] Snapchat. 2018. Snapchat for business (https://forbusiness.snapchat.com).
- [Thorndike 1953] Thorndike, R. L. 1953. Who belongs in the family? Psychometrika 18(4):267–276.
- [Tifentale and Manovich 2015] Tifentale, A., and Manovich, L. 2015. Selfiecity: Exploring photography and self-fashioning in social media. In Postdigital aesthetics. Springer. 109–122.
- [Vegega et al. 2013] Vegega, M.; Jones, B.; Monk, C.; et al. 2013. Understanding the effects of distracted driving and developing strategies to reduce resulting deaths and injuries: a report to congress. Technical report, United States. Office of Impaired Driving and Occupant Protection.
- [Xie et al. 2017] Xie, S.; Girshick, R.; Dollar, P.; Tu, Z.; and He, K. 2017. Aggregated residual transformations for deep neural networks. 2017 IEEE Conference on Computer Vision and Pattern Recognition (CVPR).
- [Zagoruyko and Komodakis 2016] Zagoruyko, S., and Komodakis, N. 2016. Wide residual networks.
- [Zeiler and Fergus 2014] Zeiler, M. D., and Fergus, R. 2014. Visualizing and understanding convolutional networks. In European conference on computer vision, 818–833. Springer.