The Impact of Merging on The Origin of Kinematically Misaligned and Counter-rotating Galaxies in MaNGA
Abstract
Galaxy mergers and interactions are expected to play a significant role leading to offsets between gas and stellar motions in galaxies. Herein we crossmatch galaxies in MaNGA MPL-8 with the Dark Energy Spectroscopic Instrument (DESI) Legacy Surveys and identify 311 merging galaxies that have reliable measurements of the PA, the difference between the stellar and gas kinematic position angles to investigate the impacts of merging on gas-stellar rotation misalignments. We find that the merging fractions of misaligned galaxies (30∘ PA 150∘) are higher than that of co-rotators (PA 30∘) in both quiescent and star-forming galaxies. This result suggests that merging is one process to produce kinematic misalignments. The merging fraction of counter-rotators (PA 150∘) is lower than that of misaligned galaxies in both quiescent and star-forming galaxies, while in the latter it is likely even lower than that of co-rotators. The orbital angular momentum transfer to the spins of stars and gas during merging and the tidal feature disappearance can lead to small merging fractions in counter-rotators. Numerous new stars that inherit angular momentum from gas after merging can further lower the merging fraction of star-forming counter-rotators.
keywords:
galaxies: interactions - galaxies: kinematics and dynamics.1 Introduction
The merging processes have profound influences on galaxy formation and evolution, such as enhancing star formation (SF) (Bournaud et al., 2011; Bloom et al., 2017; Pan et al., 2019), triggering active galactic nuclei (AGN) activity (Hopkins et al., 2008; Fu et al., 2018), transforming galaxy morphologies (Shi et al., 2009; Xu et al., 2012; Conselice, 2014), and causing chaos in the internal velocity fields of stars and gas.
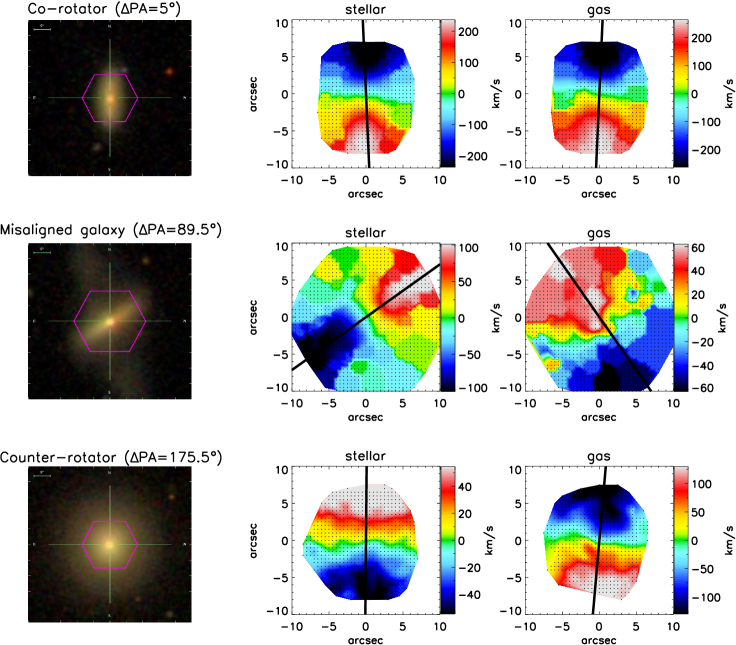
Recently, benefiting from the developments of spatially-resolved integral field spectroscopy (IFS), it is possible to measure the position angles (PAs) of the stellar and ionized gas velocity fields directly, which are inferred from the doppler shifts of the absorption lines (for stars) and the emission lines (for gas), respectively. Some galaxies exhibit offsets in the PAs (PA) between the stellar and gas rotation. Galaxies with 30∘ PA 150∘ are called the misaligned galaxies and those with PA 150∘ are counter-rotators (Davis et al., 2011; Chen et al., 2016; Bryant et al., 2019).
Davis et al. (2011) investigated ionized, molecular and atomic gas in 260 early type galaxies (ETGs) in ATLAS3D (Cappellari et al., 2011), finding a large proportion of misaligned galaxies and underlining the importance of the externally acquired gas on the gas replenishment in the ETGs. On the other hand, no striking differences in the kinematic PAs between gas and stars are found in non-interacting CALIFA galaxies (Sánchez et al., 2012), which are mainly late type galaxies (LTGs) (Barrera-Ballesteros et al., 2014). Jin et al. (2016) and Chen et al. (2016) found younger stellar populations, enhanced star formation rates and higher metallicity in central regions of misaligned galaxies in MaNGA (Bundy et al., 2015) than their outer parts, which could be caused by misaligned gas accretion and its subsequent collision with in-situ gas. Bryant et al. (2019) (hereafter B19) made use of galaxies in SAMI (Bryant et al., 2015) covering a broad range in morphological types, stellar masses and environments, and proposed that not only gas accretion, but also the gas precession plays an important role in the apparent distributions of PA. In addition, gas stripping and gas disc destruction induced by AGN feedback, merging and flyby events through groups or clusters make it easier to produce gas-stellar misalignment during subsequent gas re-accretion (van de Voort et al., 2015; Starkenburg et al., 2019; Duckworth et al., 2020b). Meanwhile lower stellar angular momentum inherited from halo spin exerts weaker torques on gas motion, leading to a longer time for misaligned gas precessing to align with stellar motion. As a result, galaxies with lower angular momentum are more likely to exhibit such misalignment (Duckworth et al., 2020a). All of these studies share a common sense that external processes, such as gas accretion and merging, play important roles in the formation of misaligned galaxies and counter-rotators.
It is expected that the misaligned and counter-rotating gas origins from external processes such as merging as seen in simulations (van de Voort et al., 2015). The observational evidence for this has emerged from Barrera-Ballesteros et al. (2015). Based on 66 interacting galaxies that have well defined PA (out of 103 total interacting galaxies), they found interacting galaxies have larger kinematic misalignments than non-interacting galaxies. With a sample of five times larger than theirs, we will further investigate the effect of merging in producing misaligned galaxies and counter-rotators, and especially we will discuss the effect in different groups of galaxy types including star-forming and quiescent galaxies.
Mapping Nearby Galaxies at Apache Point Observatory (MaNGA) (Bundy et al., 2015) will finish observations of 10000 nearby galaxies designed to have a flat stellar mass distribution from to with IFS data until 2020 (Wake et al., 2017). The latest internal data release MPL-8 contains 6505 unique galaxies. Meanwhile, there are plenty of methods to identify mergers, such as tidal features (Martínez-Delgado et al., 2010; Wen et al., 2014; Hood et al., 2018; Morales et al., 2018), morphological asymmetries (Reichard et al., 2008; Shi et al., 2009; Lotz et al., 2010; Conselice, 2014) or the galaxy pairs (Ellison et al., 2008; Li et al., 2008; Torrey et al., 2012). All of them can be extracted from the optical images. By combining MaNGA with imaging surveys, and looking for merger vestiges, we are able to directly examine the importance of the role that merger plays in kinematically misaligned galaxies.
The paper is organized as follows. In Section 2, we briefly introduce the MaNGA project, Legacy Surveys, sample selection and methodology. The observational results are shown in Section 3. We discuss the possible explanation for the PA distribution of our sample in Section 4. A summary and conclusion are listed in section 5.
2 Data and Methodology
2.1 MaNGA
MaNGA, which started in 2014 July using the 2.5 meters telescope at Apache Point Observatory (APO) (Gunn et al., 2006), is one of three major programs in Sloan Digital Sky Survey IV (SDSS-IV, (Blanton et al., 2017)). This program aims to acquire integral field unit (IFU) spectra for 10000 nearby galaxies with redshift ranging from 0.01 to 0.15 (Wake et al., 2017). Each target is observed to ensure the depth to reach 23 mag (Law et al., 2015). The coverage of each galaxy is expected to be 1.5 effective radii () for primary sample and 2.5 for secondary sample with typical angular resolution 2.5 arcsec, corresponding to 12 kpc in such redshift range (Yan et al., 2016b). Thus the bundles are designed to contain 19 to 127 fibers to satisfy these coverages of galaxies with different angular size (Drory et al., 2015), with the mini-bundles with 7 fibers for flux calibration (Yan et al., 2016a). The dual-channel BOSS spectrographs cover a wavelength range of 360010300 Å with spectral resolution R2000 (Smee et al., 2013). The raw data is reduced through data reduction pipeline (DRP) (Law et al., 2016) and analyzed through Data Analysis Pipeline (DAP) (Westfall et al., 2019; Belfiore et al., 2019). In the latest internal data release MPL-8, there are 6505 unique galaxies with 3D data cubes and 2D data maps, which is the largest IFU survey sample to date.
2.2 Legacy surveys
The Dark Energy Spectroscopic Instrument (DESI) Legacy Imaging Surveys (hereafter Legacy Surveys) (Dey et al., 2019) aim to provide targets for the DESI survey. The Legacy Surveys are a combination of three public projects covering about 14000 of the sky visible from the northern hemisphere: the Beijing-Arizona Sky Survey (BASS) (Zou et al., 2017) observed by the 90Prime camera (Williams et al., 2004) on the Bok 2.3-meter telescope on Kitt Peak; the Mayall -band Legacy Survey (MzLS) (Silva et al., 2016) observed by the Mosaic3 camera (Dey et al., 2016) on the 4-meter Mayall telescope at Kitt Peak and the Dark Energy Camera Legacy Survey (DECaLS) (Blum et al., 2016) by the Dark Energy Camera (Flaugher et al., 2015) on the 4-meter Blanco telescope at the Cerro Tololo Inter-American Observatory. BASS covers about 5400 in the north Galactic cap (dec32∘) providing - and -band images and MzLS complements the same region as BASS with -band observations. In tandem, DECaLS surveys an equatorial area (dec32∘) of about 9000 with -, - and -band images. The surface brightness (SB) limits of BASS are =27.10 and =26.76 mag arcsec-2 (5 in 1010 arcsec boxes). The SB limits of DECaLS are =27.77 and =27.44 mag arcsec-2. They are about 1 mag deeper than those of SDSS. These deeper images will facilitate us to search for debris features of merging and strongly interacting galaxies.
2.3 Methods
Sample selection: We crossmatch the galaxies in MaNGA MPL-8 with legacy surveys111http://legacysurvey.org DR7 (DECaLS) and DR6 (BASS DR2222http://batc.bao.ac.cn/BASS/doku.php?id=home (Zou et al., 2018)). Since the BASS data are independently processed by the BASS team and the image quality is better than sections provided from the Legacy Surveys data release, we use BASS images rather than DECaLS ones for those available in both surveys. Bad images including those with bad pixels across the galaxy, those with distortion during mosaic and those at the edge of an image segment, are eliminated from the sample. Finally we get 6217 galaxies (hereafter crossmatched MaNGA sample) with 3729 from BASS and 2488 from DECaLS. All of them have both - and -band images. For each galaxy we convolve one band that has smaller seeing with a Gaussian function to match the PSF in the other band and stack them to enhance S/N. Then we visually check all those stacked images in DS9 to visually identify faint features.
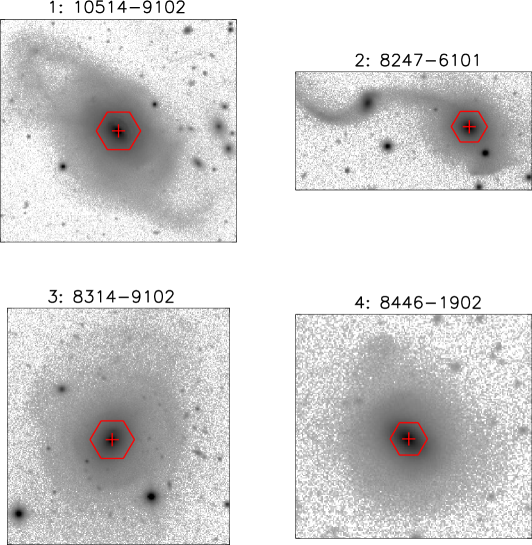
We finally find 538 merging/interacting galaxies and roughly divide them into four groups, as illustrated in Fig. 1. The first group contains isolated galaxies with tidal streams (219, top left). The second group is composed of distorted galaxies that have companions (184, top right). This type of galaxies belongs to galaxy pairs but pairs without strong interacting features, i.e. bridges, are not included in this group. The third group consists of galaxies with shells (36, bottom left). Shells are very faint structures, so we only identify 36 galaxies with shells. Here we include two types of shells as discussed in Ebrova (2013). Type I is cone like and interleaved in radius. Type II is randomly distributed arcs. The unique feature of shells is ripple like, so that galaxies with extended symmetric smooth halos are not in our sample. The fourth group contains galaxies with extended asymmetric halos (99, bottom right). Thus except for the second group, all the merging galaxies are remnants and most of them may have experienced major mergers. By adopting the above four groups of merging/interacting features, we can better train our eyes to have fair classifications. We will not discuss the difference among different groups in this work, and use all of them as a whole.
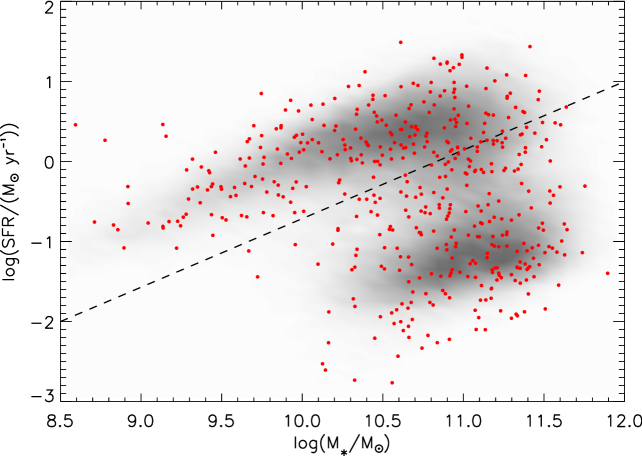
Stellar mass and star formation rate: The total stellar mass and SFR of the crossmatched MaNGA sample are obtained from two catalogs - GALEX-SDSS-WISE Legacy Catalog (GSWLC) from Salim et al. (2016) and MPA-JHU DR7 catalog333https://wwwmpa.mpa-garching.mpg.de/SDSS/DR7/. GSWLC derived physical properties from the UV/optical SED fitting, which is robust but only contains 5109 out of 6217 galaxies. In addition, we crossmatch the rest of them with MPA-JHU DR7 to add 840 more objects. The stellar mass and SFRs for star forming galaxies in this catalog are calculated following Kauffmann et al. (2003) and Brinchmann et al. (2004), respectively. For non-SF galaxies, the SFRs are estimated from D4000. The two catalogs agree with each other quite well in stellar mass and SFRs for SF galaxies, but the MPA catalog tends to overestimate the SFRs slightly for non-SF galaxies. Finally, there are 268 crossmatched MaNGA sample without stellar mass and SFR measurements. We don’t use them for the following investigations. Fig. 2 shows the SFR-M∗ diagram of our merging/interacting sample in MaNGA.
PAs of stellar and gas rotations: The velocity maps of both stellar and ionized gas are extracted from the output of data analysis pipeline (DAP) in MaNGA (Westfall et al., 2019; Belfiore et al., 2019). We are using VOR10 velocity maps from DAP throughout this paper. The pipeline first bins adjacent spaxels and stacks the spectra in those spaxels using Voronoi binning procedure (Cappellari, & Copin, 2003) to ensure the pseudo--band S/N bigger than 10. Then the continuum of each bin is fitted using penalized pixel-fitting routing (pPXF) (Cappellari, & Emsellem, 2004; Cappellari, 2017) and hierarchically clustered MILES templates (MILES-HC) (MILES stellar library: Sánchez-Blázquez et al., 2006) to determine the stellar kinematics. After performing stellar-continuum fit, the pipeline fixes the stellar kinematics and fits the emission lines by adopting Gaussian emission-line models and continuum simultaneously, providing best fit continuum models and fluxes and equivalent widths of emission lines, as well as velocities and velocity dispersions.
The PAs of stellar and gas rotations are measured using FIT_KINEMATIC_PA code444https://www-astro.physics.ox.ac.uk/ mxc/software/, which is based on algorithms proposed in Appendix C of Krajnović et al. (2006). To obtain robust PAs of both stellar and gas, we apply following criteria: (1) only spaxels with mask=0 in DAP output are used, which means there are no significant issues of the data quality and the fit is reasonable; (2) for stellar rotation, we eliminate spaxels with velocity uncertainties 30 km/s. As for gas, we only include spaxels after binning with fluxes S/N of either or greater than 5; (3) the number of spaxels satisfying the above second criterion needs to be greater than 1/3 of spaxels with mask=0. We then visually check each velocity map with successful PA fitting to ensure that the measurements are reasonable.
The advantage of FIT_KINEMATIC_PA code is that it is not sensitive to the local distortion of the velocity fields. To ensure that our PA measurements are robust, we visually check every velocity map. We find that two cases could make the fitted PA deviate from the real rotation direction. The first case is the spuriously local high velocities that might be attributed to background targets. This high-velocity spaxels contribute to the significantly and thus tend to make the fitted PA along their direction. We mask corresponding region and refit the velocity maps. The second case is that the procedure could not fit edge-on galaxies well as also found in Duckworth et al. (2020a). Therefore, we eliminate those edge-on galaxies with obvious deviations of PA measurements from the real PA of either stellar or gas velocities.
At the end 3681 galaxies out of 6217 have both reliable stellar and gas PAs, while most of the rest either don’t have enough gas to produce measurable emission lines or don’t have coherent gas or stellar velocity fields and thus don’t have an overall PA. Among merging/interacting galaxies, 311 out of 538 have PA measurements available. The PAs are in the range from 0∘ to 360∘, so we force the PA offsets between gas and stellar from 0∘ to 180∘.
3 Results
Following the classification in Chen et al. (2016), galaxies with PA 30∘ are co-rotators or aligned galaxies; those with PA 150∘ are counter-rotators and the rest (30∘ PA 150∘) are misaligned galaxies (Here the definition is a little bit different with Chen et al. (2016), where counter-rotators are also misaligned galaxies). Fig. 3 shows examples of the velocity maps and measured PA of one co-rotator (top row), one misaligned galaxy (middle row), and one counter-rotator (bottom row). We further divide our sample into star-forming and quiescent galaxies according to the dashed line in Fig. 2. Table 1 lists the statistics on the numbers of galaxies in each PA group.
| Groups | Co-rotators | Misaligned galaxies | Counter-rotators | |
|---|---|---|---|---|
| (0∘-30∘) | (30∘-150∘) | (150∘-180∘) | ||
| Star-forming | 179 | 13 | 2 | |
| Merging/interacting | Quiescent | 80 | 29 | 8 |
| Total | 259 | 42 | 10 | |
| Star-forming | 2420 | 101 | 39 | |
| The whole | Quiescent | 915 | 136 | 70 |
| Total | 3335 | 237 | 109 | |
3.1 The PA distributions
Fig. 4 shows the PA distributions of star-forming galaxies (blue bars) and quiescent galaxies (red bars). In both groups, while co-rotators are dominant, 18% of quiescent galaxies have PA 30∘, but only 5% of star-forming galaxies do. B19 find that only 5% of star-forming galaxies that are morphologically identified have PA greater than 30∘ in SAMI sample and Duckworth et al. (2020a) identify misaligned galaxies and counter-rotators to be 5.4% of morphologically-identified star-forming galaxies in MaNGA. These works all find that gas-rich galaxies are hard to produce stars and gas kinematic misalignment and are in line with our results. We thus draw a same conclusion with these works but with six times larger sample size than B19. According to B19, in star-forming galaxies, the interaction between existing co-rotating gas and incoming gas rapidly disrupts the latter and produces a co-rotator even if the incoming gas is misaligned with stellar rotation. Moreover, simulations of halo accretion (Danovich et al., 2015) show that the accreted gas in star-forming galaxies is tilted rapidly toward to stellar rotation outside 0.1 virial radii, such that the external gas in the region covered by MaNGA is more likely to already align with stellar rotation. Both co-rotating settling and preferentially aligned accretion result in very few misaligned galaxies and counter-rotators in star-forming galaxies.
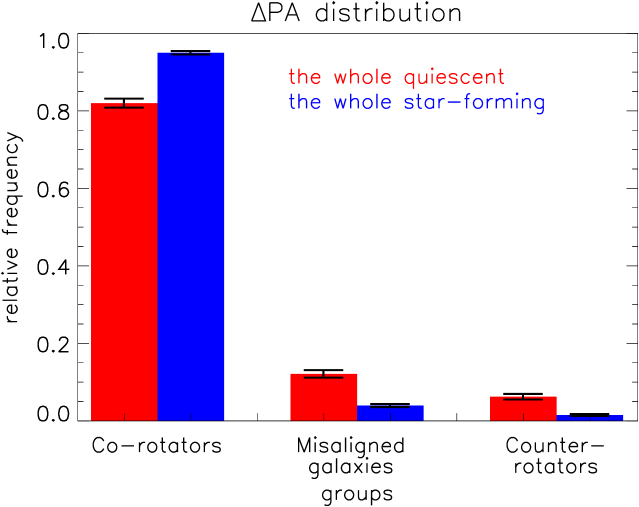
The relative number ratio of misaligned galaxies to counter-rotating galaxies is 2:1 and 2.5:1 in quiescent and star-forming galaxies, respectively. This is smaller than the simple expectation from the PA coverage of these two groups, which should be 120∘:30∘=4:1. This means that we find more counter-rotators than predicted. B19 also find this counter-rotator excess and they use gas precession scenario to explain it. Due to gravitational dynamical settling, misaligned gas will precess to be stabilized in either counter-rotating, if the initial PA is bigger than 90∘, or co-rotating, if the initial PA is smaller than 90∘, with stellar motion (Stevens et al., 2016; Davis, & Bureau, 2016). The precessing timescale depends on both ellipticity of the existing stellar disc and the gas inclination to the galaxy. For example, it will take over Hubble time for one near polar gas disc in round ellipticals (e.g.: type E3 with b/a=0.7) precessing and aligning with stellar motion (Schweizer et al., 1983). Gas precession alters some misaligned galaxies to counter-rotators, thus resulting in more counter-rotators.
3.2 The merging fractions
Fig. 5 shows the merging fractions of the whole sample (green bars), the quiescent galaxies (red bars), and the star-forming galaxies (blue bars). It is evident that misaligned galaxies have a higher merging fraction than co-rotators. This excess is seen in both quiescent (the difference between misaligned galaxies and co-rotators is 12%3.6%) and star-forming galaxies (the difference is 6%3.3%), and of course the whole sample (the difference is 10%2.5%). We have also run FIT_KINEMATIC_PA on unbinned stellar and gas velocity maps. Then we use different stellar and gas map combinations to calculate the PA and this excess still exists as the merging fractions of co-rotators and misaligned galaxies are 7.7%0.5% and 18.2%2.6% for unbinned stellar and binned gas maps, 7.7%0.5% and 19.6%2.9% for binned stellar and unbinned gas maps, and 7.8%0.5% and 19.1%3.0% for unbinned stellar and unbinned gas maps. Barrera-Ballesteros et al. (2015) also find that interacting galaxies have higher mean PA compared with non-interacting galaxies. Our results show that this elevated merging fractions of misaligned galaxies are independent of the SFRs. This supports that merging is responsible for the origin of misaligned galaxies in both star-forming galaxies and quiescent galaxies. MaNGA FoV only covers to 1.5 Re or 2.5 Re of each galaxy. According to B19, the precession timescale depends on the radial distance to the galactic center, with gas in the lower radius precessing faster and aligning with stellar rotation. Therefore, for warped disc galaxies (Debattista & Sellwood, 1999; Radburn-Smith et al., 2014; Sparke et al., 2009; van de Voort et al., 2015), if an IFU with FoV larger than MaNGA is adopted, some co-rotators will be classified as misaligned galaxies, enhancing the merging fraction of misaligned galaxies. Our results remain unchanged.
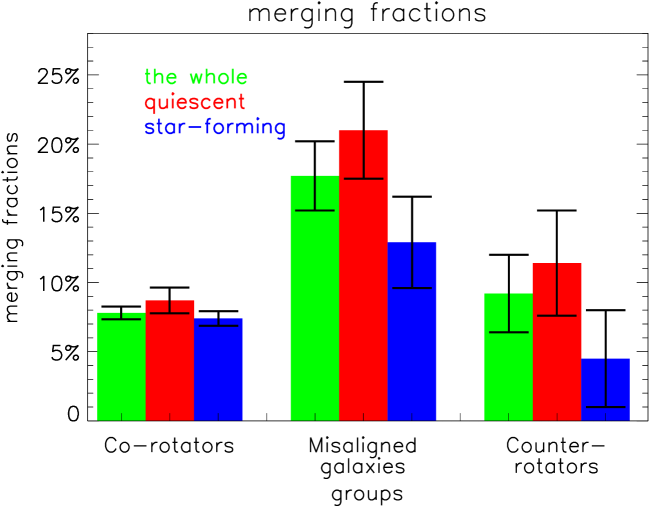
The merging fraction of counter-rotators is smaller than that of misaligned galaxies too, with the difference of 9%3.8% in the whole sample and 10%5.2% and 9%4.8% in quiescent and star-forming galaxies, respectively. In star-forming galaxies, the merging fraction of counter-rotators is even smaller than that of co-rotators in spite of statistical insignificance. This indicates that merging is hard to produce star-forming counter-rotators.
3.3 The mass effects
Next, we investigate whether misaligned galaxies have a dependency on stellar mass and whether this dependency would change our main result that misaligned galaxies generally have higher merging fractions than co-rotators.
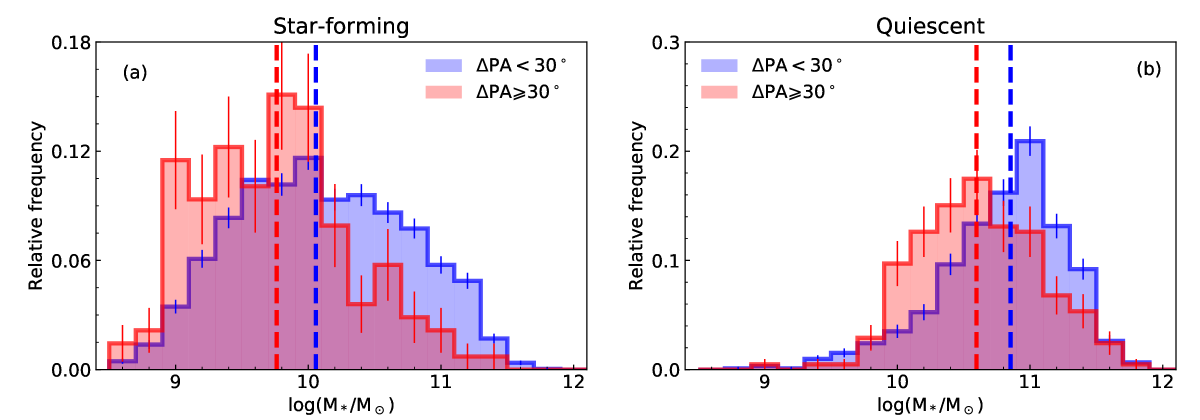
Fig. 6 shows the stellar mass distributions of those with PA 30∘ and those with PA 30∘ in the whole MaNGA sample. We find galaxies with PA 30∘ tend to have smaller stellar mass than those with PA 30∘ in both star-forming and quiescent sample, with the KS test p-value=8.62 for star-forming galaxies and 4.02 for quiescent galaxies. Duckworth et al. (2020a) find the same trend in star-forming galaxies but an inverted trend in quiescent galaxies. The reason of this difference is that we use a different criterion. Their quiescent galaxies are chosen by morphologies. We find that their stellar mass distribution of ETGs is bimodal, with the low mass peak around 10. This peak can not be found in Fig. 6(b). We crossmatch their sample with ours and reveal that 90% of their ETGs with stellar mass lower than 10 are actually star-forming galaxies in our sample. The stellar mass of co-rotators around this peak is smaller than that of misaligned galaxies, which leads to the overall higher stellar mass of misaligned galaxies. If we only inspect the distribution with ETGs stellar mass higher than 10 (Fig. 11 in Duckworth et al. (2020a)), misaligned galaxies are truly less massive than co-rotators, in line with our results.
We then draw from the co-rotators to create a subsample with a consistent mass distribution as those with PA 30∘. We find that the merging/interacting fractions are 5.8% for star-forming co-rotators and 7.2% for quiescent co-rotators, showing more difference against other two groups. Hence we confirm that the kinematic misalignment enhancement in the merging/interacting sample is really attributed to mergers but not stellar mass.
4 Discussion
In this work, our main finding is that misaligned galaxies have higher merging/interacting fraction than co-rotators. This phenomenon exists in both quiescent galaxies and star-forming galaxies and provides us with a direct observational evidence that merging is one way to produce kinematically misaligned galaxies. We do caution that our heavy Voronoi binning and symmetrisation of the velocity fields with kinematic perturbations can potentially cause large errors in the estimations of PA at least for some cases, although we have done visually check.
As shown in Fig. 5, and listed in Table 1, the merging/interacting fraction of the whole sample is about 8%, whereas the merging/interacting fraction of misaligned galaxies is about 18%. This fraction will be changed if the depth of images is deeper or the methods to identify merging are different. In previous works, different merging tracers reveal that merging fraction in local universe is no more than 20% (Le Fèvre et al., 2000; Cassata et al., 2005; Lotz et al., 2008; Shi et al., 2009). If we adopt this upper limit and keep the ratio of merging fractions between misaligned galaxies and the whole sample, then the maximum merging fraction in misaligned galaxies is about 45%, whereas other misaligned gas can originate from gas accretion from cosmic web or surrounding gas-rich satellites, which can not be identified by photometry in optical bands.
In the next, we will discuss the results of quiescent galaxies and star-forming galaxies separately.
4.1 Quiescent galaxies
As shown in Table 1, the ratio of misaligned galaxies to counter-rotators in quiescent merging/interacting sample is about 4:1, greater than that ratio in the whole quiescent sample (2:1 as discussed above). We think this is because during merging galaxy pairs transfer their orbital angular momentum into spin of remnant halo, and also of stars and gas (Di Matteo et al., 2009; Codis et al., 2012; Stewart, 2017; Lagos et al., 2018). In semi-analytic model, the spin direction of merger remnant is set as the orbital axis direction of merging galaxies in the last resolved moment (Stevens et al., 2016). Orbital angular momentum transfer during the merger reduces the overall PA so that some progenitors with gas and star initially counter-rotating end up as misaligned remnants. This effect also reduces the merging fraction in counter-rotators as seen in Fig. 5. In addition, counter-rotating is a stable phase (Bryant et al., 2019; Stevens et al., 2016). Tidal features in merging/interacting counter-rotators will disappear or immerse into noise in this stable configuration and fail to be identified from optical images. It is likely that both the orbital angular momentum transfer during the merger and the tidal feature disappearance lead to a smaller merging fraction of counter-rotators than misaligned galaxies.
4.2 Star-forming galaxies
Fig. 5 shows a hint that the merging fraction of star-forming counter-rotators is low, even smaller than that of star-forming co-rotators. This suggests that merging plays a minor role in producing star-forming counter-rotators. B19 also indicated that star-forming counter-rotators are unlikely a production of merging based on the marginal dependency on local environment density. Algorry et al. (2014) alternately proposed that a specific ’V-shaped’ gas accretion from cosmic filaments could produce star-forming counter-rotators, with no merging process.
The minor effects of merging on producing star-forming counter-rotators could be also attributed to the disappearance of tidal features and the orbital angular momentum transfer as explained for quiescent counter-rotators. Table 1 shows that the ratio between star-forming misaligned galaxies and star-forming counter-rotators in merging/interacting sample is 7:1, greater than that ratio in quiescent merging sample (4:1). This requires more efficient angular momentum transfer. In addition, Lagos et al. (2018) use EAGLE simulation and find out that wet mergers spin up galaxies. The increased stellar angular momentum originates from new formed stars out of gas disc formed after merging. These new born stars inherit angular momentum of the gas, and thus form a co-rotator. Stellar angular momentum inheritance also make it hard to form a star-forming counter-rotator after merging.
5 Summary
In 6217 MaNGA galaxies crossmatched with Legacy Surveys, we find 538 galaxies with merging features or strong interaction with companions. They can be roughly separated into four groups - isolated galaxies with tidal streams (219); distorted galaxies with companions (184); galaxies with shells (36) and galaxies with extended asymmetric halo (99). Among these galaxies, 3681 out of 6127 galaxies have both reasonable stellar and gas PA measurements, and 311 out of 538 merging/interacting sample does. Then we separate the whole sample into quiescent galaxies and star-forming galaxies.
We firstly investigate the gas-stellar rotation misalignments distribution in quiescent galaxies and star-forming galaxies. We find that 18% quiescent galaxies have PA and only 5% star-forming galaxies do, which shows that star-forming galaxies are hard to produce kinematic misalignments. Our results are consistent with former works and we corroborate them with a sample size six times larger than former works.
Next, we investigate the merging fraction in three PA groups and find that the merging fractions of misaligned galaxies are higher than that of co-rotators in both quiescent and star-forming galaxies. This result shows a direct evidence that merging is one process to produce stellar-gas misalignments. In addition, the merging fraction of counter-rotators is smaller than misaligned galaxies. Both the orbital angular momentum transfer during the merger and the tidal feature disappearance can lead to this smaller merging fraction. For star-forming galaxies, we find a hint that the merging fraction of counter-rotators could be even smaller than that of co-rotators. Apart from two possible explanation mentioned above, we think new stars inheriting angular momentum from gas also make it hard to form a star-forming counter-rotator after merging.
6 Acknowledgements
We thank the referee for a detailed report that helped significantly in improving the presentation of our work. S.L. and Y.S. acknowledge the support from the National Key R&D Program of China (No. 2018YFA0404502, No. 2017YFA0402704, ), the National Natural Science Foundation of China (NSFC grants 11825302, 11733002 and 11773013). D.B. is supported by grant RScF 19-12-00145. C.D. acknowledges support from the Science and Technology Funding Council (grant number ST/N504427/1). The Flatiron Institute is supported by the Simons Foundation. Y.C. acknowledges support from the National Key R&D Program of China (No. 2017YFA0402700), the National Natural Science Foundation of China (NSFC grants 11573013, 11733002, 11922302). R.A.R thanks partial financial support from Conselho Nacional de Desenvolvimento Científico e Tecnológico (202582/2018-3 and 302280/2019-7) and Fundação de Amparo à pesquisa do Estado do Rio Grande do Sul (17/2551-0001144-9 and 16/2551-0000251-7). Funding for the Sloan Digital Sky Survey IV has been provided by the Alfred P. Sloan Foundation, the U.S. Department of Energy Office of Science, and the Participating Institutions. SDSS- IV acknowledges support and resources from the Center for High-Performance Computing at the University of Utah. The SDSS web site is www.sdss.org. SDSS-IV is managed by the Astrophysical Research Consortium for the Participating Institutions of the SDSS Collaboration including the Brazilian Participation Group, the Carnegie Institution for Science, Carnegie Mellon University, the Chilean Participation Group, the French Participation Group, Harvard-Smithsonian Center for Astrophysics, Instituto de Astrofísica de Canarias, The Johns Hopkins University, Kavli Institute for the Physics and Mathematics of the Universe (IPMU) / University of Tokyo, Lawrence Berkeley National Laboratory, Leibniz Institut für Astrophysik Potsdam (AIP), Max-Planck-Institut für Astronomie (MPIA Heidelberg), Max-Planck-Institut für Astrophysik (MPA Garching), Max-Planck-Institut für Extraterrestrische Physik (MPE), National Astronomical Observatory of China, New Mexico State University, New York University, University of Notre Dame, Observatório Nacional / MCTI, The Ohio State University, Pennsylvania State University, Shanghai Astronomical Observatory, United Kingdom Participation Group, Universidad Nacional Autónoma de México, University of Arizona, University of Colorado Boulder, University of Oxford, University of Portsmouth, University of Utah, University of Virginia, University of Washington, University of Wisconsin, Vanderbilt University, and Yale University.
7 Data availability
The data underlying this article will be shared on reasonable request to the corresponding author.
References
- Abadi et al. (1999) Abadi, M. G., Moore, B., & Bower, R. G. 1999, MNRAS, 308, 947
- Algorry et al. (2014) Algorry, D. G., Navarro, J. F., Abadi, M. G., et al. 2014, MNRAS, 437, 3596
- Barrera-Ballesteros et al. (2014) Barrera-Ballesteros, J. K., Falcón-Barroso, J., García-Lorenzo, B., et al. 2014, A&A, 568, A70
- Barrera-Ballesteros et al. (2015) Barrera-Ballesteros, J. K., García-Lorenzo, B., Falcón-Barroso, J., et al. 2015, A&A, 582, A21
- Belfiore et al. (2019) Belfiore, F., Westfall, K. B., Schaefer, A., et al. 2019, AJ, 158, 160
- Blanton et al. (2017) Blanton, M. R., Bershady, M. A., Abolfathi, B., et al. 2017, AJ, 154, 28
- Bloom et al. (2017) Bloom, J. V., Fogarty, L. M. R., Croom, S. M., et al. 2017, MNRAS, 465, 123
- Blum et al. (2016) Blum, R. D., Burleigh, K., Dey, A., et al. 2016, American Astronomical Society Meeting Abstracts #228 228, 317.01
- Bournaud et al. (2011) Bournaud, F., Chapon, D., Teyssier, R., et al. 2011, ApJ, 730, 4
- Brinchmann et al. (2004) Brinchmann, J., Charlot, S., White, S. D. M., et al. 2004, MNRAS, 351, 1151
- Brooks et al. (2009) Brooks, A. M., Governato, F., Quinn, T., et al. 2009, ApJ, 694, 396
- Bryant et al. (2015) Bryant, J. J., Owers, M. S., Robotham, A. S. G., et al. 2015, MNRAS, 447, 2857
- Bryant et al. (2019) Bryant, J. J., Croom, S. M., van de Sande, J., et al. 2019, MNRAS, 483, 458 (B19)
- Bundy et al. (2015) Bundy, K., Bershady, M. A., Law, D. R., et al. 2015, ApJ, 798, 7
- Cappellari, & Copin (2003) Cappellari, M., & Copin, Y. 2003, MNRAS, 342, 345
- Cappellari, & Emsellem (2004) Cappellari, M., & Emsellem, E. 2004, PASP, 116, 138
- Cappellari et al. (2011) Cappellari, M., Emsellem, E., Krajnović, D., et al. 2011, MNRAS, 413, 813
- Cappellari (2016) Cappellari, M. 2016, ARA&A, 54, 597
- Cappellari (2017) Cappellari, M. 2017, MNRAS, 466, 798
- Cassata et al. (2005) Cassata, P., Cimatti, A., Franceschini, A., et al. 2005, MNRAS, 357, 903
- Chen et al. (2016) Chen, Y.-M., Shi, Y., Tremonti, C. A., et al. 2016, Nature Communications, 7, 13269
- Chung et al. (2009) Chung, A., van Gorkom, J. H., Kenney, J. D. P., et al. 2009, AJ, 138, 1741
- Coccato et al. (2013) Coccato, L., Morelli, L., Pizzella, A., et al. 2013, A&A, 549, A3
- Codis et al. (2012) Codis, S., Pichon, C., Devriendt, J., et al. 2012, MNRAS, 427, 3320
- Conselice (2014) Conselice, C. J. 2014, ARA&A, 52, 291
- Crocker et al. (2009) Crocker, A. F., Jeong, H., Komugi, S., et al. 2009, MNRAS, 393, 1255
- Dalla Vecchia & Schaye (2012) Dalla Vecchia, C., & Schaye, J. 2012, MNRAS, 426, 140
- Danovich et al. (2015) Danovich, M., Dekel, A., Hahn, O., et al. 2015, MNRAS, 449, 2087
- Davis et al. (2011) Davis, T. A., Alatalo, K., Sarzi, M., et al. 2011, MNRAS, 417, 882
- Davis, & Bureau (2016) Davis, T. A., & Bureau, M. 2016, MNRAS, 457, 272
- Debattista & Sellwood (1999) Debattista, V. P., & Sellwood, J. A. 1999, ApJ, 513, L107
- Dey et al. (2016) Dey, A., Rabinowitz, D., Karcher, A., et al. 2016, Proc. SPIE, 99082C
- Dey et al. (2019) Dey, A., Schlegel, D. J., Lang, D., et al. 2019, AJ, 157, 168
- Di Matteo et al. (2009) Di Matteo, P., Jog, C. J., Lehnert, M. D., et al. 2009, A&A, 501, L9
- Drory et al. (2015) Drory, N., MacDonald, N., Bershady, M. A., et al. 2015, AJ, 149, 77
- Duckworth et al. (2020a) Duckworth, C., Tojeiro, R., & Kraljic, K. 2020, MNRAS, 492, 1869
- Duckworth et al. (2020b) Duckworth, C., Starkenburg, T. K., Genel, S., et al. 2020, MNRAS, 495, 4542
- Ebrova (2013) Ebrova, I. 2013, arXiv e-prints, arXiv:1312.1643
- Ellison et al. (2008) Ellison, S. L., Patton, D. R., Simard, L., et al. 2008, AJ, 135, 1877
- Flaugher et al. (2015) Flaugher, B., Diehl, H. T., Honscheid, K., et al. 2015, AJ, 150, 150
- Fu et al. (2018) Fu, H., Steffen, J. L., Gross, A. C., et al. 2018, The Astrophysical Journal, 856, 93
- Gunn et al. (2006) Gunn, J. E., Siegmund, W. A., Mannery, E. J., et al. 2006, AJ, 131, 2332
- Haan & Braun (2014) Haan, S., & Braun, R. 2014, MNRAS, 440, L21
- Hood et al. (2018) Hood, C. E., Kannappan, S. J., Stark, D. V., et al. 2018, ApJ, 857, 144
- Hopkins et al. (2006) Hopkins, P. F., Hernquist, L., Cox, T. J., et al. 2006, ApJS, 163, 1
- Hopkins et al. (2008) Hopkins, P. F., Hernquist, L., Cox, T. J., et al. 2008, ApJS, 175, 356
- Jin et al. (2016) Jin, Y., Chen, Y., Shi, Y., et al. 2016, MNRAS, 463, 913
- Johnston et al. (2013) Johnston, E. J., Merrifield, M. R., Aragón-Salamanca, A., et al. 2013, MNRAS, 428, 1296
- Kauffmann et al. (2003) Kauffmann, G., Heckman, T. M., White, S. D. M., et al. 2003, MNRAS, 341, 33
- Krajnović et al. (2006) Krajnović, D., Cappellari, M., de Zeeuw, P. T., et al. 2006, MNRAS, 366, 787
- Lagos et al. (2015) Lagos, C. del P., Padilla, N. D., Davis, T. A., et al. 2015, MNRAS, 448, 1271
- Lagos et al. (2018) Lagos, C. del P., Stevens, A. R. H., Bower, R. G., et al. 2018, MNRAS, 473, 4956
- Law et al. (2015) Law, D. R., Yan, R., Bershady, M. A., et al. 2015, AJ, 150, 19
- Law et al. (2016) Law, D. R., Cherinka, B., Yan, R., et al. 2016, AJ, 152, 83
- Le Fèvre et al. (2000) Le Fèvre, O., Abraham, R., Lilly, S. J., et al. 2000, MNRAS, 311, 565
- Li et al. (2008) Li, C., Kauffmann, G., Heckman, T. M., et al. 2008, MNRAS, 385, 1903
- Lotz et al. (2008) Lotz, J. M., Davis, M., Faber, S. M., et al. 2008, ApJ, 672, 177
- Lotz et al. (2010) Lotz, J. M., Jonsson, P., Cox, T. J., et al. 2010, MNRAS, 404, 575
- Maiolino et al. (2012) Maiolino, R., Gallerani, S., Neri, R., et al. 2012, MNRAS, 425, L66
- Martínez-Delgado et al. (2010) Martínez-Delgado, D., Gabany, R. J., Crawford, K., et al. 2010, AJ, 140, 962
- Miskolczi et al. (2011) Miskolczi, A., Bomans, D. J., & Dettmar, R.-J. 2011, A&A, 536, A66
- Morales et al. (2018) Morales, G., Martínez-Delgado, D., Grebel, E. K., et al. 2018, A&A, 614, A143
- Pan et al. (2019) Pan, H.-A., Lin, L., Hsieh, B.-C., et al. 2019, ApJ, 881, 119
- Pizzella et al. (2014) Pizzella, A., Morelli, L., Corsini, E. M., et al. 2014, A&A, 570, A79
- Radburn-Smith et al. (2014) Radburn-Smith, D. J., de Jong, R. S., Streich, D., et al. 2014, ApJ, 780, 105
- Reichard et al. (2008) Reichard, T. A., Heckman, T. M., Rudnick, G., et al. 2008, ApJ, 677, 186
- Salim et al. (2007) Salim, S., Rich, R. M., Charlot, S., et al. 2007, ApJS, 173, 267
- Salim et al. (2016) Salim, S., Lee, J. C., Janowiecki, S., et al. 2016, ApJS, 227, 2
- Sánchez-Blázquez et al. (2006) Sánchez-Blázquez, P., Peletier, R. F., Jiménez-Vicente, J., et al. 2006, MNRAS, 371, 703
- Sánchez et al. (2012) Sánchez, S. F., Kennicutt, R. C., Gil de Paz, A., et al. 2012, A&A, 538, A8
- Sanders et al. (1988) Sanders, D. B., Soifer, B. T., Elias, J. H., et al. 1988, ApJ, 325, 74
- Sanders, & Mirabel (1996) Sanders, D. B., & Mirabel, I. F. 1996, ARA&A, 34, 749
- Schweizer et al. (1983) Schweizer, F., Whitmore, B. C., & Rubin, V. C. 1983, AJ, 88, 909
- Shapiro et al. (2008) Shapiro, K. L., Genzel, R., Förster Schreiber, N. M., et al. 2008, ApJ, 682, 231
- Shi et al. (2009) Shi, Y., Rieke, G., Lotz, J., et al. 2009, The Astrophysical Journal, 697, 1764
- Silva et al. (2016) Silva, D. R., Blum, R. D., Allen, L., et al. 2016, American Astronomical Society Meeting Abstracts #228 228, 317.02
- Smee et al. (2013) Smee, S. A., Gunn, J. E., Uomoto, A., et al. 2013, AJ, 146, 32
- Solomon et al. (1997) Solomon, P. M., Downes, D., Radford, S. J. E., et al. 1997, ApJ, 478, 144
- Sparke et al. (2009) Sparke, L. S., van Moorsel, G., Schwarz, U. J., et al. 2009, AJ, 137, 3976
- Starkenburg et al. (2019) Starkenburg, T. K., Sales, L. V., Genel, S., et al. 2019, ApJ, 878, 143
- Stevens et al. (2016) Stevens, A. R. H., Croton, D. J., & Mutch, S. J. 2016, MNRAS, 461, 859
- Stewart (2017) Stewart, K. R. 2017, Gas Accretion onto Galaxies, 249
- Torrey et al. (2012) Torrey, P., Cox, T. J., Kewley, L., et al. 2012, ApJ, 746, 108
- van de Voort et al. (2015) van de Voort, F., Davis, T. A., Kereš, D., et al. 2015, MNRAS, 451, 3269
- Veilleux et al. (2013) Veilleux, S., Meléndez, M., Sturm, E., et al. 2013, ApJ, 776, 27
- Wake et al. (2017) Wake, D. A., Bundy, K., Diamond-Stanic, A. M., et al. 2017, AJ, 154, 86
- Wen et al. (2014) Wen, Z. Z., Zheng, X. Z., & An, F. X. 2014, ApJ, 787, 130
- Westfall et al. (2019) Westfall, K. B., Cappellari, M., Bershady, M. A., et al. 2019, AJ, 158, 231
- Williams et al. (2004) Williams, G. G., Olszewski, E., Lesser, M. P., et al. 2004, Proc. SPIE, 787
- Xu et al. (2012) Xu, C. K., Zhao, Y., Scoville, N., et al. 2012, The Astrophysical Journal, 747, 85
- Yan et al. (2016a) Yan, R., Tremonti, C., Bershady, M. A., et al. 2016a, AJ, 151, 8
- Yan et al. (2016b) Yan, R., Bundy, K., Law, D. R., et al. 2016b, AJ, 152, 197
- Zou et al. (2017) Zou, H., Zhou, X., Fan, X., et al. 2017, PASP, 129, 064101
- Zou et al. (2018) Zou, H., Zhang, T., Zhou, Z., et al. 2018, ApJS, 237, 37