Examining the surface phase diagram of IrTe2 with photoemission.
Abstract
In the transition metal dichalcogenide IrTe2, low-temperature charge-ordered phase transitions involving Ir dimers lead to the occurrence of stripe phases of different periodicities, and nearly degenerate energies. Bulk-sensitive measurements have shown that, upon cooling, IrTe2 undergoes two such first-order transitions to and reconstructed phases at K and K, respectively. Here, using surface sensitive probes of the electronic structure of IrTe2, we reveal the first-order phase transition at K to the stripes phase, previously proposed to be the surface ground state. This is achieved by combining x-ray photoemission spectroscopy and angle-resolved photoemission spectroscopy, which give access to the evolution of stripe domains and a particular surface state, the energy of which is dependent on the Ir dimer length. By performing measurements over a full thermal cycle, we also report the complete hysteresis of all these phases.
I Introduction
Transition-metal dichalcogenides (TMDCs) are layered quasi-two dimensional (2D) materials that have generated considerable interest in recent years due to the possibility of reducing their thickness down to the monolayer as well as to their particularly diverse optical and electronic properties despite their chemical simplicity Wang et al. (2012); Radisavljevic et al. (2011); Mak et al. (2012); Bertoni et al. (2016). Additionally, TMDCs have been extensively studied for several decades, due to the occurrence of phase transitions such as charge-density waves (CDWs) or superconductivity Rossnagel (2011); Johannes and Mazin (2008); Pyon et al. (2012) at low temperatures. An open question is how these collective states evolve for thicknesses of a few layers at surfaces. Many recent examples have illustrated different behaviors in monolayers, namely an enhanced critical temperature for the CDW in TiSe2 Chen et al. (2016), enhanced superconductivity in TaS2 Navarro-Mortalla et al. (2016), or a change in the symmetry of the CDW in VSe2 Chen et al. (2018). In this context, the surface of IrTe2 offers an exciting platform for studying ordered phases in a quasi-2D material with large spin-orbit coupling on the transition metal site. A complex succession of charge-ordered phases involving the creation of Ir dimers Pascut et al. (2014a); Mauerer et al. (2016); Hsu et al. (2013) has been observed in IrTe2 at low temperature, which gives way to superconductivity for thin samples Yoshida et al. (2018), after rapid cooling Oike et al. (2018) or with Pt substitution Pyon et al. (2012).
IrTe2 undergoes a first-order structural phase transition at K from a trigonal CdI2-type () unit cell to a monoclinic () unit cell accompanied by jumps in the resistivity and magnetic susceptibility Ko et al. (2015); Fang et al. (2013); Jobic et al. (1991); Matsumoto et al. (1999); Toriyama et al. (2014); Koley (2016); Li et al. (2014a); Paris et al. (2016). In this first low-temperature charge-ordered phase, one-dimensional stripes of Ir dimers with a strongly reduced bond length have been observed by x-ray diffraction and are described by a wave vector Pascut et al. (2014a, b); Ko et al. (2015); Li et al. (2014b); Toriyama et al. (2014); Oh et al. (2013); Takubo et al. (2014). At K, a second phase transition follows and the charge-ordering wave vector of this new low-temperature phase is in the bulk of IrTe2. This has stimulated many scanning tunneling microscopy (STM) studies, which evidenced additional ordering patterns and revealed a surface periodicity proposed to be the ground state reconstruction Mauerer et al. (2016); Ko et al. (2015); Li et al. (2014b); Dai et al. (2014). In addition, a detailed low-energy electron diffraction (LEED) and STM study observed in addition the coexistence of the surface and phases over a wide temperature range Chen et al. (2017). It was later realized that the phase can also appear in the bulk at very low temperature, if the cooling rate is higher than 4 Kmin Takubo et al. (2018). Numerous angle-resolved photoelectron spectroscopy (ARPES) investigations have exposed large changes in the spectral weight of electronic states up to eV below the Fermi level () at low temperatures, leading to severe band broadening Mauerer et al. (2016); Chen et al. (2017); Ko et al. (2015); Li et al. (2014b); Dai et al. (2014); Monney et al. (2018). In parallel, x-ray photoemission spectroscopy (XPS) studies have identified a large splitting of the Ir core-levels across the charge-ordered phase transitions into Ir+3 and Ir+4 mixed valence states Ko et al. (2015); Qian et al. (2014). The charge-ordered phases are stabilized by the energy gain due to the stronger bonds of the dimerized states, despite the elastic energy loss Pascut et al. (2014b). Therefore, phases of different stripe periodicities appear with increasing dimer densities as temperature decreases. Their complex kinetics, involving dimers breaking and reassembling, has been studied by Mauerer et al. Mauerer et al. (2016). Interestingly, a very recent study predicts the correct by considering the entropy of the phase Saleh and Artyukhin (2020). However, in all experimental studies, a clear sequence of sharp transitions between the surface , and phases could not be unambiguously detected.
In this paper, we present a systematic temperature-dependent study of the electronic properties at the surface of IrTe2. Using XPS, we measure the evolution of the Ir dimer density upon cooling down to K and warming back to room temperature by quantifying the Ir core level peak intensities. While we confirm the sharp first-order transition occurring at , we observe a more intricate behavior below at the surface. The phase is replaced by the phase that progressively changes into the phase, indicating domain growth at the expense of the domains. However, our ARPES measurements reveal that a third first-order structural transition between the and phases occurs at K. This is based on the observation of a surface state at about eV binding energy that is an excellent marker of the periodicity of the dominating phase, since its binding energy is dictated by the Ir dimer length, as supported by density functional theory (DFT) calculations. By analyzing both XPS and ARPES data over the full warming and cooling cycle, and combining them with LEED measurements, we are able to reconstruct the complete surface phase diagram of IrTe2 with the hysteretic behavior of all , , and phases.
II Methods
Single crystals of IrTe2 were grown using the self-flux method Fang et al. (2013); Jobic et al. (1991). They were characterized by magnetic susceptibility and resistivity measurements (see Appendix VI.3), which confirm that K and = K. Samples were cleaved at room temperature in vacuum at a pressure of about mbar; during the photoemission measurements, the base pressure was better than mbar. XPS measurements were acquired at the PEARL beamline Muntwiler et al. (2017) of the Swiss Light Source. The total energy resolution was meV. The temperature-dependent ARPES study was carried out using a Scienta DA photoelectron analyzer and monochromatized HeI radiation as excitation source ( eV). The total energy resolution was about meV and the error on the sample temperature was estimated to be K. Cooling and warming of the sample were carried out at rates Kmin and Kmin, respectively, and each measurement was preceded by a pause of at least 10 min, to ensure thermalization. Small spot LEED with micron resolution (LEED) data were obtained using a low energy electron microscopy (LEEM)/photoemission electron microscopy (PEEM)/LEED instrument (Elmitec GmbH). Samples were cleaved in ultra-high vacuum ( mbar). The aperture for LEED measurements was set to select a spatial region on the sample of 20 m.
DFT calculations with spin-orbit interaction were performed using the Vienna ab-initio simulation package (VASP) Kresse and Hafner (1993, 1994); Kresse and Furthmueller (1996a, b) within the projector augmented wave method Kresse and Joubert (1999) and the Perdew-Burke-Ernzerhof (PBE) functional Perdew et al. (1996). The cutoff energy was set to eV and the k-point grid spacing was Å-1. Band unfolding has been performed using the BandUP code Medeiros et al. (2014, 2015).
III Results and discussion
III.1 Ir core levels
We present first a detailed XPS study of the Ir core levels. Figures 1 (a) and 1 (b) shows a zoom on the Ir core-levels measured at different temperatures upon cooling and warming, respectively. A clear splitting occurs below , with a new peak appearing at eV binding energy and corresponding to the Ir4+ states (the peak at eV binding energy is attributed to the Ir3+ states). Across upon cooling [ Fig. 1 (a) ], the intensity ratio between the Ir4+ and Ir3+ peaks is reversed and, upon warming [Fig. 1 (b)], this intensity ratio changes further in a non-trivial way. In Fig. 1 (c), the intensity ratio (area) Ir4+/(Ir3++Ir4+) is plotted as a function of temperature, when cooling from K down to K and then warming back to K.
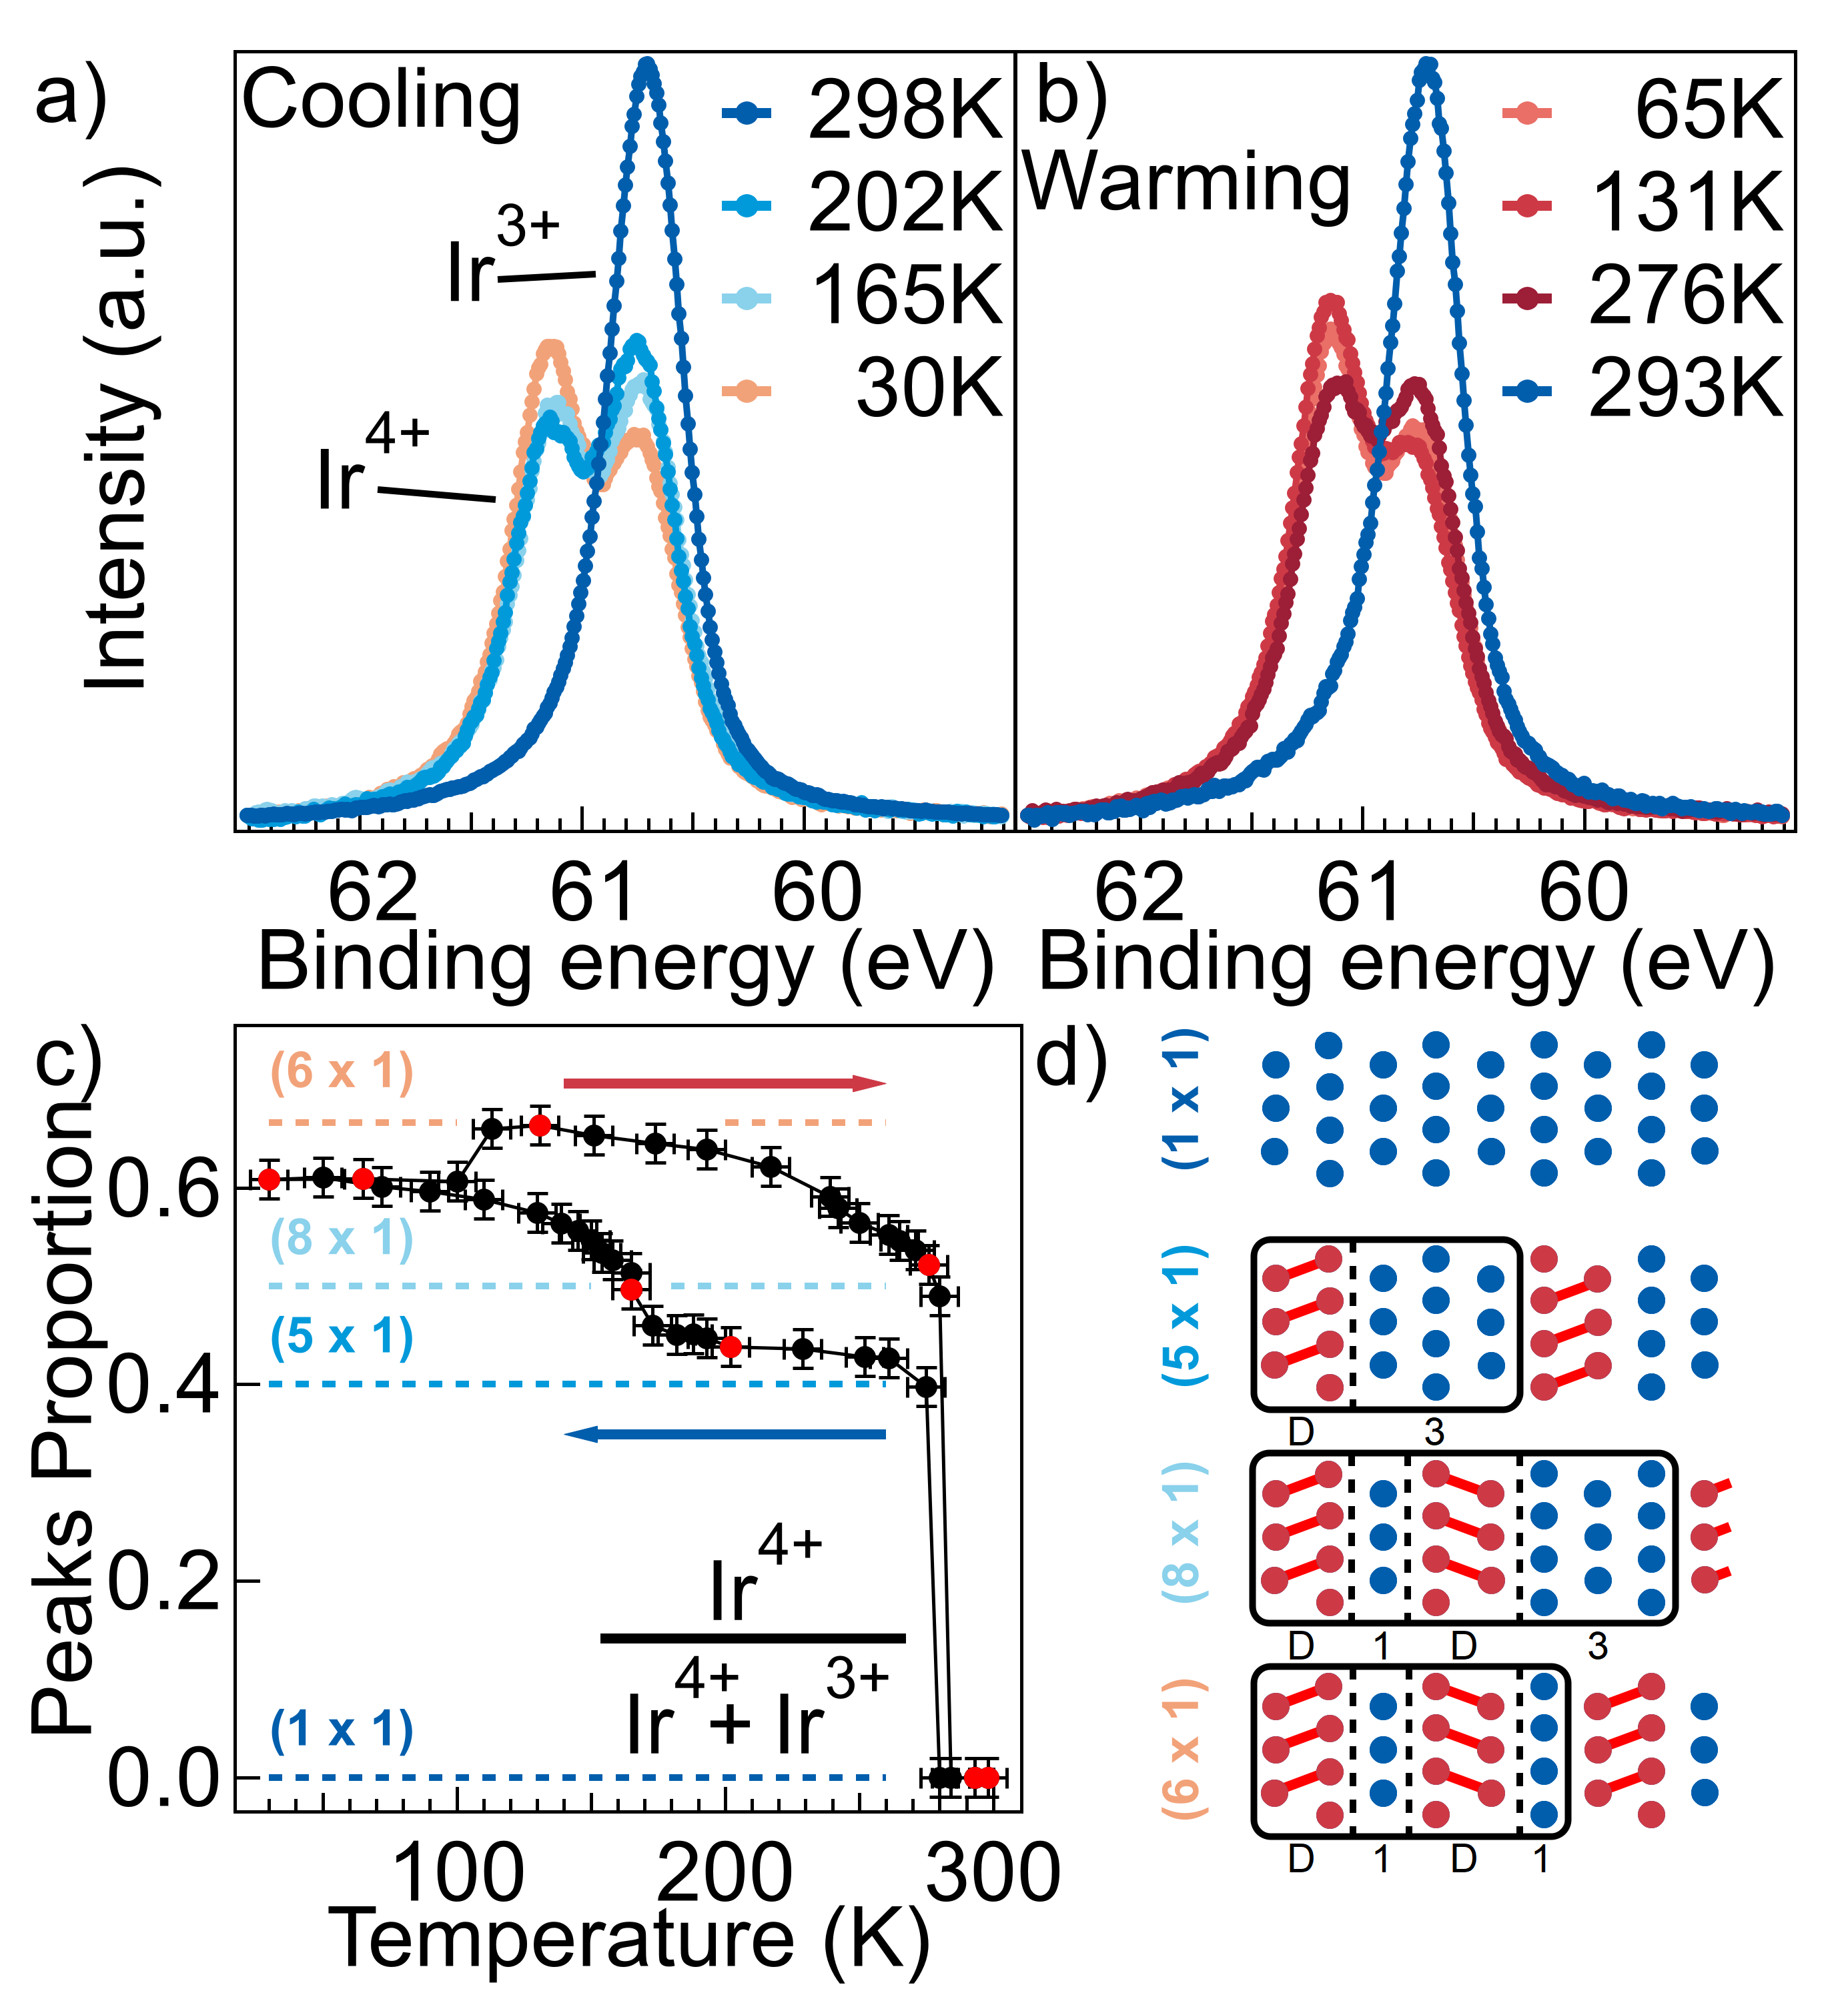
The Ir4+/(Ir3++Ir4+) intensity ratio measured by XPS has been interpreted as a measure of the density of Ir4+ Ir4+ dimers in the different phases observed in IrTe2 Ko et al. (2015); Qian et al. (2014). On cooling, different stripe periodicities have been evidenced by STM and LEED at the surface of IrTe2 Hsu et al. (2013); Chen et al. (2017); Mauerer et al. (2016); Ko et al. (2015). Below , a phase with two dimerized Ir4+ atoms, labeled D, and triple undimerized Ir atoms have been observed [Fig. 1 (d)], giving a Ir4+/(Ir3++Ir4+) ratio of in good agreement with our XPS data just below [Fig. 1 (c)]. Across , the phase gives way to a phase with a Ir4+/(Ir3++Ir4+) ratio of , due to the presence of Ir4+ dimers alternating with triple and single undimerized Ir atoms [Fig. 1 (d)]. At even lower temperatures, recent STM and LEED studies Hsu et al. (2013); Chen et al. (2017); Mauerer et al. (2016); Li et al. (2014b), supported by DFT calculations, revealed a phase with a Ir4+/(Ir3++Ir4+) ratio of and concluded that it represents the low-temperature ground state at the surface of IrTe2. Indeed, below , the Ir4+/(Ir3++Ir4+) ratio increases progressively above [Fig. 1 (c)], meaning that the phase is gradually replaced by the phase. At K, the phase dominates over the phase, since the Ir4+/(Ir3++Ir4+) ratio reaches a value of , close to the maximum value of expected for a pure phase with two dimers over six Ir atoms [see Fig. 1 (d)]. Interestingly, when warming the sample above K, this ratio increases to , indicating further changes in the vs phase ratio. This effect, although small, can be directly seen on the XPS spectra of Fig. 1 (b), and will be addressed further below. In summary, upon cooling, the Ir4+/(Ir3++Ir4+) intensity ratio measured by XPS reveals that a sharp transition occurs across , but that the evolution below is continuous with temperature, as a consequence of the coexistence of domains with different stripe periodicities.
III.2 Low-energy electronic structure
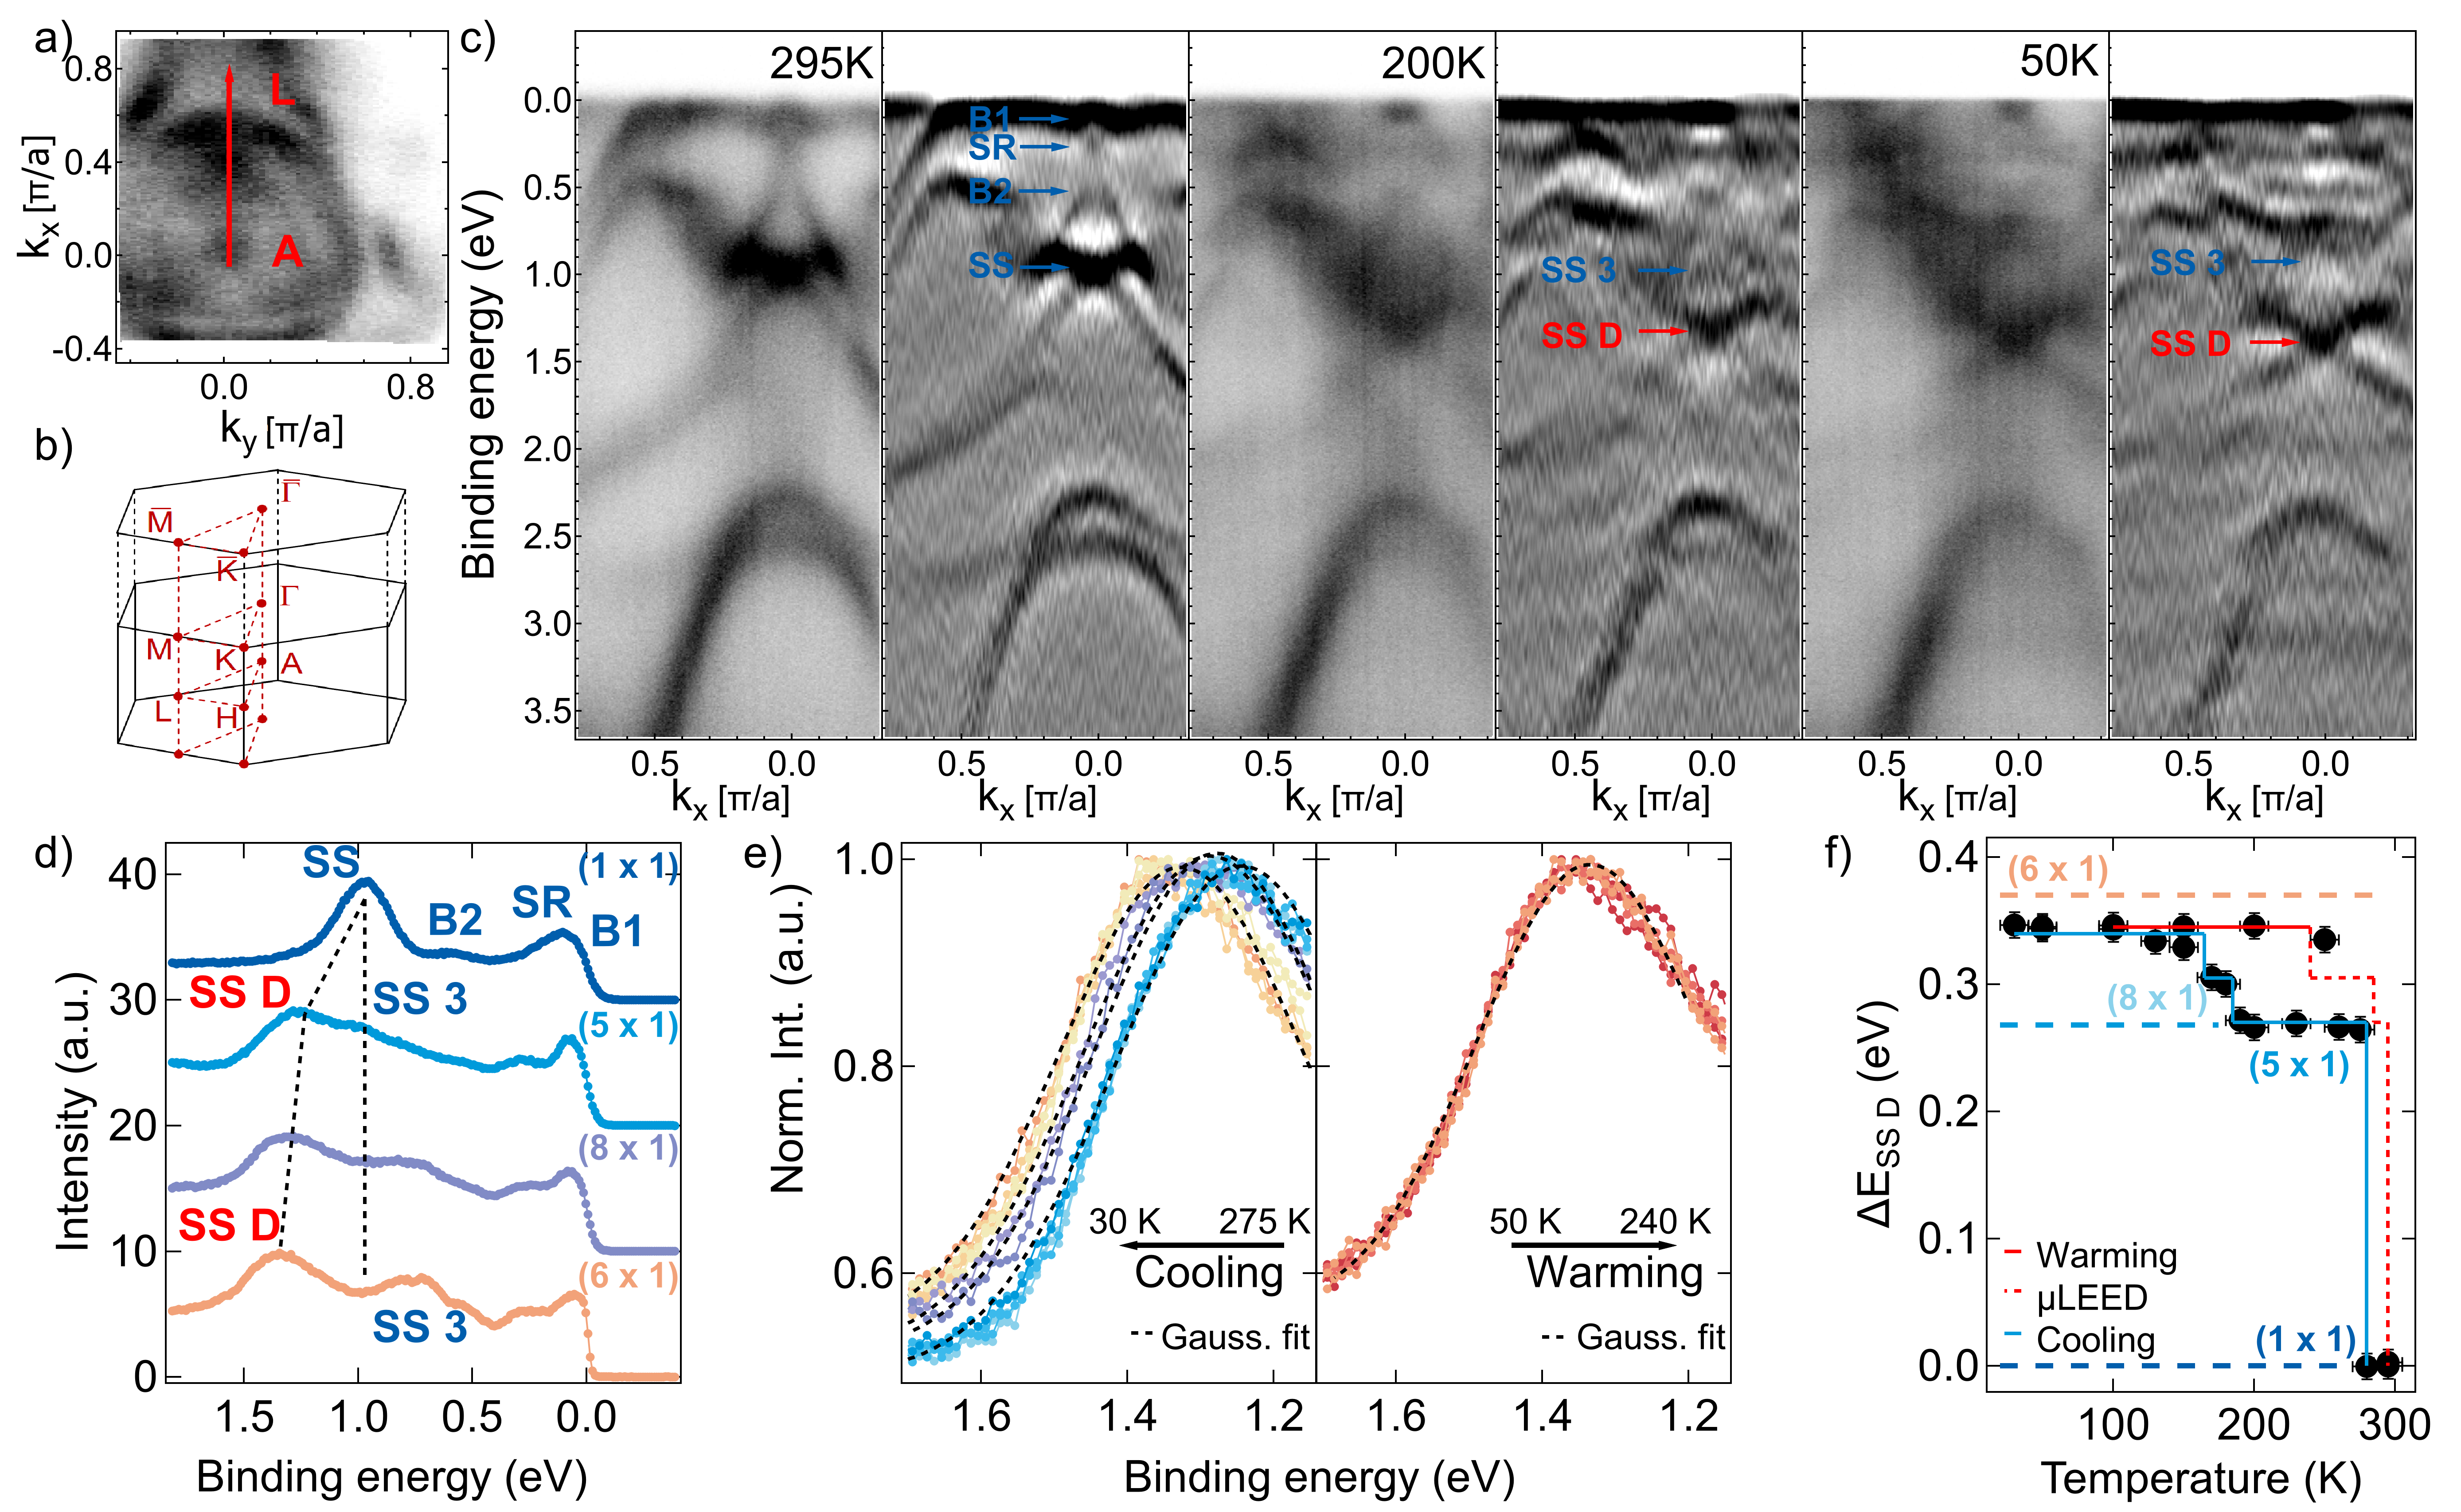
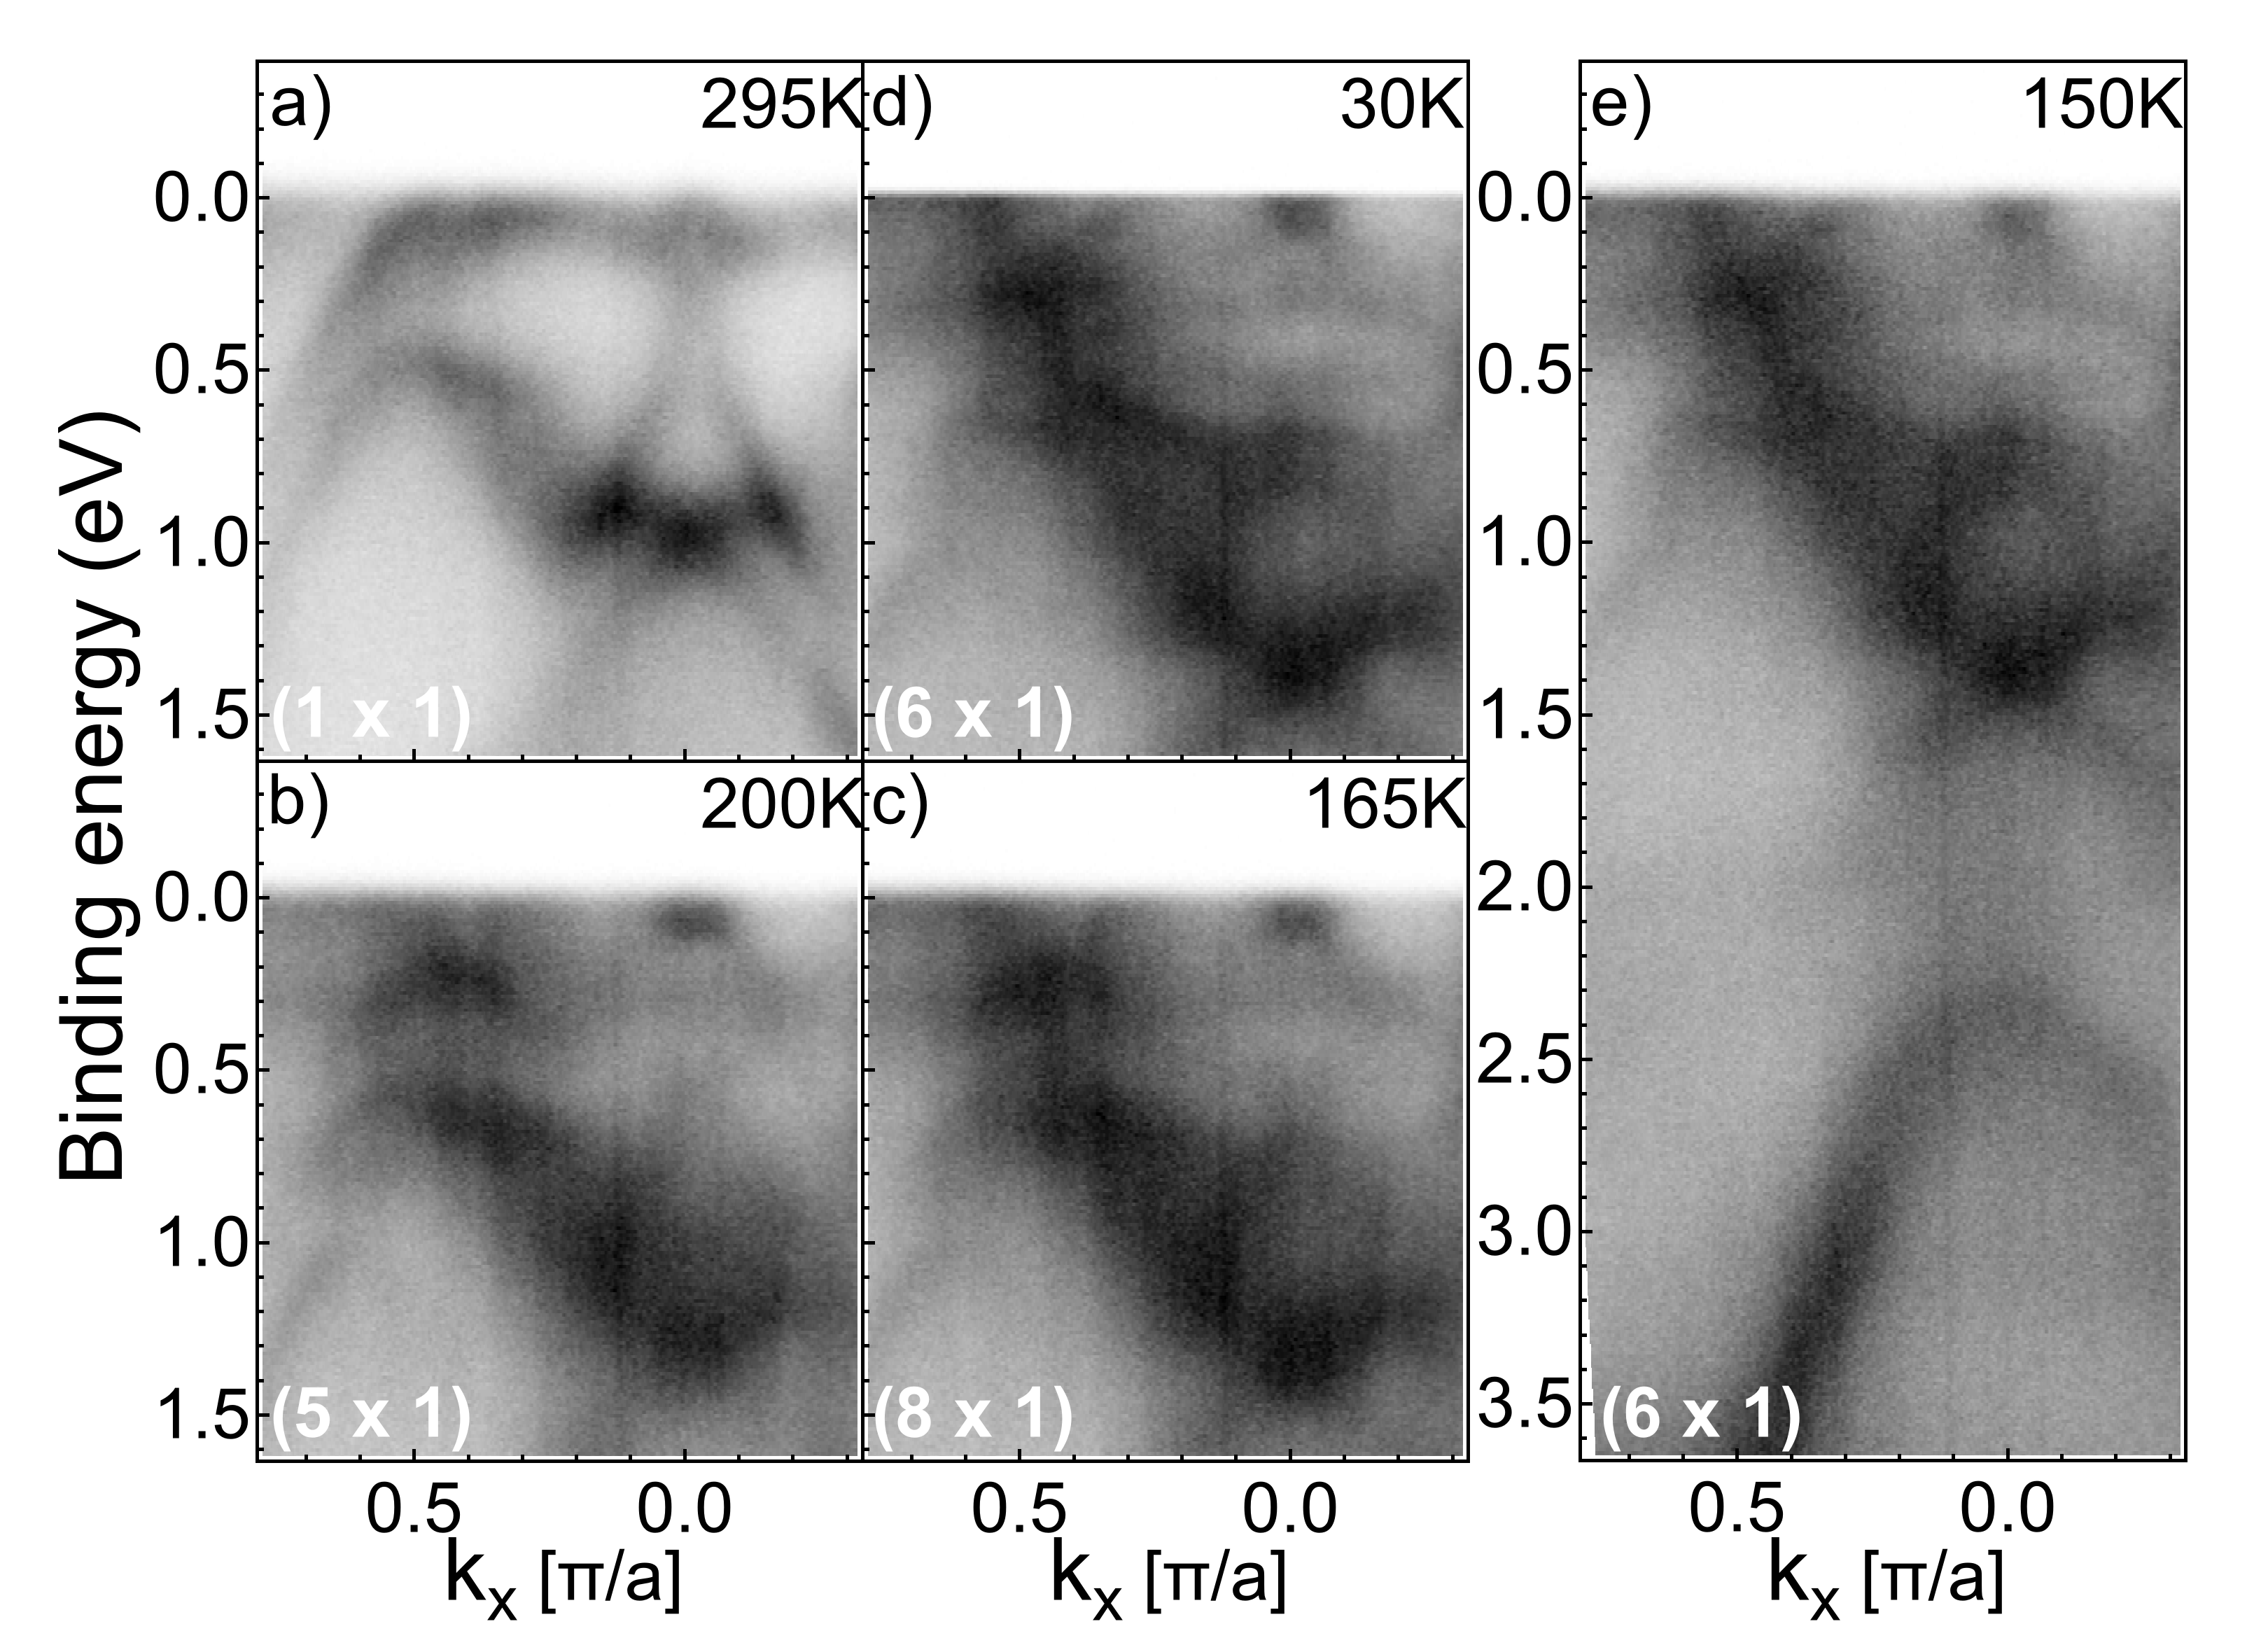
We have also performed ARPES measurements as a function of temperature, to discriminate further the occurrence of difference phases in IrTe2. Figure 2 (a) shows its room-temperature Fermi surface (integrated over eV around ). At this photon energy, states close to the ALH plane are probed, in agreement with the literature Ootsuki et al. (2013, 2014, 2019). The three-dimensional Brillouin zone and its surface projection are presented in Fig. 2 (b). In Fig. 2 (c), ARPES spectra taken at K , K and K , along the AL direction are displayed, together with their second derivative. Corresponding energy distribution curves (EDCs) integrated around A are shown in Fig. 2 (d). At K [Fig. 2 (c), left panels], the electronic bands are sharp and, by comparison with the literature Lee et al. (2017); Bahramy et al. (2017), we can identify the presence of a bulk state B1 just below , a surface resonance SR dispersing around eV binding energy on top of a bulk band B2, and an intense surface state SS at about eV binding energy. This is further confirmed by a DFT calculation of the bulk-projected band structure combined with a slab calculation [see Fig. 3 (b) and next paragraph]. All these features can be seen in the corresponding EDC [Fig. 2 (d)]. When decreasing the temperature below , the electronic bands become intricate due to the new translational symmetry of the charge-ordered phases and their mixed orientations Hsu et al. (2013). One distinguishes a multitude of folded bands [see Fig. 2 (c) center and right panels], especially, in the binding energy range between and eV. At K, in the phase, the surface state is split into two states. This is more obvious in the EDC (light blue curve) in Fig. 2 (d). We attribute the surface state positioned at eV binding energy (labelled SS 3) as originating from the undimerized triple Ir atoms, since it lies at the same energy as the surface state of the phase, for which there are only undimerized atoms. The intense second surface state (labelled SS D) is shifted to about eV binding energy and we attribute it to the dimerized Ir atoms. At K, in the -dominated phase [see right panels in Fig. 2 (c) and orange EDC in Fig. 2 (d)], the SS D surface state shifts further to higher binding energy. Looking at the ARPES spectra [graphs (c)], one sees that the surface state dispersion remains mostly unchanged across the phase transitions, except for the global energy shift, confirming its persistence at low temperature.
III.3 DFT analysis and the surface-state
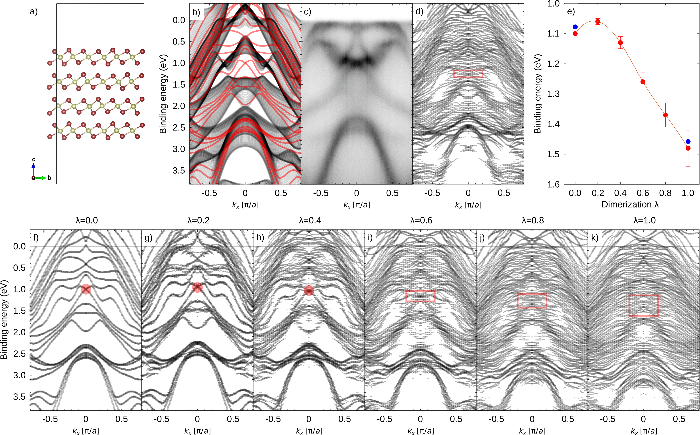
To support our interpretation of the evolution of the binding energy of the surface state across the phase transitions, we have performed DFT calculations using a slab geometry for the , , and surface phases, based on the atomic bulk structure of the corresponding phases Jobic et al. (1991); Pascut et al. (2014b) [see Fig. 3 (a) for the atomic structure of this slab in the phase]. We have assumed that the structural parameters of the bulk IrTe2 phase are the same as in IrTe2-xSex Pascut et al. (2014b). In the room-temperature phase, the surface state is identified by comparing the bulk projected band structure to the four-layer slab band structure [Fig. 3 (b)]. The band crossing at () near eV binding energy in the slab band structure appears in a gap region of the bulk projected band structure, thus confirming the surface nature of this state, in agreement with literature Lee et al. (2017); Bahramy et al. (2017). The binding energy of the surface state is well reproduced in comparison to the experiment at 295 K [Fig. 3 (c)]. In Fig. 3 (d), we show the unfolded four-layer slab band structure for the phase. Here the band structure becomes complicated because of the multiplicity of the bands. A direct comparison with the four-layer slab band structure [Fig. 3 (b)] helps to locate the surface state crossing at at about eV binding energy. The red box in Fig. 3 (d) renders the uncertainty about the exact localization of this surface state, which is likely duplicated due to the new surface periodicity.
Next we use DFT calculations to obtain the binding energy of this surface state in the phase. Again, the band structure becomes complicated, because of the periodicity of the phase. In that respect, it is also important to recall that the dimer bond length displays a significant variation as a function of the phase periodicity. Pascut et al. inferred Å and Å for the and for the bulk phases, respectively, and proposed a value of Å (confirmed experimentally in the STM study of Hsu et al. Hsu et al. (2013)) for a DFT-calculated reconstruction Pascut et al. (2014b). The overall picture is that the Ir dimer bond length decreases across the different phases. So it is very likely that the increase of the binding energy of the surface state SS D is due to a shortening of the Ir dimer bonds. To check this idea, we introduce an interpolation parameter in our four-layer slab structural model for the surface phase, with values and corresponding to the surface phase and the surface phase, respectively. To have a controlled interpolation of the structural parameters (lattice parameters and atom positions, as well as dimer length), structural relaxation was not considered. For comparison with experimental ARPES data, the surface band structures were unfolded to a corresponding reciprocal cell. Figures 3 (f)3 (k) show the corresponding DFT band structures for to along the direction. In comparison to the calculations of Fig. 3 (b) for the phase, the bands become back-folded to the original Brillouin zone with various weights. However, the surface state is still recognizable and shifts to higher binding energy. We have performed such calculations for up to and tracked the energy position of the surface state. The resulting values for the surface state, shown in Fig. 3 (e) (the error bars relate to the uncertainty in localizing the exact position of the surface state rendered by the red boxes), compare very well with the experimental data. In particular, it reproduces the shift in the surface-state binding energy as a function of the increase of dimerization in the phase.
Note that our calculations do not exclude the possibility that the bulk band gap hosting the surface state at [see Fig. 3 (b)] closes in the low-temperature phases. Closure of the bulk band gap would mean that the surface state becomes a surface resonance, with a deeper extension of its wave function into the bulk and an enhanced sensitivity to bulk physics.
Based on these observations, we consider the energy of the surface state at the highest binding energy in our experimental ARPES data as a marker of the phase and stripe periodicities. EDCs at different temperatures are shown in Fig. 2 (e) upon cooling (left) and warming (right) the sample. Interestingly, they exhibit a shift in energy and can be collected in different groups upon cooling, but do not show many changes upon warming. We have fitted them in the displayed energy range with a single Gaussian. The resulting surface-state energy position is displayed on Fig. 2 (f) (full symbols) as a function of temperature. The shift in binding energy of the surface state derived from the DFT calculations in the phase (with respect to the case) is reported as orange dashed lines, showing a very good agreement with experimental data. Three different sharp transitions can be observed upon cooling and, by comparison with the XPS data [Fig. 1 (c)], we identify the transition at into the phase, at the transition into the phase and at K the transition into the phase. All of them are expected to be first-order transitions but, surprisingly, we do not observe the distinct hysteresis of the and phases upon warming up to K.
III.4 LEED upon warming
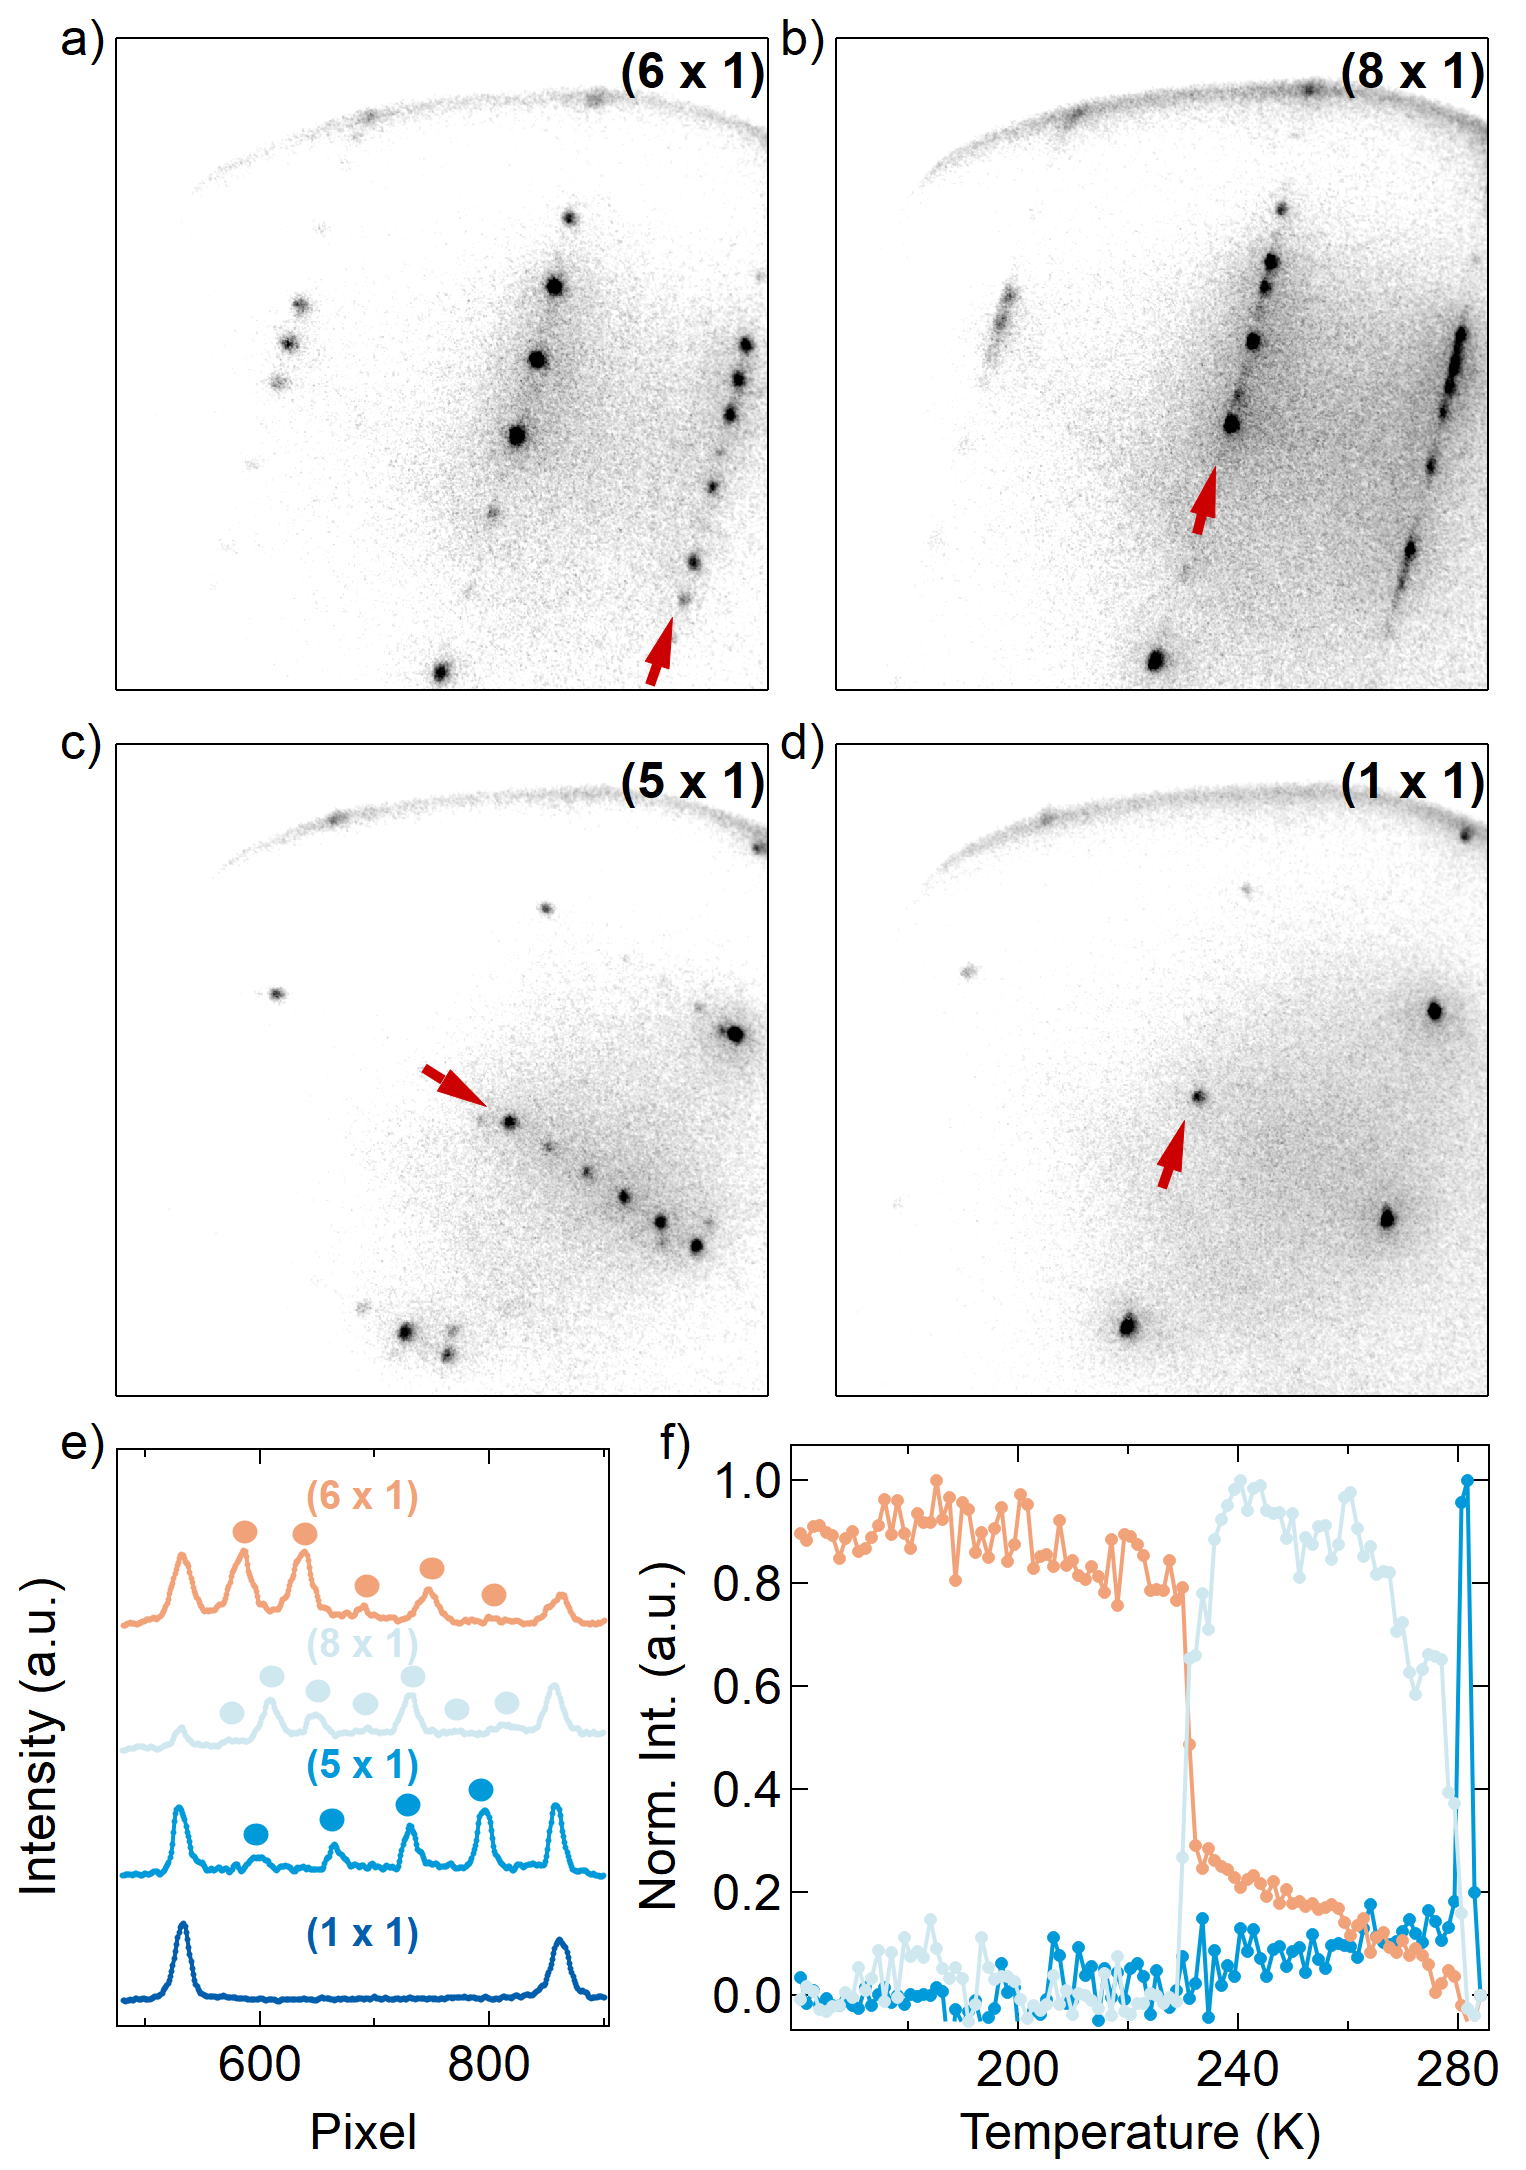
To investigate in more detail possible changes in the stripe phases upon warming, we have performed LEED measurements on IrTe2. Figures 4 (a)4 (d) shows the raw LEED images taken at different temperatures during the warming process. It illustrates (a) the phase at K, (b) the at K, (c) the phase at K and, finally, (d) the phase at K. All graphs clearly show the different superstructures characterizing each phase at their respective temperatures. Line cuts through the LEED images are shown in Fig. 4 (e), revealing the surface diffraction spots and the superstructure spots corresponding to different structural phases obtained at different temperatures. In each case, only a single phase was present within the selected real-space region. IrTe2 has then been measured continuously with LEED while heating the sample, starting from the -dominated phase at about K. The evolution of the contribution of the , and spots to the LEED images is shown in Fig. 4 (f). From the lowest temperature of K, the phase remains the only phase visible until K when the system transforms abruptly to the phase. The phase persists up to K and then disappears, transiently giving way to the phase, before the phase sets in again.
III.5 Discussion
We can now complete the phase diagram of Fig. 2 (f) with the LEED results 111Formally, we do not measure electronic surface states with LEED, but we make use of the transition temperatures (upon warming) extracted with LEED to extrapolate the phase diagram of Fig. 2 (f). (red dashed line) and obtain the full picture of phase transitions occurring at the surface of IrTe2, in very good agreement with previous LEED and STM works Hsu et al. (2013); Chen et al. (2017); Mauerer et al. (2016); Li et al. (2014b). In particular, we observe that the phase appears at K upon cooling and then persists up to K upon warming. Therefore, with our combined XPS, ARPES, and LEED study, we clearly reveal the hysteresis of the , , and phases over the cooling/warming cycle.
In addition to this, there is still a puzzling observation based on our XPS data [see Fig. 1 (c)]: Upon warming, at about K, the Ir4+/(Ir3++Ir4+) ratio jumps from a value of to , indicating that the proportion of the phase increases to nearly 100% at this temperature, in comparison to the situation at K, for which about % of the surface is still populated by domains. The phase change at K occurs without any shift of the related surface state energy [Fig. 2 (f)], meaning that there is no significant concomitant structural change in the dominating phase. Therefore we conclude that, upon warming above K, the surface of IrTe2 gains sufficient thermal energy to allow the minority domains to overcome the kinetic energy barrier to transit into domains Mauerer et al. (2016). This suggests that temperature cycling around K might be an efficient way to prepare a full surface phase in IrTe2. However, this complete transition to the phase still contains incoherent domains of different orientations that result in broad ARPES spectra (see Appendix VI.1).
An alternative explanation is that the subsurface IrTe2 layers might transit from the dominant bulk phase (given our cooling rate, domains might also appear in the bulk Takubo et al. (2018)) and lock-in to the surface phase. XPS at a photon energy of eV probes electronic states deeper in the sample than ARPES at eV. Assuming a subsurface domain reorganization, it is interesting to note that there are hints of a weak transition occurring upon warming around K in transport data from the literature Ko et al. (2015); Fang et al. (2013); Ivashko et al. (2017), the temperature at which the phase disappears in our data [see Fig. 4 (b)].
IV Conclusion
In this paper, we have studied the electronic structure of IrTe2 with ARPES and XPS and have performed a detailed and systematic temperature dependent analysis across its charge-ordered phases. A first-order transition at K between the and phases is revealed. Using XPS, we have analyzed precisely the relative intensities of the Ir core-level and related them to the dimer populations in the different charge-ordered phases. Furthermore, we have identified a particular surface-state that shifts in binding energy across the phase transitions, an observation confirmed by DFT calculations demonstrating that this surface-state binding energy is a function of the Ir dimer length. Our results therefore establish a solid basis for further photoemission studies of IrTe2 under more exotic conditions like temperature quenching Oike et al. (2018) or time-resolved studies, or using thin samples Yoshida et al. (2018) and, ultimately, a monolayer of IrTe2.
V Acknowledgments
This project was supported from the Swiss National Science Foundation (SNSF) Grant No. P00P2_170597. A.P. acknowledges the Osk. Huttunen Foundation for financial support, and CSC – IT Center for Science, Finland, for computational resources. B.B. acknowledges support from the COST Action CA16218. We acknowledge the Paul Scherrer Institute, Villigen, Switzerland for provision of synchrotron radiation beamtime at beamline PEARL of the Swiss Light Source. We are very grateful to P. Aebi for fruitful discussions and for sharing with us his photoemission setup. Skillful technical assistance was provided by F. Bourqui, B. Hediger and O. Raetzo.
VI Appendices
VI.1 Extended ARPES data
Figure 5 shows ARPES spectra taken at different temperatures during the cooling process, (a) K, (b) K, (c) K, (d) K, and (e) at K during the warming process. The different electronic bands have already been discussed in the main text. Figure 5 allows us to distinguish the evolution of the electronic structure of IrTe2 and, in particular, of its surface state, as a function of temperature. We can differentiate the changes of the surface state from phase , , to phase . We can note the robustness of the phase during the warming process, seeing only negligible changes between spectra Figs. 5 (d) and 5 (e).
VI.2 Extended DFT data
The bulk energies (eVatom) are for the phase, for the phase, for the phase, and for the phase. They are obtained from relaxed structures calculated with PBE functional and relaxation is done without spin-orbit interaction. In this framework, the sequence of structures from lowest to highest energy is . This is very close to what is observed experimentally, except for the inversion of the and phases. However, the and phases are very close in energy.
VI.3 Transport data
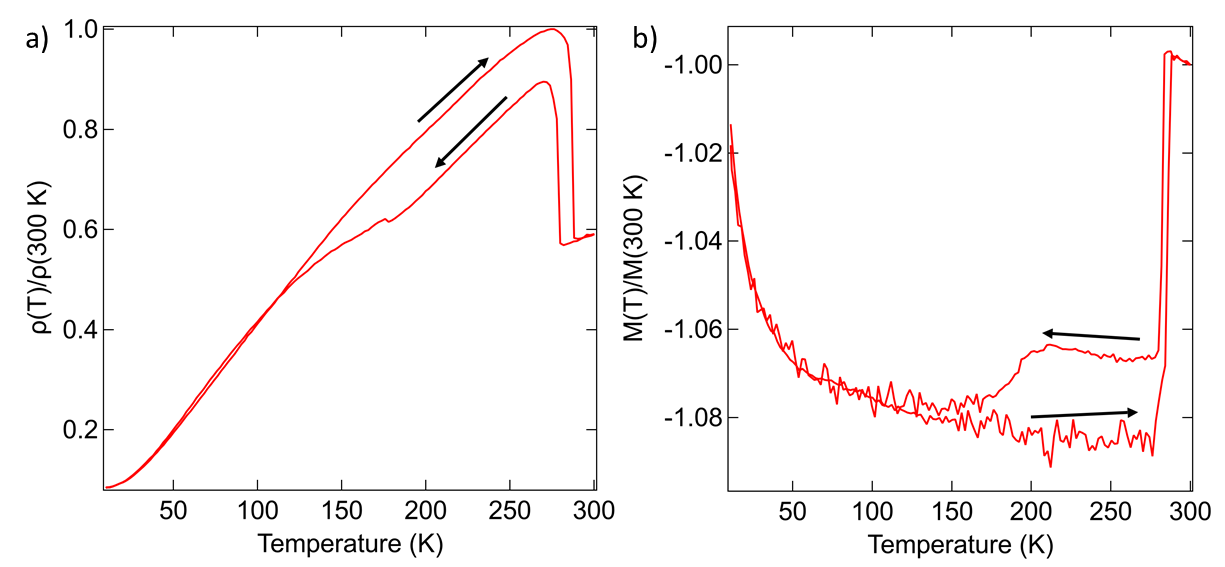
In Fig. 6, we show the temperature-dependent [graph (a)] resistivity and [graph (b)] magnetization curves of a single crystal of IrTe2 of the batch, which we used for this study. The magnetization was measured in an external field of T, with the field perpendicular to the plane of the crystal. The electrical transport measurements were performed in a standard four-probe configuration in the plane of the crystal. The sharp, well-defined transitions are strong indicators for the very high quality and order of the used crystals. From these measurements, we infer the critical temperatures of the charge-ordered transitions K and = K.
References
- Wang et al. (2012) Q. H. Wang, K. Kalantar-Zadeh, A. Kis, J. N. Coleman, and M. S. Strano, Nature Nanotechnology 7, 699 (2012).
- Radisavljevic et al. (2011) B. Radisavljevic, A. Radenovic, J. Brivio, V. Giacometti, and A. Kis, Nature Nanotechnology 6, 147 (2011).
- Mak et al. (2012) K. F. Mak, K. He, J. Shan, and T. F. Heinz, Nature Nanotechnology 7, 494 (2012).
- Bertoni et al. (2016) R. Bertoni, C. W. Nicholson, L. Waldecker, H. Hübener, C. Monney, U. De Giovannini, M. Puppin, M. Hoesch, E. Springate, R. T. Chapman, C. Cacho, M. Wolf, A. Rubio, and R. Ernstorfer, Phys. Rev. Lett. 117, 277201 (2016).
- Rossnagel (2011) K. Rossnagel, Journal of Physics: Condensed Matter 23, 213001 (2011).
- Johannes and Mazin (2008) M. D. Johannes and I. I. Mazin, Phys. Rev. B 77, 165135 (2008).
- Pyon et al. (2012) S. Pyon, K. Kudo, and M. Nohara, Journal of the Physical Society of Japan 81, 053701 (2012).
- Chen et al. (2016) P. Chen, Y.-H. Chan, M.-H. Wong, X.-Y. Fang, M. Y. Chou, S.-K. Mo, Z. Hussain, A.-V. Fedorov, and T.-C. Chiang, Nano Letters 16, 6331 (2016).
- Navarro-Mortalla et al. (2016) E. Navarro-Mortalla, J. O. Island, S. Manas-Valero, E. Pinilla-Cienfuegos, A. Castellanos-Gomez, J. Quereda, G. Rubio-Bollinger, L. Chirolli, J. A. Silva-Guillen, N. Agraït, G. A. Steele, F. Guinea, H. S. J. van der Zant, and E. Coronado, Nature Communications 7, 11043 (2016).
- Chen et al. (2018) P. Chen, W. W. Pai, Y.-H. Chan, V. Madhavan, M. Y. Chou, S.-K. Mo, A.-V. Fedorov, and T.-C. Chiang, Phys. Rev. Lett. 121, 196402 (2018).
- Pascut et al. (2014a) G. L. Pascut, K. Haule, M. J. Gutmann, S. A. Barnett, A. Bombardi, S. Artyukhin, T. Birol, D. Vanderbilt, J. J. Yang, S.-W. Cheong, and V. Kiryukhin, Phys. Rev. Lett. 112, 086402 (2014a).
- Mauerer et al. (2016) T. Mauerer, M. Vogt, P.-J. Hsu, G. L. Pascut, K. Haule, V. Kiryukhin, J. Yang, S.-W. Cheong, W. Wu, and M. Bode, Phys. Rev. B 94, 014106 (2016).
- Hsu et al. (2013) P.-J. Hsu, T. Mauerer, M. Vogt, J. J. Yang, Y. S. Oh, S.-W. Cheong, M. Bode, and W. Wu, Phys. Rev. Lett. 111, 266401 (2013).
- Yoshida et al. (2018) M. Yoshida, K. Kudo, M. Nohara, and Y. Iwasa, Nano Letters 18, 3113 (2018).
- Oike et al. (2018) H. Oike, M. Kamitani, Y. Tokura, and F. Kagawa, Science Advances 4 (2018), 10.1126/sciadv.aau3489.
- Ko et al. (2015) K.-T. Ko, H.-H. Lee, D.-H. Kim, J.-J. Yang, S.-W. Cheong, M. J. Eom, J. S. Kim, R. Gammag, K.-S. Kim, H.-S. Kim, T.-H. Kim, H.-W. Yeom, T.-Y. Koo, H.-D. Kim, and J.-H. Park, Nature Communications 6, 7342 (2015).
- Fang et al. (2013) A. F. Fang, G. Xu, T. Dong, P. Zheng, and N. L. Wang, Scientific Reports 3, 1153 (2013).
- Jobic et al. (1991) S. Jobic, P. Deniard, R. Brec, J. Rouxel, A. Jouanneaux, and A. N. Fitch, Zeitschrift für anorganische und allgemeine Chemie 598, 199 (1991).
- Matsumoto et al. (1999) N. Matsumoto, K. Taniguchi, R. Endoh, H. Takano, and S. Nagata, Journal of Low Temperature Physics 117, 1129 (1999).
- Toriyama et al. (2014) T. Toriyama, M. Kobori, T. Konishi, Y. Ohta, K. Sugimoto, J. Kim, A. Fujiwara, S. Pyon, K. Kudo, and M. Nohara, Journal of the Physical Society of Japan 83, 033701 (2014).
- Koley (2016) S. Koley, Solid State Communications 247, 40 (2016).
- Li et al. (2014a) B. Li, G. Huang, J. Sun, and Z. Xing, Scientific Reports 4, 6433 (2014a).
- Paris et al. (2016) E. Paris, B. Joseph, A. Iadecola, C. Marini, H. Ishii, K. Kudo, S. Pascarelli, M. Nohara, T. Mizokawa, and N. L. Saini, Phys. Rev. B 93, 134109 (2016).
- Pascut et al. (2014b) G. L. Pascut, T. Birol, M. J. Gutmann, J. J. Yang, S.-W. Cheong, K. Haule, and V. Kiryukhin, Phys. Rev. B 90, 195122 (2014b).
- Li et al. (2014b) Q. Li, W. Lin, J. Yan, X. Chen, A. G. Gianfrancesco, D. J. Singh, D. Mandrus, S. V. Kalinin, and M. Pan, Nature Communications 5, 5358 (2014b).
- Oh et al. (2013) Y. S. Oh, J. J. Yang, Y. Horibe, and S.-W. Cheong, Phys. Rev. Lett. 110, 127209 (2013).
- Takubo et al. (2014) K. Takubo, R. Comin, D. Ootsuki, T. Mizokawa, H. Wadati, Y. Takahashi, G. Shibata, A. Fujimori, R. Sutarto, F. He, S. Pyon, K. Kudo, M. Nohara, G. Levy, I. S. Elfimov, G. A. Sawatzky, and A. Damascelli, Phys. Rev. B 90, 081104 (2014).
- Dai et al. (2014) J. Dai, K. Haule, J. J. Yang, Y. S. Oh, S.-W. Cheong, and W. Wu, Phys. Rev. B 90, 235121 (2014).
- Chen et al. (2017) C. Chen, J. Kim, Y. Yang, G. Cao, R. Jin, and E. W. Plummer, Phys. Rev. B 95, 094118 (2017).
- Takubo et al. (2018) K. Takubo, K. Yamamoto, Y. Hirata, H. Wadati, T. Mizokawa, R. Sutarto, F. He, K. Ishii, Y. Yamasaki, H. Nakao, Y. Murakami, G. Matsuo, H. Ishii, M. Kobayashi, K. Kudo, and M. Nohara, Phys. Rev. B 97, 205142 (2018).
- Monney et al. (2018) C. Monney, A. Schuler, T. Jaouen, M.-L. Mottas, T. Wolf, M. Merz, M. Muntwiler, L. Castiglioni, P. Aebi, F. Weber, and M. Hengsberger, Phys. Rev. B 97, 075110 (2018).
- Qian et al. (2014) T. Qian, H. Miao, Z. J. Wang, X. Shi, Y. B. Huang, P. Zhang, N. Xu, L. K. Zeng, J. Z. Ma, P. Richard, M. Shi, G. Xu, X. Dai, Z. Fang, A. F. Fang, N. L. Wang, and H. Ding, New Journal of Physics 16, 123038 (2014).
- Saleh and Artyukhin (2020) G. Saleh and S. Artyukhin, The Journal of Physical Chemistry Letters 11, 2127 (2020), pMID: 32079398.
- Muntwiler et al. (2017) M. Muntwiler, J. Zhang, R. Stania, F. Matsui, P. Oberta, U. Flechsig, L. Patthey, C. Quitmann, T. Glatzel, R. Widmer, E. Meyer, T. Jung, P. Aebi, R. Fasel, and T. Greber, Journal of Synchrotron Radiation 24, 354 (2017).
- Kresse and Hafner (1993) G. Kresse and J. Hafner, Phys. Rev. B 47, 558 (1993).
- Kresse and Hafner (1994) G. Kresse and J. Hafner, Phys. Rev. B 49, 14251 (1994).
- Kresse and Furthmueller (1996a) G. Kresse and J. Furthmueller, Computational Materials Science 6, 15 (1996a).
- Kresse and Furthmueller (1996b) G. Kresse and J. Furthmueller, Phys. Rev. B 54, 11169 (1996b).
- Kresse and Joubert (1999) G. Kresse and D. Joubert, Phys. Rev. B 59, 1758 (1999).
- Perdew et al. (1996) J. P. Perdew, K. Burke, and M. Ernzerhof, Phys. Rev. Lett. 77, 3865 (1996).
- Medeiros et al. (2014) P. V. C. Medeiros, S. Stafstroem, and J. Bjoerk, Phys. Rev. B 89, 041407 (2014).
- Medeiros et al. (2015) P. V. C. Medeiros, S. S. Tsirkin, S. Stafstroem, and J. Bjoerk, Phys. Rev. B 91, 041116 (2015).
- Ootsuki et al. (2013) D. Ootsuki, S. Pyon, K. Kudo, M. Nohara, M. Horio, T. Yoshida, A. Fujimori, M. Arita, H. Anzai, H. Namatame, M. Taniguchi, N. L. Saini, and T. Mizokawa, Journal of the Physical Society of Japan 82, 093704 (2013).
- Ootsuki et al. (2014) D. Ootsuki, T. Toriyama, M. Kobayashi, S. Pyon, K. Kudo, M. Nohara, T. Sugimoto, T. Yoshida, M. Horio, A. Fujimori, M. Arita, H. Anzai, H. Namatame, M. Taniguchi, N. L. Saini, T. Konishi, Y. Ohta, and T. Mizokawa, Journal of the Physical Society of Japan 83, 033704 (2014).
- Ootsuki et al. (2019) D. Ootsuki, H. Ishii, K. Kudo, M. Nohara, M. Arita, H. Namatame, M. Taniguchi, N. L. Saini, and T. Mizokawa, Journal of Physics and Chemistry of Solids 128, 270 (2019).
- Lee et al. (2017) H. Lee, K.-T. Ko, K. Kim, B.-G. Park, J. Yang, S.-W. Cheong, and J.-H. Park, Europhysics Letters 120, 47003 (2017).
- Bahramy et al. (2017) M. S. Bahramy, O. J. Clark, B.-J. Yang, J. Feng, L. Bawden, J. M. Riley, I. Markovic, F. Mazzola, V. Sunko, D. Biswas, S. P. Cooil, M. Jorge, J. W. Wells, M. Leandersson, T. Balasubramanian, J. Fujii, I. Vobornik, J. E. Rault, T. K. Kim, M. Hoesch, K. Okawa, M. Askawa, T. Sasagawa, T. Eknapakul, W. Meevasana, and P. D. C. King, Nature Materials 17, 21 (2017).
- Note (1) Formally, we do not measure electronic surface states with LEED, but we make use of the transition temperatures (upon warming) extracted with LEED to extrapolate the phase diagram of Fig. 2 (f).
- Ivashko et al. (2017) O. Ivashko, L. Yang, D. Destraz, E. Martino, Y. Chen, C. Guo, H. Yuan, A. Pisoni, P. Matus, S. Pyon, K. Kudo, M. Nohara, L. Forrò, H. Ronnow, M. Huecker, M. v. Zimmermann, and J. Chang, Scientific Reports 7, 17157 (2017).