BABAR-PUB-19/003
SLAC-PUB-17492
Resonances in annihilation near 2.2 GeV
Abstract
Using the initial-state radiation method, the cross section from 1.98 to 2.54 GeV is measured in a data sample of 469 fb-1 collected with the BABAR detector. The results are used in conjunction with previous BABAR results for the , , , and cross sections to investigate the nature of the resonance structure recently observed by the BESIII experiment in the cross section.
pacs:
13.25.Jx, 13.60.Le, 13.40.Gp, 14.40.BeThe BABAR Collaboration
I Introduction
Recently, a precise measurement of the cross section in the center-of-mass (c. m.) energy range 2.00–3.08 GeV was performed by the BESIII Collaboration beskkc . In this cross section, a clear interference pattern was observed near 2.2 GeV. To explain this pattern, BESIII inferred the existence of a resonance with a mass of MeV/ and a width of MeV. In the Particle Data Group (PDG) table pdg there are two vector resonances with a mass near 2.2 GeV/: and . The first is observed in three reactions: babar2170 ; belle2170 , bes2170 ; besiii2170 , and besiii2170n , but only in the decay mode . As shown in Ref. beskkc , the parameters of the resonance structure observed in the cross section differ from the PDG parameters by more than 3 in mass and more than 2 in width. The isovector resonance is not well established. The PDG lists three annihilation processes in which evidence for its existence is seen: , , and . In the first two reactions, wide ( MeV) resonance-like structures are observed near the reaction thresholds ompipi1 . A completely different structure is seen in the third process. A resonance with mass and width MeV/ and MeV, respectively, is needed to describe the interference pattern in the cross section pipi . Note that the parameters of this resonance are very similar to those mentioned above for the reaction from BESIII.
Any resonance in the cross section should also be present in . The most precise data on this reaction near 2 GeV were obtained by the BABAR Collaboration kskl . In this previous work, the cross section was measured up to 2.2 GeV. Above 2 GeV, the cross section was found to be consistent with zero within the statistical uncertainties of around 20 pb. In the present work we expand the energy region of the BABAR measurement up to 2.5 GeV. The new measurements, in conjunction with previous BABAR results for other exclusive processes, are used to investigate the nature of the structure observed by BESIII in .
II FIT to the BESIII and BABAR data
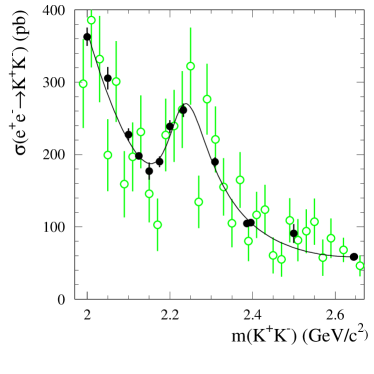
In Fig. 1 we show BESIII beskkc and BABAR babarkkc data on the dressed Born cross section for the process in the energy region of interest. The dressed cross section used to obtain resonance parameters is calculated from the bare cross section () listed in Refs. beskkc ; babarkkc as , where is the factor taking into account the vacuum polarization correction, while is the final-state correction (see, e.g., Ref. fscor ). The latter, in particular, takes into account extra photon radiation from the final state. In the energy region of interest, 2.00–2.5 GeV, and . The BESIII and BABAR data on the dressed cross section are fitted by a coherent sum of resonant and nonresonant contributions
| (1) |
where , is the charged kaon mass, is the Breit-Wigner function describing the resonant amplitude, , , and are the resonance mass, width, and peak cross section, is a second-order polynomial describing the nonresonant amplitude, and is the relative phase between the resonant and nonresonant amplitudes. The fit result is shown in Fig. 1. The fit yields () and the fit parameters are listed in Table 1.
| MeV/ | |
| MeV | |
| pb | |
| deg |
The systematic uncertainties in the resonance parameters come mainly from uncertainties in the description of the resonance and nonresonance shapes. The uncertainty due to the absolute c. m. energy calibration is negligible beskkc ; babarkkc . For the signal shape we study the effect of the energy-dependent width assuming that the main resonance decay mode is either or . We also use another parametrization of the nonresonance amplitude, in which the main energy dependence is given by the function inspired by the vector-meson dominance model, where and are fitted parameters, while small deviations from the main dependence are described by a quadratic polynomial. The nonresonance amplitude may have an energy-dependent imaginary part originating from vector resonances lying below 2 GeV. Using the results of Ref. bel , we estimate that its fraction reaches 10% at 2 GeV and decreases to 5% at 2.5 GeV. To study the effect of the imaginary parts, we multiply the function in Eq. (1) by a factor of , where is a linear function decreasing from 0.05–0.15 at GeV to zero at 2.5 GeV. The deviations from the nominal parameter values listed in Table 1 are taken as the estimates of the systematic uncertainties given in Table 1. The systematic uncertainty in the parameter includes also the correlated systematic uncertainty in the cross section, which is 2.5% (6%) for the BESIII (BABAR) data.
Our values for the resonance mass and width are close to the values MeV/ and MeV obtained in Ref. beskkc . We also perform the fit to the BABAR data only. The resulting parameters are MeV/, MeV, and pb. The resonance significance in the BABAR data estimated from the difference for the fits with and without the resonance contribution is .
III The cross section in the 2.0–2.5 GeV energy range
The data analysis presented in this paper is based on methods developed for the measurement of the cross section in Ref. kskl . The data set, with an integrated luminosity of 469 fb-1 lum , was collected with the BABAR detector BABAR at the SLAC PEP-II asymmetric-energy storage ring at the resonance and 40 MeV below this resonance. The initial-state-radiation (ISR) technique is used, in which the cross section for the process is determined from the invariant mass spectrum measured in the reaction .
The selection criteria for events are described in detail in Ref. kskl . We require the detection of all the final-state particles. The ISR photon candidate must have an energy in the c. m. frame greater than 3 GeV. The candidate is reconstructed using the decay mode. Two oppositely charged tracks not identified as electrons are fitted to a common vertex. The distance between the reconstructed decay vertex and the beam axis must be in the range from 0.2 to 40.0 cm. The cosine of the angle between a vector from the beam interaction point to the vertex and the momentum in the plane transverse to the beam axis is required to be larger than 0.9992. The invariant mass of the candidate must be in the range 0.482–0.512 GeV/. The candidate is a cluster in the calorimeter with energy deposition greater than 0.2 GeV. To suppress background, we also require the event to not contain extra charged tracks originating from the interaction region or extra photons with energy larger than 0.5 GeV.
The ISR photon, , and candidates are subjected to a three-constraint kinematic fit to the hypothesis with the requirement of energy and momentum balance. Only the angular information is used in the fit for the candidate. If there are several candidates in an event, the combination giving the smallest value is retained. The particle parameters after the kinematic fit are used to calculate the invariant mass , which is required to satisfy GeV/.
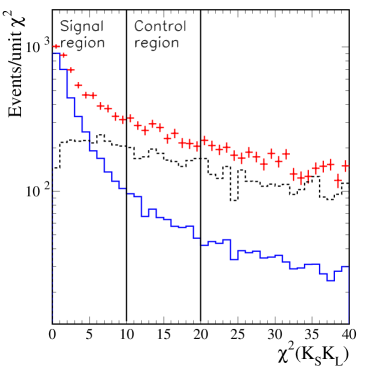
The distribution from the fit for the selected events is shown in Fig. 2 in comparison with the simulated signal and background distributions. The background is dominated by the ISR processes , , and . The condition is applied to select signal events. The control region is used to estimate and subtract background. The numbers of signal () and background () events in the signal region () are determined as
| (2) |
where and are the numbers of selected data events in the signal and control regions, and and are the ratios for signal and background, respectively.
The value of the coefficient is determined from the simulated signal distribution. For the mass region of interest GeV/ , where the number of signal events is small, the term in the expression for is negligible. The coefficient is determined in two ways: either using background simulation, or from the difference between the data and simulated signal distributions in Fig. 2. The signal distribution is normalized to the number of data events with after subtraction of the background estimated from simulation. The average of the two values is quoted above. Their difference (10%) is taken as an estimate of the systematic uncertainty in . As shown in Ref. kskl , the background distribution obtained using Eq. (2) is found to be in reasonable agreement with the same distribution obtained from simulation.

The background estimated from the control region decreases monotonically with increasing and is well approximated by a smooth function. Figure 3 shows the distribution for data events from the signal region. The curve represents the estimated background distribution.
The uncertainty in the background is 12%, which includes the 10% uncertainty in the parameter in Eq. (2) and a 6% uncertainty in the background approximation. We do not see a significant signal of events over background. The cross section in the mass region GeV/ obtained from the mass spectrum in Fig. 3 after background subtraction is shown in Fig. 4 (left). The details on the detection efficiency and ISR luminosity can be found in Ref. kskl . The numerical values of the cross section, with statistical and systematic uncertainties, are listed in Table 2.
| (GeV/) | (pb) | (GeV/) | (pb) |
|---|---|---|---|
| 1.98–2.02 | 2.26–2.30 | ||
| 2.02–2.06 | 2.30–2.34 | ||
| 2.06–2.10 | 2.34–2.38 | ||
| 2.10–2.14 | 2.28–2.42 | ||
| 2.14–2.18 | 2.42–2.46 | ||
| 2.18–2.22 | 2.46–2.50 | ||
| 2.22–2.26 | 2.50–2.54 |


The systematic uncertainties arise mainly from the background subtraction and are fully correlated between different intervals.
A fit to the cross section data with a constant yields , where is the number of degrees of freedom. The average value of the cross section between 1.98 and 2.54 GeV/ is found to be () pb, which is therefore consistent with zero. The dashed curve in Fig. 4 (left) represents the cross section for the resonance with the parameters listed in Table 1. Formally, from the difference between the two hypotheses in Fig. 4 (left) the resonance interpretation can be excluded at . However, possible destructive interference between the resonant and nonresonant amplitudes may significantly weaken this constraint. We also must take into account the uncertainty in the background subtraction and the statistical uncertainty in the resonance cross section obtained from the fit to the data. To do this we fit the mass spectrum shown in Fig. 3 with a sum of signal and background distributions. The background distribution shown in Fig. 3 is multiplied by a scale factor , which is allowed to vary within a 12% uncertainty around unity. The signal cross section is described by Eq. (1) with a constant nonresonant amplitude and the parameter varied around the value listed in Table 1. From the fit we determine and . The result of the fit is shown by the curve in Fig. 4 (right). The fitted value of the parameter is 0.94. Therefore, the points in Fig. 4 (right) lie slightly higher than those in Fig. 4 (left). The fit yields and the following values of parameters:
| (3) |
We conclude that the BABAR data on the cross section do not exclude the existence of the resonance with the parameters listed in Table 1, but restrict the possible range of allowed values of the relative phase between the resonant and nonresonant amplitudes.
IV Simultaneous fit to the , , and data with an isovector resonance


As discussed in the introduction, the mass and width of the resonance observed in the process near 2.2 GeV are close to the parameters of the state seen in the cross section measured by BABAR pipi . The latter cross section in the energy range 2.00–2.55 GeV is shown in Fig. 5 (left). An interference pattern in the energy region near 2.25 GeV is also seen in the energy dependence of the cross section recently measured by BABAR pipieta and shown in Fig. 5 (right). We perform a simultaneous fit to the and data. The cross sections are described by formulas similar to Eq. (1). For the channel, the phase space factor in Eq. (1) is replaced by the factor achasov , where is the -meson momentum calculated in the model of the intermediate state. The nonresonant amplitude is described by the function inspired by the vector-meson dominance model. The ten fitted parameters are the mass () and width () of the resonance, the peak cross sections ( and ), and , , and for the two channels. The result of the fit is shown in Fig. 5 by the solid curves. The fit parameters obtained are listed in the second column of Table 3. The fit yields (). The significance of the resonance calculated from the difference in with and without the resonance contributions is 4.6. The systematic uncertainties in the resonance parameters are determined as described in Sec. II.
| and | , , and | |
| (MeV/) | ||
| (MeV) | ||
| (pb) | ||
| (pb) | ||
| (pb) | ||
| (deg) | ||
| (deg) | ||
| (deg) | ||
| 13.96/12 | 17.2/14 |
We also perform a simultaneous fit to the BESIII and BABAR data and the BABAR and data. The cross section is parametrized as described in Sec. II. The fit parameters obtained are listed in the third column of Table 3. Since the data are statistically more accurate than the or data, the fitted resonance mass, width, and are similar to those (Table 1) obtained in the fit to the data alone. The results of the fit for and cross sections are shown in Fig. 5 by the dashed curves. The calculated using the and data is (). We conclude that it is very likely that the interference patterns observed in the three cross sections discussed above are manifestations of the same isovector resonance, . It is interesting to note that the decay rates of this state to , , and are all similar..
V Two-resonance fit
The isovector state discussed in the previous section is expected to have an -like isoscalar partner with a similar mass. An indication of an isoscalar resonance structure near 2.25 GeV is seen in the and cross sections measured by BABAR ompipi1 ; ompipi2 . The energy dependence of the total () cross section in the energy region of interest is shown in Fig. 6. It is fitted by a coherent sum of resonant and nonresonant contributions. We assume that the process proceeds via the intermediate state. Therefore, the factor in Eq. (1) is replaced by the -wave phase-space factor , where is the -meson momentum in . It should be noted that the phase-space factor for the other possible intermediate state, , has a similar energy dependence in the energy region of interest. The nonresonant amplitude is described by the function . The fit yields . The result of the fit is shown in Fig. 6 by the solid curve. The fitted resonance mass ( MeV/) and width ( MeV) are similar to the parameters of the isovector state in Table 3.

Since different intermediate mechanisms (e.g., and ) contribute to the final state, the resonant and nonresonant amplitudes may be not fully coherent. Inclusion in the fit of an incoherent contribution describing up to 50% of the nonresonant cross section has an insignificant impact on the fitted resonance mass and width. The dashed curve in Fig. 6 is the result of the fit to data with a second-order polynomial. The for this fit is 18.1/9. From the difference between the two fits we estimate that the significance of the resonance signal in the cross section is .
From isospin invariance, the isovector amplitude enters the and amplitudes with opposite sign (in contrast to the isoscalar case) kuhn :
| (4) |
The quark model predicts kuhn that the isoscalar amplitude related to the -like resonance is one-third the amplitude of the corresponding -like state and that these amplitudes have the same sign in the channel. If the - and -like resonances have similar masses and widths, we expect the resonance amplitude in the reaction to be about two times smaller than that in . This weakens the constraints on the nonresonant cross sections and the interference phase, relation (3), obtained in the fit to the data in Sec. III. Repeating this fit with the resonance amplitude smaller by a factor of two, we obtain and the parameters
| (5) |
The fit with zero nonresonant cross section also has an acceptable value, . We conclude that the two-resonance fit allows a simultaneous description of the and data without strong constraints on the interference parameters in the channel.
Finally, we fit the , , and data using the model described in Sec. IV with an additional contribution from the resonance. The mass and width are fixed at their PDG values pdg . The inclusion of the has an insignificant impact on the quality of the fit. The fitted value of the peak cross section is found to be consistent with zero, pb.
VI Summary
In this paper, we present measurements of the cross section in the center-of-mass range from 1.98 to 2.54 GeV. The measured cross section is consistent with zero and does not exhibit evidence for a resonance structure. The data are analyzed in conjunction with BESIII beskkc and BABAR babarkkc data on the cross section, and with BABAR data on the pipi , pipieta , ompipi1 ; ompipi2 cross sections to examine properties and better elucidate the nature of the resonance structure observed by BESIII in the cross section near 2.25 GeV beskkc .
The interference patterns seen in the and data near 2.25 GeV provide evidence for the existence of the isovector resonance . Its mass and width are consistent with the parameters of the resonance observed in the channel. All three cross sections are well described by a model with mass and width MeV/ and MeV.
Any resonance in the cross section should also be manifest in the cross section. The BABAR data on the cross section do not exclude the existence of the resonance, but strongly restrict the possible range of allowed values of the relative phase between the resonant and nonresonant amplitudes. This restriction may be significantly weakened by inclusion in the fit of an additional isoscalar resonance with a nearby mass. An indication of such a resonance with significance is seen in the cross section.
Further study of the resonance structures near 2.25 GeV can be performed at the BESIII experiment, where the cross sections for , , and other exclusive processes in the energy range between 2 and 2.5 GeV may be measured with high accuracy.
Acknowledgements.
We are grateful for the extraordinary contributions of our PEP-II colleagues in achieving the excellent luminosity and machine conditions that have made this work possible. The success of this project also relies critically on the expertise and dedication of the computing organizations that support BABAR. The collaborating institutions wish to thank SLAC for its support and the kind hospitality extended to them. This work is supported by the US Department of Energy and National Science Foundation, the Natural Sciences and Engineering Research Council (Canada), the Commissariat à l’Energie Atomique and Institut National de Physique Nucléaire et de Physique des Particules (France), the Bundesministerium für Bildung und Forschung and Deutsche Forschungsgemeinschaft (Germany), the Istituto Nazionale di Fisica Nucleare (Italy), the Foundation for Fundamental Research on Matter (The Netherlands), the Research Council of Norway, the Ministry of Education and Science of the Russian Federation, Ministerio de Economía y Competitividad (Spain), the Science and Technology Facilities Council (United Kingdom), and the Binational Science Foundation (U.S.-Israel). Individuals have received support from the Marie-Curie IEF program (European Union) and the A. P. Sloan Foundation (USA).References
- (1) M. Ablikim et al. (BESIII Collaboration), Phys. Rev. D 99, 032001 (2019).
- (2) M. Tanabashi et al. (Particle Data Group), Phys. Rev. D 98, 030001 (2018).
- (3) J. P. Lees et al. (BABAR Collaboration), Phys. Rev. D 86, 012008 (2012).
- (4) C. P. Shen et al. (Belle Collaboration), Phys. Rev. D 80, 031101 (2009).
- (5) M. Ablikim et al. (BES Collaboration), Phys. Rev. Lett. 100, 102003 (2008).
- (6) M. Ablikim et al. (BESIII Collaboration), Phys. Rev. D 91, 052017 (2015).
- (7) M. Ablikim et al. (BESIII Collaboration), Phys. Rev. D 99, 012014 (2019).
- (8) B. Aubert et al. (BABAR Collaboration), Phys. Rev. D 76, 092005 (2007) Erratum: [Phys. Rev. D 77, 119902 (2008)].
- (9) J. P. Lees et al. (BABAR Collaboration), Phys. Rev. D 86, 032013 (2012).
- (10) J. P. Lees et al. (BABAR Collaboration), Phys. Rev. D 89, 092002 (2014).
- (11) J. P. Lees et al. (BABAR Collaboration), Phys. Rev. D 88, 032013 (2013).
- (12) A. Hoefer, J. Gluza, and F. Jegerlehner, Eur. Phys. J. C 24, 51 (2002).
- (13) K. I. Beloborodov, V. P. Druzhinin, and S. I. Serednyakov, J. Exp. Theor. Phys. 129, 386 (2019).
- (14) J. P. Lees et al. (BABAR Collaboration), Nucl. Instrum. Methods Phys. Res., Sect. A 726, 203 (2013).
- (15) B. Aubert et al. (BABAR Collaboration), Nucl. Instrum. Methods Phys. Res., Sect. A 479, 1 (2002); B. Aubert et al. (BABAR Collaboration), Nucl. Instrum. Methods Phys. Res., Sect. A 729, 615 (2013).
- (16) J. P. Lees et al. (BABAR Collaboration), Phys. Rev. D 97, 052007 (2018).
- (17) N. N. Achasov and A. A. Kozhevnikov, Phys. Rev. D 55, 2663 (1997).
- (18) J. P. Lees et al. (BABAR Collaboration), Phys. Rev. D 98, 112015 (2018).
- (19) C. Bruch, A. Khodjamirian, and J. H. Kühn, Eur. Phys. J. C 39, 41 (2005).